What would it take to Change an Inference? Frank, K.A., Maroulis, S., Duong, M., and Kelcey, B. What Would It Take to Change an Inference? Using Rubin’s Causal Model to Interpret the Robustness of Causal Inferences. Educational Evaluation and Policy Analysis, Vol 35 : 437 - 460. 0162373713493129, first published on July 30, 2013 as doi:10.3102/0162373713493129. What would it take to Change an Inference?: Using Rubin’s Causal Model to Interpret the Robustness of Causal Inferences Kenneth A. Frank Michigan State University Spiro Maroulis Arizona State University Minh Q. Duong Pacific Metrics Corporation Benjamin Kelcey University of Cincinnati State University 2013 1

Welcome message from author
This document is posted to help you gain knowledge. Please leave a comment to let me know what you think about it! Share it to your friends and learn new things together.
Transcript

What would it take to Change an Inference?
Frank, K.A., Maroulis, S., Duong, M., and Kelcey, B. What Would It Take to Change an Inference? Using Rubin’s Causal Model to Interpret the Robustness of Causal Inferences. Educational Evaluation and Policy Analysis, Vol 35: 437-460. 0162373713493129, first published on July 30, 2013 as doi:10.3102/0162373713493129.
What would it take to Change an Inference?: Using Rubin’s Causal Model to Interpret the Robustness of Causal Inferences
Kenneth A. FrankMichigan State University
Spiro MaroulisArizona State University
Minh Q. DuongPacific Metrics Corporation
Benjamin KelceyUniversity of Cincinnati State University
2013
1

What would it take to Change an Inference?
What would it take to Change an Inference?:
Using Rubin’s Causal Model to Interpret the Robustness of Causal Inferences
Abstract
We contribute to debate about causal inferences in educational research in two
ways. First, we quantify how much bias there must be in an estimate to invalidate an
inference. Second, we utilize Rubin’s causal model (RCM) to interpret the bias
necessary to invalidate an inference in terms of sample replacement. We apply our
analysis to an inference of a positive effect of Open Court Curriculum on reading
achievement from a randomized experiment, and an inference of a negative effect of
kindergarten retention on reading achievement from an observational study. We consider
details of our framework, and then discuss how our approach informs judgment of
inference relative to study design. We conclude with implications for scientific discourse.
Keywords: causal inference; Rubin’s causal model; sensitivity analysis; observational
studies
2
What would it take to Change an Inference?
What would it take to Change an Inference?: Using Rubin’s Causal Model to Interpret the Robustness of Causal Inferences
Introduction
Education is fundamentally a pragmatic enterprise (e.g., National Research Council,
2002; Raudenbush, 2005), with the ultimate goal of educational research to inform choices about
curricula, pedagogy, practices, or school organization (e.g., Bulterman-Bos, 2008; Cook, 2002).
To achieve that goal, educational researchers must pay careful attention to the basis for making
causal inferences (e.g., Schneider et al., 2007). In Holland’s (1986) language if educational
researchers do not infer the correct causes of effects then policy manipulations based on their
research will not produce the intended results.
But study results can be ambiguous. As a result, debate about the general bases for causal
inferences in the social sciences dates back to the 1900’s (e.g., Becker, 1967; Rubin, 1974;
Thorndike & Woodworth, 1901; see Abbott, 1998 or Oakley, 1998 for reviews), with some
heated as in the Cronbach vs Campbell exchanges of the 1980’s (e.g., Cook & Campbell, 1979;
Cronbach, 1982). Debates have also emerged about specific causal inferences. For example,
analyzing data from the federal longitudinal database High School and Beyond, Coleman, Hoffer
and Kilgore (1982) estimated that students attending Catholic schools had higher achievement
than similar students attending public schools leading to an inference that Catholic schools
educate students better than public schools (Chubb and Moe 1990; Coleman, Hoffer and Kilgore
1982). Controversy ensued over the internal validity of the results: Despite controlling for
background characteristics, can we ever be sure that the Catholic and public students being
compared were really similar? Indeed in a critique of the Coleman findings, Alexander and
Pallas (1983) noted that “… the single greatest burden of school effects research is to distinguish
convincingly between outcome differences that reflect simply differences in the kinds of students 3

What would it take to Change an Inference?
who attend various schools from differences that are attributable to something about the schools
themselves” (p. 170).
Given concerns about inferences from observational studies, several institutions, such as
the What Works Clearinghouse (Eisenhardt & Towne, 2008) and the US Department of
Education’s National Center for Education Research (NCER), have drawn on the medical model
to call for a sound, scientifically rigorous basis for making causal inferences in educational
research. In particular these institutions have emphasized the importance of random assignment
to treatment conditions for making causal inferences; if subjects are randomly assigned to
treatments then any preexisting differences between treatment groups will be eliminated in the
long run (Fisher, 1970[1930]). Prominent examples of randomized experiments in educational
research include evaluations of Sesame Street (Bogatz & Ball, 1972); the Perry Preschool Project
(Schweinhart, Barnes, & Weikart, 1993); small classes (Finn & Achilles, 1991); and Comer’s
School Development Program (see Cook, 2003, p. 123, for a review).
Despite their many virtues, even perfectly executed randomized experiments do not
preempt debate about causal inferences. This is because it is rare when an educational researcher
can randomly sample subjects from the desired target population and then also randomly assign
subjects to meaningful treatment conditions (Cook, 2003). For example, imagine a researcher
randomly sampling students and then telling some they had been randomly assigned a treatment,
such as to attend a Catholic school. Consequently, randomized experiments are open to the
critique that their external validity is limited by the representativeness of the sample on which
the experiment was conducted. As a result most if not all educational research leaves the door
open to debate because of a non-random sample and/or non-random assignment to treatments.
4
What would it take to Change an Inference?
In this article, we put forth a framework that informs debate about causal inferences in
educational research. As a foundation, we draw on Rubin’s causal model (RCM) (Rubin, 1974)
to express concerns about bias in terms of the characteristics of unobserved data. In particular,
we use RCM to characterize how one could invalidate inferences by replacing observed cases
with unobserved cases in which there was no treatment effect. The underlying intuition is
straight-forward: How much would a study sample have to change in order to change the
inference? We answer this question using a framework that quantifies sources of bias rooted in
either restricted sampling or non-random treatment assignment.
Equally importantly, our framework enables researchers to identify a “switch point”
(Behn and Vaupel, 1982) where the bias is large enough to undo one’s belief about an effect (e.g.,
from inferring an effect to inferring no effect). Using the switching point, we transform external
validity concerns such as: “I don’t believe the study applies to my population of interest” to
questions such as “How much bias must there have been in the sampling process to make the
inference invalid for a population that includes my population of interest?” Similarly with
respect to internal validity, we transform statements such as “But the inference of a treatment
effect might not be valid because of pre-existing differences between the treatment groups” to
questions such as “How much bias must there have been due to uncontrolled pre-existing
differences to make the inference invalid?”
Importantly, our analysis contributes to a process and discourse of inference for particular
studies. Quantifying a switch point and interpreting in terms of sources of bias is a crucial step.
Considered together with the capacity of the study design to reduce or eliminate bias, our
framework can help researchers better evaluate whether bias is large enough to invalidate the
inference of a study.
5

What would it take to Change an Inference?
In the next Section we elaborate on the idea of a “switch point” for an inference, and
provide a more formal definition of the robustness of an inference. In Section 3, using Rubin’s
causal model (Rubin, 1974), we develop our framework in terms of missing data for interpreting
the bias necessary to invalidate an inference. In Section 4 we apply the framework to Borman,
Dowling and Schneck’s (2008) inference of a positive effect of the Open Court Curriculum from
a randomized experiment on a volunteer population, and to Hong and Raudenbush’s (2005)
inference of a negative effect of kindergarten retention from a random sample in an observational
study. We consider choices for thresholds and then discuss how our approach informs judgment
of inference relative to study design, compare with other approaches to quantifying discourse
about inferences, and characterize other sources of bias. We conclude with implications for
scientific discourse.
The Robustness of an Inference: Comparing Evidence against a Threshold
The starting point for our analysis is when one makes an inference about the effect of a
policy because empirical evidence exceeds a given threshold. The threshold defines the point at
which evidence from a study would make one indifferent to the policy choices. If the evidence
were more in favor of the policy one would choose the policy, if the evidence were less one
would not choose the policy. Given the pragmatic emphasis of educational research, the
threshold could be the effect size where the benefits of a policy intervention outweigh its costs
for either an individual or community. For example, a policy-maker might have a specific
threshold at which the evidence is strong enough in favor of a curriculum to outweigh the costs
of introducing that curriculum into her school. Or as is commonly the case in academic research,
the threshold can be defined by statistical significance – the threshold is an estimate just large
6

What would it take to Change an Inference?
enough to be interpreted as unlikely to occur by chance alone (for a given a null hypothesis).
Regardless of the specific threshold, one can compare an estimate with a threshold to
represent how much bias there must be switch the inference. The more the estimate exceeds the
threshold, the more robust the inference with respect to that threshold. Therefore, we refer to the
evaluation of the estimate against the threshold as the “robustness” of the inference.
Consider Figure 1, in which the treatment effects from hypothetical studies A (estimated
effect of six) and B (estimated effect of eight) each exceed the threshold of four. If the threshold
of four represents an effect large enough to infer that the benefits of a study outweigh its costs,
then in both cases one would draw the inference that the effect of the treatment was strong
enough to implement. But the estimated effect from study B exceeds the threshold by more than
does the estimate from A. Assuming that the estimates were obtained with similar levels of
control for selection bias in the design of the study and similar levels of precision, the inference
from study B is more robust than that from A because a greater proportion of the estimate from B
must be due to bias to invalidate the inference.
Insert Figure 1 here
The relative robustness of an inference can be explicitly quantified in terms of the
difference between an estimate and a threshold, expressed relative to the size of the estimate:
(estimate−threshold)/estimate = 1-threshold/estimate. (1)
Equation (1) simply implies that the robustness of an inference is a function of the
percentage of the estimate that exceeds the threshold. For study A,
(estimate−threshold)/estimate=(6−4)/6=1/3, or 33%. Thus 33% of the estimate from A would
have to be due to bias to invalidate the inference. In contrast, 50% of the estimate for study B
would have to be due to bias to invalidate the inference (8-4)/8=50%.
7

What would it take to Change an Inference?
More formally, define a population effect as δ, the estimated effect as , and the threshold
for making an inference as δ#. For example, to account for sampling error δ # might be the
threshold for statistical significance (δ# is associated with a p value of exactly .05). An inference
about a positive effect is invalid if:
> δ # > δ. (2)
That is, an inference is invalid if the estimate is greater than the threshold while the population
value is less than the threshold (a symmetric argument applies for negative effects). For
example, the inference from hypothetical study A is invalid if 6 > 4 >δ.
The expression in (2) can be used to quantify how much bias there must be in an estimate
to invalidate an inference. Subtracting from each side in (2) and multiplying by -1 yields:
−δ> − δ # > 0.
Defining bias as β= −δ, (2) implies an estimate is invalid if and only if:
β > − δ #. (3)
An inference is invalid if bias accounts for more than the difference between the estimate and the
threshold.
To express (3) as a proportion of the original estimate, divide the right hand side by :
( −δ#)/ =1 −δ#/ . (4)
This is equivalent to (1); the proportion of bias necessary to invalidate the inference is equivalent
to the graphical comparison of an estimate to a threshold for inference. If an unbiased test
statistic is used and assuming no random sampling error, (3) and (4) express how much bias due
to the design components there must be to invalidate an inference based on . The challenge then
8

What would it take to Change an Inference?
is to interpret the expressions in (3) and (4) in a framework that can be applied to observational
studies or randomized experiments. For this we turn to Rubin’s causal model in the next Section.
Rubin’s Causal Model (RCM) and Sources of Bias
Potential Outcomes
RCM is best understood through the counterfactual sequence: I had a headache; I took an
aspirin; the headache went away. Is it because I took the aspirin? One will never know because
we do not know what I would have experienced if I had not taken the aspirin. One of the
potential outcomes I could have experienced by either taking or not taking an aspirin will be
counter to fact, termed the counterfactual within RCM (for a history and review of RCM see
Holland, 1986; or Morgan & Winship, 2007, chapter 2). In one of the examples in this study, it
is impossible to observe a single student who is simultaneously retained in kindergarten and
promoted into the first grade.
Formally expressing the counterfactual in terms of potential outcomes shows how RCM
can be applied to represent bias from non-random assignment to treatments or non-random
sampling. Define the potential outcome as the value on the dependent variable (e.g., reading
achievement) that would be observed if unit i were exposed to the treatment (e.g., being retained
in kindergarten); and as the value on the dependent variable that would be observed if unit i
were in the control condition and therefore not exposed to the treatment (e.g., being promoted to
the first grade). i If SUTVA (Rubin, 1986, 1990) holds – that there are no spillover effects of
treatments from one unit to another – then the causal mechanisms are independent across units,
and the effect of the treatment on a single unit can be defined as
δi= − . (5)
9

What would it take to Change an Inference?
The problems of bias due to non-random assignment to treatment are addressed in RCM by
defining causality for a single unit– the unit assigned to the treatment is identical to the unit
assigned to the control. Similarly, there is no concern about sampling bias because the model
refers only to the single unit i.
Of course, RCM does not eliminate the problems of bias due to non-random assignment
to treatments or non-random sampling. Instead, it recasts these sources of bias in terms of
missing data (Holland, 1986), because for each unit, one potential outcome is missing. We use
this feature to describe characteristics of missing data necessary to invalidate an inference.
Application to Non-Random Assignment to Treatment
Consider a study in which the units were randomly sampled but were not randomly
assigned to treatments (e.g., an observational study of the effects of kindergarten retention on
achievement). In this case we would focus on interpreting the bias necessary to invalidate an
inference due to non-random assignment to treatment, a component of internal validity (Cook &
Campbell, 1979). Using notation similar to that of Morgan and Winship (2007), let X=t if a unit
received the treatment and X=c if a unit received the control. Yt | X=t is then the value of the
outcome Y for a unit exposed to the treatment, and Yc | X=t is the counterfactual value of Y
under the control condition for a unit that was exposed to the treatment. For example Yretained |
X=retained is the observed level of achievement for a student who was retained in kindergarten,
while Ypromoted | X=retained is the unobserved level of achievement for the same student if he had
been promoted.
Using this notation, and defining bias as β= E[ ]−E[ ], in technical appendix A we
show the bias due to nonrandom assignment to treatments, βa, is:
10

What would it take to Change an Inference?
βa=π { E[Yc|X=t]−E[Yc|X=c]}+(1−π ){E[Yt|X=t]−E[Yt|X=c]} . (6)
In words, the term E[Yc | X=t]−E[Yc
| X=c] represents bias introduced by comparing members of
the treatment group with members of the observed control (Yc | X=c) instead of their
counterfactual: members of the treatment group if they had received the control (Yc |X=t).
Similarly, E[Yt |X=t] − E[Yt | X=c] represents bias introduced by comparing members of the
control with members of the observed treatment (Yt | X=t) instead of their counterfactual:
members of the control if they had received the treatment (Yt | X=c). The bias attributed to the
incorrect comparison for the treatment group is weighted by the proportion in the treatment
group, π ; and the bias attributed to the incorrect comparison for the control group is weighted
by 1−π .
Application to a Non-Random Sample
Now consider a study in which the units were randomly assigned to treatments but were
not randomly sampled from the population to which one would like to generalize. In this case
the target population consists of both those directly represented by the sample as well as those
not directly represented by the sample – one might be concerned with statements about general
causes across populations, known as external validity (Cook & Campbell, 1979, page 39). As an
example in this paper, one might seek to make an inference about the effect of the Open Court
curriculum beyond the population of schools that volunteered for a study of Open Court (e.g.,
Borman et al., 2008).
To quantify robustness with respect to external validity we adapt RCM to focus on bias
due to non-random sampling. Instead of the unobserved data defined by the counterfactual,
consider a target population as comprised of two groups, one that has the potential to be
observed in a sample, p, and one does not have the potential to be sampled but is of interest, p´.
11

What would it take to Change an Inference?
For example, consider population p to consist of schools that volunteered for a study of the Open
Court curriculum, and population p´ to consist of schools that did not volunteer for the study.
Although the study sample can only come from those schools that volunteered for the study, one
might seek to generalize to the broader population of schools including p´ as well as p.
To formally adapt RCM to external validity, decompose the combined population
treatment effect, , into two components: p, the treatment effect for the population potentially
sampled, and p´, the treatment effect for the population not potentially sampled (Cronbach,
1982; Fisher, 1970[1930]; Frank & Min, 2007). Assuming the proportion of units receiving the
treatment is the same in p and p´, an expression for an unbiased treatment estimate across both
populations is
= πp p +(1− πp) p´ , (7)
where πp represents the proportion from p in the sample representative of p and p´.
We can use (7) to develop expressions for bias in estimated treatment effects due to a
non-random sample. Let Z=p if a unit is from p, and Z=p´ if a unit is from p´. Combining this
notation with our earlier notation (e.g., Yt | Z=p represents the treatment outcome for a school in
the population of schools that volunteered for the study), and defining bias due to non-random
sampling as βs, in technical appendix A we show:
βs =(1−π p){( E[Yt|Z=p]−E[Yc|Z=p])− (E[Yt|Z=p´]−E[Yc|Z=p´])} . (8)
In words, the bias is due to an estimate based on 1−π p units of p with effect E[Yt|Z=p]−E[Yc|
Z=p] instead of units from p´ with effect E[Yt|Z=p´]−E[Yc|Z=p´]. Equations (7) and (8) show
how RCM can be used to generate expressions for bias due to non-random sampling as well as
non-random assignment to treatments. ii
Limiting Condition: No Treatment Effect
12

What would it take to Change an Inference?
Expressions (6) and (8) can be used to quantify the robustness of an inference by
considering replacing observed data with hypothetical data under the limiting condition of no
treatment effect in the hypothetical data. Interpreting bias in terms of replacement data expresses
validity in terms of the exchangeability of observed and unobserved cases. External validity
concerns about bias due to a non-random sample can be cast in terms of the proportion of cases
in the observable population p that are unexchangeable with the unobservable population p´ in
the sense that one must replace the proportion in p to make a causal inference that applies to p
and p´. Similarly, internal validity concerns about bias due to non-random treatment assignment
can be cast in terms of the proportion of the observed cases that are unexchangeable with the
optimal counterfactual cases such that one must replace the proportion of observed cases to make
a causal inference in the sample.
Non-random sampling. Bias due to non-random sampling in (8) can be expressed by
assuming the null hypothesis of zero effect holds in the replacement units as might be claimed by
a skeptic of the inference (Frank & Min, 2007). In this case, E[Yt|Z=p´] = E[Yc|Z=p´] and
substituting into (8) yields:
βs =(1−π p){ E[Yt|Z=p] − E[Yc|Z=p]} = (1−π p) . (9)
Setting βs > −δ# and solving (9) for (1−π p), the inference is invalid if:
(1−π p) >1− δ# / . (10)
Equation (10) is particular example of the bias necessary to invalidate an inference shown in (4),
in this case in terms of bias due to non-random sampling associated with π p (this replicates the
result in Frank & Min, 2007).
Non-random assignment to treatments. We can use equation (6) to isolate the conditions
that could invalidate an inference due to bias from non-random assignment to treatment
13

What would it take to Change an Inference?
conditions. Following Morgan and Winship (2007, page 46), (6) can be rewritten as:
βa= {E[Yc|X=t]−E[Yc|X=c]}+
(1−π ){(E[Yt|X=t]−E[Yc|X=t]) – (E[Yt|X=c]−E[Yc|X=c])} . (11)
Thus bias is a function of expected differences at baseline, or in the absence of a treatment E[Yc|
X=t]−E[Yc|X=c]), and differential treatment effects for the treated and control (E[Yt|X=t]−E[Yc|
X=t])− (E[Yt|X=c]−E[Yc|X=c])=δt − δc.
Assuming δt − δc=0 as in the limiting case when there is no treatment effect (δt =δc=0) and
setting βa > −δ# implies an inference is invalid if:
βa =(E[Yc|X=t]−E[Yc|X=c]) > −δ#. (12)
Equation (12) indicates the bias due to differences in the absence of treatment necessary to
invalidate the inference.
To interpret (12) in terms of sample replacement, note that bias due to the difference in
expected values in the absence of treatment can be re-expressed in terms of the expected value of
the differences in the absence of treatment:
(E[Yc|X=t]−E[Yc|X=c]) > −δ#
E[(Yc|X=t)−(Yc|X=c)] > −δ# . (13)
Now separate the sample into the proportion in which there is no bias (α), and the proportion in
which there is bias (1−α):
(α)(E[(Yc|X=t)−(Yc|X=c)] + (1-α)E[(Yc|X=t)−(Yc|X=c)] > −δ# . (14)
Setting E[(Yc|X=t)−(Yc|X=c)=0 for those cases in which there is no bias because the expected
value of the counterfactuals equals the expected value of the observed controls, and E[(Yc|X=t)−
14

What would it take to Change an Inference?
(Yc|X=c)= − δ = for those cases in which the estimated effect is entirely due to bias (because
δ =0) yields:
1-α > 1−δ# / . (15)
From (15), an inference would be invalid if (1−δ# / ) or more of the cases in which there was
bias were replaced with counterfactual data for which there was no treatment effect. Thus
equation (15) is particular example of the bias necessary to invalidate an inference shown in (4),
in this case in terms of bias due to non-random assignment to treatments, associated with 1-α.
In the next Section we use our framework to quantify the robustness of inferences from
empirical studies. For each study we quantify the extent of bias necessary to invalidate the
inference and interpret using our framework based on RCM. We then compare with one
prominent and one recent study of similar design. As a set, the studies address issues of
assignment of students to schools, school policy and structure, curriculum, and teacher
knowledge and practices. In technical appendix B we then apply our framework to all of the
studies available on-line (as of Dec 19, 2012) for upcoming publication in this journal.
Examples
The Effect of Open Court Reading on Reading Achievement
Borman et al. (2008) motivated their randomized experiment of the Open Court Reading
(OCR) curriculum on reading achievement by noting “The Open Court Reading (OCR) program,
published by SRA/McGraw-Hill, has been widely used since the 1960s and offers a phonics-
based K-6 curriculum that is grounded in the research-based practices cited in the National
Reading Panel report (National Reading Panel, 2000)” (page 390). Furthermore, the program is
quite popular: “…to date, a total of 1,847 districts and over 6,000 schools have adopted the OCR
15

What would it take to Change an Inference?
program across the United States” (page 390). And yet from the perspective of internal validity,
Borman et al. stated “despite its widespread dissemination, though, OCR has never been
evaluated rigorously through a randomized trial” (page 390).
Based on an analysis of 49 classrooms randomly assigned to OCR versus business as
usual, Borman et al. (2008) found OCR increased students’ composite reading score across all
grades by 7.95 points (in Table 4 of Borman et al). This effect was about 1/7 of the standard
deviation on the achievement test, equivalent to 1/8 of a year’s growth and was statistically
significant (p <.001, t-ratio of 4.34). Borman et al. concluded that OCR affects reading
outcomes: “The outcomes from these analyses not only provide evidence of the promising one-
year effects of OCR on students’ reading outcomes, but they also suggest that these effects may
be replicated across varying contexts with rather consistent and positive results” (page 405).
In making their inference, Borman et al. (2008) were explicitly concerned with how well
their sample represented broad populations of classrooms. Thus they randomly sampled from
schools that expressed interest to the Open Court developer SRA/McGraw-Hill. Partly as a
result of the random sample, schools in Borman et al.’s sample were located across the country
(Florida, Georgia, Indiana, Idaho, North Carolina, and Texas) and varied in socioeconomic
status. Furthermore, Borman et al. carefully attended to sample attrition in their analyses.
Even given Borman et al. (2008)’s attention to their sample, there may be important
concerns about the external validity of Borman et al.’s inference. In particular, schools that had
approached SRA/McGraw-Hill prior to Borman et al.’s study may have had substantive reasons
for believing OCR would work particularly well for them (e.g., Heckman, 2005). At the very
least, if Borman et al.’s study had any effect on adoption of OCR, then one could not be certain
that the post-study population (p´) was represented by the pre-study population (p), because the
16

What would it take to Change an Inference?
pre-study population did not have access to Borman et al.’s results. This is a fundamental
limitation of external validity; a researcher cannot simultaneously change the behavior in a
population and claim that the pre-study population fully represents the post-study population.
Given the limitation for a sample in a randomized experiment to represent non-volunteer or post-
study populations, debate about a general effect of OCR is inevitable.
To inform debate about the general effect of OCR, we quantify the proportion of Borman
et al.’s estimate that must be due to sampling bias to invalidate their inference. We begin by
choosing statistical significance as a threshold for inference because it reflects sampling error
(although we will comment at the end of this Section on how other thresholds can be used).
Given Borman et al.’s sample size of 49 (and 3 parameters estimated) and standard error of 1.83,
the threshold for statistical significance is δ# = se x tcritical, df=46 =1.83 x 2.013=3.68. Given the
estimated effect ( ) was 7.95, to invalidate the inference bias must be greater than
7.95−3.68=4.27, which is 54% of the estimate.
Drawing on the general features of our framework, to invalidate Borman et al.’s inference
of an effect of OCR on reading achievement one would have to replace 54% of the cases in
study, and assume the limiting condition of zero effect of OCR in the replacement cases.
Applying (10), the replacement cases would come from the non-volunteer population (p´). That
is, 54% of the observed volunteer classrooms in Borman et al.’s study must be unexchangeable
with the unobserved non-volunteer classrooms in the sense that it is necessary to replace those
54% of cases with unobserved cases for the inference to be valid a population that includes non-
volunteer cases.
To gain intuition about sample replacement, examine Figure 2 which shows distributions
for business as usual and Open Court before and after sample replacement. The dashed line
17

What would it take to Change an Inference?
represents the observed data based on parameter estimates from Borman et al.’s multilevel
model, including pre-test as a covariate (data were simulated with mean for business as usual =
607; mean for Open Court =615 –see Borman et al., 400-402). The replacement data were
constructed to preserve the original mean of roughly 611 and standard deviation (assumed to be
6.67 based on Borman et al.’s results and assuming equal variance within groups). iii
Insert Figure 2 here
The black bars in Figure 2 represent the 46% (n=19) of classrooms that were not
replaced, and the gray bars represent the 54% (n=30) replacement classrooms randomly selected
from a hypothetical population of classrooms that did not volunteer for the study (p´). iv For
business as usual, the mean for the replacement data was about 4 points greater than the observed
data. For OCR the mean for the replacement data was about 3 points less than the observed data,
narrowing the difference between the curricula by about 7 points (the data with the replacement
values were associated with t-ratio of 1.86 with a p-value of .068). The graphic convergence of
the distributions represents what it means to replace 54% of the data with data for which there is
no effect.
We now compare the robustness of Borman et al.’s inference with the robustness of
inferences from two other randomized experiments: Finn and Achilles’ (1990) prominent study
of the effects of small classes on achievement in Tennessee, and Clements and Sarama’s (2008)
relatively recent study of the effects of the Building Blocks curriculum on preschoolers’
mathematical achievement. The latter offers an important contrast to the scripted OCR
curriculum because it is molded through continuous interaction between developers and teachers
who implement the curriculum.
For comparison of robustness across studies we conduct our analysis using the
18

What would it take to Change an Inference?
standardized metric of a correlation. v As shown in Table 1, 47% of Borman et al.’s estimated
correlation between OCR and achievement must be due to bias to invalidate their inference. By
comparison, 64% of Finn and Achilles’ (1990) estimate must be due to bias to invalidate their
inference, and Clements and Sarama’s (2008) inference would be invalid even if only 31% of
their estimate were due to sampling bias. Note that these are merely statements about the relative
robustness of the causal inferences. In order to inform policy related to curricula or small
classes, administrators and policy makers should take into account the characteristics of the study
designs (e.g., what Shadish, Cook and Campbell, 2002, refer to as surface similarity), as well as
the costs of implementing a particular policy in their contexts.
Insert Table 1 here
The Effect of Kindergarten Retention on Reading Achievement
We now quantify the robustness of an inferred negative effect of kindergarten retention
on achievement from an observational study. Similar to the Open Court Curriculum,
kindergarten retention is a large scale phenomenon, with the US Department of Health and
Human Services (2000) estimating that 8% of second graders (more than five hundred thousand)
were a year behind their expected grade level as a result of not being promoted, known as
retention, in kindergarten or first grade (see also Alexander, Entwisle & Dauber, 2003, p. 1).
Furthermore, a disproportionate percentage of those retained are from low socioeconomic
backgrounds and/or are racial minorities (Alexander et al., chap. 5). As Alexander et al. wrote:
“next to dropout, failing a grade is probably the most ubiquitous and vexing issue facing school
people today” (p. 2).
Given the prevalence and importance of retention, there have been considerable studies
and syntheses of retention effects (e.g., Alexander et al., 2003; Holmes, 1989; Holmes &
19

What would it take to Change an Inference?
Matthews, 1984; Jimerson, 2001; Karweit, 1992; Reynolds, 1992; Roderick et al., 1999; Shepard
& Smith, 1989). Yet none of these studies has been conclusive, as there has been extensive
debate regarding the effects of retention, especially regarding which covariates must be
conditioned on (e.g., Alexander, 1998; Alexander et al., 2003; Shepard, Smith & Marion, 1998).
Because of the ambiguity of results, a study of the effects of kindergarten retention that
employed random assignment to conditions at any level of analysis would be welcome. But as
Alexander et al. (2003, p. 31) wrote, “random assignment, though, is not a viable strategy [for
studying retention] because parents or schools would not be willing to have a child pass or fail a
grade at the toss of a coin, even for purposes of a scientific experiment (see Harvard Education
Letter, 1986:3, on the impracticality of this approach). Also, human subjects review boards and
most investigators would demur for ethical reasons.” This is a specific example of Rubin’s
(1974) concerns about implementing randomized experiments as well as Cronbach’s (1982)
skepticism about the general feasibility of random assignment to treatments.
In the absence of random assignment, we turn to studies that attempted to approximate
the conditions of random assignment using statistical techniques. Of the recent studies of
retention effects (Burkam et al., 2007; Jimerson, 2001; Lorence et al., 2002), we focus on Hong
and Raudenbush’s (2005) analysis of nationally representative data in the Early Childhood
Longitudinal Study (ECLS) which included extensive measures of student background,
emotional disposition, motivation, and pretests.
Hong and Raudenbush (2005) used the measures described above in a propensity score
model to define a “retained counterfactual” group representing what would have happened to the
students who were retained if they had been promoted (e.g., Rubin 1974; Holland 1986). As
represented in Figure 3, Hong and Raudenbush estimated that the “retained observed” group
20

What would it take to Change an Inference?
scored nine points lower on reading achievement than the “retained counterfactual” group at the
end of first grade. vi The estimated effect was about two thirds of a standard deviation on the test,
almost half a year’s expected growth (Hong & Raudenbush, p. 220), and was statistically
significant (p < .001, with standard error of.68, and t-ratio of −13.67). vii Ultimately, Hong and
Raudenbush concluded that retention reduces achievement: “children who were retained would
have learned more had they been promoted” (page 200).
Insert Figure 3 here
Hong and Raudenbush (2005) did not employ the “Gold Standard” of random assignment
to treatment conditions (e.g., US Department of Education, 2002; Eisenhardt & Towne, 2008).
Instead they relied on statistical covariates to approximate equivalence between the retained and
promoted groups. But they may not have conditioned for some factor, such as an aspect of a
child’s cognitive ability, emotional disposition, or motivation, which was confounded with
retention. For example, if children with high motivation were less likely to be retained and also
tended to have higher achievement, then part or all of Hong and Raudenbush’s observed
relationship between retention and achievement might have been due to differences in
motivation. In this sense, there may have been bias in the estimated effect of retention due to
differences in motivation prior to, or in the absence of, being promoted or retained.
Our question then is not whether Hong and Raudenbush’s estimated effect of retention
was biased because of variables omitted from their analysis. It almost certainly was. Our
question instead is “How much bias must there have been to invalidate Hong and Raudenbush’s
inference?” Using statistical significance as a threshold for Hong and Raudenbush’s sample of
7639 (471 retained students and 7168 promoted students, page 215 of Hong & Raudenbush), and
standard error of .68, δ# = se x tcritical, df=7600=.68 x (−1.96)= −1.33. Given the estimated effect of
−9, to invalidate the inference bias must have accounted for −9− −1.33= −7.67 points on the
21

What would it take to Change an Inference?
reading achievement measure, or about 85% of the estimated effect (−7.67/−9=.85).
Drawing on the general features of our framework, to invalidate Hong and Raudenbush’s
inference of a negative effect of kindergarten retention on achievement one would have to
replace 85% of the cases in their study, and assume the limiting condition of zero effect of
retention in the replacement cases. Applying (15), the replacement cases would come from the
counterfactual condition for the observed outcomes. That is, 85% of the observed potential
outcomes must be unexchangeable with the unobserved counterfactual potential outcomes such
that it is necessary to replace those 85% with the counterfactual potential outcomes to make an
inference in this sample. Note that this replacement must occur even after observed cases have
been conditioned on background characteristics, school membership, and pretests used to define
comparable groups.
Figure 4 shows the replacement distributions using a procedure similar to that used to
generate Figure 2, although the gray bars in Figure 4 represent counterfactual data necessary to
replace 85% of the cases to invalidate the inference (the difference between the retained and
promoted groups after replacement is -1.25, p =.064). The left side of Figure 2 shows the 7.2
point advantage the counterfactual replacement cases would have over the students who were
actually retained retained|x=promoted− retained|x=retained= 52.2−45.0=7.2). This shift of 7.2
points works against the inference by shifting the retained distribution to the right, towards the
promoted students (the promoted students were shifted less than the retained students in order to
preserve the overall mean). viii
Insert Figure 4 here
Our analysis appeals to the intuition of those who consider what would have happened
22

What would it take to Change an Inference?
to the promoted children if they had been retained, as these are exactly the RCM potential
outcomes on which our analysis is based. Consider test scores of a set of children who were
retained that are considerably lower (9 points) than others who were candidates for retention but
who were in fact promoted. No doubt some of the difference is due to advantages the
comparable others had before being promoted. But now to believe that retention did not have an
effect one must believe that 85% of those comparable others would have enjoyed most (7.2) of
their advantages whether or not they had been retained. This is a difference of more than a 1/3 of
a year’s growth. ix Although interpretations will vary, our framework allows us to interpret Hong
and Raudenbush’s inference in terms of the ensemble of factors that might differentiate retained
students from comparable promoted students. In this sense we quantify the robustness of the
inference in terms of the experiences of promoted and retained students and as might be
observed by educators in their daily practice.
We now compare the robustness of Hong and Raudenbush’s (2005) inference with the
robustness of inferences from two other observational studies: Morgan’s (2001) inference of a
Catholic school effect on achievement (building on Coleman et al., 1982), and Hill, Rowan and
Ball’s (2005) inference of the effects of a teacher’s content knowledge on student math
achievement. Hill et al.’s focus on teacher knowledge offers an important complement to
attention to school or district level policies such as retention because differences among teachers
are important predictors of achievement (Nye, Konstantopoulos & Hedges, 2004).
As shown in Table 2, Morgan’s (2001) inference and Hill et al.’s inference would not be
valid if slightly more than a third of their estimates were due to bias. By our measure, Hong and
Raudenbush’s inference is more robust than that of Morgan or Hill et al. Again, this is not a
final proclamation regarding policy. In choosing appropriate action, policymakers would have to
23

What would it take to Change an Inference?
consider the relative return on investments of policies related to retention, incentives for students
to attend Catholic schools, and teachers’ acquisition of knowledge (e.g., through professional
development). Furthermore, the return on investment is not the only contingency, as decision-
makers should consider the elements of the study designs already used to reduce bias. For
example, we call attention to whether the observational studies controlled for pretests (as did
Hong and Raudenbush as well as Morgan, 2001) which have recently been found to be critical in
reducing bias in educational studies (e.g., Shadish, Clark & Steiner, 2008; Steiner et al., 2010,
2011).
Insert Table 2 here
Expanded the Details of our Framework
Choosing a threshold relative to transaction costs. The general framework we have proposed
can be implemented with any threshold. But given that educational research should be
pragmatic, the threshold might depend on the size of the investment needed to manipulate policy
or practice. Individuals or families might be comfortable with a lower threshold than policy-
makers considering diverting large resources to change the experiences of many people.
Therefore, the following is a guide for increasing thresholds based on the transaction costs of
program change.
1) Changing beliefs, without a corresponding change in action.2) Changing action for an individual (or family)3) Increasing investments in an existing program.4) Initial investment in a pilot program where none exists.5) Dismantling an existing program and replacing it with a new program.
Note that the first level does not even constitute a change in action. In this sense it is
below a pragmatic threshold for action. The values of the thresholds needed to invalidate an
inference increase from levels 2 through 5 as the actions require greater resources. An inference
24

What would it take to Change an Inference?
should be more robust to convince a policy maker to initiate a whole scale change in policy than
to convince a family to choose a particular treatment.
Non-zero null hypotheses. For Hong and Raudenbush’s inference of a negative effect of
retention on achievement, consider a null hypothesis adequate for increasing investment in an
existing program. For example, define the threshold by δ> −6, where 6 units represents about ¼
of a year of growth, slightly less than half a standard deviation on Hong and Ruadenbush’s
outcome. For a null hypothesis defined by δ> −6, the threshold for statistical significance is (se x
tcritical, df=7639)=.68 x (−1.645)= −1.12 (using a one tailed test). Therefore δ# = −6−1.12=−7.12, and
1− δ #/ =1− (−7.12/−9)=.21. The result is that 21% of the estimated kindergarten retention effect
would have to be due to differences between the students before being retained or promoted to
invalidate the inference that retention has an effect using a threshold of −6. Thus quantifying the
robustness of an inference for non-zero hypotheses can represent uncertainty about qualitative
policy decisions based on fixed thresholds.
Failure to reject the null hypothesis when in fact the null is false. We have focused on the
extent of bias necessary to create a type I error (rejecting the null hypothesis when in fact the null
hypothesis is true). It is important note, however, that bias could also hide a substantively
important negative effect. This is an example of type II error, failure to reject the null when in
fact the null hypothesis is false. Critically, from an ethical or policy perspective type II errors
may require different thresholds than type I errors. For example, in medical trials the threshold
for discontinuing a trial due to potential harm is not as conservative as criteria used to infer a
positive treatment effect (Federal Register, 1998, page 49592).
When there is concern that bias may have hidden a negative effect, one could define δ# as
the threshold for inferring a negative effect of a treatment and then quantify the bias necessary to
25

What would it take to Change an Inference?
have created a false inference that there is no negative effect. For example, if a value of δ# of −4
would be strong enough to infer a negative effect and the estimate were −3, then the bias
necessary to invalidate the inference would be 1−δ# / =1−(−4)/−3)=−1/3. If the original estimate
is biased by 1/3 then the inference of no negative effect is invalid. Alternatively, one could report
the coefficient by which the estimate would have to be multiplied to exceed the threshold for
inference. This is simply the ratio of the observed estimate to its threshold. For example, one
would have to multiply an observed effect of −3 by 1.33 to make it exceed the threshold of −4.
Non-zero effect in the replacement (non-volunteer) population. In our examples so far,
we have assumed that replacement cases have a zero treatment effect. But our general framework
also applies to the conditions necessary to invalidate an inference if one assumes a non-zero
treatment effect in the replacement population. This can be illustrated in equation (7). Setting the
combined population treatment effect to be less than the threshold for inference ( < δ#) and
solving for the proportion of the original sample to be replaced (1-πp), yields that the inference is
invalid if 1-πp<( p − δ#)/( p − p´ ).
In Borman et al.’s example, assume the effect of OCR in the non-volunteer population,
, is −2, and that δ#=3.68 and p =7.95 (both as in the initial example). Under these conditions,
the inference is invalid if 1-πp<(7.95 – 3.68)/(7.95 − −2 ) =.43; the inference would be invalid if
more than 43% of the sample were replaced with cases for which the effect of OCR was −2 .
Intuitively, to invalidate the inference one would have to replace a smaller percentage (43%
versus 54%) if there is a negative versus zero effect in the replacement cases.
Discussion
26

What would it take to Change an Inference?
Judgment is required to interpret any causal inference in educational policy research. For
instance, Borman et al.’s inference that the effects of OCR “may be replicated across varying
contexts with rather consistent and positive results,” (page 405) may not apply to schools that did
not volunteer for participation in OCR. Hong and Raudenbush’s (2005) inference that “children
who were retained would have learned more had they been promoted” (page 200) may be invalid
if some other factor affected the likelihood of retention and achievement.
To inform interpretation of inferences, we have quantified how much bias must be to
invalidate an inference. How much of Borman et al.’s (2008) estimate must be due to unusual
effectiveness in their sample to invalidate their inference? The answer is 54%. Interpreting in
terms of our framework, to infer that OCR does not have a general effect pertaining to a
population that includes volunteer and non-volunteer schools, one would have replace 54% of
the volunteer classrooms in Borman et al.’s study with non-volunteer classrooms in which there
was no effect of OCR. This adds precision to Borman et al.’s language of “may be replicated”
and “rather consistent.”
How much of Hong and Raudenbush’s estimate must be due to bias to invalidate their
inference? The answer is 85%. Interpreting in our framework in terms of counterfactual data, to
believe that retention did not have an effect, one would have to believe that 85% or more of
promoted students (who were comparable to retained students in terms of background, emotional
disposition, school membership, and pretests) would have held most of their advantage whether
or not they repeated a year of kindergarten.
The bias necessary to invalidate an inference should be evaluated relative to the study
design. The sampling bias necessary to invalidate Borman et al.’s inference from a randomized
experiment on a volunteer sample should be evaluated relative to the characteristics of the
27
What would it take to Change an Inference?
sample and desired population, as well as the sampling mechanism. They did include a range of
socioeconomic status and region which should make their data representative of broader
populations, but all of the schools in their study volunteered for the study, potentially
differentiating them from non-volunteer schools. Quantifying this concern, 54% of the volunteer
schools would have to be unrepresentative of the volunteer schools to invalidate the inference.
Similarly, the extent of selection bias necessary to invalidate Hong and Raudenbush’s
inference should be evaluated relative to the mechanism of treatment assignment, as well as the
statistical controls employed to reduce selection bias. Hong and Raudenbush did control for
background, emotional disposition and pretests, ruling out many of the most ready explanations
for differences between the retained and promoted students. But questions may persist about
remaining, uncontrolled differences. Quantifying this concern, 85% of the observed students
would have to be replaced with unbiased counterfactual cases (for which there was no treatment
effect) to invalidate the inference.
Evaluating the robustness of an inference relative to study design has two important
implications. First, there is limited value in directly comparing the bias necessary to invalidate an
inference between studies of different designs (e.g., randomized experiments and observational
studies). Second, the more bias favoring the treatment the study has accounted for the less robust
the inference will appear to be, because adjusting for bias moves the estimate closer to the
threshold for inference. In this context, larger explained variance in the outcome (R2) is one
indicator of a good model for an observational study because it suggests that many of the most
important explanations of the outcome have been accounted for.
Relation to Other Approaches
28

What would it take to Change an Inference?
Bounding an effect. Altonji et al. (2005, 2010) bounded estimated effects by drawing on
information associated with observed confounds (cf. Manski, 1990, who bounds based on the
maximum value of the outcome). Consistent with this, Hong and Raudenbush (page 220),
reported how their estimate would have changed if it was reduced by an omitted variable
comparable to their most important covariate. In our own analysis (reported in endnote ix), the
estimated retention effect was reduced by .074 when we added emotional disposition to a model
already including pretests, background characteristics, and fixed effects for schools. If
unobserved confounds accounted for as much reduction, the lower bound of the kindergarten
retention effect would be −9.320+.074=−9.246.
Of course the preceding analysis is only as good as the assumption that bias associated
with unobserved confounders is no greater than bias associated with observed confounders.
Such would not be the case if there were some unique factor associated with kindergarten
retention that was not captured in the general controls included in ECLS-K. Or if there were an
omitted factor whose effect on being retained was not substantially absorbed by the pretests in
ECLS-K. x This forces consumers of research to carefully consider how potential confounders
available in a data set were selected from the set of all possible confounders (Altonji et al., 2010;
see also Steiner et al.’s 2010 attention to factors affecting choice of treatments).
Generally, while we recognize the great value of bounding an effect, bounding an effect
supports different understanding than quantifying the robustness of an inference. The lower
bound of −9.246 provides information about a worst (or best) case scenario whereas we
incorporate different effects as thresholds in our framework, and then quantify the bias necessary
to reduce an estimate below the threshold. Ultimately, we believe both can be useful to
researchers and policy-makers.
29
What would it take to Change an Inference?
Other sensitivity analyses. Typical sensitivity analyses are expressed in terms of the
properties of the omitted variables that could alter an inference either because they affected
selection into the sample or assignment to treatments or both (e.g., Copas & Li,1997; Holland,
1989; Lin, Psaty & Kronmal, 1998; Robins, Rotnisky & Scharfstein, 2000; Rosenbaum, 1986,
2002; Rosenbaum & Rubin, 1983; Scharfstein, 2002). For example, Rosenbaum, (1986, page
221) wrote: “The inclusion of an omitted variable U, which is as predictive as the most
predictive covariate in the short list of covariates excluding the pretest, would have a relatively
modest impact on the estimated effect [of dropout on cognitive test scores] unless that variable
had a substantially larger dropout-versus-stayer difference than any covariate under study.”
Rosenbaum’s statement is complex partly because one must consider two relationships
associated with an omitted variable: the relationship with the predictor of interest (e.g., drop-
out), and the relationship with the outcome (e.g., cognitive test scores). Technically, this can be
dealt with by conducting dual sensitivity (Gastwirth, Krieger & Rosenbaum, 1998) or by
characterizing sensitivity analysis in terms of the product of the two relationships (Frank, 2000;
Hirano & Imbens, 2001; Iami, Keel and Yamamoto, 2010). But the critical limitation of most
sensitivity analyses is that they are cast in terms of properties of the variables (e.g., correlations
associated with the variables), appealing to those who think in terms of relationships among
factors.
Our framework appeals to an alternative intuition than most sensitivity analyses: we
express sensitivity in terms of properties of the units of observation (e.g., people or classrooms)
instead of variables, and we interpret in terms of motives, experiences, and outcomes of the
people responsible for action (Abbott 1998). This may especially appeal to those who engage
schools and students in their daily practice. For example, a principal may naturally consider how
30

What would it take to Change an Inference?
her school compares with a neighboring school in deciding whether to adopt one of its policies.
Just so, she may be able to consider how well the schools which volunteered for a study
represent her own, and may draw on our framework to quantify her consideration.
External validity based on propensity to be in a study. Hedges and O’Muircheartaigh
(2011) used the estimates from a particular propensity stratum to generalize to a corresponding
unstudied population. This is a clever approach to exploring the external validity of an inference
based on the propensity for being in a study (see also Pearl & Bareinboim, 2011; Stuart et al.,
2011). For example, one might use estimated effects of small classes in Tennessee (Finn &
Achilles, 1990) for certain strata based on background characteristics to project a score for
California.
Our approach differs from that of Hedges and O’Muircheartaigh (2011) in two ways.
First, Hedges and O’Muircheartaigh project an estimate to a population outside the study,
whereas we consider what would happen if the outside population were brought into the study.
In this sense Hedges and O’Muircheartaigh appeal to differential treatment effects (e.g.,
Cronbach, 1982) and we seek to identify general effects across populations (e.g., Cook &
Campbell, 1979).
Second, Hedges and O’Muircheartaigh assume one has all of the information about the
unstudied target population that is both relevant for participation in the study and affects the
treatment estimate. This is similar to the strong assumption of ignorability (Rosenbaum &
Rubin, 1983) – that other factors can be ignored conditioning on the observed factors. Thus the
question can still arise as to how much unobserved factors could have affected participation in
the study as well as the treatment effect. For example, there may be subtle unobserved factors
that affected whether schools volunteered for Borman et al.’s study. And sensitivity to these
31

What would it take to Change an Inference?
factors can be assessed using our approach.
Other Sources of Bias
We attended to two fundamental sources of bias in using RCM to interpret the bias necessary
to invalidate an inference -- restricted samples and non-random assignment to treatment. But
bias can come from alternative sources. We briefly discuss three of those sources below:
violations of SUTVA, measurement error, and differential treatment effects.
Violations of SUTVA. Our analysis concerns how estimates would change if observations
were replaced with hypothetical or counterfactual cases. But estimates could also change if
observed outcomes changed when others’ assignments were altered. For example, the
achievement of the students who were actually retained could change if some promoted students
were retained. This could occur if one child’s retention reduced the stigma of another, or
competed with the resources, such as the attention of the teacher (Shepard & Smith, 1989).
Changes in observed outcomes as a result of others’ assignments to treatment conditions
constitute a violation of SUTVA, an assumption made for most inferences. As such, there are
some (recent) techniques to inform the implications of violations to SUTVA. For example, one
can use agent based models to explore the dynamic implications of changes in treatment
assignments (e.g., Maroulis et al., 2010).
Measurement Error. Error in measurement, especially of the outcomes, could bias estimates.
Generally, measurement error will lead to conservative inferences because it reduces precision of
estimates. This might be preferred if one wanted to be cautious in implementing new programs.
But measurement error could hide a substantively important negative effect (an example of a
type II error, failure to reject the null when in fact the null hypothesis is false).
Measurement error is not a large concern for the two focal examples in the article in which
32

What would it take to Change an Inference?
the outcomes were measured with high reliability. The reliability of the Terra Nova
comprehensive reading test used by Borman et al was very high (.84 to .93 across grades 3-6 --
SRA/McGraw-Hill, 2001), and would likely be higher at the classroom level given fairly large
sample sizes per classroom (see Brennan, 1995, for a discussion). Similarly, the test used by
Hong and Raudenbush had a reliability of .95 (based on the variance of repeated estimates of
overall ability --see ECLS-K user guide, section 3.1.6). Furthermore, both Borman et al., and
Hong and Raudenbush increased precision by controlling for a pre-test (which also could reduce
the potential for non-normality – see Borman et al., page 400).
Differential Treatment Effects. To isolate the bias due to baseline differences, we assumed
that the treatment effect for the treated equaled the treatment effect for the control. This would be
violated if people chose treatments that are likely to be good for them for idiosyncratic or
difficult to observe reasons (Heckman, 2005; Heckman , Urzua & Vytlacil, 2006). For example,
Hong and Raudenbush’s estimated effect of kindergarten retention could be upwardly biased if
those who were retained might have benefitted more (or suffered less) from retention than those
who were promoted for subtle idiosyncratic reasons. In response, one could use propensity score
techniques to separately estimate treatment effects for the treated and for the control (e.g.
Morgan, 2001). After doing so, one could apply our framework to either estimate (e.g. Frank,
Sykes et al., 2008).
Conclusion
Causal inference in policy analysis does not depend on a single researcher or study. For
education research to inform policy it should emerge through debate among a community of
scholars about the relative merits of different studies (e.g., Greco, 2009; Habermas, 1987; Kuhn,
1962; Kvanig, 2003; Sosa, 2007). Campbell’s law (1976) states: “The more any quantitative
33

What would it take to Change an Inference?
social indicator is used for social decision-making, the more subject it will be to corruption
pressures and the more apt it will be to distort and corrupt the social processes it is intended to
monitor” (page 49). Our corollary is “The more any quantitative social indicator is used for
social decision-making, the greater will be the intensity of debate about the inference made from
the indicator.”
Therefore, we informed debate about causal inferences by quantifying the discourse
about the robustness of the inference, and we provided a framework to interpret the robustness.
When discussing concerns about an observational study researchers can speak in terms of the
proportion of the cases that would have to be replaced with counterfactual data to invalidate the
inference; and when discussing concerns about the generality of effects from a randomized
experiment researchers can speak in terms of the proportion of the sample that would have to be
replaced to represent a population not sampled. Over time, it is our hope that the repeated
characterization of robustness in such terms can contribute to a general language for debating
inferences from educational research.
34

What would it take to Change an Inference?
Technical Appendix A (can be made available only on-line)
Deriving Expressions for Bias Using RCM
Bias due to Non-Random Assignment to Treatments
To focus on the bias due to non-random assignment to treatments, we use RCM to
decompose the population treatment effect, , into two components (e.g., Heckman, 2005;
Winship & Morgan, 1999): t, the treatment effect for those in the treatment group, and c, the
treatment effect for those in the control group. Therefore the average treatment effect, , is
= π t
t +(1−π t) c, (A1)
where πt represents the proportion in the population who received the treatment. Thus is a
simple weighted average of the two treatment effects t and c. Taking expectations of (A1)
yields:
E[ ]=E[π t +(1−π ) c]=
π (E[Yt|X=t]−E[Yc|X=t])+(1− π )(E[Yt|X=c]−E[Yc|X=c]), (A2)
where the notation is as in the main text: X=t if a unit received the treatment and X=c if a unit
received the control. Yt | X=t is then the value of the outcome Y for a unit exposed to the
treatment, and Yc | X=t is the counterfactual value of Y under the control condition for a unit
receiving the treatment.
Using the same notation, the expectation of the standard estimator, (e.g., the difference
in observed means between the treatment and control group) is
E[ ]=E[Yt|X=t]−E[Yc|X=c] . (A3)
35

What would it take to Change an Inference?
and then defining bias, β =E[ ]−E[ ], the bias due to non-random assignment of units to
treatments, βa, can be defined using the expectations in (A2) and (A3):
βa=E[ ]−E[ ]=
E[Yt|X=t]−E[Yc|X=c]−{π (E[Yt|X=t]−E[Yc|X=t])+(1−π )(E[Yt|X=c]−E[Yc|X=c])}. (A4)
Combining terms associated with π and (1−π ) yields:
βa=π { E[Yc|X=t]−E[Yc|X=c]}+(1−π ){E[Yt|X=t]−E[Yt|X=c]} , (A5)
as in the main text.
Bias due to Non-Random Sampling
Equation (7) in the main text is:
= πp p +(1− πp) p´ . (7)
As in the main text, let Z=p if a unit is in p, and Z=p´ if a unit is in p´. Combining this the
notation of RCM, Yt | Z=p represents the treatment outcome for a unit in the population from
which the cases were sampled (p), and Yc | Z=p´ represents the control outcome for a unit in the
population from which cases were not sampled (p´). Using this notation, taking expectations of
(7) yields:
E[ ]= =
E[π p
p +(1−π p)
pʹ]= π p (E[Yt|Z=p]−E[Yc|Z=p])+(1−π p)(E[Yt|Z=p´]−E[Yc|Z=p´]) (A6)
In the same notation the expectation for the standard estimator, (e.g., the difference in
observed means between the treatment and control group) is
E[ ]= p =E[ t|Z=p] –E[ c|Z=p]. (A7)
36

What would it take to Change an Inference?
Again defining bias, β =E[ ]−E[ ], the bias due to non-random sampling, βs, can be defined by
using the expectations in (A6) and (A7):
βs=E[ t|Z=p] –E[ c|Z=p]−
{π p (E[Yt|Z=p]−E[Yc|Z=p])+(1−π p)(E[Yt|Z=p´]−E[Yc|Z=p´])}. (A8)
Combining terms yields:
βs =(1−π p){( E[Yt|Z=p]−E[Yc|Z=p])− (E[Yt|Z=p´]−E[Yc|Z=p´])} , (A9)
as in the main text.
37

What would it take to Change an Inference?
Technical Appendix B (can be made available only on-line):
Application to Studies Available On-line for Upcoming Publication in this Journal
To gain more of a sense of how to interpret robustness in different contexts, we
quantified how much bias would be necessary to invalidate inferences in all of the articles
available in on-line preprint in Education, Evaluation and Policy Analysis as of Dec 19, 2012
(dates for the articles range from July 24 2012 to Nov 15 2012). As such the studies are of
current interest to this readership. All studies were included in which an inference was made by
comparing an estimate to a threshold (this eliminated one study by Saunders and Marcelletti that
was explicitly “descriptive”). These studies included applications of randomized experiments
(e.g., Grigg et al), regression discontinuity (e.g., Mariano & Martorell), meta analysis (Shager et
al.,), logistic regression (Stephan & Rosenbaum), fixed effects (Bozick & Dalton), propensity
score models (e.g., An), as well as the general linear model (e.g., Engel, Claessens, & Finch).
We applied our analysis to focal inferences from each study, as indicated by a reference
in the abstract of the study. In each case, we followed the same procedures as in generating
Tables 1 and 2. We first calculated a correlation between the predictor of interest and outcome
by converting a reported t-ratio (recognizing that the standard errors form only an approximate
basis for certain types of models, such as logistic regression). We then calculated the threshold
for statistical significance based on the reported degrees of freedom (each of the studies reported
in Tables 3 and 4 either explicitly or implicitly used statistical significance as part of the
threshold for inference, for example by only interpreting the policy relevance of those estimates
that were statistically significant – see Wainer & Robinson, 2003), and then calculated the %
bias necessary to reduce the estimate below the threshold.
We report the results for randomized experiments in Table B1. The % bias necessary to
38

What would it take to Change an Inference?
invalidate the inferences ranges from 7% to 33%. While these inferences may appear
moderately robust, much of the bias due to internal validity may have been removed by
randomly assigning units to treatments. We do note, however, that the robustness is partly a
function of sample size (when statistical significance is used as a basis for inference), and the
sample sizes are relatively small. This is often the case in randomized experiments which are
expensive especially for units of analysis that aggregate individuals (e.g., classrooms in Grigg et
al., -- see Slavin, 2008).
Insert Table B1here
We report the results for observational studies in Table B2. The bias necessary to
invalidate the inference ranges from 2% to 60%. As in Table B1, the larger percentages are
associated with the larger sample sizes, in this case from analysis of federal or city data bases. xi
Nonetheless, the implications of an inference for policy purposes should be based on effect sizes
(e.g., Wilkinson et al., 1999) as well as the robustness of the inference. For example, the
correlation between summer instruction and language arts achievement is only .029 in Mariano’s
study, although 60% of the estimate would have to be due to bias to invalidate the inference. The
point goes both ways: studies with the largest effect sizes may not be most robust to concerns
about sources of bias. For example, the correlation between elements of study design and
reported effect size in Shager is .524, but the inference of a relationship would be invalid if only
16% of the estimated effect were due to bias.
Insert Table B2 here
39

What would it take to Change an Inference?
Finally, two of the inferences reported in Tables B1 and B2 were for the lack of an effect
because the estimates fell below a threshold (Yuan et al.; Bozick & Dalton). For these two
inferences, as in the main text we report the coefficient by which the estimate would have to be
multiplied to exceed the threshold for inference. It is simply the ratio of the observed estimate to
its threshold, although it can also be considered as 1−% bias necessary to invalidate the
inference: (1−1−δ# / = δ# / ). For the example of Yuan’s randomized experiment of incentive
pay programs, the correlation between incentive pay and extra hours worked of .077 would have
to be multiplied by a factor of 2.53 to be positive and statistically significant. Applying similar
calculations to Bozick and Dalton’s inference that occupational courses taken do not affect math
achievement, the correlation between occupational courses taken in high school and math
achievement would have to be multiplied by a factor of 7.18 to become statistically significant.
The analyses reported in Tables B1 and B2 move toward a reference distribution of the
robustness of inferences reported in this journal. To fully generate such a distribution
researchers will have to analyze inferences from hundreds of studies and gain a sense of how the
robustness of inferences varies with the attributes of a study. This is beyond the scope of our
study, and ideally should be generated by a research community that reflects diverse
interpretations of our framework. Therefore, we hope others will follow the procedures outlined
here to generate such distributions against which future researchers characterize may the
robustness of new inferences.
40

What would it take to Change an Inference?
References
Abbott, A. (1998). "The Causal Devolution" Sociological Methods and Research 27:148-181.
Alexander, K. L. (1998). Response to Shepard, Smith and Marion. Psychology in Schools, 9, 410-417.
Alexander, K., Entwisle, D. R., and Dauber, S. L.(2003). On the success of failure: a reassessment of the effects of retention in the primary school grades. Cambridge, UK: Cambridge University Press.
Alexander, K. L., & Pallas, A. M. (1983). Private schools and public policy: New evidence on cognitive achievement in public and private schools. Sociology of Education, 56, 170-182.
Altonji, J.G., Elder, T., and Taber, C. (2005). An Evaluation of Instrumental Variable Strategies for Estimating the Effects of Catholic Schooling. Journal of Human Resources 40(4): 791-821.
Altonji, J.G., Conley, T., Elder, T., and Christopher Taber. (2010). ``Methods for Using Selection on Observed Variables to Address Selection on Unobserved Variables’’. Retrieved 11-20-12 from https://www.msu.edu/~telder/.
An, Brian P. (Forthcoming). The Impact of Dual Enrollment on College Degree Attainment: Do Low-SES Students Benefit? Educational Evaluation and Policy Analysis, Oct 2012; vol. 0: 0162373712461933.
Becker, H. H. (1967). Whose side are we on? Social Problems, 14, 239-247
Behn, Robert D. & James W. Vaupel. (1982). Quick Analysis for Busy Decision Makers. Basic Books, Inc. New York.
Bogatz, G. A., & Ball, S. (1972). The impact of “Sesame Street” on children’s first school experience. Princeton, NJ: Educational Testing Service.
Borman, G. D., Dowling, N. M., and Schneck, C. (2008). A multi-site cluster randomized field trial of Open Court Reading. Educational Evaluation and Policy Analysis, 30(4), 389-407.
Bozick, Robert, Dalton, Benjamin. (Forthcoming). Balancing Career and Technical Education with Academic Coursework: The Consequences for Mathematics Achievement in High School. Educational Evaluation and Policy Analysis, Aug 2012; vol. 0: 0162373712453870.
Brennan, R. L. (1995). The Conventional Wisdom about Group Mean Scores. Journal of Educational Measurement, 32(4), 385-396.
Bulterman-Bos, J. A. (2008). Will a clinical approach make education research more relevant for practice? Educational Researcher, 37(7), 412–420.
41

What would it take to Change an Inference?
Burkam, D. T., LoGerfo, L., Ready, D., and Lee, V. E. (2007). The differential effects of repeating kindergarten. Journal of Education for Students Placed at Risk, 12(2), 103-136.
Campbell, D.T. (1976). Assessing the Impact of Planned Social Change. The Public Affairs Center, Dartmouth College, Hanover New Hampshire, USA. December, 1976. Retrieved from https://www.globalhivmeinfo.org/CapacityBuilding/Occasional%20Papers/08%20Assessing%20the%20Impact%20of%20Planned%20Social%20Change.pdf
Carlson, D., Cowen, J.M., and Fleming, D.J. (Forthcoming). Life After Vouchers: What Happens to Students Who Leave Private Schools for the Traditional Public Sector? Educational Evaluation and Policy Analysis 0162373712461852, first published on November 15, 2012 as doi:10.3102/0162373712461852
Chubb, John E. and Terry M. Moe, "Politics, Markets, and America's Schools" (Washington D.C.: The Brookings Institution, 1990).
Clements, D. H. and Sarama J. (2008). Experimental Evaluation of the Effects of a Research-Based Preschool Mathematics Curriculum. American Educational Research Journal, 45(2), 443-494.
1Coleman, J. S., Hoffer, T., & Kilgore, S. (1982). High School Achievement: Public, Catholic, and Private Schools Compared. New York: Basic Books.
Cook, T. D., and Campbell, D. T. (1979). Quasi-experimentation: Design and analysis issues for field settings. Chicago: Rand McNally.
Cook, T. D. (2002). Randomized experiments in educational policy research: A critical examination of the reasons the educational evaluation community has offered for not doing them. Educational Evaluation and Policy Analysis, 24, 175-199.
Cook, T. D. (2003). Why have educational evaluators chosen not to do randomized experiments? Annals of American Academy of Political and Social Science, Vol 589: 114-149.
Copas, J. B. and Li, H. G. (1997). Inference for Non-Random Samples. Journal of the Royal Statistical Society, Series B (Methodological), 59(1), 55-95.
1Cronbach, L. J. (1982). Designing evaluations of educational and social programs. San Francisco: Jossey-Bass.
ECLS-K user guide. Available at http://nces.ed.gov/pubsearch/pubsinfo.asp?pubid=2002149
Eisenhart , M., and Towne, L. (2008). Contestation and change in national policy on "scientifically based" education research. Educational Researcher, 32, 31-38.
Engel, Mimi, Claessens, Amy, Finch, Maida A. (Forthcoming). Teaching Students What They Already Know? The (Mis)Alignment Between Mathematics Instructional Content and Student Knowledge in Kindergarten. Educational Evaluation and Policy Analysis, Nov 2012; vol. 0: 0162373712461850.
Federal Register. (1998). Federal Register, 1998. 63(179). Retrieved from http://www.fda.gov/downloads/RegulatoryInformation/Guidances/UCM129505.pdf
42

What would it take to Change an Inference?
Finn, J. D., and Achilles, C. M. (1990). Answers and questions about class size: A statewide experiment. American Educational Research Journal, 27, 557-577.
Fisher, Ronald Aylmer, Sir . (1970 [1930]). Statistical methods for research workers. Darien, Conn., Hafner Pub. Co
Frank, K. A. (2000). Impact of a Confounding Variable on the Inference of a Regression Coefficient. Sociological Methods and Research, 29(2), 147-194.
Frank, K. A., and Min, K. (2007). Indices of robustness for sample representation. Sociological Methodology, 37, 349-392. * Co first authors.
Frank, K.A., Gary Sykes, Dorothea Anagnostopoulos, Marisa Cannata, Linda Chard, Ann Krause, Raven McCrory. 2008. Extended Influence: National Board Certified Teachers as Help Providers. Education, Evaluation, and Policy Analysis. Vol 30(1): 3-30.
Gastwirth, J. L., Krieger, A. M. & Rosenbaum, P. R. (1998), Dual and Simultaneous Sensitivity Analysis for Matched Pairs. Biometrika, 85, 907-920.
Greco, J. (2009). ‘The Value Problem’. In Haddock, A., Millar, A., and Pritchard, D. H. (Eds.), Epistemic Value. Oxford: Oxford University Press.
Grigg, Jeffrey, Kelly, Kimberle A., Gamoran, Adam, Borman, Geoffrey D. (Forthcoming). Effects of Two Scientific Inquiry Professional Development Interventions on Teaching Practice. Educational Evaluation and Policy Analysis, Oct 2012; vol. 0: 0162373712461851.
Habermas, J. (1987). Knowledge and Human Interests. Cambridge, United Kingdom: Polity Press.
Harding, David J. (2003). "Counterfactual Models of Neighborhood Effects: The Effect of Neighborhood Poverty on Dropping Out and Teenage Pregnancy." American Journal of Sociology 109(3): 676-719.
Harvard Education Letter (1986). Repeating a Grade: Dopes it help? Harvard Education Letter, 2, 1-4.
Heckman, J. (1979). Sample Selection Bias as a Specification Error. Econometrica, 47(1), 153-161.
Heckman, J. (2005). The scientific model of causality. Sociological Methodology, 35, 1-99.
Heckman, J., S. Urzua and E. Vytlacil. (2006). “Understanding Instrumental Variables in Models with Essential Heterogeneity,” Review of Economics and Statistics, 88(3): 389-432.
Hedges, L. , O’Muircheartaigh, C. (2011). Generalization from Experiments. Retrieved from http://steinhardt.nyu.edu/scmsAdmin/uploads/003/585/Generalization%20from%20Experiments-Hedges.pdf
43

What would it take to Change an Inference?
Hill, H. C., Rowan, B., and Ball, D. L. (2005). Effects of teachers' mathematical knowledge for teaching on student achievement. American Educational Research Journal, 42(2), 371-406.
Hirano, K., & Imbens, G. W. (2001). Estimation of causal effects using propensity score weighting: An application to data on right heart catheterization. Health Services and Outcomes Research Methodology 2, 259-278.
Holland, P. W. (1986). Statistics and Causal Inference. Journal of the American Statistical Association, 81, 945-70.
Holland, P. W. (1989). Choosing among alternative nonexperimental methods for estimating the impact of social programs: The case of manpower training: Comment. Journal of the American Statistical Association, 84(408), 875-877.
Holmes, C. T. (1989). Grade level retention effects: A meta-analysis of research studies. In Shepard, L. A., and Smith, M. L., Flunking grades (pp. 16-33). New York: Falmer Press.
Holmes, C. T., and Matthews, K. (1984). The Effects of nonpromotion on elementary and junior high school pupils: A meta analysis. Review of Educational Research, 54, 225-236.
Hong, G., and Raudenbush, S. W. (2005). Effects of kindergarten retention policy on children’s cognitive growth in reading and mathematics. Educational Evaluation and Policy Analysis, 27(3), 205-224.
Ichino, A., Mealli, F., & Nannicini, T. (2008). From temporary help jobs to permanent employment: What can we learn from matching estimators and their sensitivity? Journal of Applied Econometrics,23, 305–327. doi:10.1002/jae.998.
Imai, K., Keele, L., and Yamamoto, Teppei. (2010). Identification, Inference and Sensitivity Analysis for Causal Mediation Effects. Statistical Science Vol. 25, No. 1, 51–71.
Jimerson, S. (2001). Meta-analysis of grade retention research: Implications for practice in the 21st century. School Psychology Review, 30(3), 420-437.
Karweit, N. L. (1992). Retention policy. In Alkin, M. (Ed.), Encyclopedia of educational research (pp. 114–118). New York: Macmillan.
Kuhn, T. (1962). The structure of Scientific Revolutions. Chicago: University of Chicago Press.
Kvanvig, J. L. (2003). The Value of Knowledge and the Pursuit of Understanding. Oxford: Oxford University Press.
Lin. D.Y., Psaty, B. M., & Kronmal, R.A. (1998). Assessing the sensitivity of regression results to unmeasured confounders in observational studies. Biometrics, 54(3), 948-63
Lorence, J., Dworkin, G., Toenjes, L., and Hill, A. (2002). Grade retention and social promotion in Texas, 1994-99: Academic achievement among elementary school students. In Ravitch, D. (Ed.), Brookings Papers on Education Policy (pp. 13-67). Washington, DC: Brookings Institution Press.
44

What would it take to Change an Inference?
Manski, C. (1990). Nonparametric Bounds on Treatment Effects. American Economic Review Papers and Proceedings, Vol. 80, No. 2, pp. 319-323.
Mariano, Louis T., Martorell, Paco. (Forthcoming). The Academic Effects of Summer Instruction and Retention in New York City. Educational Evaluation and Policy Analysis, Aug 2012; vol. 0: 0162373712454327
Maroulis, S., Guimera, R., Petry, H., Gomez, L., Amaral, L.A.N., Wilensky, U. (2010). “A Complex Systems View of Educational Policy.” Science. Vol. 330, Issue 6000.
Miller, Sarah, Connolly, Paul. (Forthcoming). A Randomized Controlled Trial Evaluation of Time to Read, a Volunteer Tutoring Program for 8- to 9-Year-Olds. Educational Evaluation and Policy Analysis, Jul 2012; vol. 0: 0162373712452628
Morgan, S. L. (2001). Counterfactuals, causal effect heterogeneity, and the Catholic school effect on learning. Sociology of Education, 74, 341-374.
Morgan, S. L. and Winship, C. (2007). Counterfactuals and Causal Inference: Methods and Principles for Social Research. Cambridge: Cambridge University Press.
National Reading Panel (2000). Report of the National Reading Panel. Teaching children to read: An evidence-based assessment of the scientific research literature on reading and its implications for reading instruction (NIH Publication No. 00-4769). Washington, DC: U.S. Government Printing Office.
National Research Council. (2002). Scientific research in education. Washington, DC: National Academy Press.
Nomi, Takako. (Forthcoming). The Unintended Consequences of an Algebra-for-All Policy on High-Skill Students: Effects on Instructional Organization and Students' Academic Outcomes. Educational Evaluation and Policy Analysis, Jul 2012; vol. 0: 0162373712453869.
Nye, B., Konstantopoulos, S, & Hedges, L.V. (2004). How Large are Teacher Effects? Educational Evaluation and Policy Analysis, 26, 237-257.
Oakley, A. (1998). experimentation and social interventions: A forgotten but important history. British Medical Journal, 317(7176), 1239-1242
Olkin, I., & Pratt, J. W. (1958). Unbiased estimation of certain correlation coefficients. Annals of Mathematical Statistics, 29, 201-211.
Pearl and Bareinboim, Transportability across studies: A formal approach, (October 2010). Retrieved from: http://ftp.cs.ucla.edu/pub/stat_ser/r372.pdf.
Raudenbush, S. W. (2005). Learning from attempts to improve schooling: The contribution of methodological diversity. Educational Researcher, 34(5), 25-31.
Reynolds, A. J. (1992). Grade retention and school adjustment: An explanatory analysis. Educational Evaluation and Policy Analysis, 14 (2), 101–121.
45

What would it take to Change an Inference?
Robins, J., Rotnisky, A., and Scharfstein, D. (2000). Sensitivity analysis for selection bias and unmeasured confounding in missing data and causal inference models. In Hallorn, E. (Ed.), Statistical Models in Epidemiology (pp: 1-95). New York: Springer.
Roderick, M., Bryk, A. S., Jacobs, B. A., Easton, J. Q., and Allensworth, E. (1999). Ending social promotion: Results from the first two years. Chicago: Consortium on Chicago School Research.
Rosenbaum, P. R. (1986). Dropping out of high school in the United States: An observational study. Journal of Educational Statistics, 11, 207-224.
Rosenbaum, P. R. (2002). Observational studies. New York: Springer.
Rosenbaum, P. R., and Rubin, D. B. (1983). Assessing sensitivity to an unobserved binary covariate in an observational study with binary outcome. Journal of the Royal Statistical Society (Series B), 45, 212-218.
Rubin, D. B. (1974). Estimating causal effects of treatments in randomized and non_randomized studies. Journal of Educational Psychology, 66, 688-701.
1Rubin, D. B. (1986). Which ifs have causal answers? Discussion of Holland's "Statistics and causal inference.". Journal of American Statistical Association, 83, 396.
Rubin, D. B. (1990). Formal Modes of Statistical Inference for Causal Effects. Journal of Statistical Planning and Inference, 25, 279-292.
Rubin, D. B. (2004). Teaching statistical inference for causal effects in experiments and observational studies. Journal of Educational and Behavioral Statistics, 29(3), 343-368.
Saunders, William M., Marcelletti, David J. (Forthcoming). The Gap That Can't Go Away: The Catch-22 of Reclassification in Monitoring the Progress of English Learners. Educational Evaluation and Policy Analysis, Nov 2012; vol. 0: 0162373712461849
Scharfstein, D. A. I.(2002). Generalized additive selection models for the analysis of studies with potentially non-ignorable missing data. Biometrics, Vol 59, 601-613.
Schneider, B.M. Carnoy, J. Kilpatrick, W.H. Schmidt, & R.J. Shavelson. (2007). Estimating Causal Effects Using Experimental and Observational Designs. AERA, publisher's information and FREE download at <http://www.aera.net/publications/Default.aspx?menu_id=46&id=3360>.
Schweinhart, L. J., Barnes, H. V., & Weikart, D. P. (with Barnett, W. S., & Epstein, A. S.). (1993). Significant benefits: The high/scope Perry Preschool study through age 27. Ypsilanti, MI: High/Scope Press.
Shadish, W. R., Cook, T. D., and Campbell, D. T. (2002). Experimental and Quais-Experimental Designs for Generalized Causal Inference. New York: Houghton Mifflin.
46

What would it take to Change an Inference?
Shadish, W. R., Clark, M. H., & Steiner, P. M. (2008). Can nonrandomized experiments yield accurate answers? A randomized experiment comparing random to nonrandom assignment. Journal of the American Statistical Association, 103(484), 1334-1344.
Shager, Hilary M., Schindler, Holly S., Magnuson, Katherine A., Duncan, Greg J., Yoshikawa, Hirokazu, Hart, Cassandra M. D. (Forthcoming). Can Research Design Explain Variation in Head Start Research Results? A Meta-Analysis of Cognitive and Achievement Outcomes.Educational Evaluation and Policy Analysis, Nov 2012; vol. 0: 0162373712462453
Shepard, L. A., and Smith, M. L. (1989). Flunking grades. New York: Falmer Press.
Shepard, L. A., Smith, M. L., and Marion, S. F. (1998). On the success of failure: A rejoinder to Alexander. Psychology in the Schools, 35, 404-406.
Slavin, R. E. (2008). Perspectives on evidence-based research in education-what works? Issues in synthesizing educational program evaluations. Educational Researcher, 37, 5-14.
Sosa, E. (2007). A Virtue Epistemology. Oxford: Oxford University Press.
SRA/McGraw-Hill. (2001). Technical Report Performance Assessments TerraNova: Monterey, CA.
Steiner, P. M., Cook, T. D., & Shadish, W. R. (2011). On the importance of reliable covariate measurement in selection bias adjustments using propensity scores. Journal of Educational and Behavioral Statistics. vol. 36(2): 213-236.
Steiner, P. M., Cook, T. D., & Shadish, W. R., Clark, M. H. (2010). The importance of covariate selection in controlling for selection bias in observational studies. Psychological Methods, 15(3), 250-267.
Stephan, Jennifer L., Rosenbaum, James E. (Forthcoming). Can High Schools Reduce College Enrollment Gaps With a New Counseling Model? Educational Evaluation and Policy Analysis, Oct 2012; vol. 0: 0162373712462624.
Stuart, E.A., Cole, S.R., Bradshaw, C.P., and Leaf, P.J. (2011). The use of propensity scores to assess the generalizability of results from randomized trials. The Journal of the Royal Statistical Society, Series A 174(2): 369-386. PMC Journal – In progress.
Thorndike EL, and Woodworth RS. (1901).The influence of improvement in one mental function upon the efficiency of other functions. Psychological Review:8:247-61, 384-95, 553-64.
US Department of Education. (2002). Evidence Based Education. Retrieved from http://www.ed.gov/nclb/methods/whatworks/eb/edlite-index.html.
US Department of Health and Human Services. (2000). Trends in the well-being of America’s children and youth. Washington, DC.
Wainer, H. & Robinson, D.H. (2003). Shaping up the practice of null hypothesis significance testing. Educational Researcher, 32, 22-30.
47

What would it take to Change an Inference?
Wilkinson, L. and Task Force on Statistical inference (1999). Statistical methods in psychology journals: Guidelines and explanations. American Psychologist, 54, 594-604.
Winship, Christopher and Stephen L. Morgan. (1999). The Estimation of Causal Effects from Observational Data. Annual Review of Sociology 25:659-706.
Yuan, K., Le, V., McCaffrey, D.F., Marsh, J.A., Hamilton, L.S., Stecher, B.M., and Springer, M.G. (forthcoming) Incentive Pay Programs Do Not Affect Teacher Motivation or Reported Practices: Results From Three Randomized Studies. Educational Evaluation and Policy Analysis 0162373712462625, first published on November 12, 2012 as doi:10.3102/0162373712462625
48
What would it take to Change an Inference?
Endnotesi Rubin (2004) would differentiate possible outcomes using Y(1) for the treatment and Y(0) for the control, but the parenthetical expressions become awkward when part of a larger function.
Therefore, we designate treatment and control with a superscript. The use of superscripts is as in Winship and Morgan (1999).
ii Heckman (1979, page 155) also established a relationship between bias due to non-random assignment to treatment conditions and bias due to sample selection. In our terms, Heckman defines Z as depending on attributes of units. In turn, if the attributes that affect the probability of being sampled are not accounted for in estimating a treatment effect, they are omitted variables. In contrast, we characterize bias in terms of the percentage of a sample to be replaced and the expected outcomes of the replacement observations. This allows us to evaluate bias due to non-random sampling (as in 8) or bias due to non-random assignment to treatments (as in 6) using a single framework based on RCM.
iii
pooled standard deviation =
.
We then corrected for the 1 degree of freedom for the pretest to generate a value of 6.24:
6.24=6.35(48/49).iv Given our formulation, (E[Yt|Z=p] − E[Yc|Z=p´]=0), the replacement classrooms were assigned to have mean value 610.6 within each curriculum because 610.6 was the average achievement of the classrooms that were removed (the standard deviations of replacement classrooms within each curriculum were also set equal to 6.67 to reproduce the first two moments of distribution of the replaced classrooms).
v We re-express (4) in terms of 1− r#/r where r is the correlation between treatment and outcome, and r# is defined as the threshold for a statistically significant correlation coefficient. Correlations adjust for differences in scales, and r# depends only on the degrees of freedom (sample size and parameters estimated) and alpha level, not the standard error of an estimate.
The correlation was obtained from the ratio of the estimate to its standard error: ,
and the threshold was obtained using the critical value of the t distribution:
(Frank & Min, 2007). For large samples (e.g., greater than 1,000) r#/r will be equivalent to δ#/
49

What would it take to Change an Inference?
to the second decimal in most circumstances, but in small samples r#/r and δ#/ will not be
equivalent because δ is not a scalar multiple of r even though statistical inferences based on and r are identical. One could also adjust the estimated correlation for estimation bias in small samples (e.g., Olkin & Pratt, 1958). vi Hong and Raudenbush first estimated the propensity for a student to be retained using a logistic regression of retention on pretreatment personal, classroom, and school characteristics. The predicted values from this regression then became the estimated propensity scores. Hong and Raudenbush then divided their sample into fifteen strata by propensity, and then controlled for the stratum, schools as well as the individual logit of propensity in using a two level model to estimate the average effect of retention on achievement (see pages 214-218). Hong and Raudenbush (2005, Table 4) established common support in terms of balance on propensity scores. vii We separately estimated the effect of retention is about 2.2 units weaker for an increase of one standard deviation on the pretest, an interaction effect that is statistically significant but not strong enough to overwhelm the large negative effect of retention across the sample so we report only the main effect. Also, at the school level, Hong and Raudenbush conclude that “the average effect of adopting a retention policy is null or very small,” (p. 214).viii Figure 4 can also be interpreted in terms of a weighting of the data according to the frequency of occurrence in the replaced cases (shaded area) versus the original distribution (dashed line). For example, a retained student with a test score of 60 would receive a weight of about 2 because there are twice as many cases in the shaded bar than in the dashed line at 60. In general, the inference would be invalid if students who were retained and had high test scores received more weight, and students who were promoted and had low test scores received more weight. Such weights would pull the two groups closer together. Intuitively, the inference of a negative effect of retention on achievement would be invalid if the students who were retained and received high test scores counted more, and if the students who were promoted but received low test scores counted more.ix It can be also valuable to assess the bias necessary to invalidate an inference against the bias reduced by controlling for observed and well recognized covariates (Altonji et al., 2010; Frank, 2000; Rosenbaum, 1986). For example, we estimated the change in effect of kindergarten retention on achievement when including measures of a child’s emotional state and motivation after controlling for schools as fixed effects, pretests and what Altonji et al. (2010) refer to as “essential” covariates: mother’s education, two parent home, poverty level, gender, and eight racial categories (Alexander et al., 2003; Holmes, 1989; Jimerson, 2001; Shepard & Smith, 1989). The estimated retention effect dropped from of −9.394 (n=9298 using the weight C24CW0, standard error .448, R2 of .75) to −9.320 (a drop of .074) when we included measures of the child’s approaches to learning (t1learn), teacher’s and parent’s perceptions of the child’s self control (t1contro, p1contro), and the tendency to externalize problems (t2extern). x We also follow Altonji et al (2010) in assuming that the unobserved confounds are independent of the observed confounds. Any dependence would reduce the impacts of observed as well as unobserved variables on treatment estimates if all were included in a single model.
50

What would it take to Change an Inference?
xi An (forthcoming) conducts an interesting analysis of the robustness of the results to unmeasured confounders (see Ichino, 2008; as well as Harding’s 2003 adaptation of Frank, 2000).
51

What would it take to Change an Inference?
Table 1
Quantifying the Robustness of Inferences from Randomized ExperimentsStudy(author, year)
Treatment vs Control
Blocking Population Outcome Estimated effect, standard error, source
Effect size(correlation)
% bias to make the inference invalid
A multi-site cluster randomized field trial of Open Court Reading(Borman et al., 2008)
Open Court curriculum versus business as usual
Within grade and school
917 students in 49 classrooms
Terra Nova comprehensive reading score
7.95(1.83)Table 4, results for reading composite score
.16(.54)
47%
Answers and questions about class size: A statewide experiment(Finn & Achilles, 1990)
Small classes versus all others
By school 6500 students in 328 classrooms
Stanford Achievement Test, reading
13.14(2.34)Table 5mean for other classes is based on the regular and aide classes combined proportional to their sample sizes.
.23(.30)
64%
Experimental Evaluation of the Effects of a Research-based Preschool Mathematics Curriculum(Clements & Sarama, 2008)
Building Blocks research to practice curriculum versus alternate math intensive curriculum
By program type
276 children within 35 classrooms randomly sampled from volunteers within income strata
Change in Early Mathematics Childhood Assessment IRT scale score (mean=50, std=10)
3.55(1.16)Building Blocks vs comparison group Table 6 (df of 19 used based on footnote b)
.5(.60)
31%
52

What would it take to Change an Inference?
Table 2
Quantifying the Robustness of Inferences from Observational Studies
Study(author, year)
Predictor of interest
Condition on pretest
Population Outcome Estimated effect, standard error, source
Effect size(correlation)
% bias to make inference invalid
Effects of kindergarten retention policy on children’s cognitive growth in reading and mathematics(Hong & Raudenbush, 2005)
Kindergarten retention versus promotion
Multiple 7639 kindergarteners in 1080 retention schools in ECLS-K
ECLS-K Reading IRT scale score
9(.68)Table 11, model based estimate
.67(.14)
85%
Counterfactuals, causal effect heterogeneity, and the Catholic school effect on learning,(Morgan, 2001)
Catholic versus public school
Single 10835 high school students nested within 973 schools in NELS
NELS Math IRT scale score
.99(.33)Table 1, (model with pretest + family background)
.23(.10)
34%
Effects of teachers’ mathematical knowledge for teaching on student achievement(Hill et al., 2005)
Content knowledge for teacher mathematics
Gain score 1773 third graders nested within 365 teachers
Terra Nova math scale score
2.28(.75)Table 7, model 1, (third graders)
NA(.16)
36%
53

What would it take to Change an Inference?
Table B1Quantifying the Robustness of Inferences from Randomized Experiments in EEPA posted on-line July 24-Nov 15 2012Study(1st author)
Predictor of interest
Population(df)
Outcome source r % bias to make inference invalid
Multiplier to make estimate significant
Incentive Pay Programs Do Not Affect Teacher Motivation or Reported Practices(Yuan)
Pay-for performance
5th-8th grade teachers in Nashville(143)
Test Preparation
Table 3, POINT program
.250 33%
Effects of Two Scientific Inquiry Professional Development Interventions on Teaching Practice(Grigg)
Professional development for inquiry in science
4th-5th gradeClassrooms in Los Angeles(70 schools)
Inquiry used
Table 5 Model 1
.277 15%
A Randomized Controlled Trial Evaluation of Time to Read, a Volunteer Tutoring Program for 8- to 9-Year-Olds(Miller)
Time to Read (tutoring)
8-9 year old children in Northern Ireland(734)
Future aspiration
Table 5, column 1
.078 7%
Incentive Pay Programs Do Not Affect Teacher Motivation or Reported Practices(Yuan)
Pay-for performance
5th-8th grade teachers in Nashville(143)
Extra hours worked/ week
Table 3, POINT program
.077 -154% 2.53
a Degrees of freedom for calculating threshold value of r are defined at the level of the predictor of interest, subtracting the number of parameters estimated at that level. Calculations can be conducted from spreadsheet at https://www.msu.edu/~kenfrank/research.htm#causal. Studies listed in order of % robustness.
54

What would it take to Change an Inference?
Table B2
Quantifying the Robustness of Inferences from Observational Studies in EEPA posted on-line July 24-Nov 15 2012
Study(1st author)
Randomsample
Predictor of interest
Condition on pretest
Population(df)a
Outcome source r % bias to make inference invalid
Multiplier to make estimate significant
Academic Effects of Summer Instruction and Retention in New York City(Mariano)
Summer instruction and retention
RD 5th graders in New York(29,987)
English & Language Arts achievement 6th grade
Table 2, Panel 1, column 1
.029 60%
Unintended Consequences of an Algebra-for-All Policy on High-Skill Students(Nomi)
schools that increased algebraenrollment post-policy for low-ability studentsby more than 5%)
Interrupted Time Series
9th graders in Chicago(17,987)
Peer ability levels for high skill students(1999 difference for affected schools)
Table 2, column 1
.030 50%
Impact of Dual Enrollment on College Degree Attainment(An)
yes Dual enrollment NELS(8,754)
Any degree obtained
Table 1, Panel A, column 1
.043 50%
Life After Vouchers(Carlson)
Student transferred to public school
No 3rd-10th grade in Milwaukee public
Math Table 5, all students
.092 36%
55

What would it take to Change an Inference?
schools (1,120)
Teaching Students What They Already Know?(Engel)
yes Teaching practices
yes Kindergarten teachers in ECLS-K(2,174)
Math(spring of kindergarten)
Table 6, column 1
.059 28%
Unintended Consequences of an Algebra-for-All Policy on High-Skill Students(Nomi)
schools that increased algebraenrollment post-policy for low-ability studentsby more than 5%)
Interrupted Time Series
9th graders in Chicago(17,987)
9th grade math scores(1999 difference for affected schools)
Table 3, column 1
.020 26%
Can High Schools Reduce College Enrollment Gaps With a New Counseling Model?(Stephan)
Coach in school for college going
9th-12th grade schools in Chicago(54)
Applied to 3+ colleges
Table 4, column 1
.35 23%
Can Research Design Explain Variation in Head Start Research Results?(Shager)
Elements of study design
Studies of Head Start on Cognition(20)
Reported effect size
Table 4, Model 1
.524 16%
Can High Schools Reduce College Enrollment Gaps With a New Counseling
Coach in school for college going
9th-12th grade schools
Enrollment in less selective 4-yr college
Table 3, column 3
.27 2%
56

What would it take to Change an Inference?
Model?(Stephan)
in Chicago(54)
vs 2-yr
Balancing Career and Technical Education With Academic Coursework(Bozick)
Occupational courses taken in high school
Student fixed effects
ELS: 2002(7,156)
Math achievement
Table 3, column 1
.003 -617% 7.18
a Degrees of freedom for calculating threshold value of r are defined at the level of the predictor of interest, subtracting the number of parameters estimated at that level (including parameters estimated in a propensity model).
Calculations can be conducted from spreadsheet at https://www.msu.edu/~kenfrank/research.htm#causal.
Studies listed in order of % robustness.
57

What would it take to Change an Inference?
Figure Captions
Figure 1. Estimated Treatment Effects in Hypothetical Studies A and B Relative to a Threshold for Inference
Figure 2. Example Replacement of Cases from Non-Volunteer Schools to Invalidate
Inference of an Effect of the Open Court Curriculum
Figure 3. Effect of Retention on Reading Achievement in Retention Schools (from Hong
and Raudenbush, 2005, Figure 2, p. 218).
Figure 4. Example Replacement of Cases with Counterfactual Data to Invalidate
Inference of an Effect of Kindergarten Retention
58
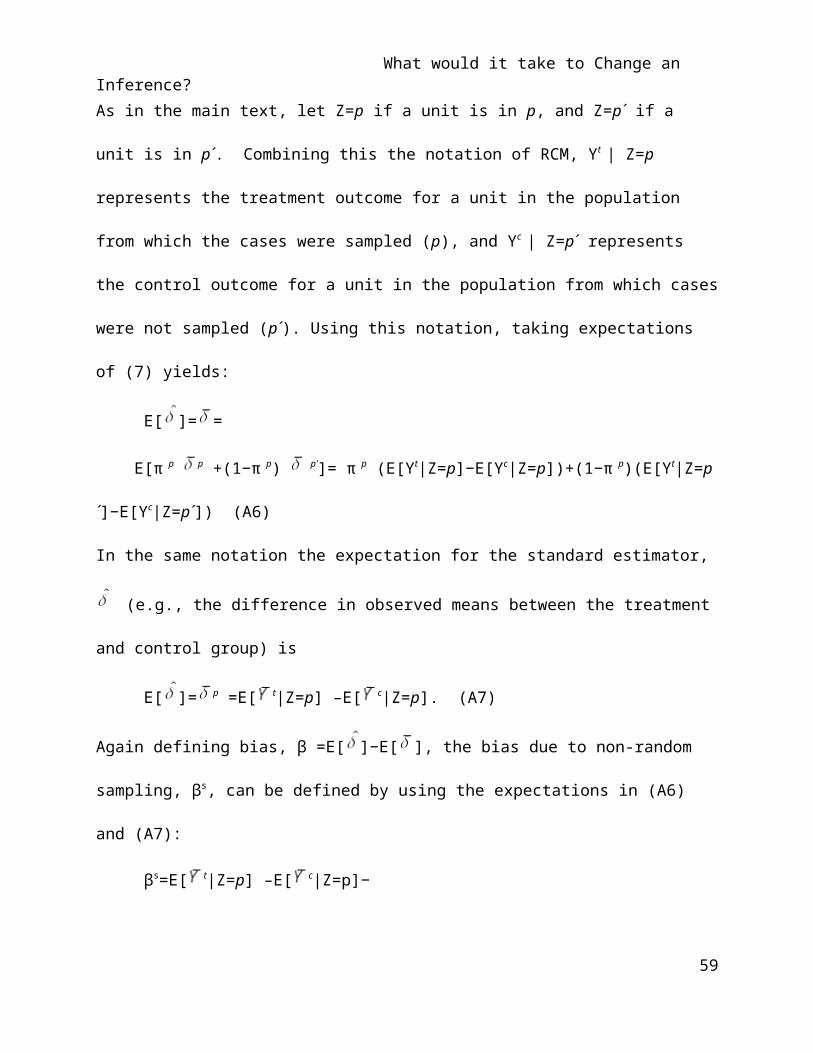
What would it take to Change an Inference?
59

What would it take to Change an Inference?
Figure 2. Example Replacement of Cases from Non-Volunteer Schools to Invalidate
Inference of an Effect of the Open Court Curriculum
60
Open CourtBusiness as Usual
Original volunteer cases that were not replacedReplacement cases from non-volunteer schoolsOriginal distribution for all volunteer cases

What would it take to Change an Inference?
Figure 3. Effect of Retention on Reading Achievement in Retention Schools (from Hong
and Raudenbush, 2005, Figure 2, p. 218).
61
0
10
20
30
40
50
60
70
Fall, K Spring, K Spring, 1st Fall, 1st
Round of assessment
Rea
ding
scal
e sc
ore
17.8
23.78 24.41
34.3
26
39.96
57.57
45.78
36.77
Promoted observed Retained observed Retained counterfactual
What would it take to Change an Inference?
Figure 4. Example Replacement of Cases with Counterfactual Data to Invalidate
Inference of an Effect of Kindergarten Retention
62
Original cases that were not replacedReplacement counterfactual cases
Original distribution
Retained Promoted
Related Documents


