OHM-ADVISORS.COM Quantifying Climate Change for Stormwater / Wastewater Collection Systems Charles Humphriss OHM Advisors MWEA Conference December 3, 2014 ARCHITECTS. ENGINEERS. PLANNERS.

Welcome message from author
This document is posted to help you gain knowledge. Please leave a comment to let me know what you think about it! Share it to your friends and learn new things together.
Transcript

OHM-ADVISORS.COM
Quantifying Climate Change for
Stormwater / Wastewater
Collection Systems
Charles Humphriss
OHM Advisors
MWEA Conference
December 3, 2014
ARCHITECTS. ENGINEERS. PLANNERS.

• Long design life of infrastructure
• Increasing precipitation
observed across the Midwest
• Models predict increases in both
average and extreme rainfall
• Statistics are changing
OHM-ADVISORS.COM ARCHITECTS. ENGINEERS. PLANNERS.
Motivation

• We state that the ‘design life’ is 50
years, BUT:
• Minneapolis, MN: Average pipe age is 80
years
• Minnesota: One third of state’s sewers are
older than 50 years
• Philadelphia, PA: Average age of sewers is
100 years, with some pipes as old as 190
years
• Philadelphia, PA: Wastewater sewer planned
replacement rate: 100-120 years
• New Jersey: Average age of sewers is 70
years
OHM-ADVISORS.COM ARCHITECTS. ENGINEERS. PLANNERS.
How Long will it Last?
• Rehabilitating sewers increases life
expectancy, BUT:
• Pipe lining typically results in a smaller effective
diameter
• Rehabilitated pipe can have a reduced flow
capacity
• We should assume that the pipe we
design will be in service 80-100 years
from now.
OHM-ADVISORS.COM ARCHITECTS. ENGINEERS. PLANNERS.
How Long will it Last?

OHM-ADVISORS.COM ARCHITECTS. ENGINEERS. PLANNERS.
Predicted Changes in
Average Precipitation
• 1986-2005 data compared to 2081-2100 multi-model mean
• 10-20% increase in Great Lakes Region
• IPCC Summary for Policy Makers

OHM-ADVISORS.COM ARCHITECTS. ENGINEERS. PLANNERS.
Predicted Changes in
Average Precipitation
• 1986-2005 data compared to 2081-2100 multi-model mean
• 10-20% increase in Great Lakes Region
• IPCC Summary for Policy Makers

OHM-ADVISORS.COM ARCHITECTS. ENGINEERS. PLANNERS.
Average Precipitation
Predicted to Increase
• National Climate
Assessment, US
Global Change
Research Program
• Total Annual
Average Rainfall:
1971-2000 vs 2041-
2070 with continued
emissions scenario
OHM-ADVISORS.COM ARCHITECTS. ENGINEERS. PLANNERS.
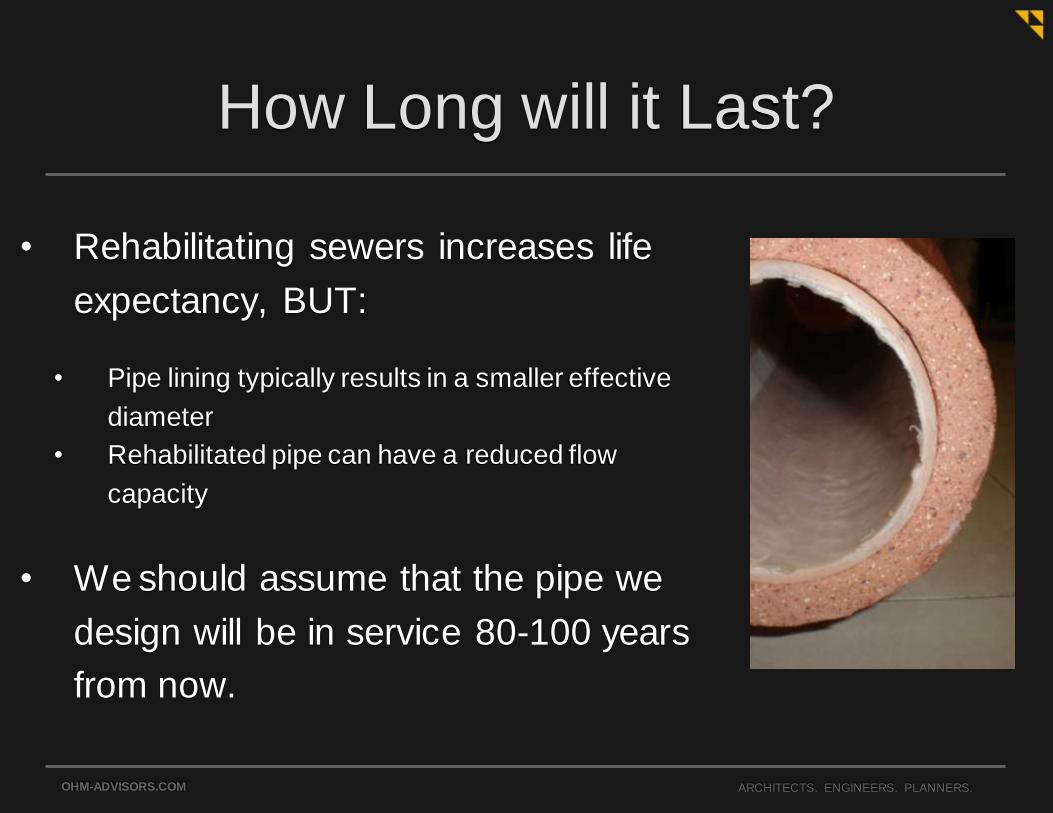
Heavy Precipitation Days
Predicted to Increase
• National Climate
Assessment, US
Global Change
Research Program
• Top 2% of all rainfalls
each year
• 1971-2000 vs 2041-
2070 with continued
emissions scenario

OHM-ADVISORS.COM ARCHITECTS. ENGINEERS. PLANNERS.
Heavy Precipitation Days
Predicted to Increase
• National Climate
Assessment, US
Global Change
Research Program
• Top 2% of all rainfalls
each year
• 1971-2000 vs 2041-
2070 with continued
emissions scenario

OHM-ADVISORS.COM ARCHITECTS. ENGINEERS. PLANNERS.
Observed Changes in Very
Heavy Precipitation
• National Climate
Assessment
• Heaviest 1% of
all observed daily
events from
1958-2012
• Midwest outside
range of natural
variability

OHM-ADVISORS.COM ARCHITECTS. ENGINEERS. PLANNERS.
Recent Rainfall Statistics
• NOAA Atlas 14
• More recent set of
rainfall statistics
(through 2012)
• Previous sources
(TP40 and Bulletin
71) are at least 20-50
years out of date
Source: NOAA Atlas 14, Volume 8 (2013)
Percent difference between NOAA Atlas 14 and TP40
for the 100-yr 24-hr rainfall

3.0
3.5
4.0
4.5
5.0
5.5
6.0
100-yr 24-hr
100-yr 3-hr 2.0
2.5
3.0
3.5
4.0
↑ 24%
↑ 38%
3.0
3.5
4.0
4.5
5.0
NO
AA
Atl
as
14
TP
40
Bu
lleti
n 7
1
LEGEND

10-yr 2-hr
100-yr 3-hr
↑ 26%
2.0
2.5
3.0
3.5
4.0
1.6
1.7
1.8
1.9
2.0
2.1 ↑ 14%
3.0
3.5
4.0
4.5
5.0
NO
AA
Atl
as
14
TP
40
Bu
lleti
n 7
1
LEGEND

2.0
2.5
3.0
3.5
4.0
1.6
1.7
1.8
1.9
2.0
10-yr 2-hr
100-yr 3-hr
↑ 40%
↑ 11%
3.0
3.5
4.0
4.5
5.0
NO
AA
Atl
as
14
TP
40
Bu
lleti
n 7
1
LEGEND

2.5
3.0
3.5
4.0
1.7
1.8
1.9
2.0
2.1
10-yr 2-hr
100-yr 3-hr
↑ 22%
↑ 11%
3.0
3.5
4.0
4.5
5.0
NO
AA
Atl
as
14
TP
40
Bu
lleti
n 7
1
LEGEND

OHM-ADVISORS.COM ARCHITECTS. ENGINEERS. PLANNERS.
Comparing Statistics
• August 11-12, 2014
• Catastrophic rainfall
event in Metro Detroit
• Local press coverage
categorized this as a
100-yr + storm
• However, using recent
statistics shows us it
wasn’t as rare as we
thought

OHM-ADVISORS.COM ARCHITECTS. ENGINEERS. PLANNERS.
Comparing Statistics
City
Peak 3-hour
rainfall (in.) TP 40 Bulletin 71 NOAA Atlas 14Exceedance
Interval
Garden City 2.89 63 >100 28 25-yr to 50-yr
Detroit (west fringe) 3.21 >100 >100 48 50-yr to 75-yr
Romulus 2.84 56 >100 28 75-yr to 100-yr
Westland 2.91 66 >100 29 >100 yr
August 11-12, 2014 Rainfall Event
Exceedance Interval (years) Key

OHM-ADVISORS.COM ARCHITECTS. ENGINEERS. PLANNERS.
Comparing Statistics
City
Peak 6-hour
rainfall (in.) TP 40 Bulletin 71 NOAA Atlas 14Exceedance
Interval
Garden City 3.49 79 >100 37 25-yr to 50-yr
Detroit (west fringe) 3.59 91 >100 43 50-yr to 75-yr
Romulus 3.65 98 >100 48 75-yr to 100-yr
Westland 3.49 79 >100 36 >100 yr
Exceedance Interval (years) Key
August 11-12, 2014 Rainfall Event

OHM-ADVISORS.COM ARCHITECTS. ENGINEERS. PLANNERS.
Comparing Statistics
City
Peak 12-hour
rainfall (in.) TP 40 Bulletin 71 NOAA Atlas 14Exceedance
Interval
Garden City 3.91 68 >100 30 25-yr to 50-yr
Detroit (west fringe) 4.24 93 >100 36 50-yr to 75-yr
Romulus 4.03 77 >100 28 75-yr to 100-yr
Westland 3.94 70 >100 23 >100 yr
August 11-12, 2014 Rainfall Event
Exceedance Interval (years) Key

• Climate data based on past statistics only and are not forward-looking
• Flow rates and pipe sizes dependent on selection of climate
data
• Need new tools to address future climate patterns
OHM-ADVISORS.COM ARCHITECTS. ENGINEERS. PLANNERS.
Uncertainty in Design
?

• Several Independent Methods:
EPA Stormwater Calculator
Updating Rainfall Statistics
Comparing Biases in Flow Data
Confidence Intervals
OHM-ADVISORS.COM ARCHITECTS. ENGINEERS. PLANNERS.
Tools for Addressing Climate Trends

OHM-ADVISORS.COM ARCHITECTS. ENGINEERS. PLANNERS.
Frequency Analysis
• Annual maxima determined with historical data
available from NOAA
• Plot Annual Max vs Probability
• Use Log-Pearson Type III Statistical Distribution to fit
data – Commonly accepted method in hydrologic
community
• Method also used in USGS Streamflow calculations

OHM-ADVISORS.COM ARCHITECTS. ENGINEERS. PLANNERS.
Frequency Analysis Example
Plot Data

OHM-ADVISORS.COM ARCHITECTS. ENGINEERS. PLANNERS.
Frequency Analysis Example
Probability
Axis is Log
Scale

OHM-ADVISORS.COM ARCHITECTS. ENGINEERS. PLANNERS.
Frequency Analysis Example
Calculate Log
Pearson Type
III Distribution

OHM-ADVISORS.COM ARCHITECTS. ENGINEERS. PLANNERS.
Frequency Analysis Example
Add 95%
Confidence
Intervals

OHM-ADVISORS.COM ARCHITECTS. ENGINEERS. PLANNERS.
Frequency Analysis Example
Determine Storm
Statistics:
10-yr storm = 1.64 in

• Historical data for Detroit City Airport available for 1949-2012
• Comparison of Annual Maxima between 1949-2012 and 1990-
2012
• 1 hour and 24 hour storms
• Increase in rainfall depths
• 7.4% increase for 10 year, 24 hour storm
• 10.2% increase for 10 year, 1 hour storm
OHM-ADVISORS.COM ARCHITECTS. ENGINEERS. PLANNERS.
Updating Rainfall Statistics

OHM-ADVISORS.COM ARCHITECTS. ENGINEERS. PLANNERS.
Updating Rainfall Statistics

OHM-ADVISORS.COM ARCHITECTS. ENGINEERS. PLANNERS.
Updating Rainfall Statistics

OHM-ADVISORS.COM ARCHITECTS. ENGINEERS. PLANNERS.
Updating Rainfall Statistics
7.4% increase
for 10-yr storm

OHM-ADVISORS.COM ARCHITECTS. ENGINEERS. PLANNERS.
Updating Rainfall Statistics

OHM-ADVISORS.COM ARCHITECTS. ENGINEERS. PLANNERS.
Updating Rainfall Statistics
10.2%
increase

OHM-ADVISORS.COM ARCHITECTS. ENGINEERS. PLANNERS.
EPA Stormwater Calculator
http://www2.epa.gov/water-research/national-stormwater-calculator
Estimates annual
amount of
rainwater &
frequency of
runoff from a
specific site based
on local soil
conditions, land
cover, and historic
rainfall records.

OHM-ADVISORS.COM ARCHITECTS. ENGINEERS. PLANNERS.
EPA Stormwater Calculator:
Climate Change Options
http://www2.epa.gov/water-research/national-stormwater-calculator
• Scenarios:
Hot/Dry
Median Change
Warm/Wet
• Time Period:
Near Term
(2020-2049)
Far Term
(2045-2074)

OHM-ADVISORS.COM ARCHITECTS. ENGINEERS. PLANNERS.
EPA Stormwater Calculator:
Climate Change Options
http://www2.epa.gov/water-research/national-stormwater-calculator
• Scenarios:
Hot/Dry
Median Change
Warm/Wet
• Time Period:
Near Term
(2020-2049)
Far Term
(2045-2074)
Warm/Wet
Scenario =
Higher Average
Rainfall

OHM-ADVISORS.COM ARCHITECTS. ENGINEERS. PLANNERS.
EPA Stormwater Calculator:
Climate Change Options
http://www2.epa.gov/water-research/national-stormwater-calculator
• Scenarios:
Hot/Dry
Median Change
Warm/Wet
• Time Period:
Near Term
(2020-2049)
Far Term
(2045-2074)
Hot/Dry
Scenario =
Larger Extreme
Storms

OHM-ADVISORS.COM ARCHITECTS. ENGINEERS. PLANNERS.
EPA Stormwater Calculator:
Ann Arbor Example
http://www2.epa.gov/water-research/national-stormwater-calculator
Applying
Rainfall
generated
to a
Sanitary
Sewer
Analysis

OHM-ADVISORS.COM ARCHITECTS. ENGINEERS. PLANNERS.
EPA Stormwater Calculator:
Ann Arbor Example
http://www2.epa.gov/water-research/national-stormwater-calculator
Far Term
(2045-2074)
Warm/Wet
Scenario

OHM-ADVISORS.COM ARCHITECTS. ENGINEERS. PLANNERS.
EPA Stormwater Calculator:
Ann Arbor Example

OHM-ADVISORS.COM ARCHITECTS. ENGINEERS. PLANNERS.
EPA Stormwater Calculator:
Ann Arbor Example
Perform
Frequency
Analysis
using
Hydrologic
Model
Output and
60 years of
historic rain
data

OHM-ADVISORS.COM ARCHITECTS. ENGINEERS. PLANNERS.
EPA Stormwater Calculator:
Ann Arbor Example
Perform
Frequency
Analysis
using
Hydrologic
Model
Output and
60 years of
hourly
historic rain
data

OHM-ADVISORS.COM ARCHITECTS. ENGINEERS. PLANNERS.
EPA Stormwater Calculator:
Ann Arbor Example
Perform a
second
Frequency
Analysis using
Hydrologic
Model Output
and 60 years
of hourly rain
data scaled
monthly using
output from
EPA’s SW
Calculator

OHM-ADVISORS.COM ARCHITECTS. ENGINEERS. PLANNERS.
EPA Stormwater Calculator:
Ann Arbor Example
Perform a
second
Frequency
Analysis using
Hydrologic
Model Output
and 60 years
of hourly rain
data scaled
monthly using
output from
EPA’s SW
Calculator

OHM-ADVISORS.COM ARCHITECTS. ENGINEERS. PLANNERS.
EPA Stormwater Calculator:
Ann Arbor Example • In Ann Arbor, there were 20 districts each with different changes to frequency
flows due to climate change.
• Use average of downstream meters to quantify system wide peak flow changes.
• Consider a 10% increase in peak flows to account for climate change.
14.3% 8.6%
7.0% 11.4%
11.1%
Overall
Increase
= 10.4%
25 year Frequency Analysis Comparison

OHM-ADVISORS.COM ARCHITECTS. ENGINEERS. PLANNERS.
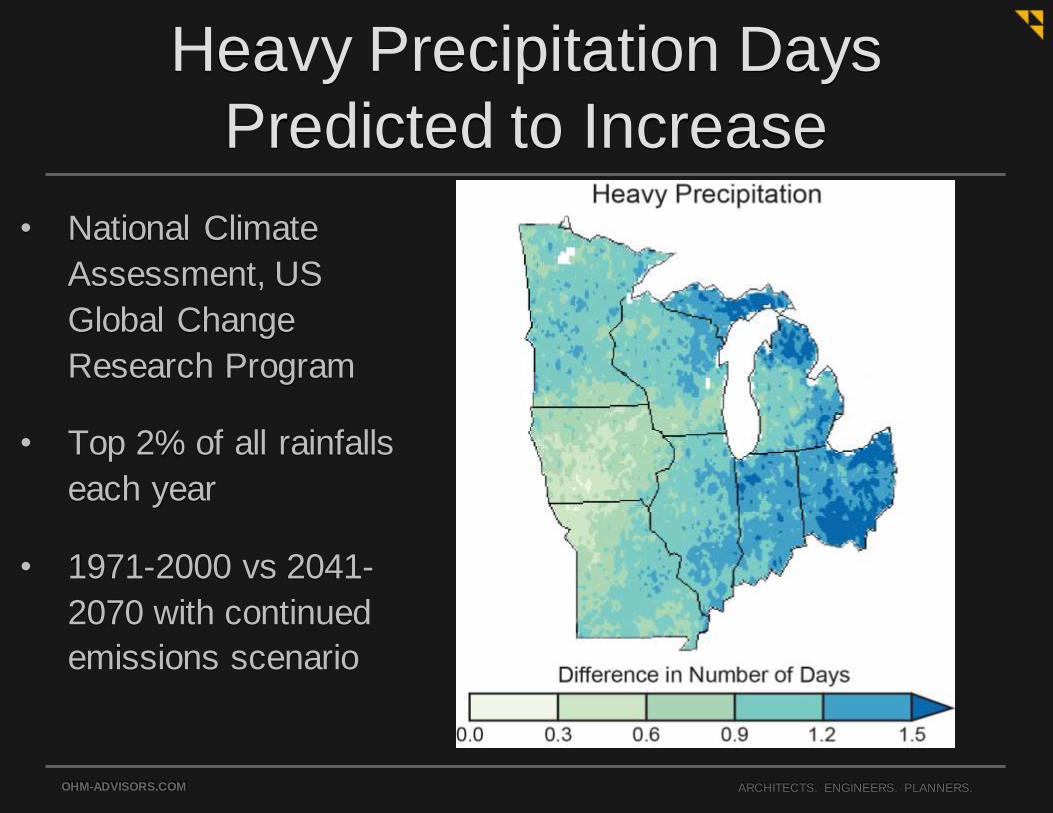
NOAA Atlas 14
Confidence Intervals
http://www.nws.noaa.gov/oh/hdsc/index.html
• Frequency estimates for Detroit, MI
• 90% confidence
intervals given • Upper bounds
are 20% higher than average
• Lower bounds are 13.3% lower than average
OHM-ADVISORS.COM ARCHITECTS. ENGINEERS. PLANNERS.
NOAA Atlas 14
Confidence Intervals
http://www.nws.noaa.gov/oh/hdsc/index.html
In many cases, you can increase the duration while staying within the confidence interval

OHM-ADVISORS.COM ARCHITECTS. ENGINEERS. PLANNERS.
Confidence Intervals
• 90% probability of observing a value within the
range
• Justifies use of a value closer to the upper
limit
• All methods show an increase in precipitation
values so use a value towards the upper
bound of the confidence interval

OHM-ADVISORS.COM ARCHITECTS. ENGINEERS. PLANNERS.
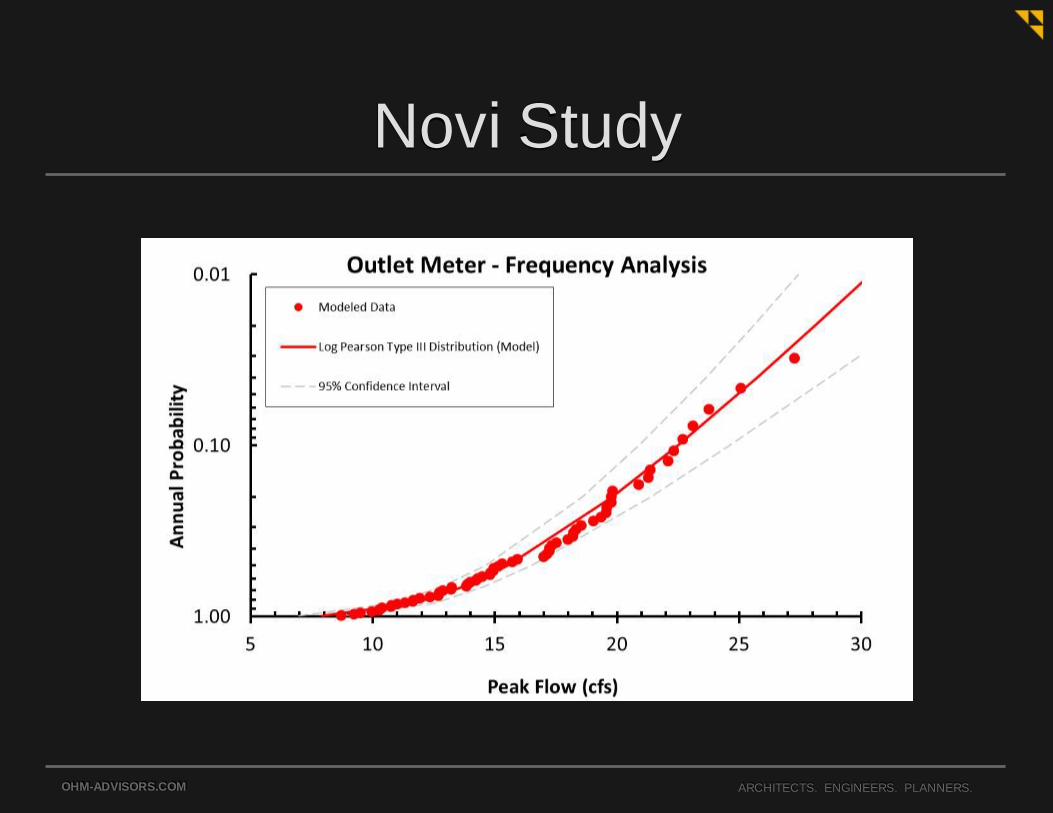
Novi Study
• Results of a 2014 sanitary sewer capacity study for the City of
Novi indicated increased heavy precipitation in recent years.
• Hydrologic model was calibrated and validated using 15 years
(2000-2014) local rain data and outlet meter flow data.
• Long-term flow simulation was performed using 64 years of
NOAA rain data from nearby Detroit City Airport.
• 10-year frequency flow based on most recent NOAA rain data
was significantly larger than that based on all 64 years of
NOAA rain data.
OHM-ADVISORS.COM ARCHITECTS. ENGINEERS. PLANNERS.
Novi Study

OHM-ADVISORS.COM ARCHITECTS. ENGINEERS. PLANNERS.
Novi Study

OHM-ADVISORS.COM ARCHITECTS. ENGINEERS. PLANNERS.
Novi Study
10-year flow = 22.5 cfs
based on running all 64
years (1949-2012) of
rainfall through model

OHM-ADVISORS.COM ARCHITECTS. ENGINEERS. PLANNERS.
Novi Study

OHM-ADVISORS.COM ARCHITECTS. ENGINEERS. PLANNERS.
Novi Study
22.5 cfs = 10-year flow
based on running 1949-
2012 rain data through
model
24.1 cfs = 10-year flow
based on running 2000-
2012 rain data through
model
7% increase

• Recent statistics indicate rainfall depths for design storms have been increasing in Michigan
• Climate models project further increases in rainfall depth for future storms
• Tools are available to account for higher rainfall for design purposes
• Tools provide a basis for increasing future design flows ~10% above existing
OHM-ADVISORS.COM ARCHITECTS. ENGINEERS. PLANNERS.
Conclusions
Related Documents