Quantification of ultrasonic texture intra-heterogeneity via volumetric stochastic modeling for tissue characterization Omar S. Al-Kadi a,b,⇑ , Daniel Y.F. Chung a , Robert C. Carlisle a , Constantin C. Coussios a , J. Alison Noble a a Institute of Biomedical Engineering, Department of Engineering Science, University of Oxford, Oxford OX3 7DQ, United Kingdom b King Abdullah II School for Information Technology, University of Jordan, Amman 11942, Jordan article info Article history: Received 31 July 2014 Received in revised form 11 November 2014 Accepted 13 December 2014 Available online 27 December 2014 Keywords: Texture analysis Fractal dimension Tumor characterization Nakagami modeling Ultrasound imaging abstract Intensity variations in image texture can provide powerful quantitative information about physical prop- erties of biological tissue. However, tissue patterns can vary according to the utilized imaging system and are intrinsically correlated to the scale of analysis. In the case of ultrasound, the Nakagami distribution is a general model of the ultrasonic backscattering envelope under various scattering conditions and den- sities where it can be employed for characterizing image texture, but the subtle intra-heterogeneities within a given mass are difficult to capture via this model as it works at a single spatial scale. This paper proposes a locally adaptive 3D multi-resolution Nakagami-based fractal feature descriptor that extends Nakagami-based texture analysis to accommodate subtle speckle spatial frequency tissue intensity var- iability in volumetric scans. Local textural fractal descriptors – which are invariant to affine intensity changes – are extracted from volumetric patches at different spatial resolutions from voxel lattice-based generated shape and scale Nakagami parameters. Using ultrasound radio-frequency datasets we found that after applying an adaptive fractal decomposition label transfer approach on top of the generated Nakagami voxels, tissue characterization results were superior to the state of art. Experimental results on real 3D ultrasonic pre-clinical and clinical datasets suggest that describing tumor intra-heterogeneity via this descriptor may facilitate improved prediction of therapy response and disease characterization. Ó 2014 The Authors. Published by Elsevier B.V. This is an open access article under the CC BY license (http://creativecommons.org/licenses/by/4.0/). 1. Introduction Analysis of the local characteristic patterns of tissue texture can reveal subtle pathological features deemed important for clinical diagnosis. Spatial variation of textons quantified in terms of image ‘‘surface roughness’’ has been shown to reflect tumor functional heterogeneity, and to lead to a better understanding of disease state (Bae et al., 2013; Chicklore et al., 2013; Davnall et al., 2012; Al-Kadi and Watson, 2008). However, sub-voxel resolution com- plex and higher order textural features can be difficult to discern by simple observation. These texture signatures may convey signif- icant information about disease progression or regression. How- ever, quantifying these subtle signatures in ultrasound images is challenging. Our motivation stems from a clinical need to improve the diag- nosis and therapy of liver cancer. Approximately 100,000 patients are diagnosed each year with primary liver cancers in the United States and Europe (Cancer Research UK, 2014; American Cancer Society, 2014). When this is compared against worldwide statis- tics, liver cancer is even more common in developing countries (World Health Organization: International Agency for Research on Cancer, 2012). Although it the sixth most common cancer in the world (Ferlay et al., 2013), incidence varies across the world, and it is the most cancer type in some developing countries (Parkin et al., 2014). Surgery is considered the only curative treat- ment; however, this is not suitable in the majority of cases due to co-morbidity, extent or location of the cancer, with chemotherapy forming the mainstay of treatment in these patients. Chemother- apy can have significant side effects, and may not be effective in all cases. Development of monitoring techniques during the course of chemotherapy may permit dose adjustment in responders to minimize side effects, while alternative treatments could be offered to non-responders. Current monitoring techniques rely on computed tomography and magnetic resonance imaging, with fre- quency limited by the potential damage from ionizing radiation and cost consideration respectively. Despite the difficulties of using ultrasound for monitoring disease (e.g. operator dependent, poorly reproducible and non-standardize), it is a technique that is known to be rapid, relatively inexpensive, readily available, with http://dx.doi.org/10.1016/j.media.2014.12.004 1361-8415/Ó 2014 The Authors. Published by Elsevier B.V. This is an open access article under the CC BY license (http://creativecommons.org/licenses/by/4.0/). ⇑ Corresponding author at: Institute of Biomedical Engineering, Department of Engineering Science, University of Oxford, Oxford OX3 7DQ, United Kingdom. E-mail address: [email protected] (O.S. Al-Kadi). Medical Image Analysis 21 (2015) 59–71 Contents lists available at ScienceDirect Medical Image Analysis journal homepage: www.elsevier.com/locate/media

Welcome message from author
This document is posted to help you gain knowledge. Please leave a comment to let me know what you think about it! Share it to your friends and learn new things together.
Transcript
Medical Image Analysis 21 (2015) 59–71
Contents lists available at ScienceDirect
Medical Image Analysis
journal homepage: www.elsevier .com/locate /media
Quantification of ultrasonic texture intra-heterogeneity via volumetricstochastic modeling for tissue characterization
http://dx.doi.org/10.1016/j.media.2014.12.0041361-8415/� 2014 The Authors. Published by Elsevier B.V.This is an open access article under the CC BY license (http://creativecommons.org/licenses/by/4.0/).
⇑ Corresponding author at: Institute of Biomedical Engineering, Department ofEngineering Science, University of Oxford, Oxford OX3 7DQ, United Kingdom.
E-mail address: [email protected] (O.S. Al-Kadi).
Omar S. Al-Kadi a,b,⇑, Daniel Y.F. Chung a, Robert C. Carlisle a, Constantin C. Coussios a, J. Alison Noble a
a Institute of Biomedical Engineering, Department of Engineering Science, University of Oxford, Oxford OX3 7DQ, United Kingdomb King Abdullah II School for Information Technology, University of Jordan, Amman 11942, Jordan
a r t i c l e i n f o a b s t r a c t
Article history:Received 31 July 2014Received in revised form 11 November 2014Accepted 13 December 2014Available online 27 December 2014
Keywords:Texture analysisFractal dimensionTumor characterizationNakagami modelingUltrasound imaging
Intensity variations in image texture can provide powerful quantitative information about physical prop-erties of biological tissue. However, tissue patterns can vary according to the utilized imaging system andare intrinsically correlated to the scale of analysis. In the case of ultrasound, the Nakagami distribution isa general model of the ultrasonic backscattering envelope under various scattering conditions and den-sities where it can be employed for characterizing image texture, but the subtle intra-heterogeneitieswithin a given mass are difficult to capture via this model as it works at a single spatial scale. This paperproposes a locally adaptive 3D multi-resolution Nakagami-based fractal feature descriptor that extendsNakagami-based texture analysis to accommodate subtle speckle spatial frequency tissue intensity var-iability in volumetric scans. Local textural fractal descriptors – which are invariant to affine intensitychanges – are extracted from volumetric patches at different spatial resolutions from voxel lattice-basedgenerated shape and scale Nakagami parameters. Using ultrasound radio-frequency datasets we foundthat after applying an adaptive fractal decomposition label transfer approach on top of the generatedNakagami voxels, tissue characterization results were superior to the state of art. Experimental resultson real 3D ultrasonic pre-clinical and clinical datasets suggest that describing tumor intra-heterogeneityvia this descriptor may facilitate improved prediction of therapy response and disease characterization.
� 2014 The Authors. Published by Elsevier B.V. This is an open access article under the CC BY license(http://creativecommons.org/licenses/by/4.0/).
1. Introduction
Analysis of the local characteristic patterns of tissue texture canreveal subtle pathological features deemed important for clinicaldiagnosis. Spatial variation of textons quantified in terms of image‘‘surface roughness’’ has been shown to reflect tumor functionalheterogeneity, and to lead to a better understanding of diseasestate (Bae et al., 2013; Chicklore et al., 2013; Davnall et al., 2012;Al-Kadi and Watson, 2008). However, sub-voxel resolution com-plex and higher order textural features can be difficult to discernby simple observation. These texture signatures may convey signif-icant information about disease progression or regression. How-ever, quantifying these subtle signatures in ultrasound images ischallenging.
Our motivation stems from a clinical need to improve the diag-nosis and therapy of liver cancer. Approximately 100,000 patientsare diagnosed each year with primary liver cancers in the United
States and Europe (Cancer Research UK, 2014; American CancerSociety, 2014). When this is compared against worldwide statis-tics, liver cancer is even more common in developing countries(World Health Organization: International Agency for Researchon Cancer, 2012). Although it the sixth most common cancer inthe world (Ferlay et al., 2013), incidence varies across the world,and it is the most cancer type in some developing countries(Parkin et al., 2014). Surgery is considered the only curative treat-ment; however, this is not suitable in the majority of cases due toco-morbidity, extent or location of the cancer, with chemotherapyforming the mainstay of treatment in these patients. Chemother-apy can have significant side effects, and may not be effective inall cases. Development of monitoring techniques during the courseof chemotherapy may permit dose adjustment in responders tominimize side effects, while alternative treatments could beoffered to non-responders. Current monitoring techniques rely oncomputed tomography and magnetic resonance imaging, with fre-quency limited by the potential damage from ionizing radiationand cost consideration respectively. Despite the difficulties ofusing ultrasound for monitoring disease (e.g. operator dependent,poorly reproducible and non-standardize), it is a technique thatis known to be rapid, relatively inexpensive, readily available, with
60 O.S. Al-Kadi et al. / Medical Image Analysis 21 (2015) 59–71
no exposure to ionizing radiation, making it ideal for frequentmonitoring of liver tumors during a course of treatment.
Given the advantages of ultrasound, analyzing tissue specklefrom a single resolution perspective is limiting, as substantialinformation that could assist tumor tissue characterization canbe hidden at sub-voxel resolution. This is true for the smallernecrotic or functionally low-activity regions that exhibit a hypere-chogenic appearance compared to healthy tissue (Ueta et al.,2011). We hypothesize that the difference in echogenicity of thetumor speckle texture can be exploited as an indicator of diseaseresponsiveness to treatment (Czarnota et al., 2013). Nevertheless,the functionally low-activity regions within the tumor textureare relatively small, especially in the early sessions of tumor che-motherapy treatment. They also tend to have low intensitycontrast compared to the aggressive or functionally activebackground of the remaining tumor. Identification of subtlechanges in these regions based on visual assessment of theintensity alone can be challenging.
Our approach is motivated by four observations:
� Tumors are heterogeneous: most previous work has accountedfor functionally active malignant regions rather than theperipheral low activity necrotic regions which may additionallyprovide key information on disease progression or regression.These subtle variations and deviations within the speckle tissuetexture were deemed too chaotic to be characterized in Larrueand Noble (2014), but are important for understanding diseasestate.� Heterogeneity suggests using a multi-resolution texture analysis: a
carefully designed multi-resolution approach which is visuallydiscriminative and geometrically informative could reveal smallspeckle changes and is better suited to describe the mixture dis-tribution complexity that underpins a heterogeneity model.� Fractal analysis is well-suited to this problem: conventional
energy-based wavelet decompositions are susceptible to localintensity distribution variations; the fractal signatures used in
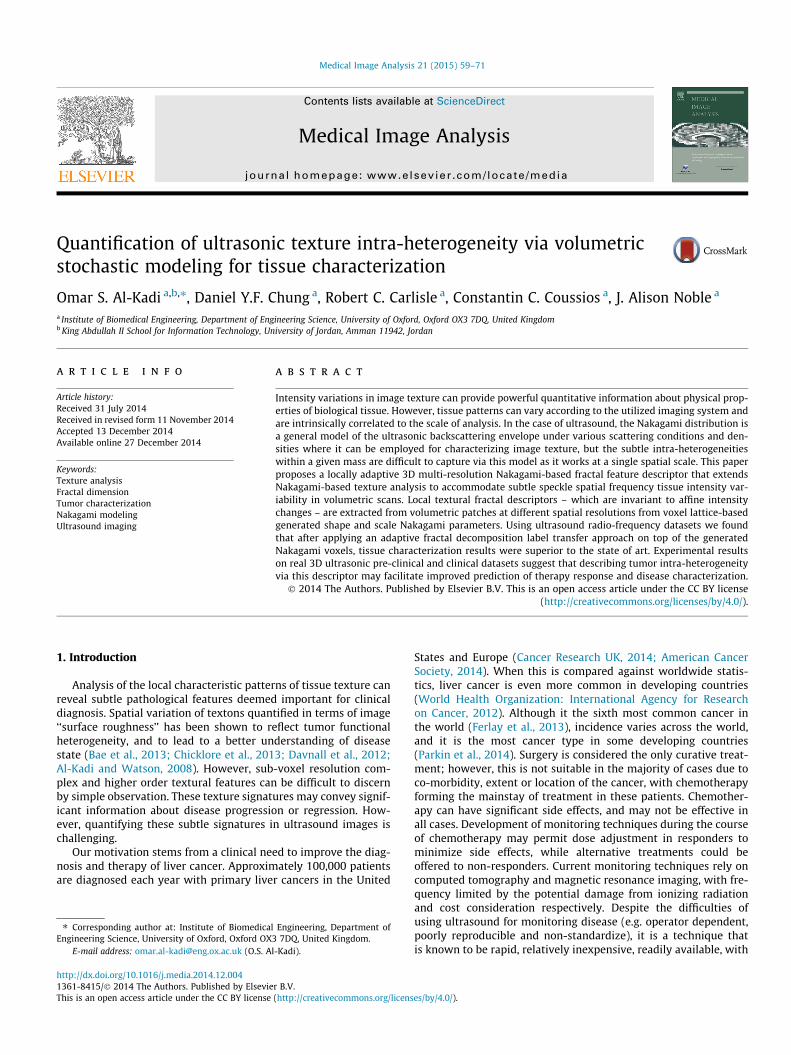
Fig. 1. 3D multifractal Nakagami feature descriptor algorithm design
our approach, derived from the wavelet representation sub-bands related to physiological properties of texture surfaceroughness are not; finally.� Analysis should be three-dimensional: performing a 3D texture
analysis based on a volumetric Nakagami modeling could facil-itate a more reliable estimate of the Nakagami parameters,where the 3D location of each voxel provides a better localiza-tion of speckle distribution mixtures.
In this work, a novel multifractal Nakagami-based volumetricfeature descriptor that is invariant to local speckle attenuationchanges is proposed. A pipeline summarizing the stages of ourapproach is illustrated in Fig. 1. It is postulated that fractal tissuecharacteristics locally derived from 3D textural tumor patterns atseveral scales and from the RF envelope of the ultrasound back-scattered volumes can assist in attaining descriptive features thatrelate to underlying biological structure. These tissue textural frac-tal characteristics tend to change in cases of therapeutic response,providing an attractive indicator for disease response to treatmentduring chemotherapy.
This paper is organized as follows. State of the art and chal-lenges associated with characterizing speckle tissue texture heter-ogeneity are summarized in Sections 2 and 3, followed by adetailed explanation of the proposed 3D multifractal Nakagami-based feature descriptor in Section 4. Sections 5 and 6 presentthe experimental results and discuss the potential significance ofthe work. The paper concludes in Section 7.
2. Related work
One of the effective statistical techniques used for modelingvarious backscattering conditions in medical ultrasound is theNakagami distribution. This probabilistic distribution is knownfor its analytical simplicity and effective modeling of dense scatter-ers, accounting for amplitude and spacing, and can be reduced to aRayleigh distribution under certain assumptions of scatterer
for ultrasonic tissue characterization introduced in this paper.
O.S. Al-Kadi et al. / Medical Image Analysis 21 (2015) 59–71 61
density and number (Shankar, 2000). Shankar et al. first proposedthe Nakagami distribution for characterizing conditions rangingfrom pre- to post-Rayleigh existing in ultrasound images, and laterfor modeling the radio-frequency (RF) envelope of the ultrasoundbackscattered signal in characterizing B-mode breast masses(Shankar et al., 2001). Others have attempted to tackle the issueof accurate estimation of the Nakagami distribution. For instance(Larrue and Noble, 2011) employed Gamma kernel density estima-tion to compute a smooth estimate of a distribution within smallwindows of B-mode ultrasound images, but the mixture of distri-butions occurring at the boundaries between structures was notaccounted for. The impact of morphological parameters and tumorstructures on the Nakagami parameters statistics were analyzed inLarrue and Noble (2014). A limitation observed was that there wasa need for a robust algorithm to compute the Nakagami parametricimages that better delineate the structures and the context in andaround the tumor. Characterizing homogeneous tissues viaimproving the smoothness of the Nakagami parametric imageswas shown in Tsui et al. (2014). The technique relies on summingand averaging the Nakagami images formed using sliding windowswith varying window sizes related to the transducer pulse length.However, a relatively large window size (required for stabilization)may affect the reliability of the estimated Nakagami parameters,and hence degrade the spatial resolution of the resulting Nakagamiimage.
The Nakagami distribution has been further employed as animage feature in various image analysis contexts. For instance, fivecontour features and the two Nakagami parameters were used forclassification of benign and malignant breast tumors in Tsui et al.(2010). In a subsequent work malignant tumors were shown tobe more pre-Rayleigh distributed than those from benign counter-parts (Tsui et al., 2010); however, the calculation of the averageintensity value in the Nakagami image makes it susceptible to spa-tial frequency intensity variability. Further, that particular tech-nique was optimized for 2D ultrasound images which may notreliably represent heterogeneous distributions of scatterers (orspeckle) encountered within a tumor volume. A random forestbased solution to learn tissue-specific ultrasonic backscatteringand a signal confidence for predicting heterogeneous compositionin atherosclerotic plaques was proposed in Sheet et al. (2014). Thattechnique was developed for intravascular ultrasound and riskassessment of plaque rupture (Zhou et al., 2002). Necrotic corewas not considered in that method. Finally, Bouhlel and Sevestre-Ghalila (2009) AND Klein et al. (2011) describe a Markov randomfield model combined with Nakagami distribution estimation todifferentiate malignant melanoma from normal tissue. Howeverit was found that the estimated scale model parameter was highlysensitive to image quality, and hence subtle variations could gounnoticed. For an overview of ultrasound tissue characterizationwe refer the reader to Noble (2010). Previous work on ultrasound
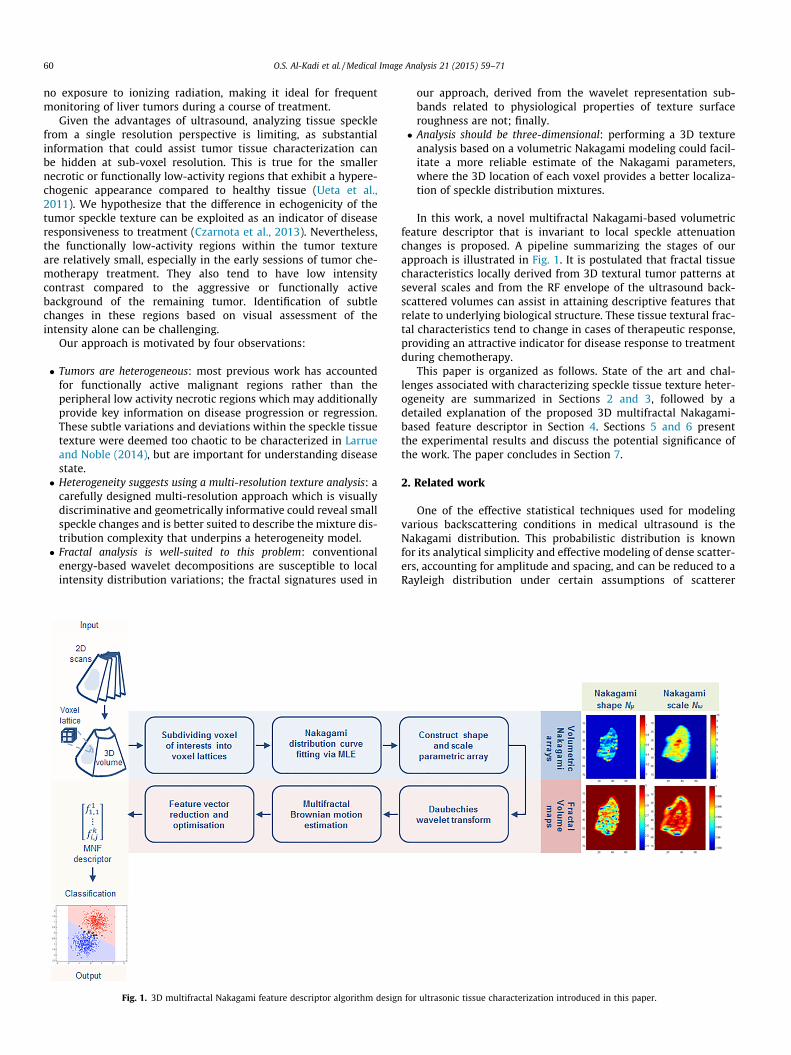
Fig. 2. Six ultrasound hypoechoic to hyperechoic gray scale target phantoms havinrepresenting a varying intensity from hypoechoic, �6, �3, +3, +6 dB, and hyperechoic, r
texture analysis of tumors has considered both global and localnon-uniformity quantification of the tumor texture at only a singleanalysis scale. Herein we are primarily concerned with tumorintra-heterogeneity (i.e. micro-structures within the tumor speckletexture) which is more challenging.
3. Challenges in ultrasonic speckle texture characterization
Speckle is a granular-shape stochastic pattern which appears inan image resulting from the scattering of an RF incident signal onan object (Sanches et al., 2011). The spacing and localization ofthe scatterers in the scanned object structure contribute to thelocal variation and distribution of the recorded texture pattern.However the characteristic interference patterns, known asspeckle, produce an overall reduction in global image contrast(Noble, 2010). As a consequence, the boundaries separating differ-ent structures are less well defined, increasing difficulty in delin-eating regions of interest with a resultant increase in inter-andintra-observer variability for tumor detection.
A means to mitigate against effects such as the beam-tissuephysical interaction and other acquisition factors is to characterizethe objects via their speckle textural properties (De Grandi et al.,2003; Madabhushi and Metaxas, 2003; Sadeghi-Naini et al.,2013). Textons or texels (texture elements) which are the funda-mental components of texture that collectively form the observedspeckle pattern texture do not directly correspond to the underly-ing structure; however, the local intensity textural pattern canreflect the local echogenicity of the underlying scatterers(Anderson and Trahey, 2006), see Fig. 2. This is due to the stochas-tic nature of the speckle pattern. Viewing the structure locally as acollective texton structure can give information about the underly-ing scatterer behavior. We hypothesize here this may lead to animprovement in internal structure delineation, and hence tumorcharacterization.
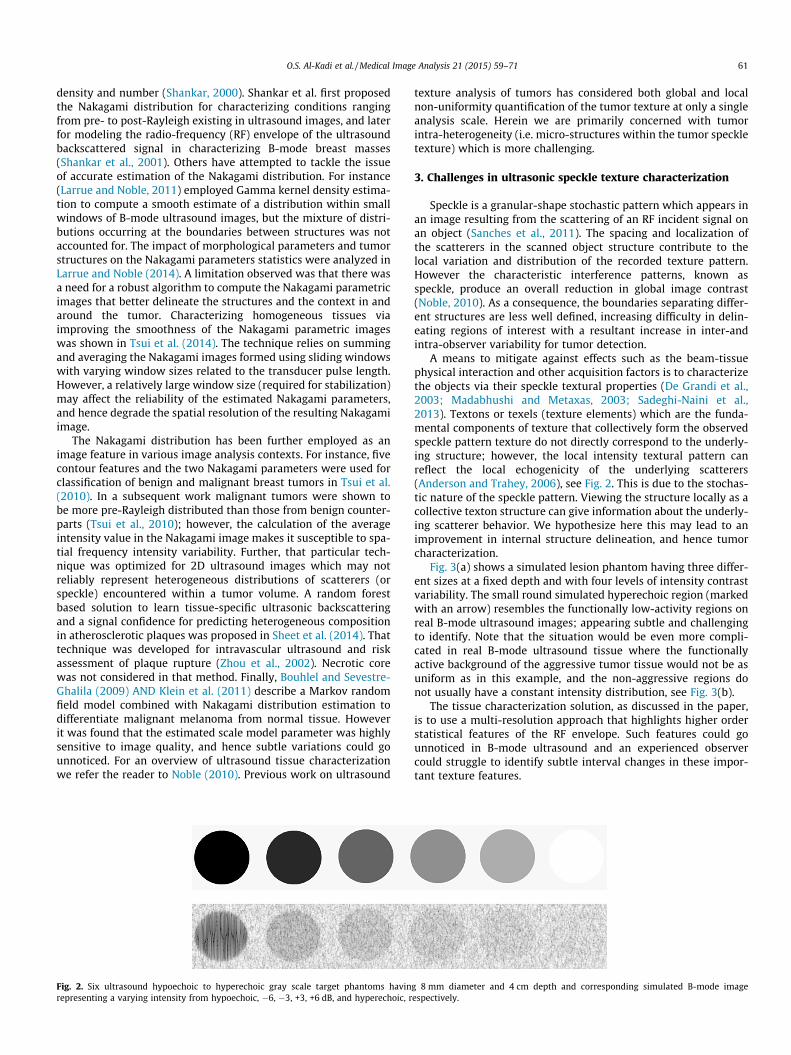
Fig. 3(a) shows a simulated lesion phantom having three differ-ent sizes at a fixed depth and with four levels of intensity contrastvariability. The small round simulated hyperechoic region (markedwith an arrow) resembles the functionally low-activity regions onreal B-mode ultrasound images; appearing subtle and challengingto identify. Note that the situation would be even more compli-cated in real B-mode ultrasound tissue where the functionallyactive background of the aggressive tumor tissue would not be asuniform as in this example, and the non-aggressive regions donot usually have a constant intensity distribution, see Fig. 3(b).
The tissue characterization solution, as discussed in the paper,is to use a multi-resolution approach that highlights higher orderstatistical features of the RF envelope. Such features could gounnoticed in B-mode ultrasound and an experienced observercould struggle to identify subtle interval changes in these impor-tant texture features.
g 8 mm diameter and 4 cm depth and corresponding simulated B-mode imageespectively.
Fig. 3. (a) Simulated ultrasound B-mode image following the method in Bamber and Dickinson (1980) showing different 4 cm depth of 4, 6 and 8 mm diameter gray scaletarget phantoms ranging from �6, �3, +3 and +6 dB varying intensity, (b) a real ultrasound B-mode volume of interest of a liver tumor with corresponding fractal slice map in(c) – estimated from the RF envelope of the ultrasound backscattered signal – indicating the subtle low-activity regions.
62 O.S. Al-Kadi et al. / Medical Image Analysis 21 (2015) 59–71
Fractals and wavelet packet analysis provide effective ways tobreak down statistical complexity to distinguish between differenttexture regions, where the invariance to affine speckle intensitychanges for the former and the high sensitivity to local featuresfor the latter facilitates effective texture discrimination (Al-Kadi,2009). Furthermore, according to the uncertainty principle, thewavelet packets can achieve an optimal joint spatial-frequencylocalization, i.e. simultaneously maintain a good boundary accuracyand frequency response (Rangayyan, 2005), and the estimated frac-tal dimension can give a quantitative assessment of the surfaceroughness (Al-Kadi and Watson, 2008; Lopes and Betrouni, 2009).Finally, simultaneous macro and micro scale tumor texture analysisprovides a more complete characterization of dense and sparse tex-tural regions within a tumor volume of interest. As demonstratedlater, this progressive refinement process optimizes characteriza-tion by giving a better fit to the underlying tumor speckle texture.
4. Methodology
Our goal is to derive a locally-based feature signature based onvolumetric generated Nakagami shape and scale parametric voxellattices, and subsequently to perform an intensity-invariant tex-ture analysis at various spatial resolutions for tissue characteriza-tion. This allows us to perform a more complete characterizationof tumor texture at the optimal resolution scales compared to sin-gle or mono-resolution approaches (Al-Kadi, 2009). The proposedvolumetric dense-to-sparse approach can break-down the specklecomplexity and provide a robust estimation of model parameters,while having the advantage of simultaneously localizing both largehigh-contrast and small low-contrast structures at low and highspatial resolution levels.
4.1. Nakagami probabilistic distribution
The Nakagami distribution N(x) is an analytically simple distri-bution that has been proposed as a general model for the ultrasonicbackscattered envelope under all scattering conditions and scat-terer densities (Shankar, 2000). This distribution has the densityfunction:
Nðxjl;xÞ ¼ 2lx
� �l 1C lð Þ x
2l�1ð Þe�lxx2; 8x 2 R P 0 ð1Þ
where x is the envelope of the RF signal, with the shape of the dis-tribution defined by the l parameter corresponding to the local
concentration of scatterers, and the local backscattered energy rep-resented by the scale parameter x i 0, for x > 0, and C �ð Þ is theGamma function. If x has a Nakagami distribution N with parame-ters l and x, then x2 has a Gamma distribution C with shape land scale (energy) parameter x/l.
The Nakagami distribution can model various backscatteringconditions in medical ultrasound. By varying l, the envelope sta-tistics range from pre-Rayleigh l < 1ð Þ, Rayleigh 0 < l < 0:5ð Þ,and to post-Rayleigh l > 1ð Þ. The Nakagami parameters are gener-ally estimated by the 2nd and 4th order moments, where given x isthe ultrasonic backscattered envelope and E �ð Þ denotes the statisti-cal mean, the two Nakagami parameters can be calculated as:
x ¼ E x2� �; and l ¼
E x2� �2
Var x2ð Þ ¼E x2� �2
E x4ð Þ � E x2ð Þ2:ð2Þ
4.2. Volumetric multi-scale Nakagami modeling
A 3D feature signature that operates locally is defined by havingeach volume V consisting of z acquired slices Ii : i ¼ 1; . . . ; zf g sub-divided into voxel lattices v i, each having a defined size of m and n,where v ¼ vkljk; l 2 Vf g for k ¼ 1; . . . ;m; l ¼ 1; . . . ;n, such thatS
klvkl ¼ V . For each v i we assume that for a scaling factor r at aspecific spatial scale s, the scaled voxel intensity lattice valuesv i
klr of the RF envelope amplitude Aklr such that Aklr ¼ vklrð Þr2Rs,
where the different possible resolution levelsRs : r ¼ 1; . . . ; s; . . . ; j reaching to the maximum level j representa stochastic pattern, and the envelope amplitude of the scales rof v i
klr follows a Nakagami distribution. Given the large numberof voxel samples to analyze and the known family of probabilitydistributions, the maximum likelihood estimators would tend tohave a higher probability of being close to the quantities to be esti-mated and more often unbiased as compared to moments-basedestimation (Cheng and Beaulieu, 2001), therefore the associatedshape and scale parameters were estimated via maximum likeli-hood estimation (MLE) by operating on each voxel lattice regionand at different scales. The maximum likelihood estimate h vð Þfor a density function f v1
111; . . . ;vzmnjjh
� �when h is a vector of
parameters for the Nakagami distribution family H, estimates
the most probable parameters h vð Þ ¼ argmaxh D hjv1111; . . . ;vz
mnj
� �,
where D hjvð Þ ¼ f v jhð Þ; h 2 H is the score function. Havinggenerated voxel-based Nakagami parameters, 3D wavelet packet
O.S. Al-Kadi et al. / Medical Image Analysis 21 (2015) 59–71 63
Daubechies analysis (Mallat, 1999) can be applied at multiplescales. Namely:
Wu t0; x; y; zð Þ ¼ 1ffiffiffiffiffiffiffiffiffimnj
p Xj�1
r¼0
Xn�1
l¼0
Xm�1
k¼0
vklruklr t0; x; y; zð Þ; ð3Þ
Wiw t; x; y; zð Þ ¼ 1ffiffiffiffiffiffiffiffiffi
mnjp Xj�1
r¼0
Xn�1
l¼0
Xm�1
k¼0
vklrwiklr t; x; y; zð Þ; ð4Þ
where vklr 2 L2Rð Þ is relative to scaling uklr and wavelet function
wklr and Wu t0;m;nð Þ defines an approximation of vklr at scale t0,and Wi
w t;m;nð Þ coefficients add horizontal, vertical and diagonaldetails for scales t P t0. The Daubechies wavelet family can accountfor self-similarity and signal discontinuities, making it one of themost useful wavelets for characterizing signals exhibiting fractalpatterns (Daubechies, 1990). In our case an orthogonal 8-tapDaubechies filter was used to obtain the wavelet packets byexpanding the basis having the most significant fractal signaturerather than energy.
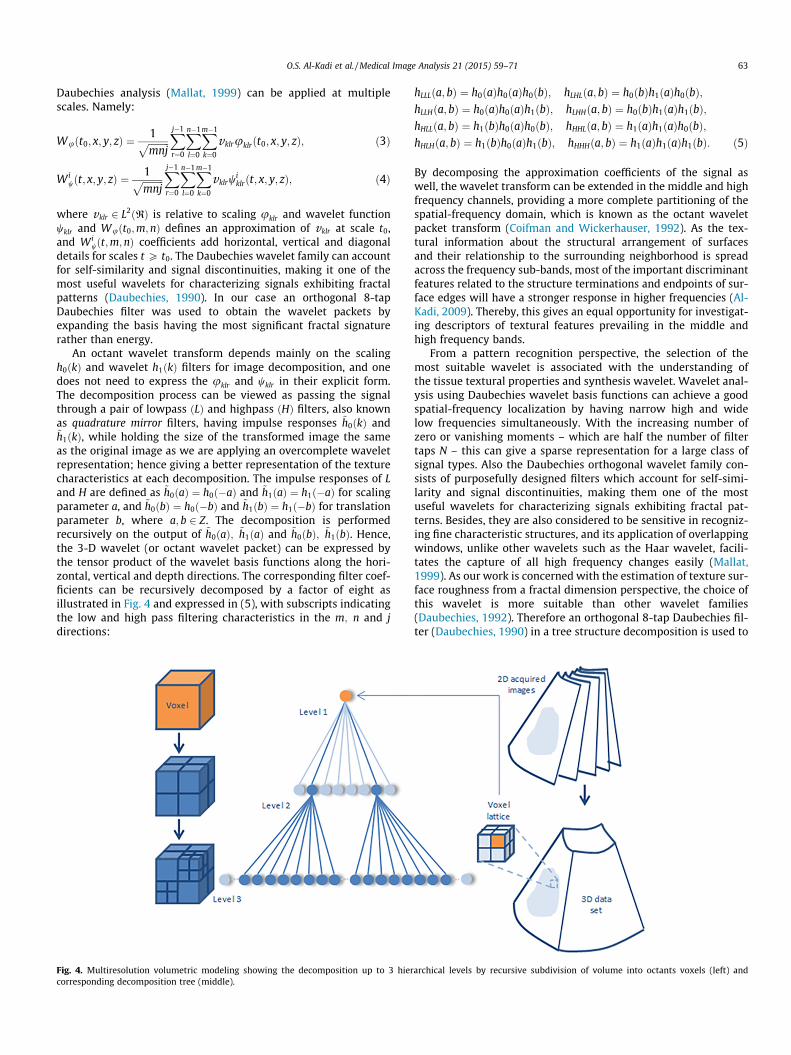
An octant wavelet transform depends mainly on the scalingh0 kð Þ and wavelet h1 kð Þ filters for image decomposition, and onedoes not need to express the uklr and wklr in their explicit form.The decomposition process can be viewed as passing the signalthrough a pair of lowpass Lð Þ and highpass Hð Þ filters, also knownas quadrature mirror filters, having impulse responses ~h0 kð Þ and~h1 kð Þ, while holding the size of the transformed image the sameas the original image as we are applying an overcomplete waveletrepresentation; hence giving a better representation of the texturecharacteristics at each decomposition. The impulse responses of Land H are defined as ~h0 að Þ ¼ h0 �að Þ and ~h1 að Þ ¼ h1 �að Þ for scalingparameter a, and ~h0 bð Þ ¼ h0 �bð Þ and ~h1 bð Þ ¼ h1 �bð Þ for translationparameter b, where a; b 2 Z. The decomposition is performedrecursively on the output of ~h0 að Þ; ~h1 að Þ and ~h0 bð Þ; ~h1 bð Þ. Hence,the 3-D wavelet (or octant wavelet packet) can be expressed bythe tensor product of the wavelet basis functions along the hori-zontal, vertical and depth directions. The corresponding filter coef-ficients can be recursively decomposed by a factor of eight asillustrated in Fig. 4 and expressed in (5), with subscripts indicatingthe low and high pass filtering characteristics in the m; n and jdirections:
Fig. 4. Multiresolution volumetric modeling showing the decomposition up to 3 hiercorresponding decomposition tree (middle).
hLLL a; bð Þ ¼ h0 að Þh0 að Þh0 bð Þ; hLHL a; bð Þ ¼ h0 bð Þh1 að Þh0 bð Þ;hLLH a; bð Þ ¼ h0 að Þh0 að Þh1 bð Þ; hLHH a; bð Þ ¼ h0 bð Þh1 að Þh1 bð Þ;hHLL a; bð Þ ¼ h1 bð Þh0 að Þh0 bð Þ; hHHL a; bð Þ ¼ h1 að Þh1 að Þh0 bð Þ;hHLH a; bð Þ ¼ h1 bð Þh0 að Þh1 bð Þ; hHHH a; bð Þ ¼ h1 að Þh1 að Þh1 bð Þ: ð5Þ
By decomposing the approximation coefficients of the signal aswell, the wavelet transform can be extended in the middle and highfrequency channels, providing a more complete partitioning of thespatial-frequency domain, which is known as the octant waveletpacket transform (Coifman and Wickerhauser, 1992). As the tex-tural information about the structural arrangement of surfacesand their relationship to the surrounding neighborhood is spreadacross the frequency sub-bands, most of the important discriminantfeatures related to the structure terminations and endpoints of sur-face edges will have a stronger response in higher frequencies (Al-Kadi, 2009). Thereby, this gives an equal opportunity for investigat-ing descriptors of textural features prevailing in the middle andhigh frequency bands.
From a pattern recognition perspective, the selection of themost suitable wavelet is associated with the understanding ofthe tissue textural properties and synthesis wavelet. Wavelet anal-ysis using Daubechies wavelet basis functions can achieve a goodspatial-frequency localization by having narrow high and widelow frequencies simultaneously. With the increasing number ofzero or vanishing moments – which are half the number of filtertaps N – this can give a sparse representation for a large class ofsignal types. Also the Daubechies orthogonal wavelet family con-sists of purposefully designed filters which account for self-simi-larity and signal discontinuities, making them one of the mostuseful wavelets for characterizing signals exhibiting fractal pat-terns. Besides, they are also considered to be sensitive in recogniz-ing fine characteristic structures, and its application of overlappingwindows, unlike other wavelets such as the Haar wavelet, facili-tates the capture of all high frequency changes easily (Mallat,1999). As our work is concerned with the estimation of texture sur-face roughness from a fractal dimension perspective, the choice ofthis wavelet is more suitable than other wavelet families(Daubechies, 1992). Therefore an orthogonal 8-tap Daubechies fil-ter (Daubechies, 1990) in a tree structure decomposition is used to
archical levels by recursive subdivision of volume into octants voxels (left) and
64 O.S. Al-Kadi et al. / Medical Image Analysis 21 (2015) 59–71
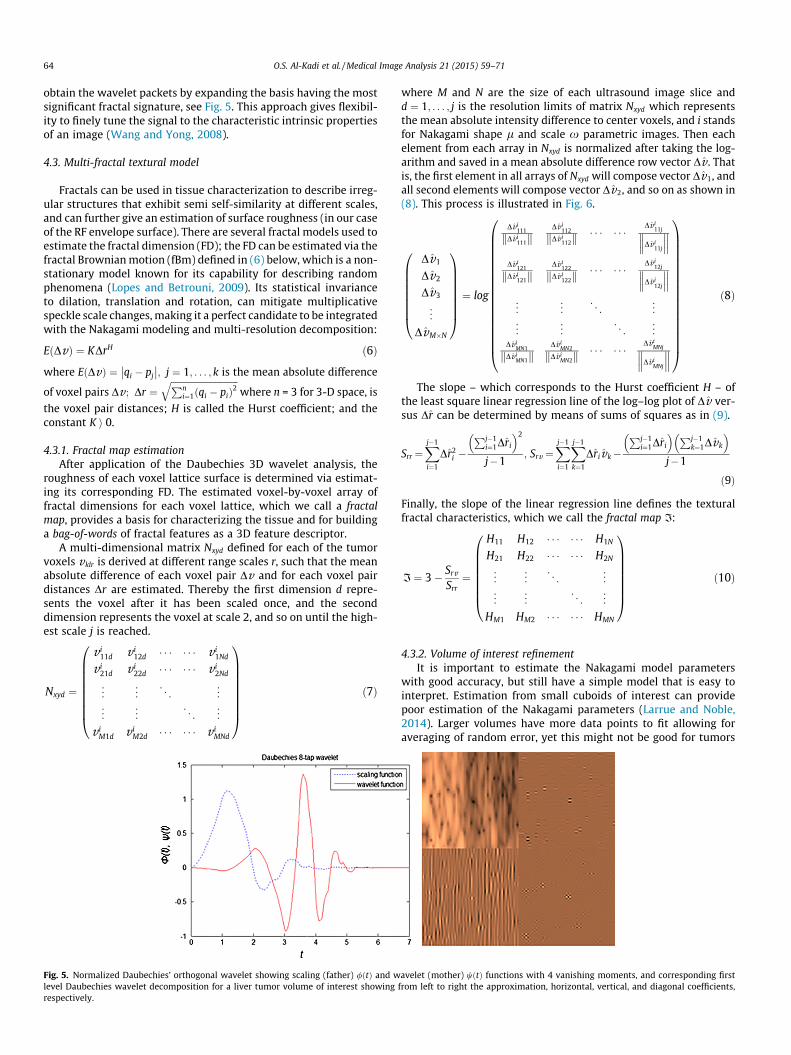
obtain the wavelet packets by expanding the basis having the mostsignificant fractal signature, see Fig. 5. This approach gives flexibil-ity to finely tune the signal to the characteristic intrinsic propertiesof an image (Wang and Yong, 2008).
4.3. Multi-fractal textural model
Fractals can be used in tissue characterization to describe irreg-ular structures that exhibit semi self-similarity at different scales,and can further give an estimation of surface roughness (in our caseof the RF envelope surface). There are several fractal models used toestimate the fractal dimension (FD); the FD can be estimated via thefractal Brownian motion (fBm) defined in (6) below, which is a non-stationary model known for its capability for describing randomphenomena (Lopes and Betrouni, 2009). Its statistical invarianceto dilation, translation and rotation, can mitigate multiplicativespeckle scale changes, making it a perfect candidate to be integratedwith the Nakagami modeling and multi-resolution decomposition:
E Dvð Þ ¼ KDrH ð6Þ
where E Dvð Þ ¼ qi � pj
�� ��; j ¼ 1; . . . ; k is the mean absolute difference
of voxel pairs Dv ; Dr ¼ffiffiffiffiffiffiffiffiffiffiffiffiffiffiffiffiffiffiffiffiffiffiffiffiffiffiffiffiffiffiPn
i¼1 qi � pið Þ2q
where n = 3 for 3-D space, is
the voxel pair distances; H is called the Hurst coefficient; and theconstant K i 0.
4.3.1. Fractal map estimationAfter application of the Daubechies 3D wavelet analysis, the
roughness of each voxel lattice surface is determined via estimat-ing its corresponding FD. The estimated voxel-by-voxel array offractal dimensions for each voxel lattice, which we call a fractalmap, provides a basis for characterizing the tissue and for buildinga bag-of-words of fractal features as a 3D feature descriptor.
A multi-dimensional matrix Nxyd defined for each of the tumorvoxels vklr is derived at different range scales r, such that the meanabsolute difference of each voxel pair Dv and for each voxel pairdistances Dr are estimated. Thereby the first dimension d repre-sents the voxel after it has been scaled once, and the seconddimension represents the voxel at scale 2, and so on until the high-est scale j is reached.
Nxyd ¼
v i11d v i
12d � � � � � � v i1Nd
v i21d v i
22d � � � � � � v i2Nd
..
. ... . .
. ...
..
. ... . .
. ...
v iM1d v i
M2d � � � � � � v iMNd
0BBBBBBBB@
1CCCCCCCCAð7Þ
Fig. 5. Normalized Daubechies’ orthogonal wavelet showing scaling (father) /ðtÞ and wlevel Daubechies wavelet decomposition for a liver tumor volume of interest showingrespectively.
where M and N are the size of each ultrasound image slice andd ¼ 1; . . . ; j is the resolution limits of matrix Nxyd which representsthe mean absolute intensity difference to center voxels, and i standsfor Nakagami shape l and scale x parametric images. Then eachelement from each array in Nxyd is normalized after taking the log-arithm and saved in a mean absolute difference row vector Dv . Thatis, the first element in all arrays of Nxyd will compose vector Dv1, andall second elements will compose vector Dv2, and so on as shown in(8). This process is illustrated in Fig. 6.
Dv1
Dv2
Dv3
..
.
DvM�N
0BBBBBBB@
1CCCCCCCA ¼ log
Dv i111
Dv i111k k
Dv i112
Dv i112k k � � � � � �
Dv i11j
Dv i11j
��� ���Dv i
121
Dv i121k k
Dv i122
Dv i122k k � � � � � �
Dv i12j
Dv i12j
��� ���... ..
. . .. ..
.
..
. ... . .
. ...
Dv iMN1
Dv iMN1k k
Dv iMN2
Dv iMN2k k � � � � � �
Dv iMNj
Dv iMNj
��� ���
0BBBBBBBBBBBBBBBBB@
1CCCCCCCCCCCCCCCCCA
ð8Þ
The slope – which corresponds to the Hurst coefficient H – ofthe least square linear regression line of the log–log plot of Dv ver-sus Dr can be determined by means of sums of squares as in (9).
Srr ¼Xj�1
i¼1
Dr2i �
Pj�1i¼1Dri
� �2
j�1; Srv ¼
Xj�1
i¼1
Xj�1
k¼1
Drivk�Pj�1
i¼1Dri
� � Pj�1k¼1Dvk
� �j�1
ð9Þ
Finally, the slope of the linear regression line defines the texturalfractal characteristics, which we call the fractal map I:
I ¼ 3� Srv
Srr¼
H11 H12 � � � � � � H1N
H21 H22 � � � � � � H2N
..
. ... . .
. ...
..
. ... . .
. ...
HM1 HM2 � � � � � � HMN
0BBBBBBB@
1CCCCCCCAð10Þ
4.3.2. Volume of interest refinementIt is important to estimate the Nakagami model parameters
with good accuracy, but still have a simple model that is easy tointerpret. Estimation from small cuboids of interest can providepoor estimation of the Nakagami parameters (Larrue and Noble,2014). Larger volumes have more data points to fit allowing foraveraging of random error, yet this might not be good for tumors
avelet (mother) wðtÞ functions with 4 vanishing moments, and corresponding firstfrom left to right the approximation, horizontal, vertical, and diagonal coefficients,
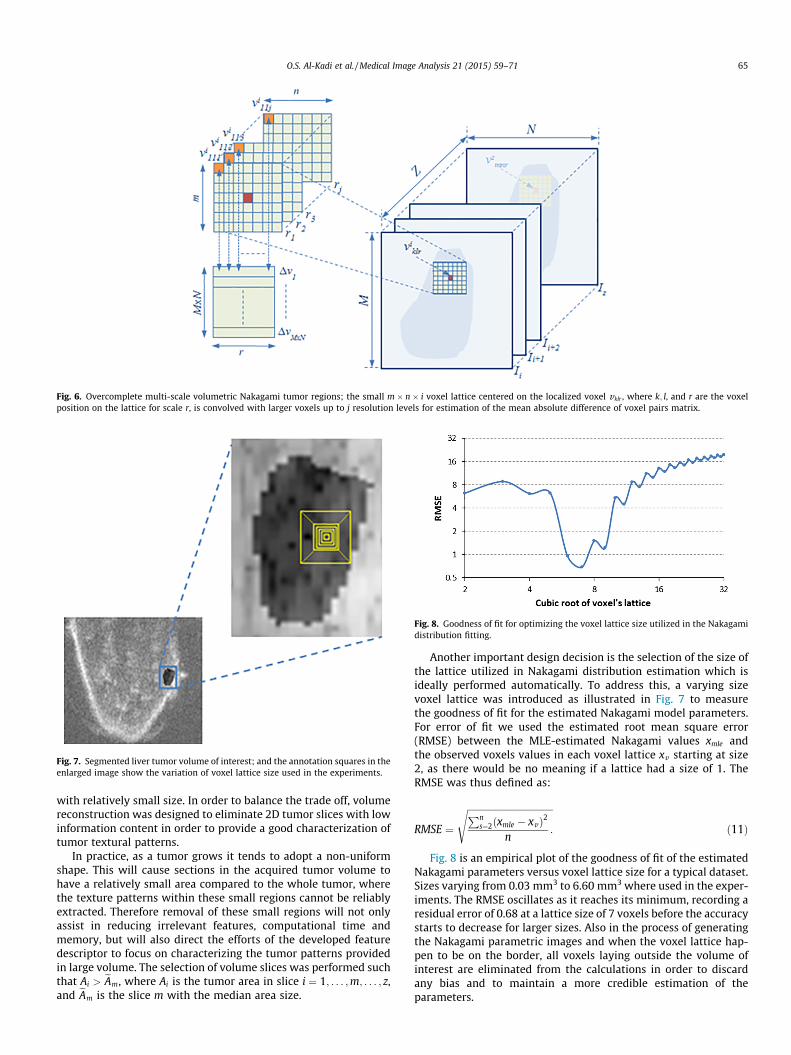
Fig. 6. Overcomplete multi-scale volumetric Nakagami tumor regions; the small m� n� i voxel lattice centered on the localized voxel vklr , where k; l, and r are the voxelposition on the lattice for scale r, is convolved with larger voxels up to j resolution levels for estimation of the mean absolute difference of voxel pairs matrix.
Fig. 7. Segmented liver tumor volume of interest; and the annotation squares in theenlarged image show the variation of voxel lattice size used in the experiments.
Fig. 8. Goodness of fit for optimizing the voxel lattice size utilized in the Nakagamidistribution fitting.
O.S. Al-Kadi et al. / Medical Image Analysis 21 (2015) 59–71 65
with relatively small size. In order to balance the trade off, volumereconstruction was designed to eliminate 2D tumor slices with lowinformation content in order to provide a good characterization oftumor textural patterns.
In practice, as a tumor grows it tends to adopt a non-uniformshape. This will cause sections in the acquired tumor volume tohave a relatively small area compared to the whole tumor, wherethe texture patterns within these small regions cannot be reliablyextracted. Therefore removal of these small regions will not onlyassist in reducing irrelevant features, computational time andmemory, but will also direct the efforts of the developed featuredescriptor to focus on characterizing the tumor patterns providedin large volume. The selection of volume slices was performed suchthat Ai > eAm, where Ai is the tumor area in slice i ¼ 1; . . . ;m; . . . ; z,and eAm is the slice m with the median area size.
Another important design decision is the selection of the size ofthe lattice utilized in Nakagami distribution estimation which isideally performed automatically. To address this, a varying sizevoxel lattice was introduced as illustrated in Fig. 7 to measurethe goodness of fit for the estimated Nakagami model parameters.For error of fit we used the estimated root mean square error(RMSE) between the MLE-estimated Nakagami values xmle andthe observed voxels values in each voxel lattice xv starting at size2, as there would be no meaning if a lattice had a size of 1. TheRMSE was thus defined as:
RMSE ¼
ffiffiffiffiffiffiffiffiffiffiffiffiffiffiffiffiffiffiffiffiffiffiffiffiffiffiffiffiffiffiffiffiffiffiffiffiffiPns¼2 xmle � xvð Þ2
n:
sð11Þ
Fig. 8 is an empirical plot of the goodness of fit of the estimatedNakagami parameters versus voxel lattice size for a typical dataset.Sizes varying from 0.03 mm3 to 6.60 mm3 where used in the exper-iments. The RMSE oscillates as it reaches its minimum, recording aresidual error of 0.68 at a lattice size of 7 voxels before the accuracystarts to decrease for larger sizes. Also in the process of generatingthe Nakagami parametric images and when the voxel lattice hap-pen to be on the border, all voxels laying outside the volume ofinterest are eliminated from the calculations in order to discardany bias and to maintain a more credible estimation of theparameters.
66 O.S. Al-Kadi et al. / Medical Image Analysis 21 (2015) 59–71
4.3.3. Feature selection optimizationThe ultrasound texture fractal maps representing the FD voxel-
based signature for the estimated Nakagami shape and scale para-metric images are shown in Fig. 9(e) and (f), respectively. Variouswavelet decomposition techniques apply the sub-bands’ energyfor decomposition which is susceptible to intensity variations inultrasound images due to speckle; however, the local density func-tion known as the FD, can instead overcome these local variationsin voxel intensities as it gives a representation of texture surfaceroughness, and hence is employed for the multiresolution analysis.The fractal characteristics are estimated for all sub-bands at eachlevel of the wavelet packet decomposition, where the FD is com-puted on a voxel-by-voxel basis to produce a fractal map I for eachsub-band i.e., each voxel in the fractal map has its own localized FDvalue estimated from its neighborhood as described in the previoussection, where the rougher the surface the higher the FD values get,and vice versa. Features at boundaries are computed after assum-ing that each slice is mirror-like continually extended in bothdirections. Specifically, the fractal features f i;j for a specific sub-band j to a certain level of decomposition i represent the averagevalue of the generated M � N fractal image map I of a volume ofinterest k as defined in Eq. (12).
f ki;j ¼
1MN
XMN
r¼1
Ir ð12Þ
This local estimation gives a more reliable estimation comparedto a single global value. Finally, the optimized multi-fractal featurevector descriptor consists of all selected sub-band fractal featuresignatures f in each volume of interest k, expressed as K ¼
Skkk,
where kk ¼ f 11;1; . . . ; f k
i;j; . . . ; f zm;n
n o.
In order to save processing time, the dimensionality of theextracted feature vector is reduced by applying a differentialthreshold which eliminates weak FD signatures. The threshold is
defined by the condition 8 f kiþ1;j � f k
iþ1;jþ1
��� ��� 2 K� �
6 Df such that
the FD signature absolute difference of the previous decomposition
level Df ¼ f ki;j � f k
i;jþ1
��� ��� is satisfied, then the decomposition should
terminate. The new 3D multi-fractal Nakagami feature descriptoris abbreviated subsequently as MNF, and its estimation summa-rized in the following pseudo code:
Algorithm 1. Multifractal Nakagami feature descriptor estimation
Input: Volumetric ultrasound images I, volume of interestsfrom each volume I: Ii ¼ x1; y1; z1; . . . ; xLn ; yLn
; zLn
� � ,
segmented volume of interests: Vsf gZs¼1.
Output: multifractal feature descriptor KðkÞf
n o1: for all Segmented volumes of interest V1 ! VZ do
2: {Step 1} //subdivide each volume of interest Vl into
voxel lattices v i.3: for all Voxel lattices v1
111 ! vzmnj do
4: Fit with a Nakagami distribution
Nðxjl;xÞ ¼ 2 lx� �l 1
C lð Þ x2l�1ð Þ
5: {Step 2} //calculate Nakagami shape l and scale x
parameters using maximum likelihood estimation as:
h vð Þ ¼ argmaxh D h=v1111; . . . ;vz
mnj
� �where h is a vector of parameters for the Nakagami
distribution family f v1111; . . . ; vz
mnj=h� �
6: {Step 3}//construct Nakagami shape Nl and scale Nx
parametric array.7: end for8: end for9: for all voxels v i in Nl and Nx do
10: {Step 4}//Perform Daubechies wavelet packet transform
Wu t0;x;y;zð Þ¼ 1=ffiffiffiffiffiffiffiffiffimnj
p� �Pj�1r¼0
Pn�1l¼0Pm�1
k¼0 vklruklr t0;x;y;zð Þ
Wiw t; x; y; zð Þ ¼ 1=
ffiffiffiffiffiffiffiffiffimnj
p� �Pj�1r¼0
Pn�1l¼0Pm�1
k¼0 vklrwiklr t; x; y; zð Þ
11: {Step 5}//multifractal estimation and optimization
phase12: for all decomposition levels i do
13: for all voxels v imnr in Wu and Wi
w do
14: for all voxel pair distances Dr in Wu and Wiw do
15: compute mean absolute difference Dv of eachvoxel pair qi; pi
16: {Step 6}//construct a multidimensional volume of
interest matrix Ndðx; y; dÞ17: normalize and take the logarithm
Dv ¼ log Dv imnr= Dv i
mnr
�� ��� �,
where m; n and r are the size of a voxel i at a certain scale18: normalize voxel pairs distances Dr where
Dr ¼ffiffiffiffiffiffiffiffiffiffiffiffiffiffiffiffiffiffiffiffiffiffiffiffiffiffiffiffiffiffiffiPn
i¼1 qi � pið Þ2q
19: perform least square linear regression as
Srr ¼Pj�1
i¼1Dr2i �
Pj�1i¼1Dri
� �2=ðj� 1Þ ,
Srv ¼Pj�1
i¼1
Pj�1k¼1Drivk �
Pj�1i¼1Dri
� � Pj�1k¼1Dvk
� �=ðj� 1Þ
20: estimate the Hurst coefficient H matrix whichrepresents the slope H ¼ Srv=Srrð Þ
21: estimate the fractal map I ¼ 3� H22: end for23: end for
24: extract mean fractal dimension f ki;j 1=MNð Þ
PMNr¼1Ir
where kk ¼ f 11;1; . . . ; f k
i;j; . . . ; f zm;n
n o25: construct feature descriptor from all wavelet sub-
bands K ¼S
kkk
26: f kiþ1;j � f k
iþ1;jþ1
��� ���27: repeat
28: {Step 7}//determine fractal absolute difference
between decomposition level i and subsequent level as:
Dki ¼ f k
i;j � f ki;jþ1
��� ���,Dk
iþ1 ¼ f kiþ1;j � f k
iþ1;jþ1
��� ���29: until Dk
iþ1 6 Dki
30: end for31: end for32: return optimized multifractal feature vector:
KðkÞf argmax kkð Þ
5. Experiments
This section describes experiments on pre-clinical and clinicalimages to illustrate the new MNF algorithm and to compare itscharacterization performance with previous single scale methods.A tumor was classified as non-progressive if categorized as partialresponse and progressive if no change or disease demonstratednon-responsiveness. The response evaluation criteria in solid
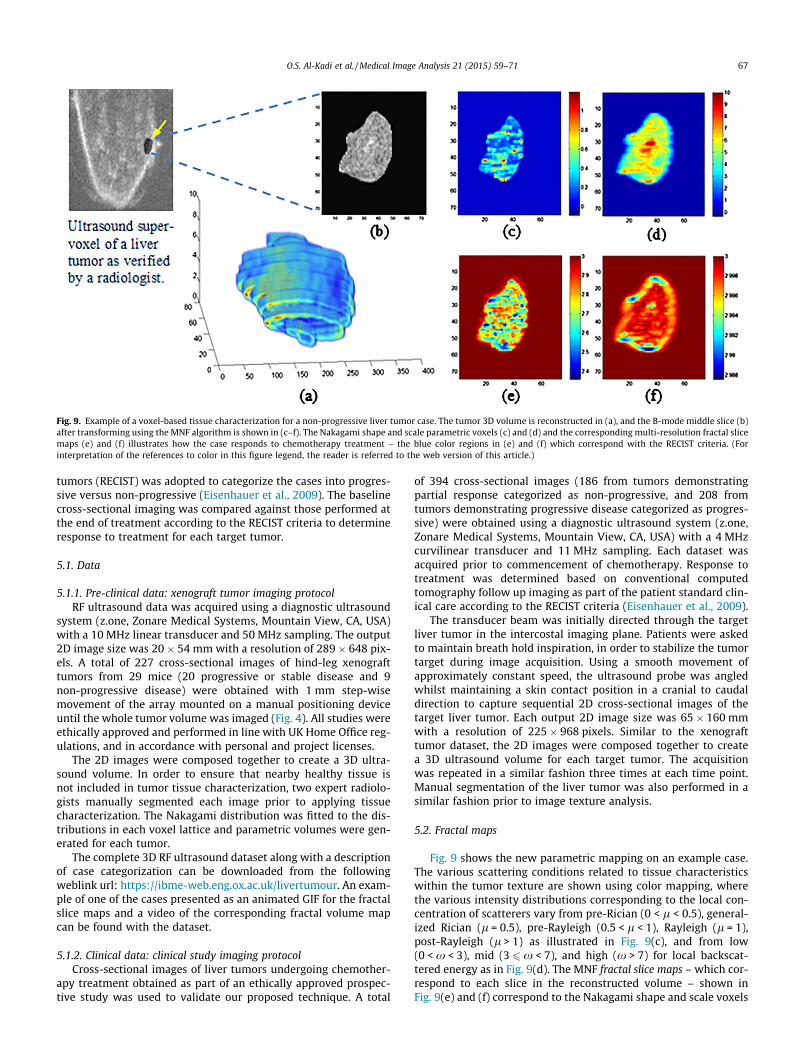
Fig. 9. Example of a voxel-based tissue characterization for a non-progressive liver tumor case. The tumor 3D volume is reconstructed in (a), and the B-mode middle slice (b)after transforming using the MNF algorithm is shown in (c–f). The Nakagami shape and scale parametric voxels (c) and (d) and the corresponding multi-resolution fractal slicemaps (e) and (f) illustrates how the case responds to chemotherapy treatment – the blue color regions in (e) and (f) which correspond with the RECIST criteria. (Forinterpretation of the references to color in this figure legend, the reader is referred to the web version of this article.)
O.S. Al-Kadi et al. / Medical Image Analysis 21 (2015) 59–71 67
tumors (RECIST) was adopted to categorize the cases into progres-sive versus non-progressive (Eisenhauer et al., 2009). The baselinecross-sectional imaging was compared against those performed atthe end of treatment according to the RECIST criteria to determineresponse to treatment for each target tumor.
5.1. Data
5.1.1. Pre-clinical data: xenograft tumor imaging protocolRF ultrasound data was acquired using a diagnostic ultrasound
system (z.one, Zonare Medical Systems, Mountain View, CA, USA)with a 10 MHz linear transducer and 50 MHz sampling. The output2D image size was 20� 54 mm with a resolution of 289� 648 pix-els. A total of 227 cross-sectional images of hind-leg xenografttumors from 29 mice (20 progressive or stable disease and 9non-progressive disease) were obtained with 1 mm step-wisemovement of the array mounted on a manual positioning deviceuntil the whole tumor volume was imaged (Fig. 4). All studies wereethically approved and performed in line with UK Home Office reg-ulations, and in accordance with personal and project licenses.
The 2D images were composed together to create a 3D ultra-sound volume. In order to ensure that nearby healthy tissue isnot included in tumor tissue characterization, two expert radiolo-gists manually segmented each image prior to applying tissuecharacterization. The Nakagami distribution was fitted to the dis-tributions in each voxel lattice and parametric volumes were gen-erated for each tumor.
The complete 3D RF ultrasound dataset along with a descriptionof case categorization can be downloaded from the followingweblink url: https://ibme-web.eng.ox.ac.uk/livertumour. An exam-ple of one of the cases presented as an animated GIF for the fractalslice maps and a video of the corresponding fractal volume mapcan be found with the dataset.
5.1.2. Clinical data: clinical study imaging protocolCross-sectional images of liver tumors undergoing chemother-
apy treatment obtained as part of an ethically approved prospec-tive study was used to validate our proposed technique. A total
of 394 cross-sectional images (186 from tumors demonstratingpartial response categorized as non-progressive, and 208 fromtumors demonstrating progressive disease categorized as progres-sive) were obtained using a diagnostic ultrasound system (z.one,Zonare Medical Systems, Mountain View, CA, USA) with a 4 MHzcurvilinear transducer and 11 MHz sampling. Each dataset wasacquired prior to commencement of chemotherapy. Response totreatment was determined based on conventional computedtomography follow up imaging as part of the patient standard clin-ical care according to the RECIST criteria (Eisenhauer et al., 2009).
The transducer beam was initially directed through the targetliver tumor in the intercostal imaging plane. Patients were askedto maintain breath hold inspiration, in order to stabilize the tumortarget during image acquisition. Using a smooth movement ofapproximately constant speed, the ultrasound probe was angledwhilst maintaining a skin contact position in a cranial to caudaldirection to capture sequential 2D cross-sectional images of thetarget liver tumor. Each output 2D image size was 65� 160 mmwith a resolution of 225� 968 pixels. Similar to the xenografttumor dataset, the 2D images were composed together to createa 3D ultrasound volume for each target tumor. The acquisitionwas repeated in a similar fashion three times at each time point.Manual segmentation of the liver tumor was also performed in asimilar fashion prior to image texture analysis.
5.2. Fractal maps
Fig. 9 shows the new parametric mapping on an example case.The various scattering conditions related to tissue characteristicswithin the tumor texture are shown using color mapping, wherethe various intensity distributions corresponding to the local con-centration of scatterers vary from pre-Rician (0 < l < 0.5), general-ized Rician (l = 0.5), pre-Rayleigh (0.5 < l < 1), Rayleigh (l = 1),post-Rayleigh (l > 1) as illustrated in Fig. 9(c), and from low(0 < x < 3), mid (3 6x < 7), and high (x > 7) for local backscat-tered energy as in Fig. 9(d). The MNF fractal slice maps – which cor-respond to each slice in the reconstructed volume – shown inFig. 9(e) and (f) correspond to the Nakagami shape and scale voxels
68 O.S. Al-Kadi et al. / Medical Image Analysis 21 (2015) 59–71
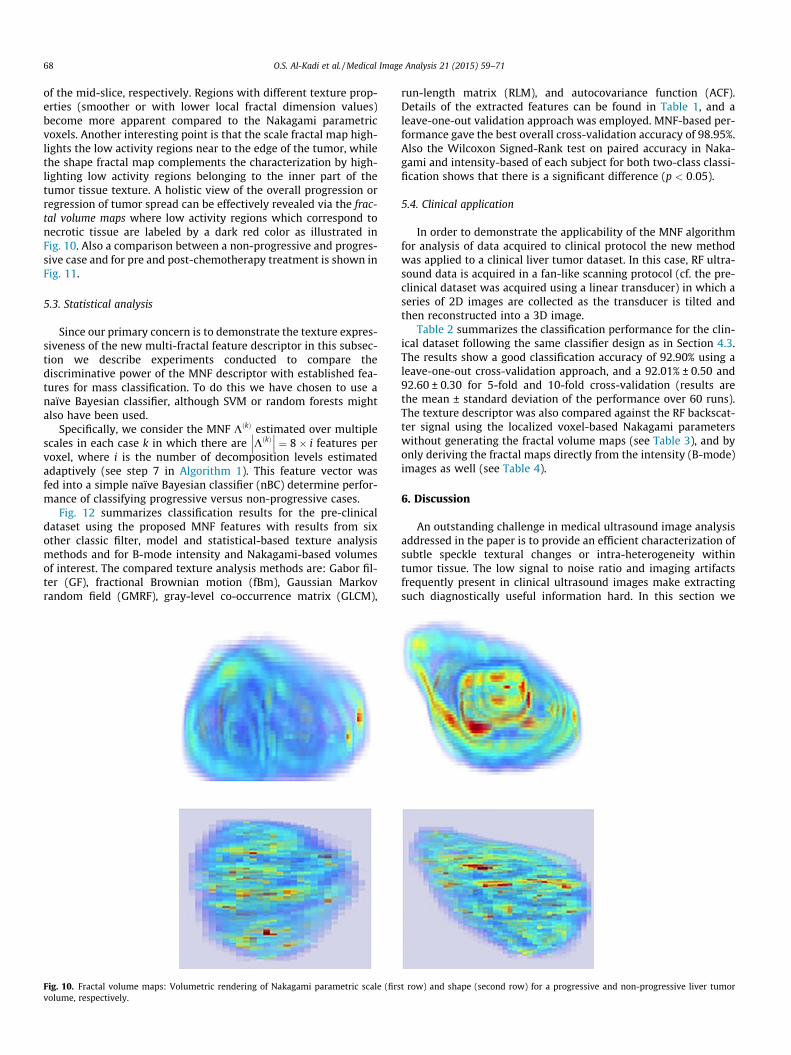
of the mid-slice, respectively. Regions with different texture prop-erties (smoother or with lower local fractal dimension values)become more apparent compared to the Nakagami parametricvoxels. Another interesting point is that the scale fractal map high-lights the low activity regions near to the edge of the tumor, whilethe shape fractal map complements the characterization by high-lighting low activity regions belonging to the inner part of thetumor tissue texture. A holistic view of the overall progression orregression of tumor spread can be effectively revealed via the frac-tal volume maps where low activity regions which correspond tonecrotic tissue are labeled by a dark red color as illustrated inFig. 10. Also a comparison between a non-progressive and progres-sive case and for pre and post-chemotherapy treatment is shown inFig. 11.
5.3. Statistical analysis
Since our primary concern is to demonstrate the texture expres-siveness of the new multi-fractal feature descriptor in this subsec-tion we describe experiments conducted to compare thediscriminative power of the MNF descriptor with established fea-tures for mass classification. To do this we have chosen to use anaïve Bayesian classifier, although SVM or random forests mightalso have been used.
Specifically, we consider the MNF KðkÞ estimated over multiplescales in each case k in which there are KðkÞ
��� ��� ¼ 8� i features pervoxel, where i is the number of decomposition levels estimatedadaptively (see step 7 in Algorithm 1). This feature vector wasfed into a simple naïve Bayesian classifier (nBC) determine perfor-mance of classifying progressive versus non-progressive cases.
Fig. 12 summarizes classification results for the pre-clinicaldataset using the proposed MNF features with results from sixother classic filter, model and statistical-based texture analysismethods and for B-mode intensity and Nakagami-based volumesof interest. The compared texture analysis methods are: Gabor fil-ter (GF), fractional Brownian motion (fBm), Gaussian Markovrandom field (GMRF), gray-level co-occurrence matrix (GLCM),
Fig. 10. Fractal volume maps: Volumetric rendering of Nakagami parametric scale (firsvolume, respectively.
run-length matrix (RLM), and autocovariance function (ACF).Details of the extracted features can be found in Table 1, and aleave-one-out validation approach was employed. MNF-based per-formance gave the best overall cross-validation accuracy of 98.95%.Also the Wilcoxon Signed-Rank test on paired accuracy in Naka-gami and intensity-based of each subject for both two-class classi-fication shows that there is a significant difference (p < 0:05).
5.4. Clinical application
In order to demonstrate the applicability of the MNF algorithmfor analysis of data acquired to clinical protocol the new methodwas applied to a clinical liver tumor dataset. In this case, RF ultra-sound data is acquired in a fan-like scanning protocol (cf. the pre-clinical dataset was acquired using a linear transducer) in which aseries of 2D images are collected as the transducer is tilted andthen reconstructed into a 3D image.
Table 2 summarizes the classification performance for the clin-ical dataset following the same classifier design as in Section 4.3.The results show a good classification accuracy of 92.90% using aleave-one-out cross-validation approach, and a 92.01% ± 0.50 and92.60 ± 0.30 for 5-fold and 10-fold cross-validation (results arethe mean ± standard deviation of the performance over 60 runs).The texture descriptor was also compared against the RF backscat-ter signal using the localized voxel-based Nakagami parameterswithout generating the fractal volume maps (see Table 3), and byonly deriving the fractal maps directly from the intensity (B-mode)images as well (see Table 4).
6. Discussion
An outstanding challenge in medical ultrasound image analysisaddressed in the paper is to provide an efficient characterization ofsubtle speckle textural changes or intra-heterogeneity withintumor tissue. The low signal to noise ratio and imaging artifactsfrequently present in clinical ultrasound images make extractingsuch diagnostically useful information hard. In this section we
t row) and shape (second row) for a progressive and non-progressive liver tumor
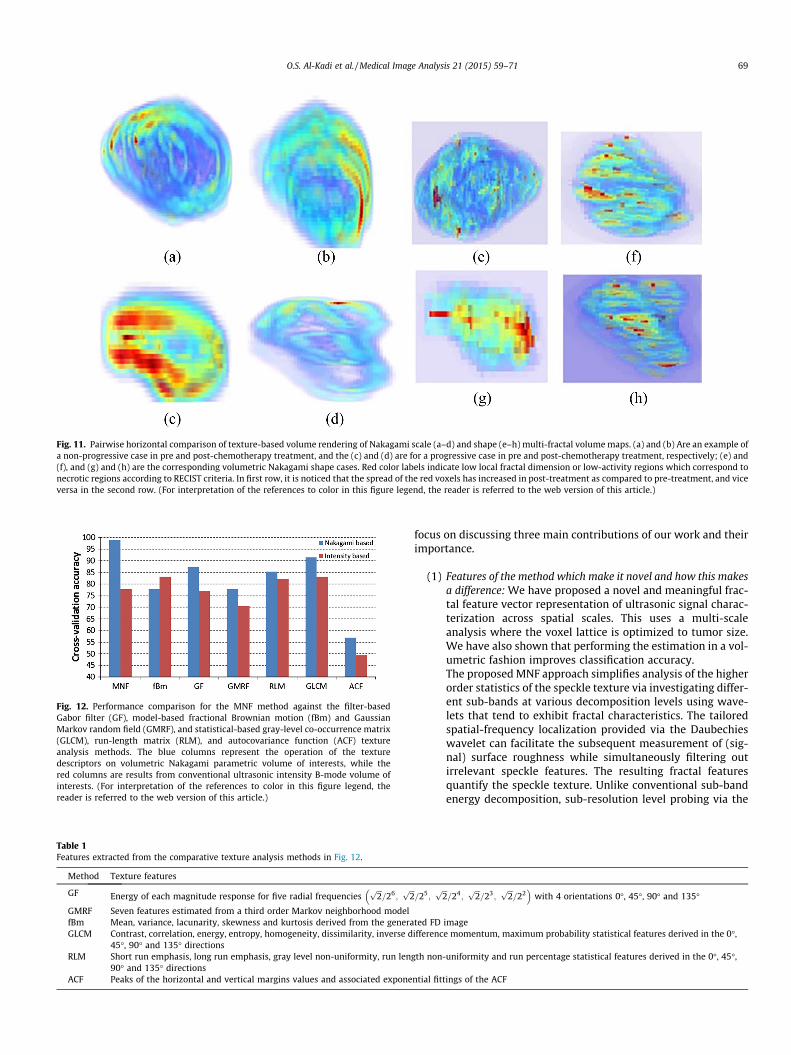
Fig. 11. Pairwise horizontal comparison of texture-based volume rendering of Nakagami scale (a–d) and shape (e–h) multi-fractal volume maps. (a) and (b) Are an example ofa non-progressive case in pre and post-chemotherapy treatment, and the (c) and (d) are for a progressive case in pre and post-chemotherapy treatment, respectively; (e) and(f), and (g) and (h) are the corresponding volumetric Nakagami shape cases. Red color labels indicate low local fractal dimension or low-activity regions which correspond tonecrotic regions according to RECIST criteria. In first row, it is noticed that the spread of the red voxels has increased in post-treatment as compared to pre-treatment, and viceversa in the second row. (For interpretation of the references to color in this figure legend, the reader is referred to the web version of this article.)
Table 1Features extracted from the comparative texture analysis methods in Fig. 12.
Method Texture features
GF Energy of each magnitude response for five radial frequenciesffiffiffi2p
=26;ffi2p�
GMRF Seven features estimated from a third order Markov neighborhood modelfBm Mean, variance, lacunarity, skewness and kurtosis derived from the generaGLCM Contrast, correlation, energy, entropy, homogeneity, dissimilarity, inverse d
45�, 90� and 135� directionsRLM Short run emphasis, long run emphasis, gray level non-uniformity, run len
90� and 135� directionsACF Peaks of the horizontal and vertical margins values and associated expone
Fig. 12. Performance comparison for the MNF method against the filter-basedGabor filter (GF), model-based fractional Brownian motion (fBm) and GaussianMarkov random field (GMRF), and statistical-based gray-level co-occurrence matrix(GLCM), run-length matrix (RLM), and autocovariance function (ACF) textureanalysis methods. The blue columns represent the operation of the texturedescriptors on volumetric Nakagami parametric volume of interests, while thered columns are results from conventional ultrasonic intensity B-mode volume ofinterests. (For interpretation of the references to color in this figure legend, thereader is referred to the web version of this article.)
O.S. Al-Kadi et al. / Medical Image Analysis 21 (2015) 59–71 69
focus on discussing three main contributions of our work and theirimportance.
(1) Features of the method which make it novel and how this makesa difference: We have proposed a novel and meaningful frac-tal feature vector representation of ultrasonic signal charac-terization across spatial scales. This uses a multi-scaleanalysis where the voxel lattice is optimized to tumor size.We have also shown that performing the estimation in a vol-umetric fashion improves classification accuracy.The proposed MNF approach simplifies analysis of the higherorder statistics of the speckle texture via investigating differ-ent sub-bands at various decomposition levels using wave-lets that tend to exhibit fractal characteristics. The tailoredspatial-frequency localization provided via the Daubechieswavelet can facilitate the subsequent measurement of (sig-nal) surface roughness while simultaneously filtering outirrelevant speckle features. The resulting fractal featuresquantify the speckle texture. Unlike conventional sub-bandenergy decomposition, sub-resolution level probing via the
ffiffi=25;
ffiffiffi2p
=24;ffiffiffi2p
=23;ffiffiffi2p
=22�
with 4 orientations 0�, 45�, 90� and 135�
ted FD imageifference momentum, maximum probability statistical features derived in the 0�,
gth non-uniformity and run percentage statistical features derived in the 0�, 45�,
ntial fittings of the ACF
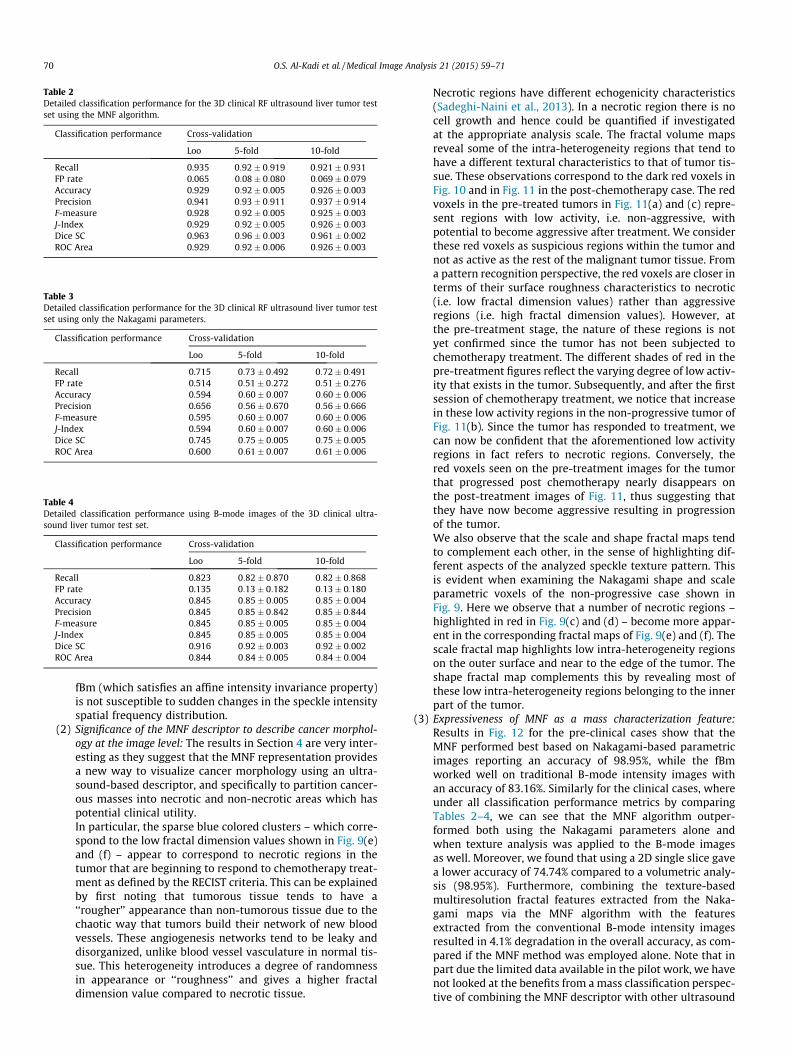
Table 2Detailed classification performance for the 3D clinical RF ultrasound liver tumor testset using the MNF algorithm.
Classification performance Cross-validation
Loo 5-fold 10-fold
Recall 0.935 0:92� 0:919 0:921� 0:931FP rate 0.065 0:08� 0:080 0:069� 0:079Accuracy 0.929 0:92� 0:005 0:926� 0:003Precision 0.941 0:93� 0:911 0:937� 0:914F-measure 0.928 0:92� 0:005 0:925� 0:003J-Index 0.929 0:92� 0:005 0:926� 0:003Dice SC 0.963 0:96� 0:003 0:961� 0:002ROC Area 0.929 0:92� 0:006 0:926� 0:003
Table 3Detailed classification performance for the 3D clinical RF ultrasound liver tumor testset using only the Nakagami parameters.
Classification performance Cross-validation
Loo 5-fold 10-fold
Recall 0.715 0:73� 0:492 0:72� 0:491FP rate 0.514 0:51� 0:272 0:51� 0:276Accuracy 0.594 0:60� 0:007 0:60� 0:006Precision 0.656 0:56� 0:670 0:56� 0:666F-measure 0.595 0:60� 0:007 0:60� 0:006J-Index 0.594 0:60� 0:007 0:60� 0:006Dice SC 0.745 0:75� 0:005 0:75� 0:005ROC Area 0.600 0:61� 0:007 0:61� 0:006
Table 4Detailed classification performance using B-mode images of the 3D clinical ultra-sound liver tumor test set.
Classification performance Cross-validation
Loo 5-fold 10-fold
Recall 0.823 0:82� 0:870 0:82� 0:868FP rate 0.135 0:13� 0:182 0:13� 0:180Accuracy 0.845 0:85� 0:005 0:85� 0:004Precision 0.845 0:85� 0:842 0:85� 0:844F-measure 0.845 0:85� 0:005 0:85� 0:004J-Index 0.845 0:85� 0:005 0:85� 0:004Dice SC 0.916 0:92� 0:003 0:92� 0:002ROC Area 0.844 0:84� 0:005 0:84� 0:004
70 O.S. Al-Kadi et al. / Medical Image Analysis 21 (2015) 59–71
fBm (which satisfies an affine intensity invariance property)is not susceptible to sudden changes in the speckle intensityspatial frequency distribution.
(2) Significance of the MNF descriptor to describe cancer morphol-ogy at the image level: The results in Section 4 are very inter-esting as they suggest that the MNF representation providesa new way to visualize cancer morphology using an ultra-sound-based descriptor, and specifically to partition cancer-ous masses into necrotic and non-necrotic areas which haspotential clinical utility.In particular, the sparse blue colored clusters – which corre-spond to the low fractal dimension values shown in Fig. 9(e)and (f) – appear to correspond to necrotic regions in thetumor that are beginning to respond to chemotherapy treat-ment as defined by the RECIST criteria. This can be explainedby first noting that tumorous tissue tends to have a‘‘rougher’’ appearance than non-tumorous tissue due to thechaotic way that tumors build their network of new bloodvessels. These angiogenesis networks tend to be leaky anddisorganized, unlike blood vessel vasculature in normal tis-sue. This heterogeneity introduces a degree of randomnessin appearance or ‘‘roughness’’ and gives a higher fractaldimension value compared to necrotic tissue.
Necrotic regions have different echogenicity characteristics(Sadeghi-Naini et al., 2013). In a necrotic region there is nocell growth and hence could be quantified if investigatedat the appropriate analysis scale. The fractal volume mapsreveal some of the intra-heterogeneity regions that tend tohave a different textural characteristics to that of tumor tis-sue. These observations correspond to the dark red voxels inFig. 10 and in Fig. 11 in the post-chemotherapy case. The redvoxels in the pre-treated tumors in Fig. 11(a) and (c) repre-sent regions with low activity, i.e. non-aggressive, withpotential to become aggressive after treatment. We considerthese red voxels as suspicious regions within the tumor andnot as active as the rest of the malignant tumor tissue. Froma pattern recognition perspective, the red voxels are closer interms of their surface roughness characteristics to necrotic(i.e. low fractal dimension values) rather than aggressiveregions (i.e. high fractal dimension values). However, atthe pre-treatment stage, the nature of these regions is notyet confirmed since the tumor has not been subjected tochemotherapy treatment. The different shades of red in thepre-treatment figures reflect the varying degree of low activ-ity that exists in the tumor. Subsequently, and after the firstsession of chemotherapy treatment, we notice that increasein these low activity regions in the non-progressive tumor ofFig. 11(b). Since the tumor has responded to treatment, wecan now be confident that the aforementioned low activityregions in fact refers to necrotic regions. Conversely, thered voxels seen on the pre-treatment images for the tumorthat progressed post chemotherapy nearly disappears onthe post-treatment images of Fig. 11, thus suggesting thatthey have now become aggressive resulting in progressionof the tumor.We also observe that the scale and shape fractal maps tendto complement each other, in the sense of highlighting dif-ferent aspects of the analyzed speckle texture pattern. Thisis evident when examining the Nakagami shape and scaleparametric voxels of the non-progressive case shown inFig. 9. Here we observe that a number of necrotic regions –highlighted in red in Fig. 9(c) and (d) – become more appar-ent in the corresponding fractal maps of Fig. 9(e) and (f). Thescale fractal map highlights low intra-heterogeneity regionson the outer surface and near to the edge of the tumor. Theshape fractal map complements this by revealing most ofthese low intra-heterogeneity regions belonging to the innerpart of the tumor.
(3) Expressiveness of MNF as a mass characterization feature:Results in Fig. 12 for the pre-clinical cases show that theMNF performed best based on Nakagami-based parametricimages reporting an accuracy of 98.95%, while the fBmworked well on traditional B-mode intensity images withan accuracy of 83.16%. Similarly for the clinical cases, whereunder all classification performance metrics by comparingTables 2–4, we can see that the MNF algorithm outper-formed both using the Nakagami parameters alone andwhen texture analysis was applied to the B-mode imagesas well. Moreover, we found that using a 2D single slice gavea lower accuracy of 74.74% compared to a volumetric analy-sis (98.95%). Furthermore, combining the texture-basedmultiresolution fractal features extracted from the Naka-gami maps via the MNF algorithm with the featuresextracted from the conventional B-mode intensity imagesresulted in 4.1% degradation in the overall accuracy, as com-pared if the MNF method was employed alone. Note that inpart due the limited data available in the pilot work, we havenot looked at the benefits from a mass classification perspec-tive of combining the MNF descriptor with other ultrasound
O.S. Al-Kadi et al. / Medical Image Analysis 21 (2015) 59–71 71
tissue characterization parameters or image texture featureswhich would be a natural topic to explore in the future.Finally, we comment on three limitations of the currentresearch which can be translated into opportunities forfuture investigation. Firstly, we are currently relying on theconsensus of two radiologists to provide the gold standardand training data. Although we have shown good resultswith our current strategy, of possible concern is that thetraining samples may be mislabelled. This would reducethe accuracy of the results. Future work might look at thesignificance of this and strategies for mitigation. Secondly,fatty livers may result in attenuation of tissue propertiesand it would be interesting to investigate how this affectsMNF classification accuracy. Thirdly, RF characteristics(and hence speckle appearance) tends to differ betweenultrasound devices. It would be interesting to investigatewhether a training set from one ultrasound scanner can beused for classification of images from a different scanneror results are scanner specific.
7. Conclusion
A new approach for assessing tumor heterogeneity via 3Dmulti-fractal multi-scale Nakagami-based feature modeling hasbeen presented which we believe is the first work to considerintra-heterogeneity quantification of a cancerous mass. We esti-mated volumetric Nakagami shape and scale parameters fromwhich the novel fractal descriptor is estimated. Future work willinvestigate the use of the method for both staging liver tumorsand in longitudinal analysis as an image-based biomarker of tumorgrowth and therapeutic response.
Acknowledgments
This work was support by the Engineering and Physical SciencesResearch Council and Wellcome Trust Grant WT 088877/Z/09/Z.The authors would like to thank the anonymous reviewers for theirconstructive comments and suggestions to improve the quality ofthe paper.
Appendix A. Supplementary data
Supplementary data associated with this article can be found, inthe online version, at http://dx.doi.org/10.1016/j.media.2014.12.004.
References
Al-Kadi, O., 2009. Tumour Grading and Discrimination Based on Class Assignmentand Quantitative Texture Analysis Techniques, Thesis, Department ofInformatics.
Al-Kadi, O., Watson, D., 2008. Texture analysis of aggressive and non-aggressivelung tumor CE CT images. IEEE Trans. Biomed. Eng. 55 (7), 1822–1830.
American Cancer Society, 2014. Cancer Facts and Statistics, Report, American CancerSociety. <http://www.cancer.org> (accessed 25.06.14).
Anderson, M.E., Trahey, G.E., 2006. A Seminar on k-Space Applied to MedicalUltrasound, Department of Biomedical Engineering, Duke University.
Bae, Y.H., Mrsny, R.J., Park, K., 2013. Cancer Targeted Drug Delivery: An ElusiveDream, first ed. Springer, New York.
Bamber, J.C., Dickinson, R.J., 1980. Ultrasonic b-scanning – a computer-simulation.Phys. Med. Biol. 25 (3), 463–479.
Bouhlel, N., Sevestre-Ghalila, S., 2009. Nakagami markov random field as texturemodel for ultrasound RF envelope image. Comput. Biol. Med. 39 (6), 535–544.
Cancer Research UK, 2014. Cancer Stats Report – Liver Cancer, Report, CancerResearch UK. <http://www.cancerresearchuk.org> (accessed 25.06.14).
Cheng, J.L., Beaulieu, N.C., 2001. Maximum-likelihood based estimation of theNakagami m parameter. IEEE Commun. Lett. 5 (3), 101–103.
Chicklore, S., Goh, V., Siddique, M., Roy, A., Marsden, P.K., Cook, G.J.R., 2013.Quantifying tumour heterogeneity in f-18-fdg pet/ct imaging by textureanalysis. Eur. J. Nucl. Med. Mol. Imag. 40 (1), 133–140.
Coifman, R.R., Wickerhauser, M.V., 1992. Entropy-based algorithms for best basisselection. IEEE Trans. Inform. Theory 38 (2), 713–718.
Czarnota, G., Sadeghi-Naini, A., Papanicolau, N., Falou, O., Dent, R., Verma, S.,Trudeau, M., Boileau, J.-F., Spayne, J., Iradji, S., Sofroni, E., Lee, J., Lemon-Wong,S., Yaffe, M., Kolios, M., 2013. Quantitative ultrasound evaluation of tumor celldeath response in locally advanced breast cancer patients to chemotherapytreatment administration. J. Acoust. Soc. Am. 133 (5), 3539.
Daubechies, I., 1990. The wavelet transform, time-frequency localization and signalanalysis. IEEE Trans. Inform. Theory 36 (5), 961–1005.
Daubechies, I., 1992. Ten Lectures on Wavelets. Society for Industrial and AppliedMathematics.
Davnall, F., Yip, C.S.P., Ljungqvist, G., Selmi, M., Ng, F., Sanghera, B., Ganeshan, B.,Miles, K.A., Cook, G.J., Goh, V., 2012. Assessment of tumor heterogeneity: anemerging imaging tool for clinical practice? Insights Imag. 3 (6), 573–589.
De Grandi, G., Lee, J.S., Schuler, D., Nezry, E., 2003. Texture and speckle statistics inpolarimetric SAR synthesized images. IEEE Trans. Geosci. Remote Sens. 41 (9),2070–2088.
Eisenhauer, E.A., Therasse, P., Bogaerts, J., Schwartz, L.H., Sargent, D., Ford, R.,Dancey, J., Arbuck, S., Gwyther, S., Mooney, M., Rubinstein, L., Shankar, L., Dodd,L., Kaplan, R., Lacombe, D., Verweij, J., 2009. New response evaluation criteria insolid tumours: revised recist guideline (version 1.1). Eur. J. Cancer 45 (2), 228–247.
Ferlay, J., Steliarova-Foucher, E., Lortet-Tieulent, J., Rosso, S., Coebergh, J.W.W.,Comber, H., Forman, D., Bray, F., 2013. Cancer incidence and mortality patternsin Europe: estimates for 40 countries in 2012. Eur. J. Cancer 49 (6), 1374–1403.
Klein, T., Hansson, M., Navab, N., 2011. Spatial statistics based feature descriptor forRF ultrasound data. In: 2011 8th IEEE International Symposium on BiomedicalImaging: From Nano to Macro. IEEE International Symposium on BiomedicalImaging. IEEE, New York, pp. 33–36.
Larrue, A., Noble, J.A., 2011. Nakagami imaging with small windows. In: 2011 8thIEEE International Symposium on Biomedical Imaging: From Nano to Macro.IEEE International Symposium on Biomedical Imaging. IEEE, New York, pp. 887–890.
Larrue, A., Noble, J.A., 2014. Modeling of errors in Nakagami imaging: illustration onbreast mass characterization. Ultrasound Med. Biol. 40, 917–930.
Lopes, R., Betrouni, N., 2009. Fractal and multifractal analysis: a review. Med. ImageAnal. 13 (4), 634–649.
Madabhushi, A., Metaxas, D.N., 2003. Combining low-, high-level and empiricaldomain knowledge for automated segmentation of ultrasonic breast lesions.IEEE Trans. Med. Imag. 22 (2), 155–169.
Mallat, S.G., 1999. A Wavelet Tour of Signal Processing, second ed. Academic Press.Noble, J.A., 2010. Ultrasound image segmentation and tissue characterization. Proc.
Inst. Mech. Eng. Part H-J. Eng. Med. 224 (H2), 307–316.Parkin, D.M., Bray, F., Ferlay, J., Jemal, A., 2014. Cancer in africa 2012. Cancer
epidemiology, biomarkers and prevention: a publication of the AmericanAssociation for Cancer Research, cosponsored by the American Society ofPreventive Oncology 23(6), 953–66.
Rangayyan, R.M., 2005. Biomedical Image Analysis, first ed. CRC.Sadeghi-Naini, A., Falou, O., Czarnota, G.J., 2013. Characterizing tumor
heterogeneous response to chemotherapy using low-frequency ultrasonicspectroscopy. J. Acoust. Soc. Am. 133 (5), 3584.
Sanches, J.M., Laine, A.F., Suri, J.S., 2011. Ultrasound Imaging: Advances andApplications, first ed. Springer, New York.
Shankar, P.M., 2000. A general statistical model for ultrasonic backscattering fromtissues. IEEE Trans. Ultrason. Ferr. Freq. Control 47 (3), 727–736.
Shankar, P.M., Dumane, V.A., Reid, J.M., Genis, V., Forsberg, F., Piccoli, C.W.,Goldberg, B.B., 2001. Classification of ultrasonic B-mode images of breastmasses using Nakagami distribution. IEEE Trans. Ultrason. Ferr. Freq. Control 48(2), 569–580.
Sheet, D., Karamalis, A., Eslami, A., Noel, P., Chatterjee, J., Ray, A.K., Laine, A.F.,Carlier, S.G., Navab, N., Katouzian, A., 2014. Joint learning of ultrasonicbackscattering statistical physics and signal confidence primal forcharacterizing atherosclerotic plaques using intravascular ultrasound. Med.Image Anal. 18 (1), 103–117.
Tsui, P.H., Liao, Y.Y., Chang, C.C., Kuo, W.H., Chang, K.J., Yeh, C.K., 2010. Classification ofbenign and malignant breast tumors by 2-d analysis based on contour descriptionand scatterer characterization. IEEE Trans. Med. Imag. 29 (2), 513–522.
Tsui, P.H., Yeh, C.K., Liao, Y.Y., Chang, C.C., Kuo, W.H., Chang, K.J., Chen, C.N., 2010.Ultrasonic Nakagami imaging: a strategy to visualize the scatterer properties ofbenign and malignant breast tumors. Ultrasound Med. Biol. 36 (2), 209–217.
Tsui, P.-H., Ma, H.-Y., Zhou, Z., Ho, M.-C., Lee, Y.-H., 2014. Window-modulatedcompounding Nakagami imaging for ultrasound tissue characterization.Ultrasonics 54 (6), 1448–1459.
Ueta, M., Sugama, J., Konya, C., Matsuo, J., Matsumoto, M., Yabunaka, K., Nakatani, T.,Tabata, K., 2011. Use of ultrasound in assessment of necrotic tissue in pressureulcers with adjacent undermining. J. Wound Care 20 (11), 503–508.
Wang, Z.Z., Yong, J.H., 2008. Texture analysis and classification with linearregression model based on wavelet transform. IEEE Trans. Image Process. 17(8), 1421–1430.
World Health Organization: International Agency for Research on Cancer, 2012.Globocan 2012: Estimated Cancer Incidence, Mortality and PrevalenceWorldwide in 2012, Report, World Health Organization. <http://globocan.iarc.fr> (accessed 25.06.14).
Zhou, Y.F., Kassab, G.S., Molloi, S., 2002. In vivo validation of the design rules of thecoronary arteries and their application in the assessment of diffuse disease.Phys. Med. Biol. 47 (6), 977–993.
Related Documents