WATERSHED SEDIMENT SOURCE IDENTIFICATION: TOOLS, APPROACHES, AND CASE STUDIES Quantification of seasonal sediment and phosphorus transport dynamics in an agricultural watershed using radiometric fingerprinting techniques Natalie L. H. Huisman & K. G. Karthikeyan & Jasmeet Lamba & Anita M. Thompson & Graham Peaslee Received: 1 March 2013 /Accepted: 5 August 2013 # Springer-Verlag Berlin Heidelberg 2013 Abstract Purpose Phosphorus (P) is a limiting nutrient for most US Midwestern aquatic systems and, therefore, increases of P, through point or non-point sources (NPS) of pollution such as agriculture, causes eutrophication. Identifying specific NPS contributions (e.g., upland vs. stream channels) for sediments and P is difficult due to the distributed nature of the pollution. Therefore, studies which link the spatial and temporal aspects of sediment and P transport in these systems can help better characterize the extent of NPS pollution. Materials and methods Our study used fingerprinting tech- niques to determine sources of sediments in an agricultural watershed (the North Fork of the Pheasant Branch watershed; 12.4 km 2 area) in Wisconsin, USA, during the spring, sum- mer, and fall seasons of 2009. The primary sources considered were uplands (cultivated fields), stream bank, and streambed. The model used fallout radionuclides, 137 Cs, and 210 Pb xs , along with total P to determine primary sediment sources. A shorter-lived fallout radioisotope, 7 Be, was used to determine the sediment age and percent new sediments in streambed and suspended sediment samples (via the 7 Be/ 210 Pb xs ratio). Results and discussion Upland areas were the primary source of suspended sediments in the stream channels followed by stream banks. The sediment age and percent new sediment for the streambed and suspended sediments showed that the channel contained and transported newer (or more recently tagged with 7 Be) sediments in the spring season (9–131 days sediment age), while relatively old sediments (165–318 days) were moving through the channel system during the fall season. Conclusions Upland areas are the major contributors to in- stream suspended sediments in this watershed. Sediment resuspension in stream channels could play an important role during the later part of the year. Best management practices should be targeted in the upland areas to reduce the export of sediments and sediment-bound P from agricultural watersheds. Keywords Fallout radionuclides . Phosphorus . Sediment fingerprinting . Sediment sources 1 Introduction Non-point sources (NPS) of pollution are difficult to identify and control because their extent is determined by complex interactions between spatial and temporal factors. The NPS pollution associated with phosphorus (P) is of particular con- cern because P is generally the limiting nutrient in most US Midwestern fresh water ecosystems (Haygarth et al. 2005), with agricultural NPS being the dominant P contributor for rural areas. A primary pathway for P transport in agricultural systems is via the particulate phase where P is associated with eroded sediments. Stone and Mudroch (1989) showed that for the lower Great Lakes, North America, approximately 75% of the total P (TP) loading was from particulate-bound P. Responsible editor: Rajith Mukundan Electronic supplementary material The online version of this article (doi:10.1007/s11368-013-0769-0) contains supplementary material, which is available to authorized users. N. L. H. Huisman Department of Chemistry, Union College, Schenectady, NY 12308, USA K. G. Karthikeyan (*) : J. Lamba : A. M. Thompson Department of Biological Systems Engineering, University of Wisconsin-Madison, Madison, WI 53706, USA e-mail: [email protected] G. Peaslee Department of Chemistry, Hope College, Holland, MI 49422, USA J Soils Sediments DOI 10.1007/s11368-013-0769-0

Welcome message from author
This document is posted to help you gain knowledge. Please leave a comment to let me know what you think about it! Share it to your friends and learn new things together.
Transcript
WATERSHED SEDIMENT SOURCE IDENTIFICATION: TOOLS, APPROACHES, AND CASE STUDIES
Quantification of seasonal sediment and phosphorus transportdynamics in an agricultural watershed using radiometricfingerprinting techniques
Natalie L. H. Huisman & K. G. Karthikeyan &
Jasmeet Lamba & Anita M. Thompson & Graham Peaslee
Received: 1 March 2013 /Accepted: 5 August 2013# Springer-Verlag Berlin Heidelberg 2013
AbstractPurpose Phosphorus (P) is a limiting nutrient for most USMidwestern aquatic systems and, therefore, increases of P,through point or non-point sources (NPS) of pollution suchas agriculture, causes eutrophication. Identifying specific NPScontributions (e.g., upland vs. stream channels) for sedimentsand P is difficult due to the distributed nature of the pollution.Therefore, studies which link the spatial and temporal aspectsof sediment and P transport in these systems can help bettercharacterize the extent of NPS pollution.Materials and methods Our study used fingerprinting tech-niques to determine sources of sediments in an agriculturalwatershed (the North Fork of the Pheasant Branch watershed;12.4 km2 area) in Wisconsin, USA, during the spring, sum-mer, and fall seasons of 2009. The primary sources consideredwere uplands (cultivated fields), stream bank, and streambed.The model used fallout radionuclides, 137Cs, and 210Pbxs,along with total P to determine primary sediment sources. Ashorter-lived fallout radioisotope, 7Be, was used to determine
the sediment age and percent new sediments in streambed andsuspended sediment samples (via the 7Be/210Pbxs ratio).Results and discussion Upland areas were the primary sourceof suspended sediments in the stream channels followed bystream banks. The sediment age and percent new sediment forthe streambed and suspended sediments showed that thechannel contained and transported newer (or more recentlytagged with 7Be) sediments in the spring season (9–131 dayssediment age), while relatively old sediments (165–318 days)were moving through the channel system during the fallseason.Conclusions Upland areas are the major contributors to in-stream suspended sediments in this watershed. Sedimentresuspension in stream channels could play an important roleduring the later part of the year. Best management practicesshould be targeted in the upland areas to reduce the export ofsediments and sediment-bound P from agricultural watersheds.
Keywords Fallout radionuclides . Phosphorus . Sedimentfingerprinting . Sediment sources
1 Introduction
Non-point sources (NPS) of pollution are difficult to identifyand control because their extent is determined by complexinteractions between spatial and temporal factors. The NPSpollution associated with phosphorus (P) is of particular con-cern because P is generally the limiting nutrient in most USMidwestern fresh water ecosystems (Haygarth et al. 2005),with agricultural NPS being the dominant P contributor forrural areas. A primary pathway for P transport in agriculturalsystems is via the particulate phase where P is associated witheroded sediments. Stone and Mudroch (1989) showed that forthe lower Great Lakes, North America, approximately 75% ofthe total P (TP) loading was from particulate-bound P.
Responsible editor: Rajith Mukundan
Electronic supplementary material The online version of this article(doi:10.1007/s11368-013-0769-0) contains supplementary material,which is available to authorized users.
N. L. H. HuismanDepartment of Chemistry, Union College,Schenectady, NY 12308, USA
K. G. Karthikeyan (*) : J. Lamba :A. M. ThompsonDepartment of Biological Systems Engineering,University of Wisconsin-Madison,Madison, WI 53706, USAe-mail: [email protected]
G. PeasleeDepartment of Chemistry, Hope College,Holland, MI 49422, USA
J Soils SedimentsDOI 10.1007/s11368-013-0769-0
To successfully reduce sediment loads to receiving waters,the sources contributing to suspended sediments must beidentified. Information on the relative contribution of differentsediment sources is also important in effective implementationof management practices, establishing watershed sedimentbudgets, and development of watershed scale models forsediment yield (Mukundan et al. 2012). Significant amountsof eroded sediments can be stored in channel beds and flood-plains before suspended sediments are routed to the watershedoutlet (Collins and Walling 2007). Quantification of sedimentstorage times in channels is important to determine the “lagtime” between best management practices (BMP) implemen-tation and achievement of desired water quality goals(Osmond et al. 2012). Studies that can determine the spatial(i.e., sediment origin) and temporal (i.e., sediment storagetimes) aspects of sediment transport are also critical to betterunderstand NPS transport processes.
Sediment fingerprinting techniques are commonly used toidentify the relative contribution of different sources tosuspended sediments. Fallout radionuclides [e.g., 137Cs (t1/2=30 years), 7Be (t1/2=53.3 days),
210Pbxs (t1/2=22.3 years)] canhelp establish a unique signature (or fingerprint) for differentsources (or land uses), which can then be related to the signa-ture for suspended sediments to isolate the relative contribu-tions from each source (Walling and Woodward 1992; Olleyet al. 1993; Collins et al. 1997; Matisoff et al. 2002; Wallbrinket al. 2003; Huisman and Karthikeyan 2012). The knowledgeof in-stream sediment transport processes, such as storage offine sediments on the channel bed and resuspension, is impor-tant to quantify sediment delivery to the watershed outlet anddevelop watershed sediment budgets (Walling and Collins2008). The fallout radionuclides, specifically, 7Be and210Pbxs, can also be used to better understand in-stream sedi-ment processes over individual rainfall events or short-termscales (Fitzgerald et al. 2001; Matisoff et al. 2005). Bonniwellet al. (1999) used the 7Be/210Pbxs ratio in the Gold Riverwatershed in west central Idaho, USA, to determine thefraction of new sediments in suspension and the transportdistance of fine sediments. Fitzgerald et al. (2001) used 7Beinventory to quantify streambed erosion/resuspension rates.The 7Be/210Pbxs ratio was also used by Matisoff et al. (2005)in three different watersheds to determine sediment age andpercent new sediments.
It is, therefore, evident that fallout radionuclides can beused to apportion sources of in-stream suspended sedimentsand better understand in-stream sediment dynamics. The sed-iment sources, sinks and fluxes, however, are highly variablein time and space (Trimble 1999). Therefore, studies whichinclude both spatial and temporal aspects of sediment trans-port are needed to achieve a more complete understanding ofsediment dynamics. However, studies containing these spatialand temporal aspects, as well as focusing on the impact ofanimal agriculture, are rare.
Upland management practices (i.e., cropping system, till-age type, and manure timing) impact soil erosion processes,which in turn affect the partitioning of P between dissolved vs.particulate forms during a runoff event. Sediment depositionon channel beds and subsequent remobilization exert an im-portant influence on the routing, transport, and fate of partic-ulate phosphorus (PP) in river basins (Owens and Walling2002). Suspended sediments and sediments deposited on thechannel bed could also influence the dissolved P concentra-tions in the streams (Owens and Walling 2002). The P storedin sediments can be re-released as dissolved P after reductionsin soluble P in the overlying water (Jarvie et al. 2005). Thespatial and temporal nutrient transport patterns from agricul-tural upland areas through the watershed drainage system canbe quite complex. A more complete understanding of bothupland P transport and in-stream dynamics is needed to ad-dress the problem of eutrophication in downstream waterbodies and nutrient losses in agricultural systems. Therefore,the major goal of this study is to systematically evaluate the in-stream processes (sediment age and percent new sediment)controlling sediment and P transport in an agricultural water-shed containing sub-watersheds with differing animal densi-ties at varying watershed scales (i.e., first, second, and thirdstream orders) during an entire growing season (spring, sum-mer, and fall).
2 Methods
2.1 Study site
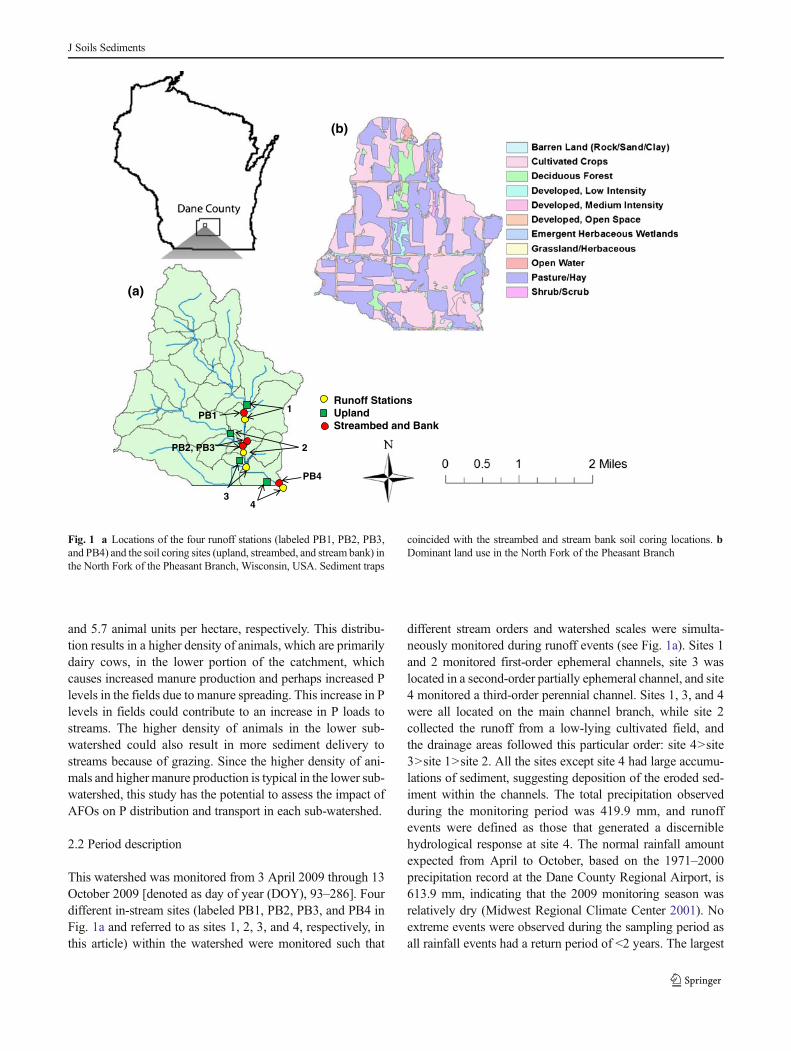
The Pheasant Branch watershed is a headwater sub-watershedof the Lake Mendota watershed located in Dane County,Wisconsin, USA. It is an agricultural watershed with flat torolling hill terrain and dominated by silt loam soils (FitzHughand Mackay 2000). The study site is the North Fork of thePheasant Branch watershed (12.4 km2; Fig. 1a). The NorthFork has an average slope of 6% and consists largely of dairyfarms with a predominance of corn and alfalfa fields (Chenand Mackay 2004). The streams in this watershed are filledwith tall grass which is fairly homogeneous throughout withrelatively few pools. The stream banks are typically verystable, and very few exposed eroding stream banks exist.Lake Mendota is a eutrophic lake that has been studied since1894 (Lathrop 2007). The dissolved reactive phosphorus(DRP) levels in Lake Mendota are higher than acceptable,and agricultural NPS is a significant contributor to these highP concentrations (Lathrop 2007). The watershed land usage ispredominantly agricultural where 42% is pasture/hay and46% is cultivated crops (Homer et al. 2007; see Fig. 1b).The watershed is unique because the upper and lower sub-watersheds are characterized by both small and large dairyanimal farm operations (AFOs) with animal densities of 1.2
J Soils Sediments
and 5.7 animal units per hectare, respectively. This distribu-tion results in a higher density of animals, which are primarilydairy cows, in the lower portion of the catchment, whichcauses increased manure production and perhaps increased Plevels in the fields due to manure spreading. This increase in Plevels in fields could contribute to an increase in P loads tostreams. The higher density of animals in the lower sub-watershed could also result in more sediment delivery tostreams because of grazing. Since the higher density of ani-mals and higher manure production is typical in the lower sub-watershed, this study has the potential to assess the impact ofAFOs on P distribution and transport in each sub-watershed.
2.2 Period description
This watershed was monitored from 3 April 2009 through 13October 2009 [denoted as day of year (DOY), 93–286]. Fourdifferent in-stream sites (labeled PB1, PB2, PB3, and PB4 inFig. 1a and referred to as sites 1, 2, 3, and 4, respectively, inthis article) within the watershed were monitored such that
different stream orders and watershed scales were simulta-neously monitored during runoff events (see Fig. 1a). Sites 1and 2 monitored first-order ephemeral channels, site 3 waslocated in a second-order partially ephemeral channel, and site4 monitored a third-order perennial channel. Sites 1, 3, and 4were all located on the main channel branch, while site 2collected the runoff from a low-lying cultivated field, andthe drainage areas followed this particular order: site 4>site3>site 1>site 2. All the sites except site 4 had large accumu-lations of sediment, suggesting deposition of the eroded sed-iment within the channels. The total precipitation observedduring the monitoring period was 419.9 mm, and runoffevents were defined as those that generated a discerniblehydrological response at site 4. The normal rainfall amountexpected from April to October, based on the 1971–2000precipitation record at the Dane County Regional Airport, is613.9 mm, indicating that the 2009 monitoring season wasrelatively dry (Midwest Regional Climate Center 2001). Noextreme events were observed during the sampling period asall rainfall events had a return period of <2 years. The largest
Runoff StationsUplandStreambed and Bank
(a)
(b)
PB1
PB2, PB3
PB4
43
2
1
Fig. 1 a Locations of the four runoff stations (labeled PB1, PB2, PB3,and PB4) and the soil coring sites (upland, streambed, and stream bank) inthe North Fork of the Pheasant Branch, Wisconsin, USA. Sediment traps
coincided with the streambed and stream bank soil coring locations. bDominant land use in the North Fork of the Pheasant Branch
J Soils Sediments
storm event observed during the period was on 22 September2009 and had a return period of 1.6 years, and the secondlargest event, which occurred on 25 April 2009, had a returnperiod of 0.6 year (Huff and Angel 1992). The average dis-charge observed at site 4 during the monitoring period was443 m3 day−1.
2.3 Soil core and suspended sediment collection and analysis
Core sampling locations within the catchment were selected toobtain a fairly robust and representative set of radiometricprofiles. Four upland soil core sites (from either alfalfa or cornfields) were selected based on their proximity to the stream andstorm flow stations using a 30-m digital elevation model(DEM), which helped identify locations in concentrated flowpaths. A representative upland surface composite soil core wasobtained on 3 April 2009 by combining six individual cores[inner diameter (ID), 2.0 cm] sectioned to 0–1 cm. Streambedand stream bank locations were situated near runoff stationsand upland coring sites (see Fig. 1a). Three stream bank cores(ID, 4.7 cm; 0–1 cm depth) were collected at each site andcombined on 3 April 2009 from exposed stream banks.Similarly, three streambed cores (ID, 4.7 cm; 0–1 cm depth)were collected and combined. All the streambed cores for thisstudy were taken at the center of the channel from depositionalzones. This sampling design permitted the generation of sourcesignatures for the surface sediments of the upland, stream bank,and streambed locations. To generate temporal information onsediment movement within the stream system, the streambedcores (three composited 0–1-cm sections) were collected fromthe same sites on a monthly basis starting on 3 April 2009 andsubsequently on 29 April, 28 May, 30 June, 5 August, 8September, and 13 October 2009. These additional streambedsamples helped determine the sediment age and percent newsediment over the entire sampling period as well as monitorchanges in the source signature.
Following the methods from Huisman and Karthikeyan(2012), each core sample was dried at 60 °C to obtain bulkdensity (grams per cubic centimeter), and then subsequentlycrushed and sieved (<63 μm) for further analysis. The upland,stream bank, and streambed 0–1-cm sections collected on 3April 2009 were used to create a source signature for 210Pbxs,137Cs, and TP. In addition, each monthly streambed core(except for 30 June) was analyzed for 7Be.
Soils/sediments were analyzed for 210Pbxs,137Cs, and 7Be
by counting the sediments for 24 h at Hope College (Holland,MI, USA) using a low-background, high-purity Germaniumdetector. Organic content of each sample was obtained using atwo-stage loss-on-ignition (LOI500) method where the sedi-ment (1 g) was dehydrated at 105 °C for 24 h and subsequent-ly ashed at 550 °C for 4 h (Christensen andMalmros 1982). ABeckman-Coulter LS-230 particle size analyzer (BeckmanCoulter, Inc., Miami, FL, USA) was used to determine the
particle size distribution (<63 μm) of dispersed sediments(50 g l−1 sodium hexametaphosphate).
A concentrated sulfuric and nitric acid digestion was usedto obtain TP measurements for each soil sample (Lachat BD-46 block digestor; Hach Company, Loveland, CO, USA;Eaton et al. 2005). Following the acid digestions, a flowinjection analysis (FIA) autoanalyzer (Lachat QuikChem®8000 series; Hach Company, Loveland, CO, USA) quantifiedorthophosphate at 880 nm using the molybdate-based colori-metric method (Murphy and Riley 1962). The recommenda-tions from StandardMethods (2005) for glassware and samplepreparation methods for P determination were followed.
Phillips et al. (2000) describe a passive suspended sedimentsampler which contains a small inlet and an outlet with a largecavity in between. This sampler is designed to reduce the flowvelocity significantly causing sediments to accumulate in thelarge cavity. These samplers have been shown to trap sedi-ments that are representative, both physically and geochemi-cally, of the stream sediments for the duration of deployment(Phillips et al. 2000; Russell et al. 2000). These sediment trapshave been used in several prior studies (McDowell andWilcock 2004; McDowell and Wilcock 2007; Walling et al.2008; Huisman and Karthikeyan 2012). Furthermore, they areinexpensive to construct and by accumulating sediments overthe entire deployment period enable collecting a time-integrated sample (an advantage over grab sampling). Wemodified the sediment traps to improve performance in theephemeral channels (Huisman and Karthikeyan 2012); a 30-cm bleed tube (ID, 4 mm) was attached to the top of thesampler (downstream end) to allow air to escape when thesampler was filling up during the flow event.
Sediment traps were placed near each streambed and soilcoring location (see Fig. 1a). The sediment trap deploymentperiods typically coincided with streambed and stream banksampling dates such that the initial deployment was on 3 April2009 and sediment retrieval was on 22 April, 29 April, 28May, 30 June, 5 August, 8 September, and 13 October 2009.The sediment traps were only deployed and collected duringbaseflow conditions. Sedimentation and centrifugation tech-niques (1,100 rpm for 15 min; 120.1 g) were used to isolatethe collected suspended sediments. Prior to analysis for 7Be,210Pbxs,
137Cs, TP, LOI500, and particle size distribution, thesuspended sediments were dried (60 °C) and sieved (<63 μm).
2.4 Precipitation collection
Wet and dry atmospheric fallout of 7Be and 210Pbxs werecollected at site 3 using two 20-l plastic containers mounted1 m above the ground. Each container contained 500 ml of10%HCl to prevent sorption of 7Be and 210Pbxs to the walls ofthe sampling container (Matisoff et al. 2005). The initialdeployment coincided with the initial soil sample collection(3 April 2009), and the precipitation sample was retrieved on
J Soils Sediments

the same dates as the suspended sediment collection (seeSection 2.3). The two containers were pooled for analysis,stored at 5 °C, and the isotopes were isolated using a techniqueoutlined by Matisoff et al. (2005) where 10% w /v FeCl3 wasinitially added to the sample, followed by the addition of 10MNaOH to increase the solution to pH 8, at which point red/brown flocs formed, which were subsequently isolated using aseparatory funnel. The red/brown flocs were then dried(60 °C), sieved (<63 μm), and analyzed for 7Be and 210Pbxsusing gamma spectroscopy.
2.5 Sediment age and percent new sediment
The “sediment age”was determined byMatisoff et al. (2005) asa function of the 7Be/210Pbxs ratio such that when the7Be/210Pbxs ratio decreases, the sediment age increases.Decreases in the 7Be/210Pbxs ratio are typically caused by (a)7Be decay as sediments are stored in the watershed (i.e., stream-bed storage) and (b) mixing of 7Be-rich sediments with 7Be-deficient sediments (i.e., bank collapse; Matisoff et al. 2005).The sediment age was defined by Matisoff et al. (2005) as:
t ¼ −1ðλ7Be−λ210PbÞ
lnA
B
� �þ 1
λ7Be−λ210Pbð Þ lnAo
Bo
� �ð1Þ
where t (days) is the age of the sediment; λ7Be (0.01300 day−1)is the decay constant for 7Be; λ210Pb (8.50999×10⁻⁵ day−1) isthe decay constant for 210Pbxs; A (millibecquerel per gram) isthe activity of 7Be in the sample; Ao (millibecquerel per gram)is the activity of 7Be in the source (i.e., precipitation); B(millibecquerel per gram) is the activity of 210Pb in the sample;and Bo (millibecquerel per gram) is the activity of 210Pb in thesource (Matisoff et al. 2005). Ayounger sediment age indicatesa recently “tagged” sample that received more recent input of7Be from precipitation (i.e., a sediment age of 0 day wouldcorrespond to initial 7Be input).
The 7Be/210Pbxs ratio can also be used to calculate the“percent new sediment,”which has an inverse relationship withthe 7Be/210Pbxs ratio. Matisoff et al. (2005) defined the percentnew sediment as:
Percent“new”sediment ¼ 100 x A=Bð Þ= Ao=Boð Þ ð2Þ
The percent new sediment helps determine the extent ofdilution of the new (7Be-rich) sediments with old (7Be-defi-cient) sediments (i.e., bank collapse).
2.6 Sediment origin
By establishing a fingerprint of the sources (e.g., upland soils,streambed, and stream bank sediments) using fallout radionu-clides, the contribution of these sources to suspended sediments
can be quantified (Walling and Woodward 1992; Wallbrinket al. 2003). Three sources were considered in this study:surficial upland soil (cultivated fields), stream bank, andstreambed sediments. There is little evidence for subsurfacesediment transport (i.e., very few tile drains and flat topographynear the stream), so this was not considered a likely transportpathway. The upland, stream bank, and streambed sedimentswere sampled at the beginning of the study period (3 April2009), and subsequent monthly measurements of streambedsediments were performed to account for changes in thisdynamic flow system. The sediment tracers used in thisstudy, which have also been used in previous sourcingstudies, were 137Cs, 210Pbxs, and TP. These tracers stronglysorb to sediments and, therefore, have distinguishing signaturesfor each source (Wallbrink et al. 2003; Walling et al. 2008).
The source fingerprints were determined by using the mean137Cs, 210Pbxs, and TP values for each source (n =4; 0–1-cmsections). A particle size correction was performed using thespecific surface area (SSA) based on the work of Collins et al.(1997) to account for preferential transport of finer sediments.The correction factor was determined from the ratio of themean SSA for suspended sediments collected at each traplocation to the mean SSA for the corresponding source sam-ples. Since the streambed is expected to be a dynamic system,only the streambed source signature for the immediate pre-ceding period was used in the calculations. For example, thestreambed signature from 3 April 2009 was used in the sedi-ment origin calculations for suspended sediments collected on22 and 29 April 2009, and then the 29 April 2009 streambedsignature was used in the 28 May 2009 suspended sedimentcalculations.
A linear model based on Collins et al. (1997) andWallbrinket al. (2003) was used to determine the sediment origin fromthree different sources (stream bank, streambed, and uplandsurface soil) using the sediment tracers TP, 210Pbxs, and
137Cs:
Xi¼1
n PUSiURU þ PBSiBRB þ PSSiSRSð Þ−Cif gCi
�������� ð3Þ
where Ci is the concentration of the sediment tracer (i ; TP,210Pbxs and
137Cs) in the suspended sediments; Si is the meanconcentration of the sediment tracer (i ) in the source (U=upland, B=stream bank, and S=streambed); P is the particlesize correction for each source (see above); and R is thepercent contribution from each source, which is constrainedto sum to unity [RU+RB+RS=1; as described in Huisman andKarthikeyan (2012)].
2.7 Statistical analysis
Statistical analyses were performed using Minitab15®, and allp values were obtained using the general linear model, which
J Soils Sediments
is a type of analysis of variance (ANOVA) technique. No datatransformations were needed as the residuals were normallydistributed. Statistical significancewas foundwhenα was <0.05.
3 Results
3.1 Soil and sediment characteristics
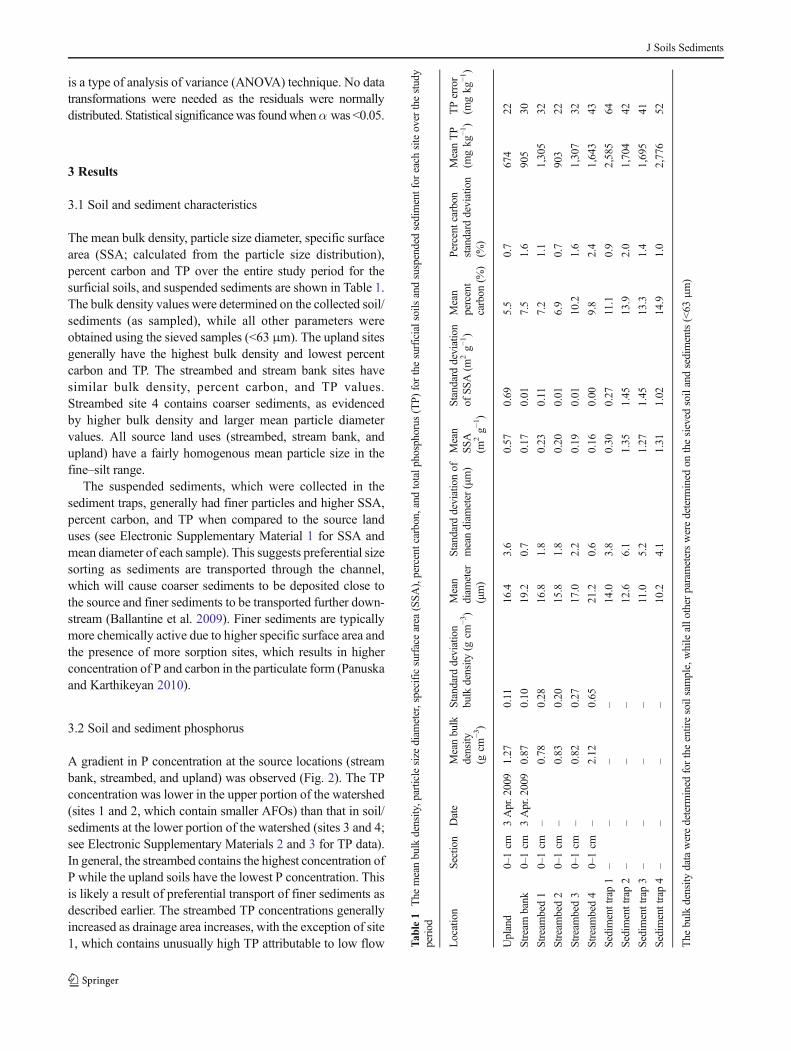
The mean bulk density, particle size diameter, specific surfacearea (SSA; calculated from the particle size distribution),percent carbon and TP over the entire study period for thesurficial soils, and suspended sediments are shown in Table 1.The bulk density values were determined on the collected soil/sediments (as sampled), while all other parameters wereobtained using the sieved samples (<63 μm). The upland sitesgenerally have the highest bulk density and lowest percentcarbon and TP. The streambed and stream bank sites havesimilar bulk density, percent carbon, and TP values.Streambed site 4 contains coarser sediments, as evidencedby higher bulk density and larger mean particle diametervalues. All source land uses (streambed, stream bank, andupland) have a fairly homogenous mean particle size in thefine–silt range.
The suspended sediments, which were collected in thesediment traps, generally had finer particles and higher SSA,percent carbon, and TP when compared to the source landuses (see Electronic Supplementary Material 1 for SSA andmean diameter of each sample). This suggests preferential sizesorting as sediments are transported through the channel,which will cause coarser sediments to be deposited close tothe source and finer sediments to be transported further down-stream (Ballantine et al. 2009). Finer sediments are typicallymore chemically active due to higher specific surface area andthe presence of more sorption sites, which results in higherconcentration of P and carbon in the particulate form (Panuskaand Karthikeyan 2010).
3.2 Soil and sediment phosphorus
A gradient in P concentration at the source locations (streambank, streambed, and upland) was observed (Fig. 2). The TPconcentration was lower in the upper portion of the watershed(sites 1 and 2, which contain smaller AFOs) than that in soil/sediments at the lower portion of the watershed (sites 3 and 4;see Electronic Supplementary Materials 2 and 3 for TP data).In general, the streambed contains the highest concentration ofP while the upland soils have the lowest P concentration. Thisis likely a result of preferential transport of finer sediments asdescribed earlier. The streambed TP concentrations generallyincreased as drainage area increases, with the exception of site1, which contains unusually high TP attributable to low flow T
able1
The
meanbulk
density,particlesize
diam
eter,specificsurfacearea
(SSA
),percentcarbon,andtotalp
hosphorus(TP)
forthesurficialsoilsandsuspendedsedimentfor
each
siteover
thestudy
period
Location
Sectio
nDate
Meanbulk
density
(gcm
−3)
Standard
deviation
bulk
density
(gcm
−3)
Mean
diam
eter
(μm)
Standard
deviationof
meandiam
eter
(μm)
Mean
SSA
(m2g−
1)
Standard
deviation
ofSS
A(m
2g−
1)
Mean
percent
carbon
(%)
Percent
carbon
standard
deviation
(%)
MeanTP
(mgkg
−1)
TPerror
(mgkg
−1)
Upland
0–1cm
3Apr.2009
1.27
0.11
16.4
3.6
0.57
0.69
5.5
0.7
674
22
Stream
bank
0–1cm
3Apr.2009
0.87
0.10
19.2
0.7
0.17
0.01
7.5
1.6
905
30
Stream
bed1
0–1cm
–0.78
0.28
16.8
1.8
0.23
0.11
7.2
1.1
1,305
32
Stream
bed2
0–1cm
–0.83
0.20
15.8
1.8
0.20
0.01
6.9
0.7
903
22
Stream
bed3
0–1cm
–0.82
0.27
17.0
2.2
0.19
0.01
10.2
1.6
1,307
32
Stream
bed4
0–1cm
–2.12
0.65
21.2
0.6
0.16
0.00
9.8
2.4
1,643
43
Sedimenttrap1
––
––
14.0
3.8
0.30
0.27
11.1
0.9
2,585
64
Sedimenttrap2
––
––
12.6
6.1
1.35
1.45
13.9
2.0
1,704
42
Sedimenttrap3
––
––
11.0
5.2
1.27
1.45
13.3
1.4
1,695
41
Sedimenttrap4
––
––
10.2
4.1
1.31
1.02
14.9
1.0
2,776
52
The
bulk
density
dataweredeterm
ined
fortheentiresoilsample,whileallo
ther
parametersweredeterm
ined
onthesieved
soilandsediments(<63
μm)
J Soils Sediments
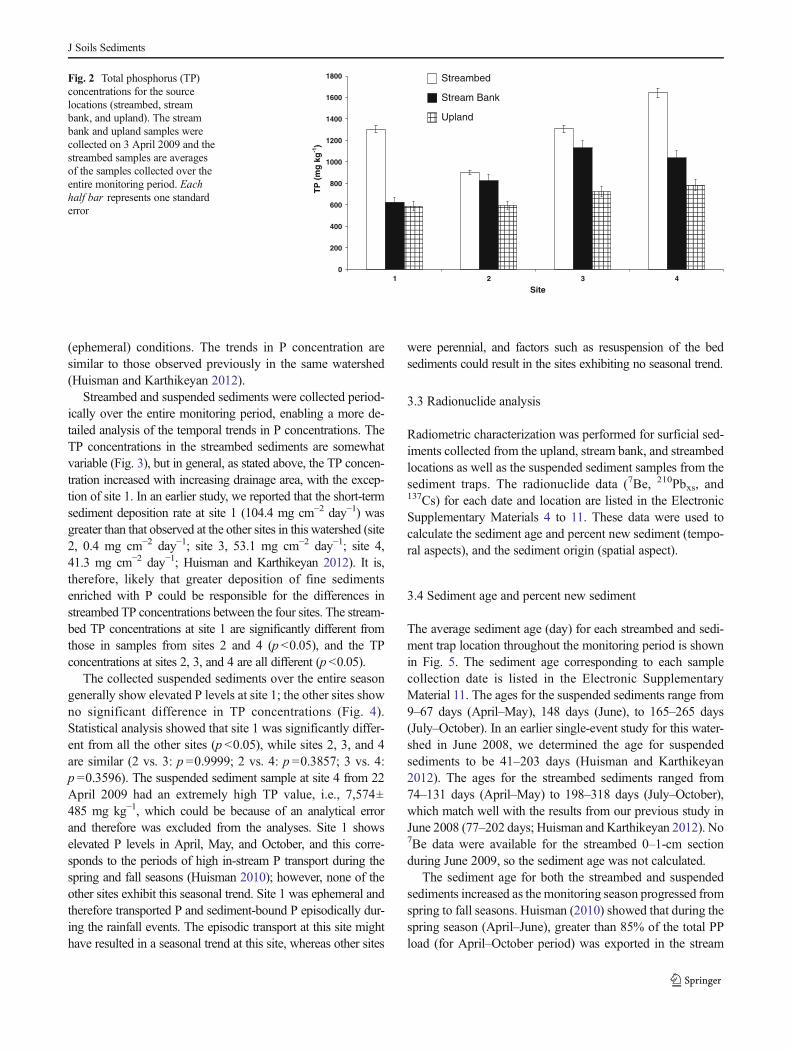
(ephemeral) conditions. The trends in P concentration aresimilar to those observed previously in the same watershed(Huisman and Karthikeyan 2012).
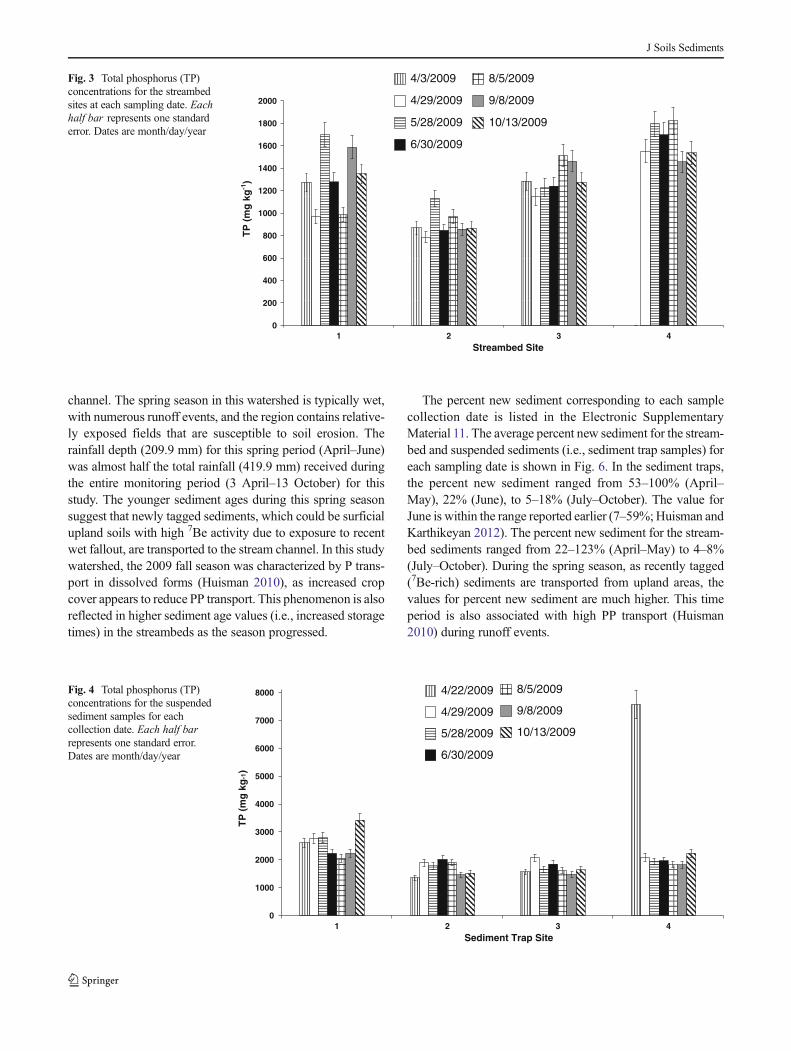
Streambed and suspended sediments were collected period-ically over the entire monitoring period, enabling a more de-tailed analysis of the temporal trends in P concentrations. TheTP concentrations in the streambed sediments are somewhatvariable (Fig. 3), but in general, as stated above, the TP concen-tration increased with increasing drainage area, with the excep-tion of site 1. In an earlier study, we reported that the short-termsediment deposition rate at site 1 (104.4 mg cm−2 day−1) wasgreater than that observed at the other sites in this watershed (site2, 0.4 mg cm−2 day−1; site 3, 53.1 mg cm−2 day−1; site 4,41.3 mg cm−2 day−1; Huisman and Karthikeyan 2012). It is,therefore, likely that greater deposition of fine sedimentsenriched with P could be responsible for the differences instreambed TP concentrations between the four sites. The stream-bed TP concentrations at site 1 are significantly different fromthose in samples from sites 2 and 4 (p <0.05), and the TPconcentrations at sites 2, 3, and 4 are all different (p<0.05).
The collected suspended sediments over the entire seasongenerally show elevated P levels at site 1; the other sites showno significant difference in TP concentrations (Fig. 4).Statistical analysis showed that site 1 was significantly differ-ent from all the other sites (p <0.05), while sites 2, 3, and 4are similar (2 vs. 3: p =0.9999; 2 vs. 4: p =0.3857; 3 vs. 4:p =0.3596). The suspended sediment sample at site 4 from 22April 2009 had an extremely high TP value, i.e., 7,574±485 mg kg−1, which could be because of an analytical errorand therefore was excluded from the analyses. Site 1 showselevated P levels in April, May, and October, and this corre-sponds to the periods of high in-stream P transport during thespring and fall seasons (Huisman 2010); however, none of theother sites exhibit this seasonal trend. Site 1 was ephemeral andtherefore transported P and sediment-bound P episodically dur-ing the rainfall events. The episodic transport at this site mighthave resulted in a seasonal trend at this site, whereas other sites
were perennial, and factors such as resuspension of the bedsediments could result in the sites exhibiting no seasonal trend.
3.3 Radionuclide analysis
Radiometric characterization was performed for surficial sed-iments collected from the upland, stream bank, and streambedlocations as well as the suspended sediment samples from thesediment traps. The radionuclide data (7Be, 210Pbxs, and137Cs) for each date and location are listed in the ElectronicSupplementary Materials 4 to 11. These data were used tocalculate the sediment age and percent new sediment (tempo-ral aspects), and the sediment origin (spatial aspect).
3.4 Sediment age and percent new sediment
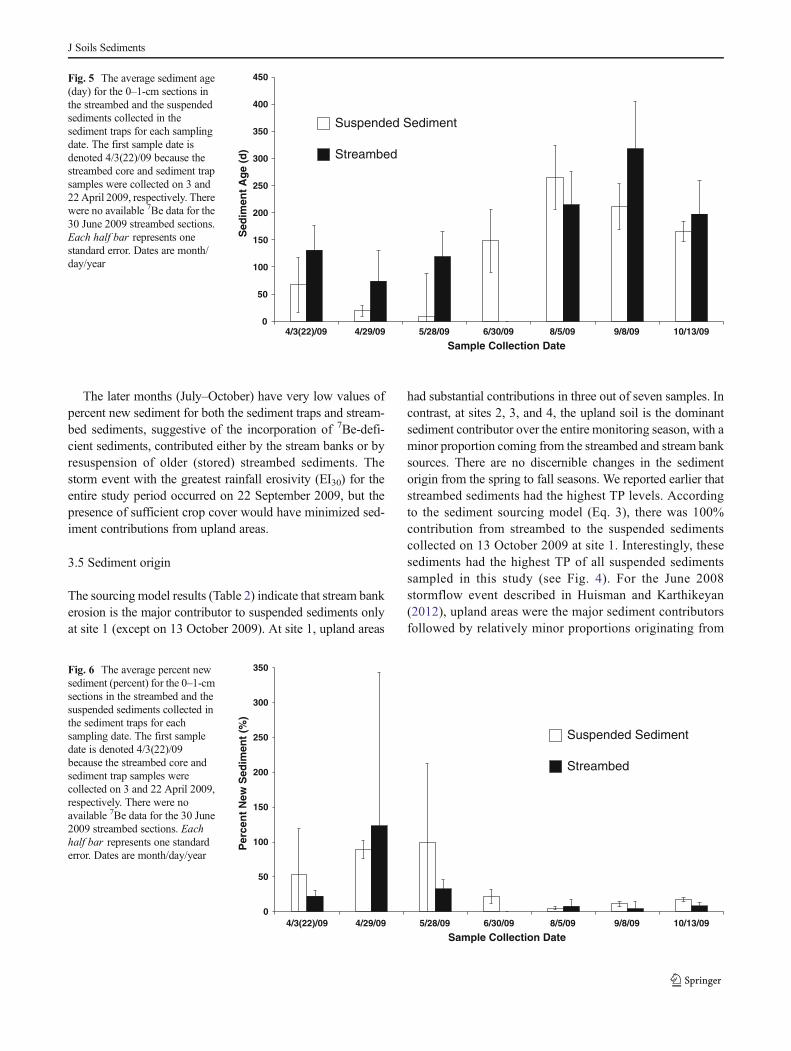
The average sediment age (day) for each streambed and sedi-ment trap location throughout the monitoring period is shownin Fig. 5. The sediment age corresponding to each samplecollection date is listed in the Electronic SupplementaryMaterial 11. The ages for the suspended sediments range from9–67 days (April–May), 148 days (June), to 165–265 days(July–October). In an earlier single-event study for this water-shed in June 2008, we determined the age for suspendedsediments to be 41–203 days (Huisman and Karthikeyan2012). The ages for the streambed sediments ranged from74–131 days (April–May) to 198–318 days (July–October),which match well with the results from our previous study inJune 2008 (77–202 days; Huisman and Karthikeyan 2012). No7Be data were available for the streambed 0–1-cm sectionduring June 2009, so the sediment age was not calculated.
The sediment age for both the streambed and suspendedsediments increased as the monitoring season progressed fromspring to fall seasons. Huisman (2010) showed that during thespring season (April–June), greater than 85% of the total PPload (for April–October period) was exported in the stream
0
200
400
600
800
1000
1200
1400
1600
1800
1 2 3 4
TP
(m
g k
g-1
)
Site
Streambed
Stream Bank
Upland
Fig. 2 Total phosphorus (TP)concentrations for the sourcelocations (streambed, streambank, and upland). The streambank and upland samples werecollected on 3 April 2009 and thestreambed samples are averagesof the samples collected over theentire monitoring period. Eachhalf bar represents one standarderror
J Soils Sediments
channel. The spring season in this watershed is typically wet,with numerous runoff events, and the region contains relative-ly exposed fields that are susceptible to soil erosion. Therainfall depth (209.9 mm) for this spring period (April–June)was almost half the total rainfall (419.9 mm) received duringthe entire monitoring period (3 April–13 October) for thisstudy. The younger sediment ages during this spring seasonsuggest that newly tagged sediments, which could be surficialupland soils with high 7Be activity due to exposure to recentwet fallout, are transported to the stream channel. In this studywatershed, the 2009 fall season was characterized by P trans-port in dissolved forms (Huisman 2010), as increased cropcover appears to reduce PP transport. This phenomenon is alsoreflected in higher sediment age values (i.e., increased storagetimes) in the streambeds as the season progressed.
The percent new sediment corresponding to each samplecollection date is listed in the Electronic SupplementaryMaterial 11. The average percent new sediment for the stream-bed and suspended sediments (i.e., sediment trap samples) foreach sampling date is shown in Fig. 6. In the sediment traps,the percent new sediment ranged from 53–100% (April–May), 22% (June), to 5–18% (July–October). The value forJune is within the range reported earlier (7–59%;Huisman andKarthikeyan 2012). The percent new sediment for the stream-bed sediments ranged from 22–123% (April–May) to 4–8%(July–October). During the spring season, as recently tagged(7Be-rich) sediments are transported from upland areas, thevalues for percent new sediment are much higher. This timeperiod is also associated with high PP transport (Huisman2010) during runoff events.
0
200
400
600
800
1000
1200
1400
1600
1800
2000
1 2 3 4
TP
(m
g k
g-1
)
Streambed Site
4/3/2009
4/29/2009
5/28/2009
6/30/2009
8/5/2009
9/8/2009
10/13/2009
Fig. 3 Total phosphorus (TP)concentrations for the streambedsites at each sampling date. Eachhalf bar represents one standarderror. Dates are month/day/year
0
1000
2000
3000
4000
5000
6000
7000
8000
1 2 3 4
TP
(m
g k
g-1
)
Sediment Trap Site
4/22/2009
4/29/2009
5/28/2009
6/30/2009
8/5/2009
9/8/2009
10/13/2009
Fig. 4 Total phosphorus (TP)concentrations for the suspendedsediment samples for eachcollection date. Each half barrepresents one standard error.Dates are month/day/year
J Soils Sediments
The later months (July–October) have very low values ofpercent new sediment for both the sediment traps and stream-bed sediments, suggestive of the incorporation of 7Be-defi-cient sediments, contributed either by the stream banks or byresuspension of older (stored) streambed sediments. Thestorm event with the greatest rainfall erosivity (EI30) for theentire study period occurred on 22 September 2009, but thepresence of sufficient crop cover would have minimized sed-iment contributions from upland areas.
3.5 Sediment origin
The sourcing model results (Table 2) indicate that stream bankerosion is the major contributor to suspended sediments onlyat site 1 (except on 13 October 2009). At site 1, upland areas
had substantial contributions in three out of seven samples. Incontrast, at sites 2, 3, and 4, the upland soil is the dominantsediment contributor over the entire monitoring season, with aminor proportion coming from the streambed and stream banksources. There are no discernible changes in the sedimentorigin from the spring to fall seasons. We reported earlier thatstreambed sediments had the highest TP levels. Accordingto the sediment sourcing model (Eq. 3), there was 100%contribution from streambed to the suspended sedimentscollected on 13 October 2009 at site 1. Interestingly, thesesediments had the highest TP of all suspended sedimentssampled in this study (see Fig. 4). For the June 2008stormflow event described in Huisman and Karthikeyan(2012), upland areas were the major sediment contributorsfollowed by relatively minor proportions originating from
0
50
100
150
200
250
300
350
400
450
4/3(22)/09 4/29/09 5/28/09 6/30/09 8/5/09 9/8/09 10/13/09
Sed
imen
t A
ge
(d)
Sample Collection Date
Suspended Sediment
Streambed
Fig. 5 The average sediment age(day) for the 0–1-cm sections inthe streambed and the suspendedsediments collected in thesediment traps for each samplingdate. The first sample date isdenoted 4/3(22)/09 because thestreambed core and sediment trapsamples were collected on 3 and22April 2009, respectively. Therewere no available 7Be data for the30 June 2009 streambed sections.Each half bar represents onestandard error. Dates are month/day/year
0
50
100
150
200
250
300
350
4/3(22)/09 4/29/09 5/28/09 6/30/09 8/5/09 9/8/09 10/13/09
Per
cen
t N
ew S
edim
ent
(%)
Sample Collection Date
Suspended Sediment
Streambed
Fig. 6 The average percent newsediment (percent) for the 0–1-cmsections in the streambed and thesuspended sediments collected inthe sediment traps for eachsampling date. The first sampledate is denoted 4/3(22)/09because the streambed core andsediment trap samples werecollected on 3 and 22 April 2009,respectively. There were noavailable 7Be data for the 30 June2009 streambed sections. Eachhalf bar represents one standarderror. Dates are month/day/year
J Soils Sediments
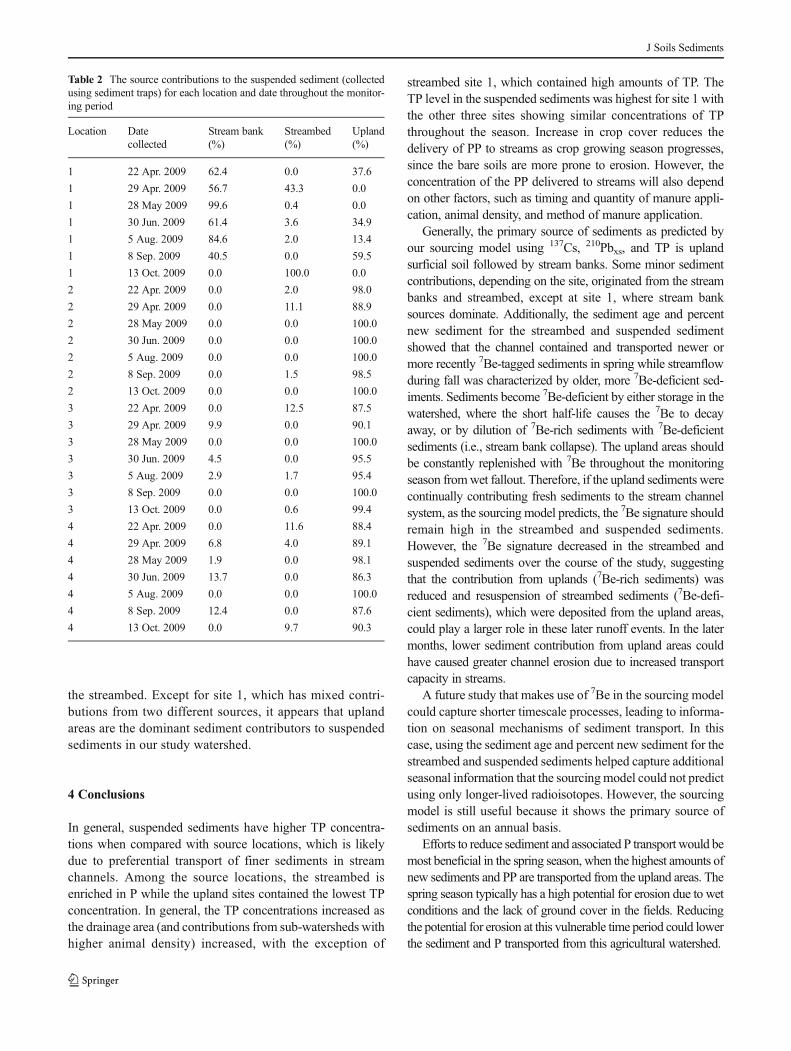
the streambed. Except for site 1, which has mixed contri-butions from two different sources, it appears that uplandareas are the dominant sediment contributors to suspendedsediments in our study watershed.
4 Conclusions
In general, suspended sediments have higher TP concentra-tions when compared with source locations, which is likelydue to preferential transport of finer sediments in streamchannels. Among the source locations, the streambed isenriched in P while the upland sites contained the lowest TPconcentration. In general, the TP concentrations increased asthe drainage area (and contributions from sub-watersheds withhigher animal density) increased, with the exception of
streambed site 1, which contained high amounts of TP. TheTP level in the suspended sediments was highest for site 1 withthe other three sites showing similar concentrations of TPthroughout the season. Increase in crop cover reduces thedelivery of PP to streams as crop growing season progresses,since the bare soils are more prone to erosion. However, theconcentration of the PP delivered to streams will also dependon other factors, such as timing and quantity of manure appli-cation, animal density, and method of manure application.
Generally, the primary source of sediments as predicted byour sourcing model using 137Cs, 210Pbxs, and TP is uplandsurficial soil followed by stream banks. Some minor sedimentcontributions, depending on the site, originated from the streambanks and streambed, except at site 1, where stream banksources dominate. Additionally, the sediment age and percentnew sediment for the streambed and suspended sedimentshowed that the channel contained and transported newer ormore recently 7Be-tagged sediments in spring while streamflowduring fall was characterized by older, more 7Be-deficient sed-iments. Sediments become 7Be-deficient by either storage in thewatershed, where the short half-life causes the 7Be to decayaway, or by dilution of 7Be-rich sediments with 7Be-deficientsediments (i.e., stream bank collapse). The upland areas shouldbe constantly replenished with 7Be throughout the monitoringseason fromwet fallout. Therefore, if the upland sediments werecontinually contributing fresh sediments to the stream channelsystem, as the sourcing model predicts, the 7Be signature shouldremain high in the streambed and suspended sediments.However, the 7Be signature decreased in the streambed andsuspended sediments over the course of the study, suggestingthat the contribution from uplands (7Be-rich sediments) wasreduced and resuspension of streambed sediments (7Be-defi-cient sediments), which were deposited from the upland areas,could play a larger role in these later runoff events. In the latermonths, lower sediment contribution from upland areas couldhave caused greater channel erosion due to increased transportcapacity in streams.
A future study that makes use of 7Be in the sourcing modelcould capture shorter timescale processes, leading to informa-tion on seasonal mechanisms of sediment transport. In thiscase, using the sediment age and percent new sediment for thestreambed and suspended sediments helped capture additionalseasonal information that the sourcingmodel could not predictusing only longer-lived radioisotopes. However, the sourcingmodel is still useful because it shows the primary source ofsediments on an annual basis.
Efforts to reduce sediment and associated P transport would bemost beneficial in the spring season, when the highest amounts ofnew sediments and PP are transported from the upland areas. Thespring season typically has a high potential for erosion due to wetconditions and the lack of ground cover in the fields. Reducingthe potential for erosion at this vulnerable time period could lowerthe sediment and P transported from this agricultural watershed.
Table 2 The source contributions to the suspended sediment (collectedusing sediment traps) for each location and date throughout the monitor-ing period
Location Datecollected
Stream bank(%)
Streambed(%)
Upland(%)
1 22 Apr. 2009 62.4 0.0 37.6
1 29 Apr. 2009 56.7 43.3 0.0
1 28 May 2009 99.6 0.4 0.0
1 30 Jun. 2009 61.4 3.6 34.9
1 5 Aug. 2009 84.6 2.0 13.4
1 8 Sep. 2009 40.5 0.0 59.5
1 13 Oct. 2009 0.0 100.0 0.0
2 22 Apr. 2009 0.0 2.0 98.0
2 29 Apr. 2009 0.0 11.1 88.9
2 28 May 2009 0.0 0.0 100.0
2 30 Jun. 2009 0.0 0.0 100.0
2 5 Aug. 2009 0.0 0.0 100.0
2 8 Sep. 2009 0.0 1.5 98.5
2 13 Oct. 2009 0.0 0.0 100.0
3 22 Apr. 2009 0.0 12.5 87.5
3 29 Apr. 2009 9.9 0.0 90.1
3 28 May 2009 0.0 0.0 100.0
3 30 Jun. 2009 4.5 0.0 95.5
3 5 Aug. 2009 2.9 1.7 95.4
3 8 Sep. 2009 0.0 0.0 100.0
3 13 Oct. 2009 0.0 0.6 99.4
4 22 Apr. 2009 0.0 11.6 88.4
4 29 Apr. 2009 6.8 4.0 89.1
4 28 May 2009 1.9 0.0 98.1
4 30 Jun. 2009 13.7 0.0 86.3
4 5 Aug. 2009 0.0 0.0 100.0
4 8 Sep. 2009 12.4 0.0 87.6
4 13 Oct. 2009 0.0 9.7 90.3
J Soils Sediments
Acknowledgements The authors would like to acknowledge theUSDA NIFA Hatch Program (Project # WIS01080) and the Universityof Wisconsin–Madison Anna Birge Memorial Grant for funding thisstudy. We would also like to thank the producers who allowed us to studytheir watershed as well as Perry Cabot and David Armstrong for theiradvice in setting up the project.
References
Ballantine D, Walling DE, Leeks GJL (2009) Mobilisation and transportof sediment-associated phosphorus by surface runoff.Water Air SoilPollut 196:311–320
Bonniwell EC, Matisoff G,Whiting PJ (1999) Determining the times anddistances of particle transit in a mountain stream using falloutradionuclides. Geomorphology 27:75–92
Chen E, Mackay DS (2004) Effects of distribution-based parameteraggregation on a spatially distributed agricultural nonpoint sourcepollution model. J Hydrol 295:211–224
Christensen BT,Malmros PA (1982) Loss-on-ignition and carbon contentin a beech forest soil-profile. Holarctic Ecol 5:376–380
Collins AL,Walling DE (2007) Fine-grained bed sediment storage withinthe main channel systems of the Frome and Piddle catchments,Dorset, UK. Hydrol Process 21:1448–1459
Collins AL, Walling DE, Leeks GJL (1997) Source type ascription forfluvial suspended sediment based on a quantitative composite fin-gerprinting technique. Catena 29:1–27
Eaton AD, Clesceri LS, Rice EW, Greenberg AE (2005) Standardmethods for the examination of water and wastewater. 21st edn.Port City Press, Baltimore, MD
Fitzgerald SA, Klump JV, Swarzenski PW, Mackenzie RA, Richards KD(2001) Beryllium-7 as a tracer of short-term sediment deposition andresuspension in the Fox River, Wisconsin. Environ Sci Technol35:300–305
FitzHugh TW, Mackay DS (2000) Impacts of input parameter spatialaggregation on an agricultural nonpoint source pollution model. JHydrol 236:35–53
Haygarth PM, Wood FL, Heathwaite AL, Butler PJ (2005) Phosphorusdynamics observed through increasing scales in a nested headwater-to-river channel study. Sci Total Environ 344:83–106
Homer C, Dewitz J, Fry J, Coan M, Hossain N, Larson C, Herold N,McKerrow A, VanDriel JN, Wickham J (2007) Completion of the2001 National Land Cover Database for the Conterminous UnitedStates. Photogramm Engineer Remote Sens 73:337–341
Huff FA, Angel JR (1992) Rainfall frequency atlas of the Midwest.Bulletin 71. Illinois State Water Survey, Champaign
Huisman NLH (2010) Sources and in-stream transport of sediment andphosphorus in an agricultural Wisconsin watershed. UnpublishedDissertation, University of Wisconsin–Madison, Madison
Huisman NLH, Karthikeyan KG (2012) Using radiometric tools to tracksediment and phosphorus movement in an agricultural watershed. JHydrol 450:219–229
Jarvie HP, Jürgens MD, Williams RJ, Neal C, Davies JJL, Barrett C,White J (2005) Role of river bed sediments as sources and sinks ofphosphorus across two major eutrophic UK river basins: the Hamp-shire Avon and Herefordshire Wye. J Hydrol 304:51–74
Lathrop RC (2007) Perspectives on the eutrophication of the Yaharalakes. Lake Reservoir Manage 23:345–365
Matisoff G, Bonniwell EC, Whiting PJ (2002) Soil erosion and sedimentsources in an Ohio watershed using beryllium-7, cesium-137, andlead-210. J Environ Qual 31:54–61
Matisoff G, Wilson CG, Whiting PJ (2005) The Be-7/PB210(xs) ratio asan indicator of suspended sediment age or fraction new sediment insuspension. Earth Surf Process Landf 30:1191–1201
McDowell RW, Wilcock RJ (2004) Particulate phosphorus transportwithin stream flow of an agricultural catchment. J Environ Qual33:2111–2121
McDowell RW, Wilcock RJ (2007) Sources of sediment and phosphorusin stream flow of a highly productive dairy farmed catchment. JEnviron Qual 36:540–548
Midwest Regional Climate Center (2001) Historical climate data; station:474961 MADISON WSO AIRPORT, WI. http://mrcc.sws.uiuc.edu/climate_midwest/historical/precip/wi/474961_psum.html. Accessed18 February 2013
Mukundan R, Walling DE, Gellis AC, Slattery MC, Radcliffe DE(2012) Sediment source fingerprinting: transforming from aresearch tool to a management tool. J Amer Water ResourAssoc 48:1241–1257
Murphy J, Riley JP (1962) A modified single solution method fordetermination of phosphate in natural waters. Anal Chim Acta27:31–36
Olley JM, Murray AS, Mackenzie DH, Edwards K (1993) Identifyingsediment sources in a gullied catchment using natural and anthro-pogenic radioactivity. Water Resour Res 29:1037–1043
Osmond D, Meals D, Hoag D, Arabi M, Luloff A, Jennings G,McFarland M, Spooner J, Sharpley A, Line D (2012) Improvingconservation practices programming to protect water quality inagricultural watersheds: lessons learned from the National Instituteof Food and Agriculture-Conservation Effects Assessment Project. JSoil Water Conserv (Ankeny) 67:122A–127A
Owens PN, Walling DE (2002) The phosphorus content of fluvialsediment in rural and industrialized river basins. Water Res36:685–701
Panuska JC, Karthikeyan KG (2010) Phosphorus and organic matterenrichment in snowmelt and rainfall-runoff from three corn man-agement systems. Geoderma 154:253–260
Phillips JM, Russell MA, Walling DE (2000) Time-integrated samplingof fluvial suspended sediment: A simple methodology for smallcatchments. Hydrol Process 14:2589–2602
Russell MA, Walling DE, Hodgkinson RA (2000) Appraisal of a simplesampling device for collecting time-integrated fluvial suspendedsediment samples. In: StoneM (ed) The role of erosion and sedimenttransport in nutrient and contaminant transfer. IAHS Publ 263,IAHS, Wallingford, pp 119–127
Stone M, Mudroch A (1989) The effect of particle-size, chemistry andmineralogy of river sediments on phosphate adsorption. EnvironTechnol Lett 10:501–510
Trimble SW (1999) Decreased rates of alluvial sediment storage in theCoon Creek Basin, Wisconsin, 1975–93. Science 285:1244–1246
Wallbrink PJ, Martin CE, Wilson CJ (2003) Quantifying the contribu-tions of sediment, sediment-P and fertiliser-P from forested,cultivated and pasture areas at the land use and catchment scaleusing fallout radionuclides and geochemistry. Soil Tillage Res69:53–68
Walling DE, Collins AL (2008) The catchment sediment budget as amanagement tool. Environ Sci Policy 11:136–143
Walling DE, Woodward JC (1992) Use of radiometric fingerprints toderive information on suspended sediment sources. In: Bogen J,Walling DE, Day T (eds) Erosion and sediment transport monitoringprogrammes in river basins. IAHS Publ 210, IAHS, Wallingford, pp153–163
Walling DE, Collins AL, Stroud RW (2008) Tracing suspended sedimentand particulate phosphorus sources in catchments. J Hydrol350:274–289
J Soils Sediments
Related Documents