QUANTIFICATION OF PHYSICAL LOADING, ENERGY INTAKE AND EXPENDITURE IN ENGLISH PREMIER LEAGUE SOCCER PLAYERS LIAM JAMES ANDERSON A thesis submitted in partial fulfillment of the requirements of Liverpool John Moores University for the degree of Doctor of Philosophy December 2017

Welcome message from author
This document is posted to help you gain knowledge. Please leave a comment to let me know what you think about it! Share it to your friends and learn new things together.
Transcript
QUANTIFICATION OF PHYSICAL
LOADING, ENERGY INTAKE AND
EXPENDITURE IN ENGLISH PREMIER
LEAGUE SOCCER PLAYERS
LIAM JAMES ANDERSON
A thesis submitted in partial fulfillment of the
requirements of Liverpool John Moores University for
the degree of Doctor of Philosophy
December 2017
2
ABSTRACT The physical demands of soccer match play have been extensively studied. Muscle glycogen is the major energy source required to meet these demands and strategies to maximise this provide clear performance benefits to match play. Such information has allowed sports nutritionists to develop specific guidelines to optimise physical performance and recovery. However, the physical demands of soccer training have only recently started to be examined. For this reason, Study 1 quantified training load in English Premier League soccer players (n=12) during one, two and three game weekly micro-cycles of the 2013-2014 season. Study 1 identified soccer training being significantly less than match play and identified that soccer training displayed evidence of training periodisation. Having identified typical training load during the weekly micro-cycle, it was recognised that soccer match play comprises a large portion of the weekly physical load. Accordingly, Study 2 quantified differences in season long physical load (inclusive of both training and match play) between players who were classified as starters (n=8, started ≥60% of games), fringe players (n=7, started 30-60% of games) and non-starters (n=4, started <30% of games). Study 2 identified that unlike total seasonal volume of training (i.e. total distance and duration), seasonal high-intensity loading patterns are dependent on players’ match starting status thereby having potential implications for training programme design and prescription of player-specific nutritional guidelines. Additionally, daily energy expenditures (EE) and energy intakes (EI) of elite players are also not currently known. Therefore, studies 3, 4 and 5 quantified EE and EI in English Premier League soccer players consisting of outfield positions (n=6), a professional GK (n=1) and a player undergoing a rehabilitation period from an ACL reconstruction (n=1), respectively. Studies 3 and 4 were conducted over a 7-day period of the 2015-2016 season, consisting of two match days (MD) and five training days (TD). Study 5 consisted of six training days and one day off. Studies 3 and 4 identified CHO periodisation strategies employed by English Premier League Players such that CHO intake was greater on MD than TD. Additionally, players readily achieve current guidelines for daily protein and fat intakes, although energy and macronutrient intakes are skewed on TD. Study 4 also identified that the GK exceeded average daily EE with EI although he failed to meet current recommendations for meals on MD. In study 5 the player was operating in an energy deficit and he was able to decrease his total body mass in the initial 1-6 weeks post injury, which was attributable to largely fat loss. In summary, the work undertaken in this thesis has quantified the typical physical loading patterns of professional soccer players according to fixture schedule, starting status and in special populations. Additionally, the quantification of EI and EE (using DLW) also provides the first report of EE in elite soccer players from the English Premier League. When taken together, these data therefore provide a theoretical framework for soccer-specific nutritional guidelines especially in relation to the concept of nutritional (specifically, carbohydrate) periodisation. Further studies are now required to quantify the specific energy and CHO cost of habitual training sessions completed by elite soccer players as well as examining the manipulation of CHO availability on soccer-specific training adaptations.
3
ACKNOWLEDGEMENTS
Firstly, I would like to thank my Director of studies, Dr James Morton. You have
provided me with an incredible amount of support throughout the PhD process. As
the completion of this thesis was combined with working full time at Liverpool
Football Club and later at a European Football Club abroad, there have been many
challenging periods of work and personal life along the way. You have always
been able to find time to accommodate my needs at any time of day and pick me
back up if needed, allowing for a ‘smoother’ less stressful process. I have also had
the privilege of witnessing you as an applied practitioner. Your passion towards the
field is truly inspiring and I fully believe that your work is world class and you are
leading the field with modern day practice and research. Also, you, along with
others have taken the time to shape me into the applied sports scientist and
researcher I am today and I am forever grateful. Without you facilitating such a
difficult process I would not be where I am today and this thesis would certainly
not be completed in this period of time. I hope that we can continue to work
together and collaborate with applied work and research for years to come.
Secondly, I would also like to thank my ‘other’ PhD supervisor, Professor Barry
Drust. Although you have not officially been my Director of Studies, I feel you
have treated me as if you were. The stresses of working in professional soccer at
the elite level are incredibly high and you have given me unparalleled support
throughout my career so far. I am eternally grateful of your input into my
development and I am forever in debt for your assistance and guidance to
overcome difficulties. You have played a huge role in helping to shape me into the
applied sports scientist and researcher I am today and I am truly grateful for the
opportunities you have provided me with throughout my career so far. I hope that I
have justified to you the faith you have shown in me on numerous occasions and I
hope we can continue to work together and collaborate with applied work and
research for years to come.
I would also like to thank my third PhD supervisor, Professor Graeme Close for his
support throughout the processes of publishing research articles and the finalising
4
of this thesis. Although you having a ‘hands on’ supervisory input was difficult
with my roles being based away from the University campus, you have always
provided with support and input when necessary. Having someone of your caliber
available when needed has provided me with a valuable and effective input into
this thesis. I would like to thank you for all your input so far and I hope we can
work together again in the future.
I would like to thank all of the people I had the privilege of working with on a daily
basis at Liverpool FC. Firstly, I’d like to show my sincere appreciation and thanks
to Dr Ryland Morgans. I am forever grateful for the opportunity to work at one of
the biggest football clubs in the world and the experience it provided me with. You
have developed me into an applied sports scientist and taught me some extremely
valuable lessons on daily conduct and practice in professional soccer. Your work
ethic is unequalled and allowed me to understand what it takes to get to the top in
professional soccer. Secondly, I would like to thank Jordan Milsom, you have been
there for me throughout my PhD as both a mentor and a friend. Your words of
wisdom and experience at times have proved invaluable both in my career to date
and I am sure in the future. I would like to thank you for your support and
continued guidance. I would also like to thank both Andy O’Boyle and Glen
Driscoll who, whilst working with them give out both experience and knowledge
for the applied field. Both of you have had very different roles behind the scenes
but have helped mold me into the sports scientist I am today.
I would also like to acknowledge the ‘team behind the team’ at the club who
without their daily talks and extremely poor ‘banter’ the 3 years would have been
much more difficult. Not many people understand the work that goes into the team
functioning to their best possible level on the pitch every day in training and every
3-4 days in matches, but without these staff members working tirelessly, the club
cannot function effectively. I would like to take a special mention to Partick Orme
and Dave Rydings who I worked with on a daily basis and spent the majority of my
time with at the club. Without you two, I don’t feel I would still be here and my
professional career in soccer would be already over. I’d like to thank you for all of
your continued support and I hope that we can all work together again in the future.

5
Finally, I would like to thank the people away from education and elite Sport. We
would often joke throughout the 3 years at Liverpool that these people were the
‘team behind, behind the teams, team’. To my mum Ruth and my dad Dave, I
would like to thank you dearly for the help and support that you have provided me
with throughout my life and education. Without your unconditional backing, I
would not be where I am today and for that I am immensely grateful and I hope
that I have done you proud with where I have got to today. Lastly, my
acknowledgements go out to my partner, Lisa, for your continued support and
understanding throughout my education and career to date. You are always there
for me when I have difficulties and put up with the long unsociable hours of work
and academic life throughout the PhD process. For you to put your life on hold to
be with me while I pursued my own career development is a testament to the kind
and selfless individual you are. Without your understanding, encouragement and
unconditional support I wouldn’t be the practitioner or person I am today. I am
eternally grateful for everything you have done for me.
6
Declaration
I declare that the work in this thesis, which I now submit for assessment on the
program of study leading to the award of PhD, is entirely my own. Additionally, all
attempts have been made to ensure that the work is original, and does not to the
best of my knowledge breach any copyright laws, and has not been taken from the
work of others, apart from work that has been fully acknowledged within the text
of my work.
Publications and presented abstracts arising from this thesis:
Publications
Anderson, L., Orme, P., Di Michele, R., Close, G.L., Morgans, R., Drust, B., &
Morton, J.P. (2015). Quantification of training load during one-, two- and three-
game week schedules in professional soccer players from the English Premier
League: implications for carbohydrate periodisation. Journal of Sports Sciences,
34, 1250-1259. (Chapter 4)
Anderson L., Orme, P., Di Michele, R., Close, G.L., Milsom, J., Morgans, R.,
Drust, B., & Morton, J.P. (2016). Quantification of seasonal-long physical load in
soccer players with different starting status form the English Premier League:
implications for maintaining squad physical fitness. International Journal of Sports
Physiology and Performance, 11, 1038-1046. (Chapter 5)
Anderson, L., Orme, P., Naughton, R.J., Close, G.L., Milsom, J., Rydings, D.,
O’Boyle, A., Di Michele, R., Louis, J., Hambly, C., Speakman, J.R., Morgans, R.,
Drust, B., & Morton, J.P. (2017a). Energy intake and expenditure of professional
soccer players of the English Premier League: evidence of carbohydrate
periodization. International Journal of Sports Nutrition and Exercise Metabolism,
27, 228-238. (Chapter 6)
Anderson, L., Naughton, R.J., Close, G.L., Di Michele, R., Morgans, R., Drust, B.,
& Morton, J.P. (2017b). Daily distribution of macronutrient intakes of professional
7
soccer players from the English Premier League. International Journal of Sports
Nutrition and Exercise Metabolism, 28, 1-18. (Chapter 6)
Abstracts
Anderson, L., Orme, P., Naughton, R.J., Close, G.L., Louis, J., Morgans, R, Drust,
B., & Morton, J.P. Quantification of nutritional intake during a congested fixture
period in players from the English Premier League. Presented at European College
of Sports Scientists, Vienna, Austria, July 2016.
8
CONTENTS
Abstract 2 Acknowledgements 3 Publications and presented abstracts arising from this thesis 6 Table of Contents 8 Contents List of Abbreviations 12 List of Figures 13 List of Tables 18 Chapter 1 – General Introduction 21 1.1. Background 22 1.2. Aims and Objectives of the thesis 25 Chapter 2 – Literature Review 27 2.1. The physiological demands of soccer match play 28 2.1.1. Activity profiles of soccer match play 28 2.1.2. Positional differences in work rate profiles 28 2.1.3. Aerobic demands of soccer match play 29 2.1.4. Anaerobic demands of soccer match play 31 2.1.5. Summary 32 2.2. The physiological demands of soccer training 31 2.2.1. Objectives of soccer training 31 2.2.2. Quantification of load in soccer 34 2.2.3. Factors influencing training load in soccer 35 2.2.3.1. Coaches influence 35 2.2.3.2. Positional differences 35 2.2.3.3. Starting status 37 2.2.3.4. Weekly schedule 37 2.2.4. Monitoring of training load 38 2.2.4.1. Heart rate 40 2.2.4.2. Rating of perceived exertion 41 2.2.4.3. Global positioning systems 43 2.2.4.4. Semi-automatic camera systems 46 2.2.5. Summary 48 2.3. Nutritional demands of soccer 48 2.3.1. Overview of the metabolic demands of match play 48 2.3.2. Overview of the nutritional recommendations for match play 52 2.3.2.1. Day prior 52 2.3.2.2. Pre-match meal 52 2.3.2.3. During match 53 2.3.2.4. Post-match 54 2.3.3. Overview of the metabolic demands of training 54 2.3.4. Energy demands of soccer players 56 2.3.4.1. Doubly labeled water 56 2.3.4.2. Heart rate 58 2.3.4.3. Accelerometry 61 2.3.5. Assessment of dietary intakes in soccer players 62 2.3.5.1. Diet record (food diary) 63 2.3.4.2. 24-hour recall 64 2.3.4.3. The remote food photographic method 65 2.3.6. Energy intakes in soccer players 66 2.3.7. Carbohydrate periodisation 67 2.4. Summary 68
9
Chapter 3 – General methodology 71 3.1. Ethical approval and location of testing 72 3.2. Participants 73 3.3. Assessment of body composition 73 3.4. Quantification of training and match load 74 3.5. Measurement of energy expenditure using doubly labeled water 76 3.6. Assessment of total dietary intake 77 3.7. Inter-researcher reliability of the methods 80 Chapter 4 – Quantification of training load during one, two and three game week schedules in professional soccer players from the English Premier League: implications for carbohydrate periodisation
81
4.1. Abstract 82 4.2. Introduction 83 4.3. Methods 85 4.3.1. Participants 85 4.3.2. Study design 85 4.3.3. Quantification of training and match load 86 4.3.4. Statistical analysis 86 4.4. Results 87 4.4.1. Day-to-day variations in training load across one-two and
three game weeks 87
4.4.2. One game week schedule 87 4.4.3. Two game week schedule 90 4.4.4. Three game week schedule 93 4.4.5. Accumulative weekly loads 93 4.5. Discussion 96 4.6. Conclusion 101 Chapter 5 – Quantification of seasonal long physical load in soccer players with different starting status from the English Premier League: implications for maintaining squad physical fitness
103
5.1. Abstract 104 5.2. Introduction 105 5.3. Methods 107 5.3.1. Participants 107 5.3.2. Study design 107 5.3.3. Quantification of training and match load 108 5.3.4. Statistical analysis 109 5.4. Results 109 5.4.1. Seasonal long comparison of “total” physical load 109 5.4.2. Seasonal long comparison of total “training” and “match”
physical load 110
5.4.3. Seasonal long comparison of “training” and “match” load in high-intensity speed zones
111
5.4.4. Comparison of “total” physical load within specific in-season periods
116
5.4.5. Comparison of “training” and “match” physical load within in-season periods
116
5.5. Discussion 117 5.6. Conclusion 121 Chapter 6 – Energy intake and expenditure of professional soccer players of the English Premier League: evidence of carbohydrate periodisation and ‘skewing’ of meal distribution
122
6.1. Abstract 123 6.2. Introduction 124
10
6.3. Methods 125 6.3.1. Participants 125 6.3.2. Study design 125 6.3.3. Quantification of training and match load 126 6.3.4. Measurement of energy expenditure using doubly labeled
water 126
6.3.5. Assessment of total dietary intake 126 6.3.6. Statistical analysis 126 6.4. Results 127 6.4.1. Quantification of daily and accumulative weekly load 127 6.4.2. Quantification of daily energy and macronutrient intake 127 6.4.3. Energy and macronutrient intake on training vs. match days 132 6.4.4. Energy and macronutrient distribution across meals on
training days 132
6.4.5. Energy and macronutrient intake across meals on match days
136
6.4.6. Carbohydrate intake during training and games 136 6.4.7. Energy expenditure vs. energy intake 136 6.5. Discussion 137 6.6. Conclusion 142 Chapter 7 – Case study: energy intake and expenditure in a Premier league goalkeeper during a typical in-season micro cycle
143
7.1. Abstract 144 7.2. Introduction 145 7.3. Methods 146 7.3.1. Overview of the player 146 7.3.2. Study design 146 7.3.3. Measurement of energy expenditure using doubly labeled
water 147
7.3.4. Assessment of total dietary intake 147 7.4. Results 147 7.4.1. Quantification of daily and accumulative weekly load 147 7.4.2. Quantification of daily energy and macronutrient intake 150 7.4.3. Energy and macronutrient distribution across meals on
training days 150
7.4.4. Energy and macronutrient intake across meals on match days
154
7.4.5. Carbohydrate intake during training and games 154 7.4.6. Energy expenditure vs. energy intake 154 7.5. Discussion 154 7.6. Conclusion 158 Chapter 8 – Case study: Energy intake and expenditure in a Premier league soccer players during a rehabilitation from ACL injury
159
8.1. Abstract 160 8.2. Introduction 161 8.3. Methods 162 8.3.1. Overview of the player, injury and surgery 162 8.3.2. Study design 163 8.4. Results 163 8.4.1. Quantification of daily energy and macronutrient intake 163 8.4.2. Energy and macronutrient distribution across meals on
training days 164
8.4.3. Energy expenditure vs. energy intake 164 8.4.4. Anthropometric developments of the rehabilitation 164
11
8.5. Discussion 172 8.6. Conclusion 175 Chapter 9 – Synthesis of findings 176 9.1. Synthesis of findings 177 9.2. Achievement of the aims and objectives 177 9.3. General discussion of the findings 179 9.3.1.1. Effects of match schedule 179 9.3.1.2. Effects of starting status 181 9.3.1.3. Effects of positional status 183 9.3.2. Energy requirements of soccer players 186 9.3.2.1. Energy expenditure 186 9.3.2.2. Energy and macronutrient intake 187 9.3.2.3. Energy and macronutrient distribution 188 9.3.2.4. Energy and macronutrient intake in the goalkeeper 190 9.3.2.5. Energy and macronutrient intake in the injured athlete 191 9.3.3. Contemporary training and nutritional guidelines for soccer
players 192
9.3.3.1. Training guidelines 192 9.3.3.2. Match day nutrition 193 9.3.3.3. Training day nutrition 193 9.3.3.4. Carbohydrate periodization in soccer 194 9.4. General Discussion 198 9.5. Recommendations for future research 198 Chapter 10 – References 200 Appendices 225
12
LIST OF ABBREVIATIONS
ACL, Anterior Cruciate Ligament
AMPK, adenosine monophosphate protein
ANOVA, Analysis of Variance
CAM, Central Attacking Midfielder
CD, Central Defender
CDM, Central Defending Midfielder
CF, Centre Forward
CHO, Carbohydrate
CV, Coefficient of Variation
DM, During-Match
EE, Energy Expenditure
EI, Energy Intake
FFA, Free Fatty Acids
FTa, Fast Twitch Type a
FTx, Fast Twitch Type x
GK, Goalkeeper
GPS, Global Positioning Systems
HR, Heart Rate
LBM, Lean Body Mass
PM, Post-Match
PMM, Pre Match Meal
PMRM, Post-Match Recovery Meal
PMS, Pre-Match Snack
RFPM, Remote Food Photographic Method
RPE, Rating of Perceived Exertion
ST, Slow Twitch
�̇�O2max, maximal oxygen uptake
VO2, Oxygen Consumption
VCO2, Carbon Dioxide Expelling
WD, Wide Defender
WM, Wide Midfielder
13
LIST OF FIGURES
Chapter 2
Figure 2.1. Blood lactate concentrations from before, during and after a soccer
game. Data are means ± SEM (N = 11) as well as individual values (adopted from
Krustrup et al., 2006).
Figure 2.2. Relative glycogen content in slow twitch (ST), fast twitch type a (FTa)
and fast twitch type x (FTx) fibers as well as all fibers before and immediately after
a soccer match (adopted from Krustrup et al., 2006).
Figure 2.3. Plasma FFA concentrations before, during and after a soccer game
(adopted from Krustrup et al., 2006).
Figure 2.4. Decline of 2H (deuterium) and 18O in body fluids (urine, plasma or
saliva) during a hypothetical doubly labeled water experiment (adopted from
Ainslie et al., 2003).
Figure 2.5. The relationship between heart rate and energy expenditure in a healthy
male study participant (adopted from Ainslie et al., 2003).
Chapter 3
Figure 3.1. Liverpool Football Club training facilities used for training load data
collection in studies 1, 2 and 3.
Figure 3.2. Liverpool Football Club’s home stadium used in studies 1, 2 and 3 for
collection of physical variables in official games.
14
Chapter 4
Figure 4.1. Total distance and average speed completed in training sessions and
matches duration during the 7-day testing period for different positions and squad
average. Figures A and B = one game week, Figures C and D = two game week
and Figures E and F = three game week. Bar 1 = Wide Defender, bar 2 = Centre
Back, bar 3 = Centre Midfielder, bar 4 = Wide Midfielder, bar 5 = Centre Forward,
bar 6 = Squad Average (this sequence of positions is identical in all days and week
types). White bars = training days and black bars = match days. a denotes
difference from day 3, b denotes difference from day 4, c denotes difference from
day 5 and d denotes difference from day 6, all P<0.05.
Figure 4.2. Accumulative weekly A) Duration, B) Total distance, C) Standing
distance, D) Walking distance, E) Jogging distance, F) Running distance, G) High
speed running distance and H) Sprint distance. a denotes difference from one game
week, b denotes difference from two game week, all P<0.05.
Figure 4.3. Intensity distribution expressed as percentage of distance completed
within each speed zone. Numbers inset represent actual percentage values. a
denotes difference from one game week, b denotes difference from two game week,
all P<0.05.
Chapter 5
Figure 5.1. Accumulative season long A) duration and B) total distance in both
training and matches. Shaded bars = training and open bars = matches. * denotes
difference to starters (matches), # denotes difference to fringe players (matches), a
denotes difference to starters (training), P<0.05 (Bonferroni corrected).
Figure 5.2. Accumulative season long A) running distance, B) high-speed running
distance and C) sprinting distance in both training and matches. Shaded bars =
training and open bars = matches. * denotes difference to starters, P<0.05
(Bonferroni corrected).
15
Figure 5.3. Within period accumulative A) duration, B) total distance, C) running
distance, D) high-speed running distance and E) sprinting distance in match per se.
* denotes difference to starters, # denotes difference to fringe players, P<0.05
(Bonferroni corrected).
Figure 5.4. Within period accumulative A) duration, B) total distance, C) running
distance, D) high-speed running distance and E) sprinting distance in training per
se. * denotes difference to starters, # denotes difference to fringe players, P<0.05
(Bonferroni corrected).
Chapter 6
Figure 6.1. Daily energy and macronutrient intake expressed absolutely and
relative to body mass over the 7-day testing period. Figure A=absolute energy
expenditure, Figure B=energy expenditure relative to lean body mass, Figure
C=absolute carbohydrate, Figure D=relative carbohydrate, Figure E=absolute
protein, Figure F=relative protein, Figure G=absolute fat and Figure H=relative fat.
White bars=training days and black bars=match days. a denotes difference from
day 1, b denotes difference from day 2, c denotes difference from day 3, d denotes
difference from day 4, e denotes difference from day 5, f denotes difference from
day 6.
Figure 6.2. Energy and macronutrient intakes meal distribution on training days.
Figure A=absolute energy expenditure, Figure B=energy expenditure relative to
lean body mass, Figure C=absolute carbohydrate, Figure D=relative carbohydrate,
Figure E=absolute protein, Figure F=relative protein, Figure G=absolute fat and
Figure H=relative fat. a denotes difference from breakfast, b denotes difference
from morning snack, c denotes difference from lunch, d denotes difference from
afternoon snack, e denotes difference from dinner, f denotes difference from
evening snack.
Figure 6.3. Energy and macronutrient intake meal distribution on the two match
days during the study period. Black bars=match day 1 and white bars=match day 2.
a denotes difference from PMM, b denotes difference from PMS, c denotes
16
difference from DM, d denotes difference from PM, e denotes difference from
PMRM. PMM=Pre Match Meal, PMS=Pre-Match Snack, DM=During-Match,
PM=Post-Match, PMRM=Post-Match Recovery Meal.
Chapter 7
Figure 7.1. Daily energy and macronutrient intake expressed absolutely and
relative to body mass over the 7-day testing period. Figure A=absolute energy
intake, Figure B=energy intake relative to lean body mass, Figure C=absolute
carbohydrate, Figure D=relative carbohydrate, Figure E=absolute protein, Figure
F=relative protein, Figure G=absolute fat and Figure H=relative fat. White
bars=training days and black bars=match days.
Figure 7.2. Energy and macronutrient intakes meal distribution on training days.
Figure A=absolute energy intake, Figure B=energy intake relative to lean body
mass, Figure C=absolute carbohydrate, Figure D=relative carbohydrate, Figure
E=absolute protein, Figure F=relative protein, Figure G=absolute fat and Figure
H=relative fat.
Figure 7.3. Energy and macronutrient intake meal distribution on the two match
days during the study period. Figure A=absolute energy intake, Figure B=energy
intake relative to lean body mass, Figure C=absolute carbohydrate, Figure
D=relative carbohydrate, Figure E=absolute protein, Figure F=relative protein,
Figure G=absolute fat and Figure H=relative fat. Black bars=match day 1 and
white bars=match day 2. PMM=Pre Match Meal, PMS=Pre-Match Snack,
DM=During-Match, PM=Post-Match, PMRM=Post-Match Recovery Meal.
Figure 7.4. Differences in average daily energy intake vs. average daily energy
expenditure and body mass changes from day 0 to day 8. Figure A=energy intake
vs. energy expenditure and Figure B=body mass changes.
17
Chapter 8
Figure 8.1. Daily energy and macronutrient intake expressed absolutely and
relative to body mass over the 7-day testing period. Figure A=absolute energy
intake, Figure B=energy intake relative to lean body mass, Figure C=absolute
carbohydrate, Figure D=relative carbohydrate, Figure E=absolute protein, Figure
F=relative protein, Figure G=absolute fat and Figure H=relative fat.
Figure 8.2. Energy and macronutrient intakes meal distribution on training days.
Figure A=absolute energy intake, Figure B=energy intake relative to lean body
mass, Figure C=absolute carbohydrate, Figure D=relative carbohydrate, Figure
E=absolute protein, Figure F=relative protein, Figure G=absolute fat and Figure
H=relative fat.
Figure 8.3. Differences in average daily energy intake vs. average daily energy
expenditure and body mass changes from day 0 to day 8. Figure A=energy intake
vs. energy expenditure and Figure B=body mass changes.
Figure 8.4. Changes in total (A) body mass, (B) lean mass, (C) fat mass and (D) fat
percentage. Changes in body mass (E), lean mass (F), fat mass (G) and fat
percentage (H) expressed as delta change during the specific period highlighted.
Figure 8.5. Changes in total (A) leg lean mass and (B) leg fat mass. Changes in leg
lean mass (C) and leg fat mass (D) expressed as delta change during the specific
period highlighted.
Figure 8.6. Changes in total (A) arm lean mass and (B) arm fat mass. Changes in
arm lean mass (C) and arm fat mass (D) expressed as delta change during the
specific period highlighted.
Figure 8.7. Changes in total (A) trunk lean mass and (B) trunk fat mass. Changes
in trunk lean mass (C) and trunk fat mass (D) expressed as delta change during the
specific period highlighted.
18
LIST OF TABLES
Chapter 2
Table 2.1. Distances covered in different positions in soccer players
Table 2.2. Training load data represented across 3 separate 1-week micro cycles
during the in-season phase between positions (mean ± SD) (adapted from Malone
et al., 2015).
Table 2.3. A typical monthly schedule for a top professional soccer club in the
Premier League
Table 2.4. Reported dietary intakes of male soccer players during training (mean
daily intake ± s) (adapted from Burke, 2006).
Chapter 3
Table 3.1. Summary of participant characteristics from all five studies.
Chapter 4
Table 4.1. Overview of the different schedules for each micro-cycle type
Table 4.2. Training and match duration during the 7-day testing period for
different positions and squad average
Table 4.3. Distances covered at different speed thresholds (representative of squad
average data) during training and matched completed in the 7-day testing period.
19
Chapter 5
Table 5.1. Total duration (minutes), total distance (km), running distance (km),
high-speed running distance (km) and sprinting distance (km) covered across the
entire in-season period, as inclusive of both training and matches.
Table 5.2. Total duration (minutes), total distance (km), running distance (km),
high-speed running distance (km) and sprinting distance (km) within 5 specific in-
season periods
Chapter 6
Table 6.1. Overview of the schedule prior to, during and post testing period
Table 6.2. Training and match load variables (representative of average daily data
in bold and individual data from players 1-6) completed in the 7-day testing period
and the day following the testing period. Running distance = distance covered
between 14.4-19.8 km . h-1, high-speed running distance = distance covered
between 19.8-25.2 km . h-1 and sprinting distance = distance covered >25.2 km . h-1.
Each player’s position is shown in brackets. CF=Centre Forward, WD=Wide
Defender, WM=Wide Midfielder, CDM=Central Defending Midfielder, CAM=
Central Attacking Midfielder and CD=Central Defender.
Table 6.3. Accumulative training and match load variables (representative of
average data in bold and individual data from players 1-6) completed in the 7-day
testing period and the day following the testing period. Running distance = distance
covered between 14.4-19.8 km . h-1, high-speed running distance = distance
covered between 19.8-25.2 km . h-1 and sprinting distance = distance covered >25.2
km . h-1. Each player’s position is shown in brackets. CF=Centre Forward,
WD=Wide Defender, WM=Wide Midfielder, CDM=Central Defending Midfielder,
CAM= Central Attacking Midfielder and CD=Central Defender.
Table 6.4. Individual differences of average daily energy intake vs. average daily
energy expenditure and body mass changes from Day 0 to Day 8. Each player’s
20
position is shown in brackets. CF=Centre Forward, WD=Wide Defender,
WM=Wide Midfielder, CDM=Central Defending Midfielder, CAM= Central
Attacking Midfielder and CD=Central Defender.
Chapter 7
Table 7.1. An overview of the absolute and accumulative training, match and total
physical demands of the player during data collection
Chapter 8
Table 8.1. An overview of a typical days rehabilitation program which the athlete
underwent during the assessment week
Table 8.2. An overview of a typical days food consumption during the assessment
week (Day 6)
Chapter 9
Table 9.1. Training guidelines which encompass different aspects of soccer
training which would suit the nutritional guidelines set out beneath.
Table 9.2. Suggested practical model of the “fuel for the work” required paradigm
taken from endurance sports for a one game per week schedule (based on a 80 kg
player).

21
CHAPTER 1
GENERAL INTRODUCTION
22
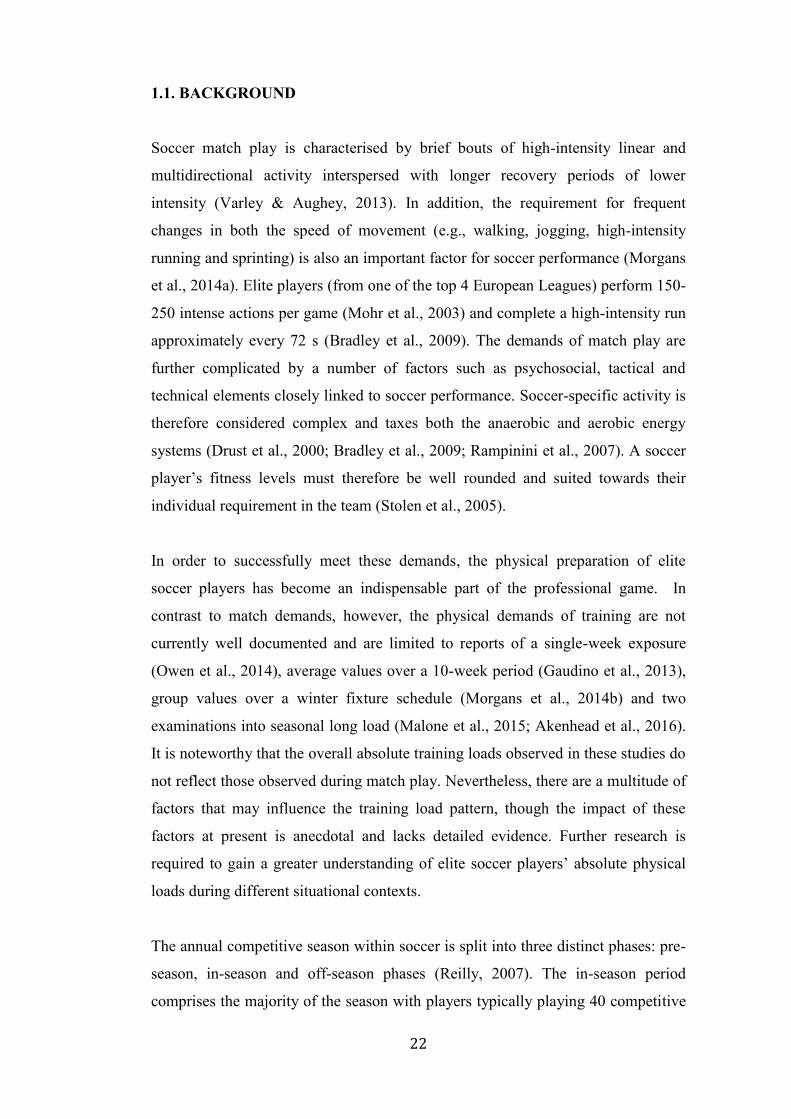
1.1. BACKGROUND
Soccer match play is characterised by brief bouts of high-intensity linear and
multidirectional activity interspersed with longer recovery periods of lower
intensity (Varley & Aughey, 2013). In addition, the requirement for frequent
changes in both the speed of movement (e.g., walking, jogging, high-intensity
running and sprinting) is also an important factor for soccer performance (Morgans
et al., 2014a). Elite players (from one of the top 4 European Leagues) perform 150-
250 intense actions per game (Mohr et al., 2003) and complete a high-intensity run
approximately every 72 s (Bradley et al., 2009). The demands of match play are
further complicated by a number of factors such as psychosocial, tactical and
technical elements closely linked to soccer performance. Soccer-specific activity is
therefore considered complex and taxes both the anaerobic and aerobic energy
systems (Drust et al., 2000; Bradley et al., 2009; Rampinini et al., 2007). A soccer
player’s fitness levels must therefore be well rounded and suited towards their
individual requirement in the team (Stolen et al., 2005).
In order to successfully meet these demands, the physical preparation of elite
soccer players has become an indispensable part of the professional game. In
contrast to match demands, however, the physical demands of training are not
currently well documented and are limited to reports of a single-week exposure
(Owen et al., 2014), average values over a 10-week period (Gaudino et al., 2013),
group values over a winter fixture schedule (Morgans et al., 2014b) and two
examinations into seasonal long load (Malone et al., 2015; Akenhead et al., 2016).
It is noteworthy that the overall absolute training loads observed in these studies do
not reflect those observed during match play. Nevertheless, there are a multitude of
factors that may influence the training load pattern, though the impact of these
factors at present is anecdotal and lacks detailed evidence. Further research is
required to gain a greater understanding of elite soccer players’ absolute physical
loads during different situational contexts.
The annual competitive season within soccer is split into three distinct phases: pre-
season, in-season and off-season phases (Reilly, 2007). The in-season period
comprises the majority of the season with players typically playing 40 competitive
23
matches over a period of 39 weeks. During this period, the management of training
loads is traditionally considered in weekly micro-cycles that normally consist of
one game per week (i.e. Saturday-to-Saturday schedule), though it is noteworthy
that elite soccer players often play two (e.g. Sunday-to-Saturday) or three games
(e.g. Sunday-Wednesday-Saturday) in a 7-day micro-cycle. This pattern of loading
is largely due to external factors (e.g. television subscription rights) and
involvement in numerous competitions (i.e. domestic league/ cup competitions and
European competitions) as well as periods of intense fixture schedules such as the
winter period (Morgans et al., 2014b). Such scenarios place different challenges
upon sports scientists and sports nutritionists as different weekly cycles are likely
to alter the absolute load and have subsequent effects on the nutritional
requirements for the players. However, no study is yet to quantify the variations in
training load that may occur during the weekly micro-cycles that are relevant to
those typically undertaken by professional soccer players. Additionally, training
load in the weekly micro-cycle is often aimed at providing sufficient recovery from
match play (Nedelec et al., 2014), whilst also preventing injury (Dellal et al., 2015;
Dupont et al., 2010) and symptoms of over-training (Morgans et al., 2014b), and is
usually aimed at those players who are starting each competitive fixture. As such,
it could be suggested that it is the participation in match play itself that is the most
appropriate stimulus for preparing players for the physical demands of matches
(Morgans et al., 2017). This point is especially apparent when considering previous
evidence demonstrating positive correlations between individual in-season playing
time and aspects of physical performance including sprint performance, muscle
strength and counter movement jump height (Silva et al., 2011; Morgans et al.,
2017). Nonetheless, the impact of player starting status on overall load during the
annual season is not yet known.
Given the potential daily fluctuations in absolute training loads across the micro-
cycle, it is likely that EE may vary accordingly and hence, EI could also be
adjusted to account for the goals of that particular day. Indeed, the concept of
“fuelling for the work required” has recently been suggested as a practical
framework for which to apply nutritional periodisation strategies to endurance
athletes (Impey et al., 2016). Such strategies are intended to concomitantly promote
components of training adaptation (e.g., activation of regulatory cell signaling
24
pathways) but yet, also ensure adequate CHO (and energy) availability to promote
competitive performance, reduce injury risk and aid recovery (Burke et al., 2011;
Chamari et al., 2012; Burke et al., 2006). This strategy aims to manipulate the
CHO (and therefore energy) intakes depending on the load and goals of that
particular day. However, despite the growing theoretical rationale for nutritional
periodisation strategies, it is difficult to prescribe accurate nutritional guidelines for
professional soccer players owing to a lack of study that has provided direct
assessments of EE and EI in the modern professional player (Ebine et al., 2002).
In addition to absolute daily energy and macronutrient intake, the “distribution” of
such parameters has now been found to be important. Such rationale is well
documented for CHO given the relevance of both timing and absolute CHO intake
in relation to promoting pre-match loading and post-match muscle glycogen re-
synthesis (Ivy et al., 1988a; Ivy et al., 1988b). However, there is also a requirement
to quantify daily distribution of protein intakes (Areta et al., 2013; Mamerow et al.,
2014). Indeed, these latter authors demonstrated that the timing and even
distribution of daily protein doses may have a more influential role in modulating
muscle protein synthesis when compared with the absolute dose of protein intake
per se, an effect that is evident in response to both feeding alone (Mamerow et al.,
2014) and post-exercise feeding (Areta et al., 2013). Although such skewed
approaches to protein feeding have been previously observed in elite youth UK
soccer players (Naughton et al., 2016) and adult Dutch soccer players (Bettonviel
et al., 2016), no such study exists examining the daily distribution of macronutrient
intake of soccer players of the English Premier League.
The majority of research in soccer is primarily focused around outfield players and
there is relatively little research that is specific to the assessing the nutritional
requirements of the soccer goalkeeper (GK). Although the GK is often overlooked
in research, their playing position is extremely unique and cannot be put into the
same category as outfield players. Indeed, whilst match analysis data have verified
that GKs display significantly reduced match loads compared with outfield players
(Di Salvo et al., 2008; Bradley et al., 2010), researchers have yet to quantify the
habitual training loads of professional GKs. This is likely due to the only recent
introduction of GK specific Global Positioning Systems (GPS) units for monitoring
25
training load. It is clear that more research is required to quantify the training load
and the energy expenditure of the soccer GK in order to prescribe more informed
nutritional guidelines.
Throughout the competitive season, it is common for players to sustain both acute
and chronic injuries. Injured players are also often overlooked in terms of specific
nutritional requirements with many of the daily menus prescribed by club support
staff aimed at providing fuel and recovery for competitive match play. However,
there has been a recent rise in scientific support to the injured athlete to enable a
faster, more efficient return to play. In relation to long-term injuries, the
maintenance and in some cases, improvements of body composition and physical
capabilities are nowadays essential to a successful return from injury (Milsom et
al., 2014). Nonetheless, it is currently difficult to prescribe accurate nutritional
guidelines to long-term injured players owing to a lack of understanding of energy
requirements during the rehabilitation process.
1.1. AIMS AND OBJECTIVES OF THE THESIS
The primary aim of the present thesis was to quantify the physical loading (both
training and match play), EE and EI of elite professional soccer players from the
English Premier League. On the basis of characterising the habitual loading
patterns and typical EE, a secondary aim was to formulate contemporary nutritional
guidelines in accordance with the concept of nutritional periodisation.
This will be achieved by completion of the following objectives:
1. The quantification of training load during one-, two- and three-game week
schedules in professional soccer players from the English Premier League.
This objective will be achieved through completion of Study 1 (Chapter 4).
2. The quantification of seasonal long physical load in soccer players with
different starting status from the English Premier League. This objective
will be achieved through completion of Study 2 (Chapter 5).
26
3. The quantification of training load, EE and EI (including daily
macronutrient distribution) in professional soccer players of the English
Premier League during a typical in-season micro-cycle. This objective will
be achieved through completion of Study 3 (Chapter 6)
4. The quantification of physical load, EE and EI (including daily
macronutrient distribution) in a professional soccer GK from the English
Premier League during a typical in-season micro-cycle. This objective will
be achieved through completion of Study 4 (Chapter 7).
5. The quantification of EE and EI in a professional soccer player from the
English Premier League during rehabilitation from ACL injury. This
objective will be achieved through the completion of Study 5 (Chapter 8).

27
CHAPTER 2
LITERATURE REVIEW
28
2.1. THE PHYSIOLOGICAL DEMANDS OF SOCCER MATCH
PLAY
2.1.1. ACTIVITY PROFILES OF SOCCER MATCH PLAY
Soccer match play has been characterised by its sporadic nature whereby
multidirectional unpredictable physical actions are integrated with an array of
technical skills (Bradley et al., 2009; Wallace & Norton, 2014; Bush et al., 2015b).
The physical demands of soccer match play have been studied extensively for over
four decades (Reilly & Thomas, 1976; Di Salvo et al., 2006; Di Salvo et al., 2009;
Russell et al., 2016). The typical total distance covered by a top-class outfield
player during a soccer match is around 10-13 km (Dellal et al., 2011; Di Salvo et
al., 2007). Relative to the overall distance covered by players, ~80-90% of it is
covered in low to moderate intensity activity (speeds <19.8 km . h-1), with ~7-12%
covered at high-intensity (speeds >19.8 km . h-1) and 1-4% whilst sprinting (speeds
>25.2 km . h-1) (Bradley et al., 2009; Di Salvo et al., 2010; Rienzi et al., 2000).
Furthermore, the demands in the English Premier League are evolving over time
with an increase in distance covered at high-intensity being observed between
2007-2014 (Barnes et al., 2014). In addition to running match demands, each
player performs around 1000 – 1400 short activities changing every 4 – 6 seconds
during a match (Mohr et al., 2003). These include around 30 – 40 sprints (Bangsbo
et al., 2006), more than 700 turns (Bloomfield et al., 2007) and 30 – 40 tackles and
jumps (Bangsbo et al., 2006). Other actions including kicking, dribbling and
tackling are also endured although these are difficult to quantify specifically for
each match (Bangsbo, 1994).
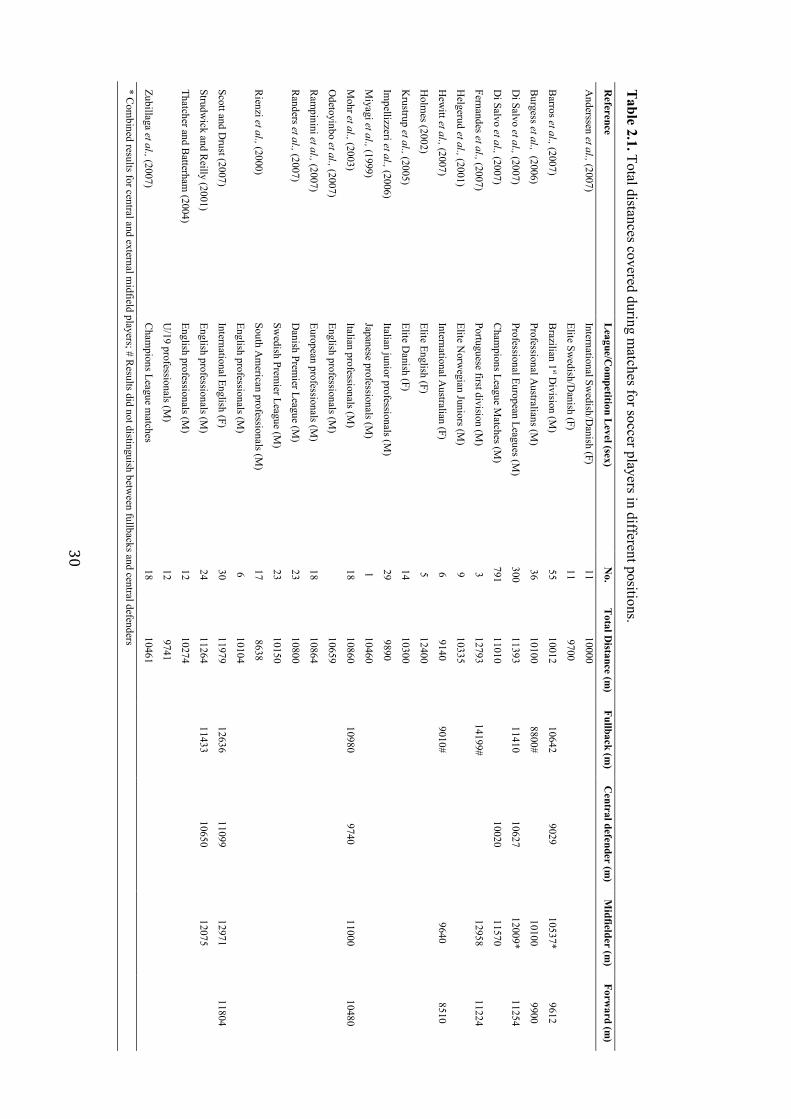
2.1.2. POSITIONAL DIFFERENCES IN ACTIVITY PROFILES
Understanding the different physiological load imposed on players with regards to
their positional role in the team can further enhance soccer specific training (Di
Salvo et al., 2007). A number of studies have identified positional differences in
match data, such as central midfielders covering the highest distance during a
match and central defenders covering the least (excluding goalkeepers) (see Table
2.1.). The greater distance covered by central midfield players is suggested to be a
29
product of both higher levels of fitness associated with such players and the role
which they play in the team (linking between defence and attack), a role which
evidently requires more sustained running (Bangsbo, 1994; Bangsbo & Michalsik,
2002; Bloomfield et al., 2007; Reilly & Thomas, 1976). Wide midfielders and wide
defenders have been reported to cover greater distances in high-intensity running
(>14.4 km . h-1), whilst both wide midfielders and full backs cover greater distances
sprinting (>25.2 km . h-1) compared to other outfield positions (Bradley et al.,
2009). The greater high-intensity running distance covered by wide midfielders is
suggested to be a product of their tactical role in the team and due to their high-
intensity runs being the longest in distance (Bradley et al., 2009). The greater sprint
distance could be of a similar tactical role in the team for both wide midfielders and
full backs with a greater amount of long runs in behind the opposition defence and
recovery runs to stop counter attacks from the opposition. Soccer is therefore a
complex sport with clear evidence of position specific high-intensity demands.
2.1.3. AEROBIC DEMANDS OF SOCCER MATCH PLAY
Soccer match play typically consists of large amounts of moderate to low intensity
activity (Di Salvo et al., 2007; Rienzi et al., 2000). Although it is difficult to
directly measure, analysis into the physical performance of match play provides
evidence for players’ aerobic energy systems being highly taxed during match play
(Stolen et al., 2005). It could, however, be supported by research reporting mean
and peak heart rates of around 85 and 98% of maximal, respectively (Krustrup et
al., 2005; Mohr et al., 2004; Suarez-Arrones et al., 2015; Torreño et al., 2016).
These heart rate values correspond to an average exercise intensity of
approximately 70% of maximal oxygen uptake (�̇�O2max) (Bangsbo et al., 2006) and
give further evidence that the aerobic energy system is frequently stressed during
match play.
30
Table 2.1. Total distances covered during m
atches for soccer players in different positions. R
eference L
eague/Com
petition Level (sex) N
o. T
otal Distance (m
) Fullback (m
) C
entral defender (m)
Midfielder (m
) Forw
ard (m)
Anderssen et al., (2007)
International Swedish/D
anish (F) 11
10000
Elite Sw
edish/Danish (F)
11 9700
Barros et al., (2007)
Brazilian 1
st Division (M
) 55
10012 10642
9029 10537*
9612
Burgess et al., (2006)
Professional Australians (M
) 36
10100 8800#
10100
9900
Di Salvo et al., (2007)
Professional European Leagues (M)
300 11393
11410 10627
12009* 11254
Di Salvo et al., (2007)
Cham
pions League Matches (M
) 791
11010
10020 11570
Fernandes et al., (2007) Portuguese first division (M
) 3
12793 14199#
12958
11224
Helgerud et al., (2001)
Elite Norw
egian Juniors (M)
9 10335
Hew
itt et al., (2007) International A
ustralian (F) 6
9140 9010#
9640
8510
Holm
es (2002) Elite English (F)
5 12400
Krustrup et al., (2005)
Elite Danish (F)
14 10300
Impellizzeri et al., (2006)
Italian junior professionals (M)
29 9890
Miyagi et al., (1999)
Japanese professionals (M)
1 10460
Mohr et al., (2003)
Italian professionals (M)
18 10860
10980 9740
11000 10480
Odetoyinbo et al., (2007)
English professionals (M)
10659
Ram
pinini et al., (2007) European professionals (M
) 18
10864
Randers et al., (2007)
Danish Prem
ier League (M)
23 10800
Sw
edish Premier League (M
) 23
10150
Rienzi et al., (2000)
South Am
erican professionals (M)
17 8638
English professionals (M
) 6
10104
Scott and Drust (2007)
International English (F) 30
11979 12636
11099 12971
11804
Strudwick and R
eilly (2001) English professionals (M
) 24
11264 11433
10650 12075
Thatcher and Batterham
(2004) English professionals (M
) 12
10274
U
/19 professionals (M)
12 9741
Zubillaga et al., (2007) C
hampions League m
atches 18
10461
* Com
bined results for central and external midfield players; # R
esults did not distinguish between fullbacks and central defenders
31
2.1.4. ANAEROBIC DEMANDS OF SOCCER MATCH PLAY
Although aerobic metabolism dominates energy production during a soccer
match, the most decisive actions are highly dependent anaerobic metabolism
(Cometti et al., 2001; Faude et al., 2012; Wragg et al., 2000). For example,
straight sprints were most frequent action in goal situations (Faude et al., 2012).
Also, performance in short-sprinting actions can distinguish between playing
level (Cometti et al., 2001). Match analysis data demonstrates that elite soccer
players perform 150-250 brief intense actions during a game (Mohr et al., 2003),
indicating that the rate of anaerobic energy turnover is high at certain times.
Additionally, there is evidence supporting the anaerobic metabolism demands in
soccer match play from more direct methods such as analysis of muscle and
blood metabolites. Intense actions during a game would lead to a high rate of
creatine phosphate breakdown, which to an extent is resynthesised in the
subsequent low intensity exercise periods (Bangsbo, 1994). In parts of a match,
concentrations of creatine phosphate in the muscle have also been reported to
decline below 30% of resting values following intense exercise periods when
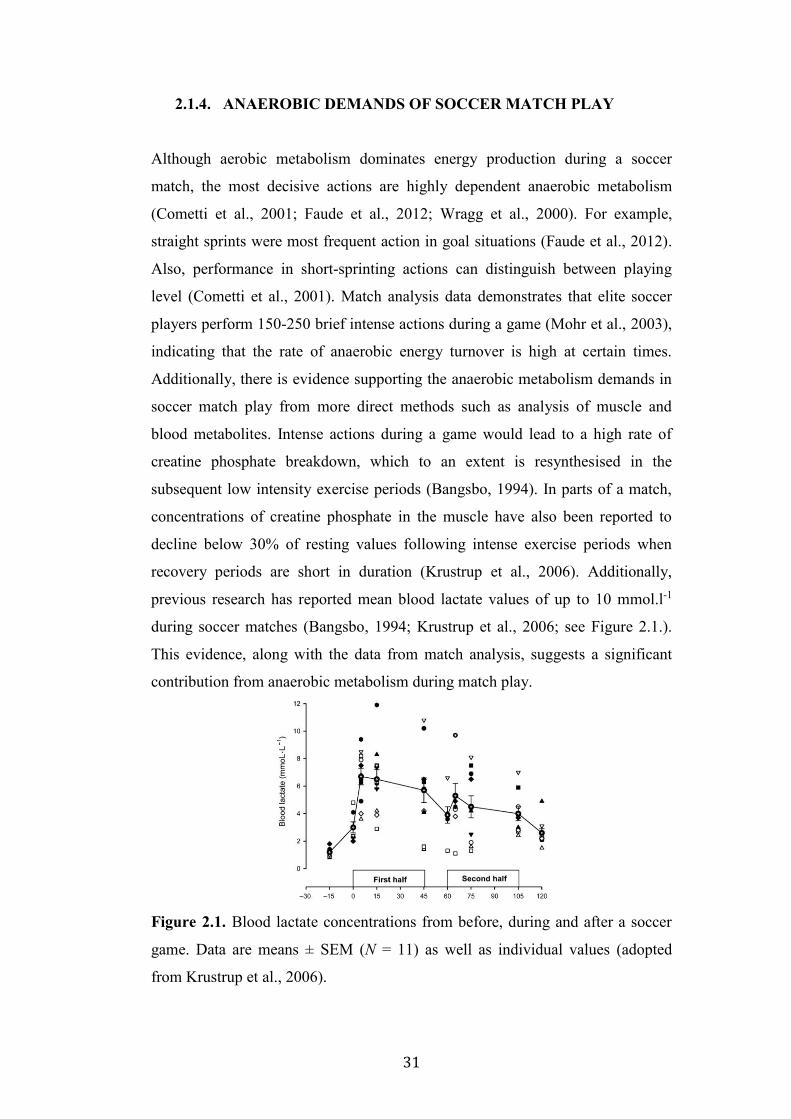
recovery periods are short in duration (Krustrup et al., 2006). Additionally,
previous research has reported mean blood lactate values of up to 10 mmol.l-1
during soccer matches (Bangsbo, 1994; Krustrup et al., 2006; see Figure 2.1.).
This evidence, along with the data from match analysis, suggests a significant
contribution from anaerobic metabolism during match play.
Figure 2.1. Blood lactate concentrations from before, during and after a soccer
game. Data are means ± SEM (N = 11) as well as individual values (adopted
from Krustrup et al., 2006).
32
2.1.5. SUMMARY
The match demands of soccer have been studied extensively. It is now
understood that match play consists of high intensity anaerobic efforts
superimposed on a base of aerobic activity. However, the demands can be more
complex given the players positional and tactical role in the team. It is therefore
essential to train the aforementioned systems in accordance to the players match
demands in order to improve or maintain soccer specific match fitness.
2.2. THE PHYSIOLOGICAL DEMANDS OF SOCCER TRAINING
2.2.1. OBJECTIVES OF SOCCER TRAINING
The objective of the training process in soccer is to administer a correct
frequency, volume, and intensity of training to deliver the appropriate
psychological and physiological stimuli to achieve adaptations which will
improve individual and team performance (Akenhead et al., 2016). As previously
discussed, soccer match play has contributions from both aerobic and anaerobic
energy systems. Training programs for players will therefore need to include
activities and exercise prescriptions that stress these systems. Players also need
to possess muscles that are both strong and flexible as these attributes are
important for the successful completion of technical actions (e.g., passing,
shooting, etc.), which ultimately determine the outcome of the match (Morgans
et al., 2014a). Fortunately, unlike matches, soccer training can consist of
different drills that the coaches can prescribe in order to fulfill different physical
aspects of training (Bangsbo et al., 2006). These drills should include activities
and exercises that stress both of these systems (Morgans et al., 2014a). In
addition, the prescription of such training load is heavily influenced by
competition frequency, with in-season micro-cycles of typically 3-7 days in
duration. Therefore, following the preseason period players are often required to
establish a “multiple peaking” periodisation model to enable a high performance
during matches throughout the season (Mujika, 2010; Pyne et al., 2009). This
then complicates the training load prescription with respect to the fixture
schedule to enable enough recovery from the last fixture and enable freshness
33
leading into the next. As such, specific attention should be made to the designing
of training sessions in different weekly micro-cycles. In addition to the match
frequency, match play is often deemed to be the highest load during the weekly
micro-cycle and will potentially leave non-starting players not experiencing
match load, which can potentially lead to a decrease in soccer-specific fitness
levels (Silva et al., 2011). More information is therefore required to identify the
different contextual factors that affect training load.
Soccer training can be described in terms of its process (the nature of the
exercise) or its outcome (anatomical, physiological, biochemical, and functional
adaptations) (Impellizzeri et al., 2004; Impellizzeri et al., 2005; Viru & Viru,
2000). The training process is prescribed by the teams coaching staff (i.e.,
conditioning drills, technical drills, or small sided games) and it has now become
common to examine these processes using a magnitude of devices to see if has
met the desired outcomes. In simple terms, the training process is most
commonly referred to as the external training load. However, the different
training processes prescribed will often produce different physical outputs
between players as they will cover different distances, distances in different
speed zones and accelerations etc. that will ultimately lead to different external
training load. For example, a central midfielder is likely to cover more distance
than a central defender in a small-sided game (e.g. 5v5 for 4x4minutes) as they
typically possess greater aerobic fitness levels due to the role they play in the
team. Therefore, monitoring of this external load in training sessions is key to
understanding the true external load. The training outcome is a consequence of
this external training load and the associated level of physiological stress that it
imposes on any given individual player (which is referred to as the internal
training load) (Viru & Viru, 2000). To optimise athletic performance, physical
training programs should be prescribed to suit each athlete’s individual
characteristics (Alexiou & Coutts, 2008). However, soccer training is most
commonly performed as a team and although different external loads can be
experienced, it is important to monitor the internal training load as it varies
between individuals in the group to how they have responded to a given stimulus
and it is this component of physical training that produces the stimulus for
adaptations (Booth & Thomason, 1991; Manzi et al., 2010; Viru & Viru, 2000).
34
When taken together, it is clearly important to assess both the external and
internal training load in order to assess the relationship between them and
individual player responses (Scott et al., 2013).
2.2.2. QUANTIFICATION OF TRAINING LOAD IN SOCCER
In order to successfully meet match demands, the physical preparation of elite
players has become an indispensable part of the professional game, with high
fitness levels required to cope with the ever-increasing demands of match play
(Iaia et al., 2009; Barnes et al., 2014). Nonetheless, despite nearly four decades
of research examining the physical demands of soccer match play (Reilly &
Thomas, 1976), the quantification of actual daily training loads completed by
elite professional soccer players are not currently well known. There are a
multitude of reasons for this lack of research but they are potentially due to the
only recent rise in the use of GPS in elite soccer training sessions. Additionally,
there is a large confidentiality issue regarding the training of elite players with
club staff often refusing to “give away” training data, as they perceive it as their
‘secret’ information.
Of the current available research literature on training load quantification in
soccer, the body of work has focused on either individual training drills or short
periods of a training program. Most research has been conducted into small-sided
games and their outcomes under varying conditions (Hill-Haas et al., 2011).
However, research looking at the absolute external training load for professional
soccer players has now started to emerge. For example, studies now exist
examining the training load during a single week (Owen et al., 2014), a 10-week
period (Guadino et al., 2013), the periodisation strategies adopted by an elite club
(Malone et al., 2015) and more recently, average values from training over a
season when one game was played per week (Akenhead et al., 2016). Although
training load studies are now starting to be undertaken, it is important to
understand the contextual factors, which can influence training load as each one
can alter both the absolute training stimulus and influence the subsequent
nutritional requirements.
35
2.2.3. FACTORS INFLUENCING TRAINING LOAD
2.2.3.1. COACHES INFLUENCE
Ultimately, in professional soccer, the head coach is responsible for the ‘on
pitch’ training program and it is their decision what to do in order to match their
needs. For example, training load in-season can be as high as 11.8 km total
distance (Owen et al., 2014), whereas Akenhead et al. (2016) observed that the
maximum load on one of the high load days in season reached 6.5 km total
distance. In addition, the role of the coach has shown different micro-cycle
structures in the organization of training sessions that could potentially influence
adaptations and overall training load during the week (Malone et al., 2015;
Akenhead et al., 2016). Further to the planning and delivery of training sessions,
coaches often have different styles in the way they work and different amounts of
verbal encouragement can be given which have been found to increase the
intensity of small sided games (Hoff et al., 2002) and subsequent physiological
responses (Rampinini et al., 2007). In addition to the training load, coaches can
influence match load in regards to the formation that they play on match day
(Tierney et al., 2016) and playing style (Bradley et al., 2013). This gives
sufficient evidence of the role of the coach on the training load undertaken by
elite soccer players.
2.2.3.2. POSITIONAL DIFFERENCES
There are significant positional differences in physical load observed in soccer
match play (Bradley et al., 2009; Bloomfield et al., 2007; Di Salvo et al., 2007;
Mohr et al., 2003). With regards to soccer training, soccer training is often
prescribed as an entire team; it is often dependent on the type of drill prescribed
whether positional differences are observed (Morgans et al., 2014b). For
example, small-sided games that are played in large spaces (e.g. 75x60m) with
large numbers (e.g. 11v11) will encompass game like situations and allow
actions to be performed in their positions and similar to what would be
performed in match play. However, small-sided games that are played in small
spaces (e.g. 35x20m) with small player numbers (e.g. 4v4) can partially remove
36
positional differences due to more intensive and less organizational requirements
for these games.
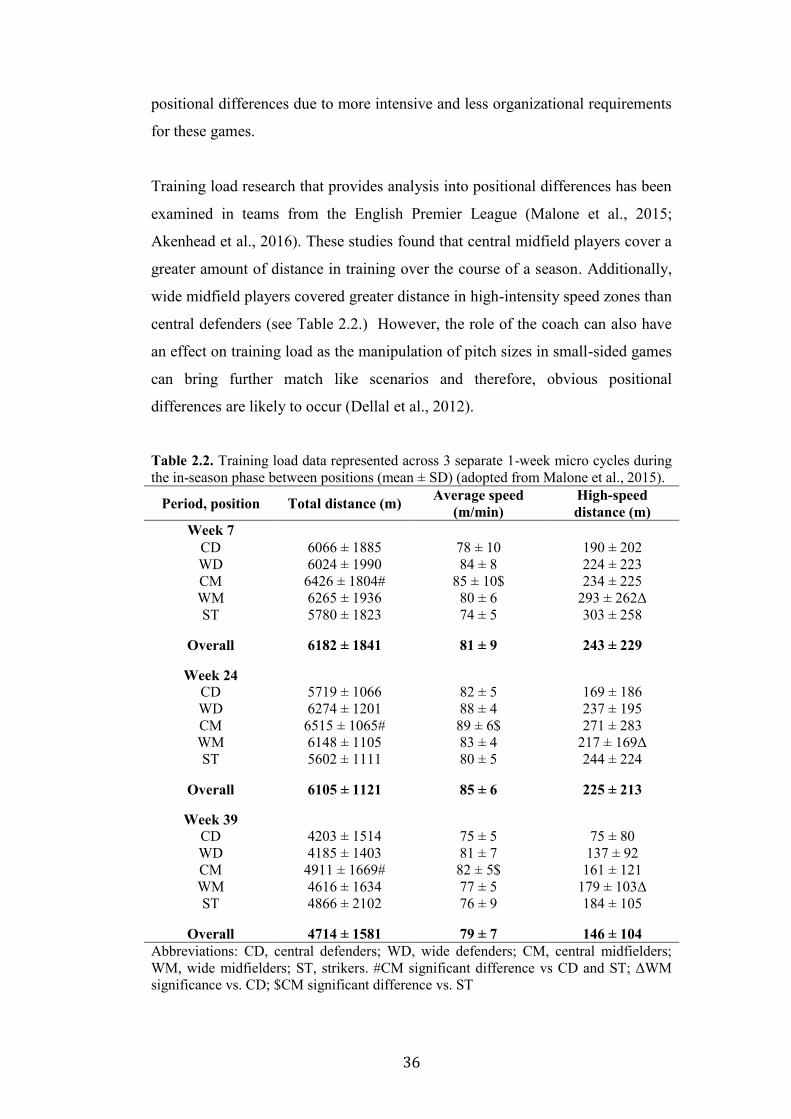
Training load research that provides analysis into positional differences has been
examined in teams from the English Premier League (Malone et al., 2015;
Akenhead et al., 2016). These studies found that central midfield players cover a
greater amount of distance in training over the course of a season. Additionally,
wide midfield players covered greater distance in high-intensity speed zones than
central defenders (see Table 2.2.) However, the role of the coach can also have
an effect on training load as the manipulation of pitch sizes in small-sided games
can bring further match like scenarios and therefore, obvious positional
differences are likely to occur (Dellal et al., 2012).
Table 2.2. Training load data represented across 3 separate 1-week micro cycles during the in-season phase between positions (mean ± SD) (adopted from Malone et al., 2015).
Period, position Total distance (m) Average speed (m/min)
High-speed distance (m)
Week 7 CD 6066 ± 1885 78 ± 10 190 ± 202 WD 6024 ± 1990 84 ± 8 224 ± 223 CM 6426 ± 1804# 85 ± 10$ 234 ± 225 WM 6265 ± 1936 80 ± 6 293 ± 262Δ ST 5780 ± 1823 74 ± 5 303 ± 258
Overall 6182 ± 1841 81 ± 9 243 ± 229
Week 24 CD 5719 ± 1066 82 ± 5 169 ± 186 WD 6274 ± 1201 88 ± 4 237 ± 195 CM 6515 ± 1065# 89 ± 6$ 271 ± 283 WM 6148 ± 1105 83 ± 4 217 ± 169Δ ST 5602 ± 1111 80 ± 5 244 ± 224
Overall 6105 ± 1121 85 ± 6 225 ± 213
Week 39 CD 4203 ± 1514 75 ± 5 75 ± 80 WD 4185 ± 1403 81 ± 7 137 ± 92 CM 4911 ± 1669# 82 ± 5$ 161 ± 121 WM 4616 ± 1634 77 ± 5 179 ± 103Δ ST 4866 ± 2102 76 ± 9 184 ± 105
Overall 4714 ± 1581 79 ± 7 146 ± 104 Abbreviations: CD, central defenders; WD, wide defenders; CM, central midfielders; WM, wide midfielders; ST, strikers. #CM significant difference vs CD and ST; ΔWM significance vs. CD; $CM significant difference vs. ST
37
2.2.3.3. STARTING STATUS
A player’s starting status often provides a difficult situation for sports scientists
with regards to replicating match load for non-starting players to enable
maintenance of fitness levels. Evidence of the methodological manipulation of
training load in the recovery from and in the build up to a competitive fixture
illustrate the importance of the match to the overall planning and preparation
strategies used within soccer (Malone et al., 2015). It is evident that match load
values are significantly greater than training load values. This is the case for
parameters such as total distance (e.g. < 7 km v ~10-13 km) (Bangsbo et al.,
2006), high-speed running distance (e.g. < 300 m v > 900 m) and sprinting
distance (e.g. < 150 m v > 200 m) (Di Salvo et al., 2010) and therefore creates a
difficult situation for the sports scientist with regards to maintaining players
fitness levels who do not start matches. As such, it could also be suggested that it
is the participation in match play itself that is the most appropriate stimulus for
preparing players for the physical demands of match play. This point is
especially relevant considering previous evidence demonstrating significant
positive correlations between individual in season playing time and aspects of
physical performance including sprint performance and muscle strength (Silva et
al., 2011). More recently, Morgans et al. (2017) demonstrated evidence of
improved counter movement jump height being proportional to the amount of
high-intensity distance covered in match play itself. Therefore, it is evident that
match play is a potent stimulus in the development of physical qualities
associated with soccer. In order to examine differences in load between players
with different starting status it is clear further information is required to inform
practice.
2.2.3.4. WEEKLY SCHEDULE
In addition to the aforementioned variables, another factor that can influence the
training load is the weekly fixture schedule (see Table 2.3.). In soccer, training
loads are often managed in weekly micro-cycles depending on how many
training days are available between matches (Malone et al., 2015). For example,
Akenhead et al. (2016) reported that 27 weeks of a 39-week season contained
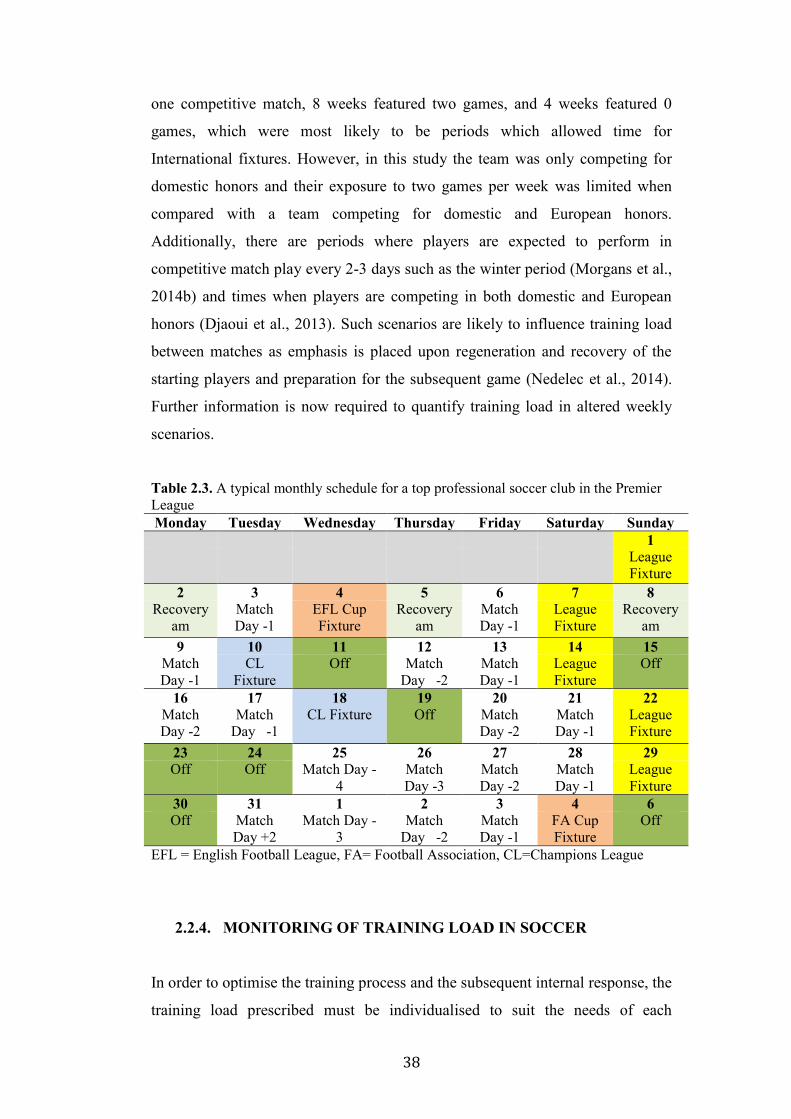
38
one competitive match, 8 weeks featured two games, and 4 weeks featured 0
games, which were most likely to be periods which allowed time for
International fixtures. However, in this study the team was only competing for
domestic honors and their exposure to two games per week was limited when
compared with a team competing for domestic and European honors.
Additionally, there are periods where players are expected to perform in
competitive match play every 2-3 days such as the winter period (Morgans et al.,
2014b) and times when players are competing in both domestic and European
honors (Djaoui et al., 2013). Such scenarios are likely to influence training load
between matches as emphasis is placed upon regeneration and recovery of the
starting players and preparation for the subsequent game (Nedelec et al., 2014).
Further information is now required to quantify training load in altered weekly
scenarios.
Table 2.3. A typical monthly schedule for a top professional soccer club in the Premier League Monday Tuesday Wednesday Thursday Friday Saturday Sunday
1 League
Fixture 2 3 4 5 6 7 8
Recovery am
Match Day -1
EFL Cup Fixture
Recovery am
Match Day -1
League Fixture
Recovery am
9 10 11 12 13 14 15 Match Day -1
CL Fixture
Off Match Day -2
Match Day -1
League Fixture
Off
16 17 18 19 20 21 22 Match Day -2
Match Day -1
CL Fixture Off Match Day -2
Match Day -1
League Fixture
23 24 25 26 27 28 29 Off Off Match Day -
4 Match Day -3
Match Day -2
Match Day -1
League Fixture
30 31 1 2 3 4 6 Off Match
Day +2 Match Day -
3 Match
Day -2 Match Day -1
FA Cup Fixture
Off
EFL = English Football League, FA= Football Association, CL=Champions League
2.2.4. MONITORING OF TRAINING LOAD IN SOCCER
In order to optimise the training process and the subsequent internal response, the
training load prescribed must be individualised to suit the needs of each
39
individual player (Alexiou & Coutts, 2008). Whilst too much and too little
training load may lead to accumulated fatigue (non-functional overreaching or
overtraining) and detraining, respectively, an appropriate training dose at the
individual level may allow optimal improvements in fitness and performance
(Bouchard & Rankinen, 2001: Hautala et al., 2006, Borresen & Lambert, 2009;
Manzi et al., 2009, 2013; Castagna et al., 2011). Additionally, the inappropriate
training load may lead to increased injury rates (Gabbett, 2016), increased
susceptibility to infection (Morgans et al., 2014b) and reduced subjective
recovery measures (Brink et al., 2012).
To examine whether soccer players are meeting, or indeed exceeding, training
load requirements, it is vital to monitor their individual training load (Scott et al.,
2013). There are a variety of different methods used to quantify training loads
undertaken by athletes (Borresen & Lambert, 2009). The most common methods
currently used to quantify training load in soccer involve analyzing players’ heart
rate and rating of perceived exertion (RPE) (Alexiou & Coutts, 2008). However,
recent advances in technology have now seen the increase in use of GPS in
soccer training (Cummins et al., 2013) and now (due to a recent FIFA and UEFA
rule changing) competitive matches. It is now common practice for elite soccer
clubs to use GPS and heart rate monitors to receive comprehensive and real-time
analysis of on-field player performance during competition and training
(Cummins et al., 2013). Additionally, during matches clubs often use semi-
automatic cameras in order to track players movements during competitive
games. This was developed due to the previous restriction of wearing any
monitoring device during competitive matches and has been used in many
leagues around the world. Although there are many methods to quantify training
and match load, in professional football many of the methods are used
collectively in order to give an overall perspective of physical load. Each method
has their own advantages and disadvantages and will now been discussed
individually.
40
2.2.4.1. HEART RATE
The use of HR monitors to quantify players’ internal responses is now
commonplace in professional soccer. Nowadays, HR monitors are a noninvasive
method that are used to quantify the cardiovascular strain placed on an individual
to a given training load (Drust et al., 2007). This can enable practitioners to
differentiate the internal response of an individual to the external load that was
provided. For example, different pitch sizes and players numbers in small-sided
games can elicit different HR responses on individuals and a group of players
(Owen et al., 2011; Hill-Haas et al., 2011). In addition, simple technical/ tactical
conditions can affect the internal response (Sassi et al., 2005). Therefore, the
integration of simultaneous HR monitoring and the use of GPS or multiple
camera systems can provide a precise profile of each player (Drust et al., 2007).
This combination could improve the link between the external demands of the
session and different drills and the cardiovascular exertion in responses.
Originally, HR was measured via continuous electrocardiogram (ECG)
recording, which were transmitted by short-range radio telemetry. However, this
was limited during soccer like activities as the connection of the electrodes to the
skin surface was compromised (Ali & Farrally, 1991). Since then, there has been
a development in radio telemetry technology, which has allowed for the creation
of ‘team systems’ such as the Polar Team 2 and are now commercially available
to soccer teams. This has allowed real-time HR monitoring with the possibility to
intervene if a player is receiving an undesired training response rather than
intervening after the session has finished and the data has been downloaded. In
addition to these technological advances, nowadays soccer teams use HR in
conjunction with GPS systems and are interlinked in the software. In soccer, it is
common to use this method during training sessions although difficulty arises
when players are to perform in match play and no GPS or HR is worn. Until
recently, a FIFA ruling meant that players were not permitted to wear any
integrated technology during match play although implementation of such
monitoring strategies in elite teams is still scarce. Therefore, the complete
cardiovascular stress of the weekly micro-cycle cannot be monitored.
41
Although the use of HR monitoring is practical, like many methods to quantify
training, it is not without its limitations and many factors influence the
relationship between workload and HR. For example, HR monitors are used in
soccer based on the principle that there is a linear relationship between HR and
�̇�O2max over a range of steady state submaximal workloads (Astrand & Rodahl,
1986). However, caution should be taken when interpreting the linear HR-�̇�O2max
relationship. This relationship is based on a continuous treadmill running test,
and this linearity does not necessarily apply during soccer due to its intermittent
nature (Hoff et al., 2002; Wicks et al., 2011). Moreover, the day-to-day variation
in HR is ~6 bpm (Lambert et al., 1998). Additionally, external factors such as
environmental conditions, hormonal variations (i.e. adrenaline), diurnal changes,
fatigue, hydration status, altitude, (Achten & Jeukendrup, 2003) and medication
can alter the HR responses of players and are often not taken into account when
analyzed. Perhaps the way to overcome such limitations is to provide a global
approach to training load analysis and use a combination of methods. This can
allow a more precise profile of each individual player according to their playing
position. Such monitoring tools will now be discussed separately below.
2.2.4.2. RATING OF PERCEIVED EXERTION
A rating of perceived exertion (RPE) is based on the understanding that athletes
can inherently monitor an individual’s internal response to an external stimulus
and it is one of the most commonly used methods to quantify the intensity and
load of training sessions in soccer (Coutts et al., 2009; Borresen & Lambert,
2009). Originally, the RPE scale was developed by Borg (1970) but since then,
there have been many adaptations that can allow an increased understanding of
training. For example, Foster et al. (2001) proposed an alternative method that
utilised Borg’s CR-10 RPE scale (Borg 1982) to simplify the quantification of
training load. Although this method was originally developed for endurance
athletes, research has shown that it has good levels agreement to HR methods
when quantifying internal training response in soccer players (Impellizzeri et al.,
2004, Alexiou & Coutts, 2008). Moving forward, new methods stressed for the
need of more information from the RPE score. Therefore, the Foster et al., (2001)
42
CR-10 scale score can be multiplied by the session duration in order to account
for an increased volume and/ or intensity to give a ‘session load’ score, to which
it has been validated in soccer (Impellizzeri et al., 2004). Additionally, RPE does
not require particular expensive equipment or training and can therefore be very
useful and practical for sports scientists and coaches to monitor and control load.
However, players and practitioners must follow correct procedures when
collecting data in order for the data to be true and effective. For example,
practitioners must familiarise players with the scales prior to use and the data
should be collected individually to prevent other individuals influencing the
rating given (Burgess & Drust, 2012).
Although there are many advantages of measuring RPE post training sessions to
quantify internal training load, it is not without its limitations. Firstly, the
complex interaction of many factors which contribute to the personal perception
of physical effort, including hormone and substrate concentrations or personality
traits may limit the use of RPE in accurately quantifying exercise intensity
(Borresen & Lambert, 2009). Additionally, RPE requires the athlete’s own
perception of training stress, which can include their psychological stress.
Therefore, it is possible that players could perceive the same physiological
stimulus differently as a consequence of their individual psychological state
(Morgan, 1973). For example, if a player was on different team during a small-
sided game in the training session that he felt didn’t reflect their current form
(i.e. the next games perceived starting team) this could leave them in a negative
mood that results in a change of the players true RPE score for the given session.
Therefore, sports scientists and coaches are left to rely on the individual player to
provide an accurate RPE of the session. Additionally, it is the responsibility of
the sports scientist and/ or coach who is taking the score to provide
familiarisation and allow for individual assessments to take place. Although RPE
as a subjective measure may not be as accurate as objective measures such as
HR, the combined use with the addition of GPS may provide a more complete
picture and allow coaches to make more informed decisions.
43
2.2.4.3. GLOBAL POSITIONING SYSTEMS
The development of GPS in 1990 has enabled the collection of real-time data on
human locomotion to examine sport performance in a more convenient, efficient,
and precise manner (Dellaserra et al., 2014). Originally, GPS was developed for
military purposes and first used for athlete tracking in 1997 (Schutz & Chambaz,
1997). Global positioning systems consist of 27 satellites equipped with atomic
clocks that orbit around the earth. These satellites continually send information
to GPS receivers and, using these signals, the receivers calculate the distance to
the satellite (Larsson et al., 2003). This is achieved by comparing the difference
in time between the satellites atomic clock encoded in the signal to the internal
clock of the receiver (Scott et al., 2016). A connection to a minimum of four
satellites is required to determine the position of the GPS receiver (Larsson et al.,
2003). With commercial GPS receivers, the speed the device is moving at is
calculated using Doppler shift (Scott et al., 2016). This is attained by examining
frequency of the satellite signal and is subject to change because of the
movement of the receiver (Larsson et al., 2003). Such commercial GPS systems
are now commonly used in team sports such as soccer to provide sports scientists
and coaches with comprehensive real-time analysis of on-field player
performance during competition or training.
Global positioning systems are classified by the rate at which they sample per
second. When they were first used in human locomotion and indeed with elite
soccer clubs, commercial devices had a sample rate of 1Hz (1 sample per
second). However, due to rapid advancements in the technology, sampling rates
have subsequently improved where now 10 and 15Hz units exist. Alongside
these developments, the development and subsequent acceptance of micro-
technology in sport has led to the integration of other micro inertial sensors
within GPS devices, such as tri-axial accelerometers, magnetometers and
gyroscopes; collectively termed as micro electrical mechanical system (MEMS)
devices (Malone et al., 2017a). The tri-axial accelerometer measures a composite
vector magnitude (expressed as a G-force) by recording the sum of accelerations
measured in three axes (X, Y, and Z planes) (Waldron et al., 2011). Typically, in
commercial GPS units the accelerometers have a sampling frequency of 100Hz
44
and therefore offer a higher sampling rate compared to devices without (Boyd et
al., 2011). Therefore, the integration of GPS with a tri-axial accelerometer
enables the capture of information on work rate patterns and more
comprehensive information on physical loading. This has led to the widespread
use in elite soccer clubs during training and more recently (due to a change in
FIFA ruling) a growing use during competitive match play.
In comparison to other tracking techniques, GPS is time efficient and provides
real-time feedback, allowing greater practicality in team sports (Scott et al.,
2016). They have the ability to objectively quantify the external training load of
individual athletes during training and matches. Currently, practitioners can use a
wide range of variables in order to quantify the frequency, volume, and density
of the external training load components. Manufacturers provide these variables
but practitioners mainly use variables such as total distance covered, the distance
covered in different velocity ranges and/or the number of times they have
executed a run at a speed in each velocity range. An understanding of the
different movement demands of soccer training can allow a greater
understanding of the total physical load (Akenhead et al., 2016) and give
potential indications to energy system utilisation. To further enhance the
comprehensive understanding of training load, the development of tri-axial
accelerometers in GPS devices has allowed for the quantification of different
metabolic demanding activities in all three planes of movement that are not taken
into account by the analysis of movement profiles alone (Barrett et al., 2014).
These measures are based on the instantaneous rate of change in acceleration in
each of the three vectors (X, Y and Z axis). Using the accelerometers a vector-
magnitude algorithm, which is termed differently by each GPS manufacturer, the
variable can be produced. The most commonly used metric in the research
literature being PlayerLoad (Boyd et al., 2014; Barrett et al., 2014; Akenhead et
al., 2016). Although such measures of accelerometer load have demonstrated
acceptable levels of inter- and intra-unit reliability (Boyd et al., 2011; Kelly et
al., 2015), it is still not common place for players to use GPS devices during
competitive match play at the elite level.
45
Despite the advantages of using GPS systems to analyze and interpret external
training and match load, practitioners must understand the limitations around
validity and reliability of GPS devices in order to accurately interpret data. The
first attempt to validate a commercially available GPS device for the
measurement of human locomotion was published in 1997 (Schutz & Chambaz,
1997). Here they used one participant who undertook a number of different trials
at different velocities, comparing GPS data to a Swiss chronometer. Although the
results seemed promising for GPS use (r = .99 and 5% CV), the methodology
was not considered gold standard for measuring GPS velocities. Since then, there
has been an abundance of literature examining the validity and reliability of GPS
for the measurement of movement in and more specifically, soccer specific
movements. In addition, when GPS units are increased in velocity and players
move in a multidirectional motion there becomes a decreased accuracy of
measurement. For example, during initial testing of the 1-5Hz units, the validity
and reliability of short distance linear running were found to be poor. Moreover,
Rampinini et al. (2015) found that 10Hz GPS devices had good accuracy for total
distance and high speed running (CV = 1.9% and CV = 4.7%, respectively).
However, accuracy became poor during very high-speed running (CV = 10.5%)
(Rampinini et al., 2015). Unlike, 1-5Hz GPS devices, 10Hz were found to have
no significant difference to the criterion method of a tape measure in a team sport
simulated circuit consisting of change of direction activities (Johnston et al.,
2014). In addition, the quality of satellite coverage can also give limitations
when using the GPS unit and this has to be taken into account upon analysis.
Despite such limitations, GPS is now one of the most common monitoring tools
used in soccer training as it can provide extensive feedback on the external
training load in real-time. However, practitioners must be aware that they should
individually quantify their GPS systems degree of error and consider this in any
of the decision-making processes. In order to limit the degree of error when
using GPS devices, practitioners are advised to follow individual manufacturers
guidelines in order to get the ‘best’ data. For example, conducting the activity in
an open space instead of covered area such as soccer stadiums will allow an
increased number and enhanced signals to the surrounding satellites.
Additionally, manufacturers often advise to turn devices on 30 minutes prior to
activity in order to allow satellite lock on.
46
Until recently, the concomitant use of GPS and semi-automatic motion analysis
software such as ProZone® has been widely used in training sessions and
matches, respectively. This was partly due to the FIFA ruling that did not permit
players to wear tracking devices in competition. This rule has now been
overturned but tracking devices such as GPS are still rarely used at the elite level.
Therefore, teams would typically employ a semi-automatic camera system such
as ProZone® and Amisco to quantify match movement demands and use GPS to
quantify training demands. However, the simultaneous use of GPS and semi-
automatic camera systems has obvious implications. GPS (1Hz and 5Hz devices)
has been shown to under-report high intensity running, low intensity running and
total distance compared to the Amisco system (Randers et al., 2010).
Additionally, Harley et al. (2011) reported that both sprint distance and high-
intensity running distances were underestimated in 5Hz GPS devices compared
to the ProZone® system. This study concluded that sprint performances were
~40% different between systems. Also, in 10Hz devices, high speed running and
sprinting were suggested to be underestimated compared to ProZone® systems by
10-15% and 15-20%, respectively (Milsom et al., Unpublished Data). In an
attempt to overcome such issues between systems, Buchheit et al. (2014)
provided equations for data in order to make systems more interchangeable in
tracking longitudinal load, designing training programs and drills. Nevertheless,
this is the approach to monitoring that is commonly employed by sports
scientists in the elite soccer environment and is currently a difficult
methodological issue to overcome.
2.2.4.4. SEMI-AUTOMATIC CAMERA SYSTEMS
The monitoring of players’ activity profiles during competition was originally
achieved during real-time analysis from one observation of a single player’s
match activity by one observer (Reilly & Thomas, 1976). Diagrams on the pitch
were used with markings and cues used to estimate distances travelled. However,
such methods elicit high amounts of complexity and consumption of time
required for coding, analyzing and interpreting the output and thus, formed
barriers for their use in professional soccer (James, 2006). Over the past two
47
decades, technological advances have allowed for the introduction of more
sophisticated semi-automatic camera systems in the form of ProZone® and
Amisco®. This allows for multi-player video tracking using computer and video
technology and is now one of the most comprehensive and widely used
commercial tracking systems in professional soccer (Carling et al., 2008).
Generally, these tracking systems require the installation of several permanent
cameras fixed in optimally calculated positions to cover the entire playing area.
At least two cameras will cover each player at any time whilst on the pitch to
improve accuracy of tracking. The stadium and pitch are first calibrated in terms
of height, length and width and transformed into a 2-dimensional model to allow
player positions (x and y coordinates) to be calculated from the camera sources.
Player movements can then be tracked on the video at a sampling rate of 10-
25Hz (depending on the system) by computer software through either manual
operation or automatic tracking processes during the game. Despite being largely
computer automated, these tracking systems still require some manual input as
well as continual verification by an operator to make sure that the computer
program correctly tracks players.
By establishing the work rate profiles of soccer matches, these motion analysis
systems allow practitioners to examine the total distance covered by individual
players and teams during the matches. Additionally, movement activities are
generally coded to their time spent at an intensity, which is determined by the
speed of actions. Therefore, distances are often categorised into different speed
categories related to soccer and also the time spent in each category. Di Salvo
and colleagues (2006) produced a validation study of ProZone® system in its
application to monitoring soccer specific actions of six male subjects performed
in an elite stadium setting. Subjects performed a course of various soccer specific
actions including linear sprints and change of direction comparing the activity
data to timing gate measurements. Correlation coefficients and absolute
reliability coefficients between velocity measurements over runs of 50 and 60 m
meters obtained from both systems were high (r=0.999; total error 0.05, limits of
agreement 0.12). Therefore, such camera tracking systems were found to have an
acceptable level of validity and reliability in tracking soccer specific movements
48
and have gone on to be utilised during each competitive game in elite
professional soccer (Barnes et al., 2014).
Although the practicality of this monitoring strategy is not very labor intensive
for the clubs who use the data, there is a large cost associated with the
installation and subscription to the tracking systems. Additionally, this
information cannot yet be viewed real-time and there are large wait times (often
24-36-h post game) in order for the dataset to be available to analyze. Both of the
aforementioned points give reasons for the lack of use for training sessions as
this type of monitoring requires cheaper and faster analysis of training demands.
Also, the reliance on trained observers and analysts still has some potential for
human error in coding activates from the computer software.
2.2.5. SUMMARY
Soccer training does not near recreate the load experienced during match play. It
is however, a complex process that can be monitored numerous ways, which can
have an effect on the way training load is perceived. Additionally, training load
can be different depending on the coach, the player’s position, the players’
stating status in the team and of course the weekly match schedule. In addition to
modulating components of physical fitness, such factors may have also have
implications for the nutritional requirements of training. As such, the nutritional
requirements of soccer players will now be reviewed in the next section.
2.3. NUTRITIONAL DEMANDS OF SOCCER
2.3.1. OVERVIEW OF METABOLIC DEMANDS OF MATCH PLAY
The high levels of aerobic energy production in soccer and the pronounced
anaerobic energy turnover during periods of match play are associated with the
consumption of large amounts of substrates (Bangsbo, 1994). Carbohydrates are
the major energy source for moderate to high-intensity exercises (>70%
VO2max) (van Loon et al., 2001) although CHO that is stored as muscle
glycogen is limited to around 500 g and is depleted after soccer match play
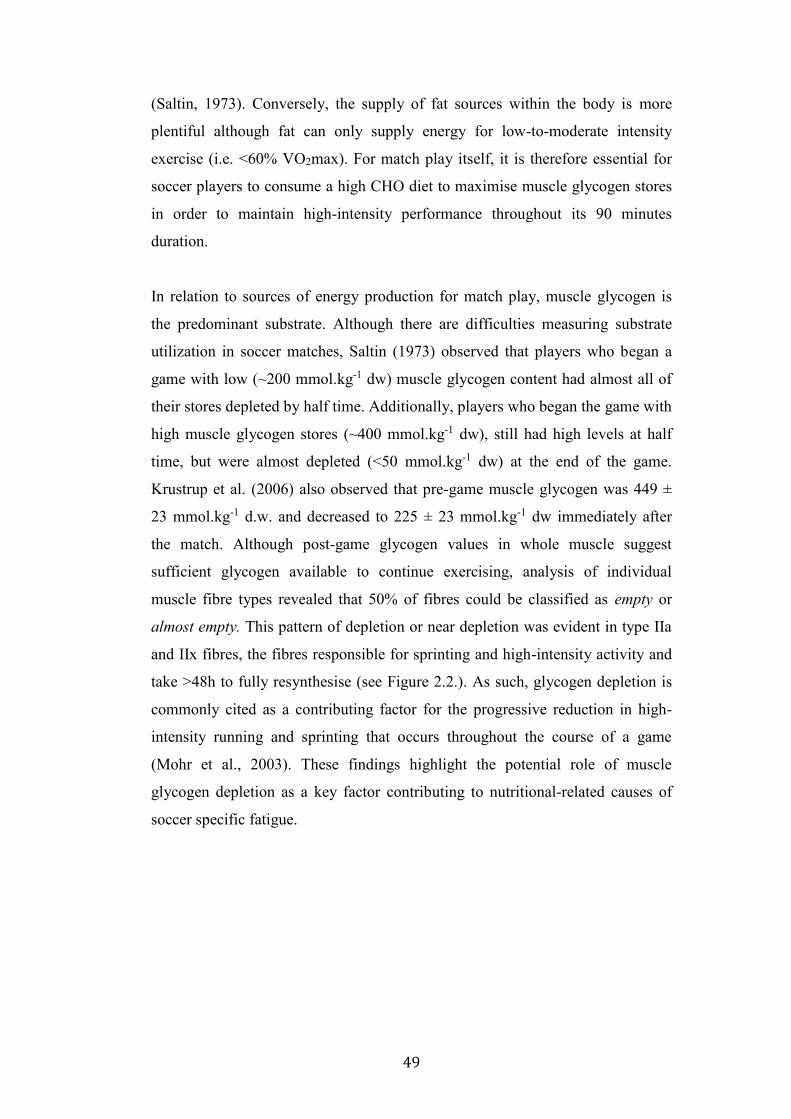
49
(Saltin, 1973). Conversely, the supply of fat sources within the body is more
plentiful although fat can only supply energy for low-to-moderate intensity
exercise (i.e. <60% VO2max). For match play itself, it is therefore essential for
soccer players to consume a high CHO diet to maximise muscle glycogen stores
in order to maintain high-intensity performance throughout its 90 minutes
duration.
In relation to sources of energy production for match play, muscle glycogen is
the predominant substrate. Although there are difficulties measuring substrate
utilization in soccer matches, Saltin (1973) observed that players who began a
game with low (~200 mmol.kg-1 dw) muscle glycogen content had almost all of
their stores depleted by half time. Additionally, players who began the game with
high muscle glycogen stores (~400 mmol.kg-1 dw), still had high levels at half
time, but were almost depleted (<50 mmol.kg-1 dw) at the end of the game.
Krustrup et al. (2006) also observed that pre-game muscle glycogen was 449 ±
23 mmol.kg-1 d.w. and decreased to 225 ± 23 mmol.kg-1 dw immediately after
the match. Although post-game glycogen values in whole muscle suggest
sufficient glycogen available to continue exercising, analysis of individual
muscle fibre types revealed that 50% of fibres could be classified as empty or
almost empty. This pattern of depletion or near depletion was evident in type IIa
and IIx fibres, the fibres responsible for sprinting and high-intensity activity and
take >48h to fully resynthesise (see Figure 2.2.). As such, glycogen depletion is
commonly cited as a contributing factor for the progressive reduction in high-
intensity running and sprinting that occurs throughout the course of a game
(Mohr et al., 2003). These findings highlight the potential role of muscle
glycogen depletion as a key factor contributing to nutritional-related causes of
soccer specific fatigue.
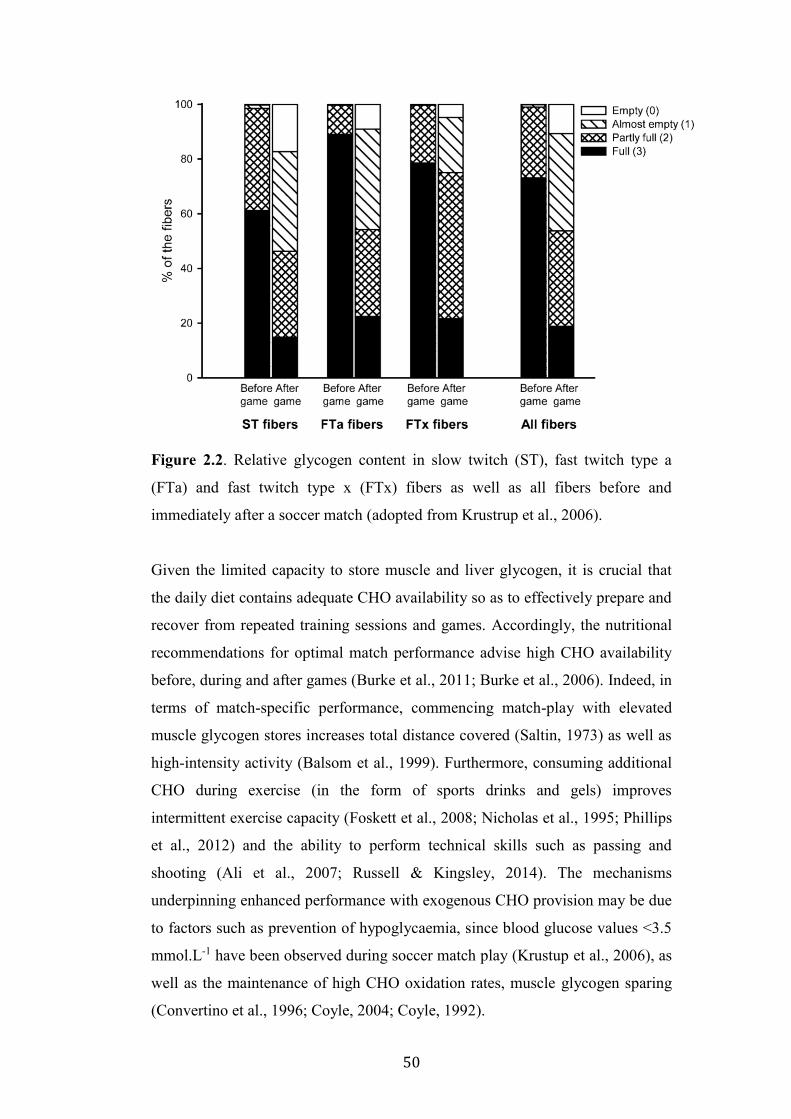
50
Figure 2.2. Relative glycogen content in slow twitch (ST), fast twitch type a
(FTa) and fast twitch type x (FTx) fibers as well as all fibers before and
immediately after a soccer match (adopted from Krustrup et al., 2006).
Given the limited capacity to store muscle and liver glycogen, it is crucial that
the daily diet contains adequate CHO availability so as to effectively prepare and
recover from repeated training sessions and games. Accordingly, the nutritional
recommendations for optimal match performance advise high CHO availability
before, during and after games (Burke et al., 2011; Burke et al., 2006). Indeed, in
terms of match-specific performance, commencing match-play with elevated
muscle glycogen stores increases total distance covered (Saltin, 1973) as well as
high-intensity activity (Balsom et al., 1999). Furthermore, consuming additional
CHO during exercise (in the form of sports drinks and gels) improves
intermittent exercise capacity (Foskett et al., 2008; Nicholas et al., 1995; Phillips
et al., 2012) and the ability to perform technical skills such as passing and
shooting (Ali et al., 2007; Russell & Kingsley, 2014). The mechanisms
underpinning enhanced performance with exogenous CHO provision may be due
to factors such as prevention of hypoglycaemia, since blood glucose values <3.5
mmol.L-1 have been observed during soccer match play (Krustup et al., 2006), as
well as the maintenance of high CHO oxidation rates, muscle glycogen sparing
(Convertino et al., 1996; Coyle, 2004; Coyle, 1992).
51
Free fatty acids (FFA) concentrations in the blood are increased during the game,
but most notably in the second half (Bangsbo, 1994; Krustrup et al., 2006; see
Figure 2.3.). As ~80-90% of soccer match play is covered at low to moderate
intensity activity and consists of frequent breaks and rest periods (Bradley et al.,
2009; Di Salvo et al., 2010; Rienzi et al., 2000), such running intensities and rest
periods allow for increased blood flow to adipose tissue, which promotes the
release of FFA and therefore gives an indication of lipolysis occurring in soccer
match play. Furthermore, hormonal concentrations such as catecholamine
concentrations are progressively elevated and insulin concentrations are lowered
during match play, which stimulate a high rate of lipolysis and release FFA into
the blood (Bangsbo et al., 1994; Galbo, 1983). Such progressive elevations in
catecholamine during the second half may also increase the use of muscle
triglycerides (Galbo, 1992). Also, due to the intermittent nature of soccer and
large amounts of rest periods (i.e. a during a break in play such as a free-kick or
substitution), FFA will change during a match and may cause a higher uptake
and oxidation of such acids by the contracting muscles (Turcotte et al., 1991).
Therefore, both forms of substrate may be used during a soccer game and the
latter may be a compensatory mechanism for the lowering of muscle glycogen.
Figure 2.3. Plasma FFA concentrations before, during and after a soccer game
(adopted from Krustrup et al., 2006).
52
2.3.2. OVERVIEW OF THE NUTRITIONAL RECOMMENDATIONS
FOR MATCH PLAY
2.3.2.1. DAY PRIOR
Given the role of muscle glycogen in fuelling moderate and high-intensity
exercise, the major goal of nutritional interventions in the days prior to the game
should be to maximise pre-game muscle and liver glycogen stores (i.e. CHO
loading). Soccer players can achieve high glycogen stores with as little as 24-36
h of a high CHO (6-10 g.kg-1) diet (Bassau et al., 2002), providing that training
demands on the day prior to match day are relatively low in volume and
intensity. To be able to fully maximise muscle glycogen stores on the day before
the game it is necessary to consume larger portion sizes of increased frequency
that consists of mainly high glycaemic index foods and drinks (Burke et al.,
1993; Wee et al., 2005).
2.3.2.2. PRE-MATCH MEAL
Soccer players often perceive the pre-match meal to be the most important for
match performance as it’s the closest to match play itself. However, assuming
that players have correctly CHO loaded in the day and morning prior to match
play, the pre-match meal is simply time to “top up” glycogen stores prior to
match performance (Chryssanthopoulos et al., 2004; Wee et al., 2005).
Essentially, the timing of the pre-match meal is dependent on the location and
timing of kick off. For example, for a regular 3 pm Saturday kick off, nutritional
preparation on match day would consist of a light breakfast and the main pre-
match meal consumed around 11.30 am. Alternatively, for an evening kick off
between 7.45 and 8 pm, match day nutrition would be extended and the pre-
match meal should be consumed at around 4.30 pm. Finally, at the opposite end
of the spectrum is the lunch time kick off (usually between 12 and 1 pm) and in
this situation, match day nutrition would be limited, with breakfast effectively
serving as the pre-match meal. In this case, breakfast is the opportunity to
replenish the glycogen stores that are lost from the liver during an overnight fast
53
and help “top up” muscle glycogen stores in preparation for match play (Casey et
al., 2000).
Regardless of the timing of the game, it is always advised that the pre-match
meal be reasonably high in CHO (approximately 2 g.kg-1) and consumed within
3-4 hours prior to kick off so as to allow sufficient time for digestion and avoid
gastrointestinal problems and feelings of gut fullness (Wee et al., 2005). It is
important that the stomach be reasonably empty at the time of commencing the
match so the digestion and absorption of food do not compete with the exercising
muscles for blood supply. Furthermore, consumption of fibre (e.g. vegetables)
and high fat foods (even those associated with protein sources such as red meat
and cheese) should be avoided given that they slow down the rate of gastric
emptying.
2.3.2.3. DURING MATCH
Carbohydrate intake in the correct doses during the game itself enables the player
to maintain appropriate energy availability by sustaining blood glucose levels,
increasing CHO oxidation and potentially sparing muscle and liver glycogen
(Convertino et al., 1996; Coyle, 2004; Coyle, 1992). The addition of CHO
feeding at regular intervals during simulated soccer match play after a prior CHO
loading strategy improves high-intensity running capacity during simulated
intermittent exercise (Foskett et al., 2008). Additionally, CHO provided during
games improves aspects of technical (Ali & Williams, 2009; Russell & Kingsley,
2012) and cognitive (Welsh et al., 2002) performance. During exercise, CHO
oxidation from exogenous feeding has maximal oxidation rates from glucose
polymers of approximately 1 g.min-1 (Jeukendrup, 2010), and players are
therefore advised to consume 30-60 g per hour. Such doses are equivalent to
500-1000 ml of a conventional 6% sports drink though ingestion of such
volumes of fluid are unlikely given that opportunities for fuelling are limited to
natural breaks in match play and the half-time period.
In order to sustain plasma glucose levels and potential spare endogenous
glycogen stores, it is likely required to begin fuelling from the beginning of the
54
game in any opportunity available (i.e. immediately before players leave the
changing rooms). Additionally, players should attempt to fuel again at the half-
time period and at regular periods in the second half. Rates of CHO oxidation are
largely similar regardless if CHO is provided in fluid, gels or sports bars (Pfeiffer
et al., 2010a, 2010b) and thus players should be provided with their preferred
source to encourage appropriate energy intake. The provision of gels or sports
bars is particularly useful to those who prefer water for hydration as opposed to
sports drinks as well as those who prefer not to drink much fluid at all.
2.3.2.4. POST-MATCH
The goal of post-match nutrition is to replenish both muscle and liver glycogen
stores as well as promoting protein synthesis so as to facilitate remodeling and
repair of muscle tissue. In relation to muscle glycogen synthesis, the general
consensus is that consuming 1.2 g.kg-1.h-1 of high glycaemic CHO for 3-4 hours
is optimal to facilitate short-term glycogen re-synthesis (Beelen et al., 2010).
Importantly, post-match feeding should begin immediately (i.e. in the changing
room) as this is when the muscle is most receptive to glucose uptake and the
enzymes responsible for glycogen synthesis are most active (Ivy et al., 1988).
Whether or not the CHO is provided in solid or liquid form is immaterial and
should be left to the player’s preference. In practice, therefore, a selection of high
CHO snacks and drinks should be readily available in the changing room post
game. Additionally, these meals should contain moderate protein intake to repair
exercise induced muscle damage and post-exercise protein synthesis (Ivy, 2004;
Ferguson-Stegall et al., 2011).
2.3.3. OVERVIEW OF THE METABOLIC DEMANDS OF
TRAINING
Although the physical demands of match play have long been known, an
increased use of contemporary tracking technologies has allowed professional
clubs to easily collect objective internal and external variables of players during
training (Buchheit et al., 2014). This had led to an increase in training load
research in different micro-cycles (Akenhead et al., 2016; Malone et al., 2015).
55
Such data suggest that absolute training loads are not as high as those
experienced in match play. This is the case for parameters such as total distance
(e.g. <7 km vs. 10-13 km) (Bangsbo et al., 2006), high speed running distance
(e.g. <300 m v >900 m) (Bradley et al., 2009) and sprint distance (e.g. <150 m v
>200 m) (Di Salvo et al., 2010). It is therefore likely that the need for
maximizing muscle glycogen stores for training days is not necessary and that a
sufficient amount of CHO should be consumed in order to simply fuel training
sessions. Consuming a daily diet on training days that is high in CHO and energy
may lead to elevated body fat and reduced performance adaptations (Bartlett et
al., 2015). Therefore, more information is required on current training load
practices during typical micro-cycles experienced by elite soccer players. Such
data could allow more specific nutritional guidelines in relation to CHO intake.
Although the actual energy demands of soccer training are still relatively
unknown, research examining a simulated ‘in season’ soccer training session on
a treadmill displayed a 14% reduction in muscle glycogen stores (Jeong et al.,
2015. Data from this study suggest that muscle glycogen is not heavily taxed
during training. However, the full demands of soccer training cannot be
replicated on a treadmill due to lack of accelerations/ decelerations and change of
directions. More information is required on the metabolic demands of soccer
training to develop more comprehensive nutritional guidelines.
In addition to the “on pitch” endurance training and matches, soccer players are
often required to perform maximal strength training sessions in the gym within
the same training cycle. This is defined as ‘concurrent training’ (Fyfe et al.,
2014). The challenge for practitioners is to design and implement concurrent
training programs into the weekly micro-cycle and also facilitate this with the
correct nutritional prescription. However, for soccer players this is not always
systematic and players often perform strength training prior to on pitch training
sessions or strength training after pitch sessions with varying recovery times in
between. This can subsequently affect the habitual intakes of players, as they
tend to consume protein shakes post resistance training whilst adhering to their
regular meal patterns. Using an ecological valid study where participants
underwent “real world” methodologies, Enright et al. (2015) performed
56
concurrent training two-days per week when soccer training was performed prior
to strength training vs. strength training being performed prior to soccer training.
Enright and colleagues reported larger strength benefits when soccer training was
performed in the morning, followed by lunch, strength training and a whey
protein shake with exercise order being suggested the defining factor. However,
the more evenly distributed protein intake across the day during this trial is also a
potential factor (Areta et al., 2013; Mamerow et al., 2014). Therefore, soccer
players should be advised to consider the training structure and the potential
effects of protein distribution in facilitating training adaptations when advising
nutritional recommendations.
2.3.4. ENERGY DEMANDS OF SOCCER PLAYERS
In addition to the metabolic demands of soccer, quantifying the total energy
expenditure (EE) of soccer players is necessary in order to provide accurate
nutritional programs and guidance, however in elite players, this is currently not
well known. The total EE and requirements of each soccer player are unique,
arising from the contribution of basal metabolic rate, thermic effect of food,
thermic effect of activity, and in some cases growth (Manore & Thompson,
2006). Nowadays elite professional soccer players can undertake multiple
training sessions per day and compete in two competitive matches during the
weekly micro-cycle. This means that the player’s EE is likely to be high and
often periodised in accordance with the daily load. It is therefore essential to
have an accurate understanding of EE in order to prescribe sound nutritional
programs. The development of valid methods for assessing EE in soccer players
is highly beneficial to the sports scientist, nutritionist, coach and player.
2.3.4.1. DOUBLY LABELED WATER
The use of the DLW for the assessment of free-living EE has been used for over
three decades (Schoeller & van Santen, 1982). This technique has been widely
acknowledged as the criterion or “gold standard” approach to assess EE in free-
living individuals (Schoeller & Delany, 1998; Speakman & Roberts, 1995; Park
et al., 2014). It provides the total energy expended over a 4-20 day period and is
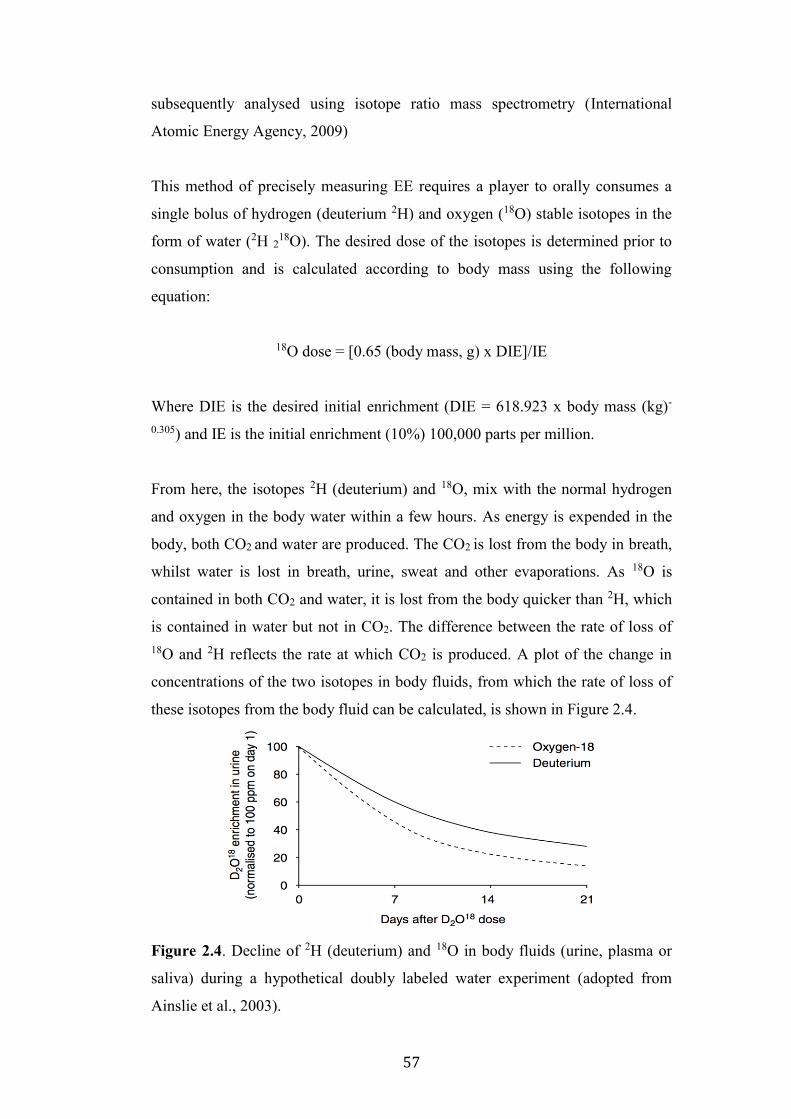
57
subsequently analysed using isotope ratio mass spectrometry (International
Atomic Energy Agency, 2009)
This method of precisely measuring EE requires a player to orally consumes a
single bolus of hydrogen (deuterium 2H) and oxygen (18O) stable isotopes in the
form of water (2H 218O). The desired dose of the isotopes is determined prior to
consumption and is calculated according to body mass using the following
equation:
18O dose = [0.65 (body mass, g) x DIE]/IE
Where DIE is the desired initial enrichment (DIE = 618.923 x body mass (kg)-
0.305) and IE is the initial enrichment (10%) 100,000 parts per million.
From here, the isotopes 2H (deuterium) and 18O, mix with the normal hydrogen
and oxygen in the body water within a few hours. As energy is expended in the
body, both CO2 and water are produced. The CO2 is lost from the body in breath,
whilst water is lost in breath, urine, sweat and other evaporations. As 18O is
contained in both CO2 and water, it is lost from the body quicker than 2H, which
is contained in water but not in CO2. The difference between the rate of loss of 18O and 2H reflects the rate at which CO2 is produced. A plot of the change in
concentrations of the two isotopes in body fluids, from which the rate of loss of
these isotopes from the body fluid can be calculated, is shown in Figure 2.4.
Figure 2.4. Decline of 2H (deuterium) and 18O in body fluids (urine, plasma or
saliva) during a hypothetical doubly labeled water experiment (adopted from
Ainslie et al., 2003).
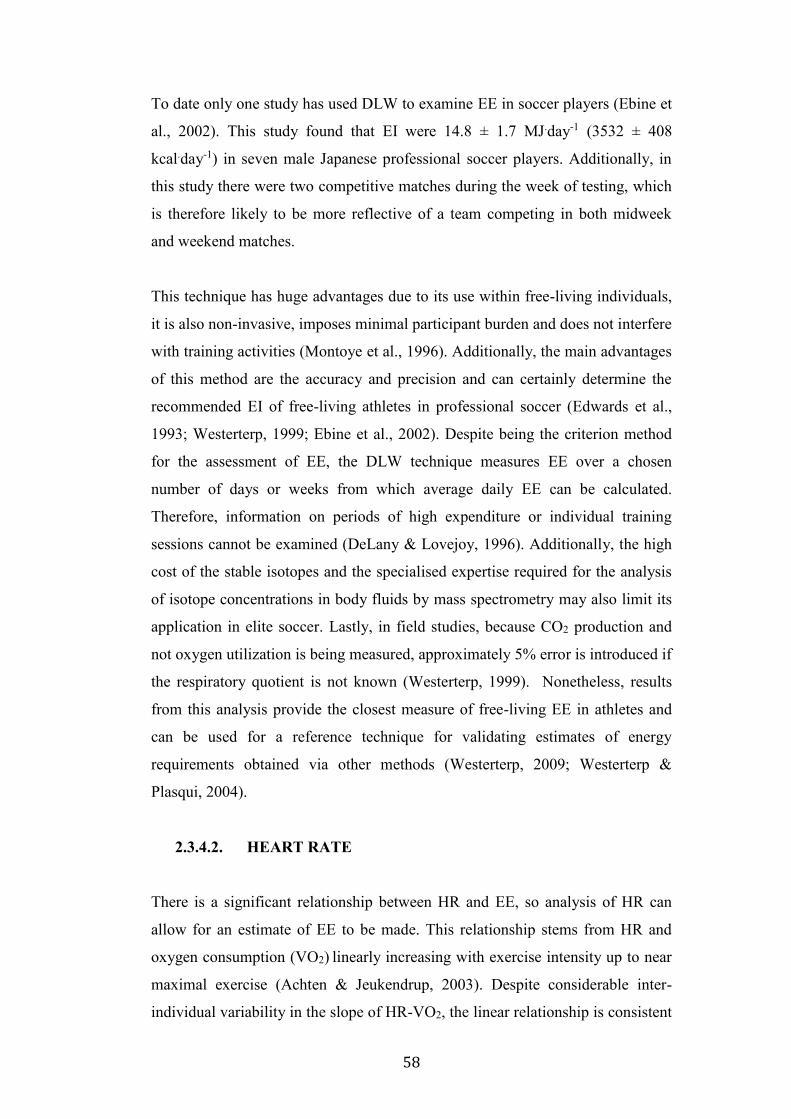
58
To date only one study has used DLW to examine EE in soccer players (Ebine et
al., 2002). This study found that EI were 14.8 ± 1.7 MJ.day-1 (3532 ± 408
kcal.day-1) in seven male Japanese professional soccer players. Additionally, in
this study there were two competitive matches during the week of testing, which
is therefore likely to be more reflective of a team competing in both midweek
and weekend matches.
This technique has huge advantages due to its use within free-living individuals,
it is also non-invasive, imposes minimal participant burden and does not interfere
with training activities (Montoye et al., 1996). Additionally, the main advantages
of this method are the accuracy and precision and can certainly determine the
recommended EI of free-living athletes in professional soccer (Edwards et al.,
1993; Westerterp, 1999; Ebine et al., 2002). Despite being the criterion method
for the assessment of EE, the DLW technique measures EE over a chosen
number of days or weeks from which average daily EE can be calculated.
Therefore, information on periods of high expenditure or individual training
sessions cannot be examined (DeLany & Lovejoy, 1996). Additionally, the high
cost of the stable isotopes and the specialised expertise required for the analysis
of isotope concentrations in body fluids by mass spectrometry may also limit its
application in elite soccer. Lastly, in field studies, because CO2 production and
not oxygen utilization is being measured, approximately 5% error is introduced if
the respiratory quotient is not known (Westerterp, 1999). Nonetheless, results
from this analysis provide the closest measure of free-living EE in athletes and
can be used for a reference technique for validating estimates of energy
requirements obtained via other methods (Westerterp, 2009; Westerterp &
Plasqui, 2004).
2.3.4.2. HEART RATE
There is a significant relationship between HR and EE, so analysis of HR can
allow for an estimate of EE to be made. This relationship stems from HR and
oxygen consumption (VO2) linearly increasing with exercise intensity up to near
maximal exercise (Achten & Jeukendrup, 2003). Despite considerable inter-
individual variability in the slope of HR-VO2, the linear relationship is consistent
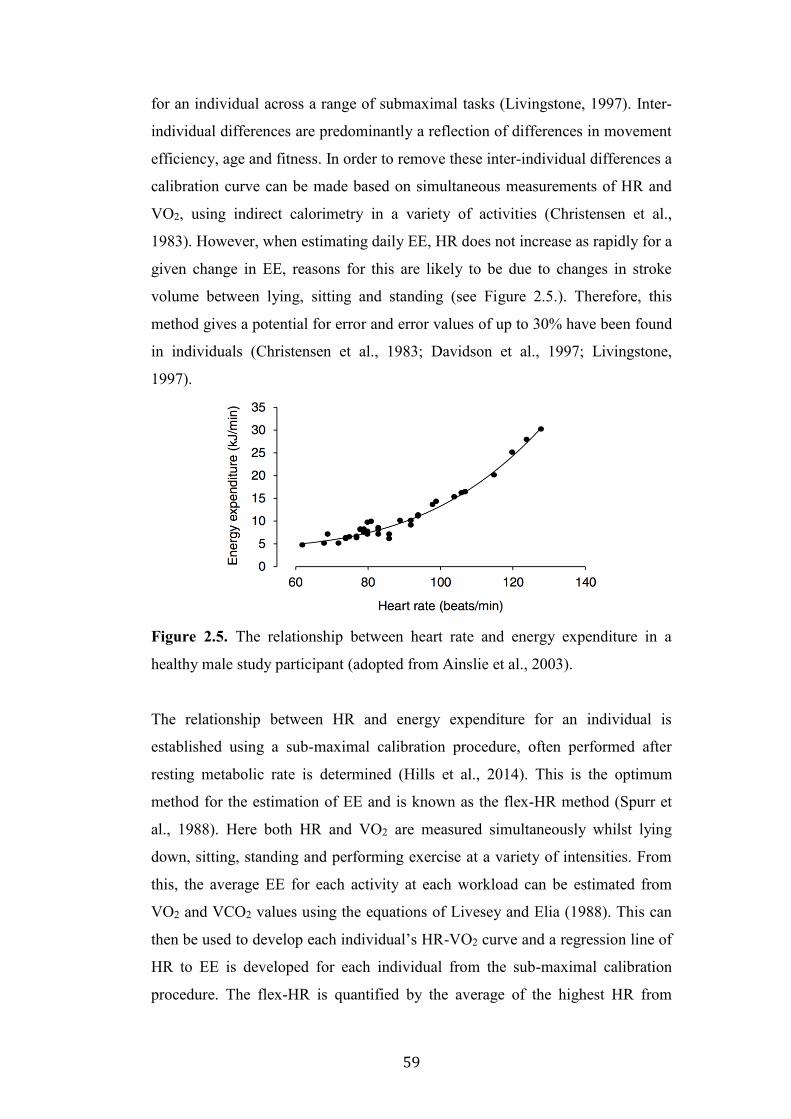
59
for an individual across a range of submaximal tasks (Livingstone, 1997). Inter-
individual differences are predominantly a reflection of differences in movement
efficiency, age and fitness. In order to remove these inter-individual differences a
calibration curve can be made based on simultaneous measurements of HR and
VO2, using indirect calorimetry in a variety of activities (Christensen et al.,
1983). However, when estimating daily EE, HR does not increase as rapidly for a
given change in EE, reasons for this are likely to be due to changes in stroke
volume between lying, sitting and standing (see Figure 2.5.). Therefore, this
method gives a potential for error and error values of up to 30% have been found
in individuals (Christensen et al., 1983; Davidson et al., 1997; Livingstone,
1997).
Figure 2.5. The relationship between heart rate and energy expenditure in a
healthy male study participant (adopted from Ainslie et al., 2003).
The relationship between HR and energy expenditure for an individual is
established using a sub-maximal calibration procedure, often performed after
resting metabolic rate is determined (Hills et al., 2014). This is the optimum
method for the estimation of EE and is known as the flex-HR method (Spurr et
al., 1988). Here both HR and VO2 are measured simultaneously whilst lying
down, sitting, standing and performing exercise at a variety of intensities. From
this, the average EE for each activity at each workload can be estimated from
VO2 and VCO2 values using the equations of Livesey and Elia (1988). This can
then be used to develop each individual’s HR-VO2 curve and a regression line of
HR to EE is developed for each individual from the sub-maximal calibration
procedure. The flex-HR is quantified by the average of the highest HR from
60
resting/ sedentary activity and the lowest HR from light activity. If a given HR
during field activity is below the flex-HR, the resting metabolic rate is used to
determine the EE. If a given HR is above the flex-HR then the calibration curve
is used to estimate EE. Consequently, this method does prove costly and time
consuming. A group calibration could be used to decrease time; this can increase
the reliability of EE estimation (Spurr et al., 1988).
The current literature provides a general consensus that while the HR method
provides satisfactory estimates of average EE for groups of people, it is not an
accurate measure for individual study participants (Spurr et al., 1988, Ceesay et
al., 1989; McCrory et al., 1997). This is demonstrated by a classical study by
Spurr et al., (1988) who compared 24-hour EE by calorimetry to the HR method
in 22 individuals. HR values deviated from EE values from between +20 and -
15%. However, due to similar average scores, the statistical significance of a
paired t-test failed to observe these differences.
Heart rate monitors are portable, non-restraining, unobtrusive and cheap, with
long battery lives allowing for measurements to be carried out over several days.
However, it has not been common practice to use with professional soccer
players to measure EE. Reilly and Thomas (1979) were the first to measure EE
via a combination of HR and activities records. Similarly to the DLW results
from the Japanese players, total daily EE was estimated at 14.4 MJ.day-1 (3442
kcals.day-1). This shows a high level of consistency between results even over a
gap of 23 years where significant changes could occur in training programs and
demands. Additionally, the use of HR to estimate EE has been examined in top-
level Brazilian professional soccer players in competitive matches (Garcia et al.,
2005). Here Garcia and colleagues used indirect calorimetry prior to the matches
in order to develop individual EE-HR curves. Average EE over the five games
ranged between 10.9 – 11.8 kcal.min-1. Over a 90-minute match, this equates to
983 – 1064 kcals and will considerably influence the total daily EE on a match
day.
However, HR is affected by external factors other than physical activity. For
example, physiological status, emotional stress, high humidity, dehydration,
61
posture and illness can all have an effect on HR values without changes in VO2
and thus, EE (Montoye et al., 1996; Christensen et al., 1983; Davidson et al.,
1997; Melanson & Freedson, 1996; Spurr et al., 1988). Additionally, the size of
the muscle group engaged may also affect the relationship with HR being
elevated for a given VO2 during arm exercise being different compared with
exercise with the legs or with both arms (Secher et al., 1974). More specifically
to soccer, the HR-EE relationship may not be as accurate as HR response
relatively slowly to changes in work rate. Therefore, a sudden increase in work
rate will not immediately result in the HR that would be observed at that exercise
intensity after an adaption to the work rate had been allowed. Equally, when the
work rate is decreased or exercised is temporarily ceased, HR will remain
elevated for some time and only gradually return to the values observed during
steady state conditions at this lower work rate.
2.3.4.3. ACCELEROMETRY
Motion sensor technology is an innovative, easily accessible and efficient
method to objectively assess the EE of free-living individuals (Chen & Bassett,
2005). This technology allows individuals to wear sensors during most exercise
activities without restricting exercise performance with large uncomfortable
equipment (Chen & Bassett, 2005, Liden et al., 2002a). A relatively new product
called the SenseWear™ Armband device uses a tri-axial accelerometer with
other sensor technologies to obtain and collate a variety of physiological data,
including galvanic skin response, skin temperature, near body ambient
temperature, heat flux and sweat rate (Liden et al., 2002a). These parameters are
incorporated into a patented algorithm to provide an estimate of EE (Liden et al.,
2002a).
This device has been used and assessed for accuracy in numerous populations
and conditions, which have provided promising results (Liden et al., 2002b,
Arvidsson et al., 2007; Fruin & Rankin, 2004; Jakicic et al., 2004; Johannsen et
al., 2010). However, when used to evaluate the device in an intermittent exercise
drills in basketball there was a significant (~27%) underestimation of EE (Taylor,
2012). Additionally, in a rugby specific intermittent exercise protocol this device
62
provided unclear EE during exercise and significantly overestimated during post-
exercise recovery (Zanetti et al., 2014). Moreover, in rugby union players the
average daily EE has been estimated at 15.9 and 14.0 MJ for forwards and backs,
respectively (Bradley et al., 2015), values that were lower than when quantified
using DLW (Morehen et al., 2016).
Due to the limitations with HR and that it is affected by factors other than
physical activity, a method that integrates physiological and motion detection
systems have been identified as a promising research area (LaMonte &
Ainsworth, 2001). The Actiheart sensor is a single piece of equipment that
combines HR and a movement monitor, designed to clip onto two standard
electrocardiogram electrodes on the chest. This device has been found to be
reliable and valid during walking and running (Brage et al., 2005). However,
when assessed in free-living conditions comparing to DLW relatively poor
measurement of agreements were made (Campbell et al., 2012).
2.3.5. ASSESSMENT OF DIETARY INTAKES IN SOCCER
PLAYERS
The assessment of energy intake has been described as the most difficult of all
physiological methods due to the difficulty of obtaining accurate and reliable
data (Hackett, 2007). Given that there is no gold standard tool to assess energy
intake (Hackett, 2009), the choice of method is dependent on the population
being measured (Magkos & Yannakoulia, 2003). Analysis into an athlete’s diet
can either be done retrospectively or prospectively. Retrospective methods (i.e.
dietary recall) depend on the athlete’s memory and honesty to assess recent, or
less recent food intakes. Prospective methods (i.e. the remote food photographic
method) monitor current and ongoing food consumption but can often be
underreported which raises concern for the accuracy of data collected from
professional soccer players (Hackett, 2009). The major issue faced by sports
nutritionists is the underreporting of dietary intake which can be explained by
intentionally or unintentionally omitting some of the food consumed and/or
intentionally or unintentionally reducing food intake during the study period
(Magkos & Yannakoulia, 2003; Hackett, 2009). Therefore, the best option to
63
assess dietary intake is often what suits the situation whilst clearly
acknowledging the limitations of the chosen method alongside careful
interpretation of the data. An overview of the most popular assessment methods
used in professional soccer will now be discussed below.
2.3.5.1. DIET RECORD (FOOD DIARY)
In the dietary record approach, the respondent records the foods and beverages
and the amounts of each consumed over one or more days (Thompson & Subar,
2008). Ideally, the recording is done at the time of consumption in order to avoid
the reliance of memory. The amounts consumed can be measured using a variety
of different ways. For example, the weighed food method is the ‘gold standard’
for assessing dietary intake although this is not always possible and other
measurements such as household measures (e.g. cups or tablespoons), or
estimated using pictures, or no aid are required to be used (Thompson & Subar,
2008). In order to gain an overall insight into players nutritional practices (i.e.
different on a training day compared to a match day) a consecutive period of 7
days are commonly examined. In order to allow an accurate analysis of the
dietary record, the player must possess a level of detail required to adequately
describe the foods and amounts consumed, including the name of the food (brand
name, if possible), preparation methods, recipes for food mixtures, portion size
and left overs (Thompson & Subar, 2008). It is possible for the investigator to 1)
provide training to the player prior to the investigation, 2) review the food diary
with the player after each day of recording in order to clarify any food entries
and also probe for any forgotten foods and 3) review the food diary next to a
taken photograph of the consumed food so the investigator can cross examine the
input method.
Although in theory this method can be very advantageous in the real world, it is
not without its disadvantages. Research shows that respondent fatigue leads to an
increase in incomplete records as more days of records are kept (Gersovitz et al.,
1978). For example, during the latter days of a consecutive 7-day period players
may develop the practice of filling out the record retrospectively rather than
concurrently and in essence, becomes a 24-hour dietary recall as they are relying
64
on memory. Additionally, recording dietary intake through this method can
affect both the types of food chosen and the quantities consumed (Rebro et al.,
1998; Anderson et al., 2002; Kristjansdottir et al., 2006). The conscious
understanding of the intake being recorded can alter the typical dietary behaviors
(Vuckovic et al., 2000). Therefore, this awareness of the diary can often give the
investigator non-habitual dietary intakes and ultimately affect the reason for the
investigation.
2.3.5.2. 24-HOUR RECALL
The 24-hour dietary recall method involves low subject burden, minimal
distortion of food intake and are easy to administer (Hackett, 2009), and is
therefore a useful assessment method to use with professional soccer players.
The 24-hour dietary recall method requires players to remember and report all of
the foods and beverages consumed in the preceding 24-hours or in the preceding
day (Subar & Thompson, 2013). The recall is typically conducted face-to-face in
an interview format and there can often be specific tools or photographs used in
order to do so (i.e. a photograph of a small, medium and large bowl of cereal
used to estimate portion size). This method relies on the experience and expertise
of the interviewer as the player will forget a lot of foods and hence, probing
questions will need to be asked. Very early research found that respondents being
interviewed with the addition of probing reported ~25% higher dietary intakes
than non-probed interviews (Campbell & Dodds, 1967).
The 24-hour recall can be scheduled around daily activities, conducted by a
single face-to-face short interview or even by telephone or video call, meaning
multiple recalls be collected, and a large number of athletes can be studied. Such
methods have been shown in some situations to be more accurate than food
diaries (Sawaya et al., 1996), which is likely to be due to the ability of the
practitioner to extract more thorough and finer details from an athlete compared
with the athlete working independently. The 24-hour dietary recall does not
require any literacy of the respondent and as they are consumed after the food
has been consumed and will not interfere with dietary behavior. A large
disadvantage of the 24-hour dietary recall approach, like many of the assessment
65
methods, is that players may not report their food consumption accurately for
various reasons such as the player perceiving a typical food to be a poor choice
so they fail to disclose this to the interviewer. Moreover, this method does not
provide multiple days worth of dietary intake and multiple days of recalls may be
needed in order to establish a players true eating patterns.
2.3.5.3. THE REMOTE FOOD PHOTOGRAPHIC METHOD
The remote food photographic method (RMPM) is a method that allows players
to maintain free-living conditions but removes any emphasis on the player
estimating portion size. This is typically done using smartphone applications
where the plate of foods selected by the player and any waste following the meal
are photographed and sent to the investigator at the time of consumption. This
allows meals to be time stamped and puts less emphasis on player training for
estimating portion sizes. The investigator will use reference or standard portions
of known quantities of the foods to estimate the portion size of the foods
consumed by the player. This method has been found to be highly reliable when
used to measure EI in adults (Williamson et al., 2003; Williamson et al., 2004).
Portion sizes from digital photography have been found to correlate highly with
weighed portion sizes (r’s > .90, p’s < .0001) and mean difference between
directly weighing foods and digital photography are minimal (< 6 g) (Williamson
et al., 2003). Additionally, using the RMPM has proven to also correlate highly
with weighed EI in both laboratory and free-living conditions (r’s > .62, p’s <
.0001) (Martin et al., 2009). In the same study, this method underestimated EI by
-6.6% (p = .017). More recently, Costello et al. (2017) found this method to be a
accurate method to assess the diet of elite adolescent male rugby players with a
small mean bias for under reporting across a 96 h assessment (CI = -5.7% to -
2.2%) when compared to a researcher-observed weighed method. Therefore, this
method could be considered as a potential method for estimating EI of free-living
individuals, especially in athletic populations.
66
2.3.6. ENERGY INTAKES IN SOCCER PLAYERS
Nutritional assessments of soccer players have primarily been conducted in elite
youth players with very few been conducted in senior professional players (see
Table 2.3.). The most interesting conclusion from these studies is the vast
amount of differences both between populations and differences in intakes over
time. For example, Van Erp-baart et al. (1989) observed higher EI than
Bettonviel et al. (2016), which seemingly arise from previously higher CHO, and
fat intakes. Interestingly, in the aforementioned studies protein intake has
remained similar whereas in professional players from the U.K. protein intake
has substantially increased (Ono et al., 2012; Reeves & Collins, 2003) from
previous years (Maughan, 1997). Such differences between eras are potentially
driven by the increased scientific research and resulting athlete (and coach)
awareness of the role of protein in facilitating adaptations and recovery from
both aerobic and strength training (Moore et al., 2014; McNaughton et al., 2016).
In addition to the quantification of daily energy and macronutrient intake, it is
important to consider the daily “distribution” of energy and macronutrient
intakes. Such rationale is well documented for CHO given the relevance of both
timing and absolute CHO intakes in relation to promoting pre-match loading and
post match muscle glycogen resynthesis (Ivy et al., 1988a; Ivy et al., 1988b).
Similarly to CHO intake, the timing and distribution of protein doses may have
more of an influential role in modulating muscle protein synthesis when
compared with the absolute dose of protein intake per se. This effect is evident
on response to both feeding alone (Mamerow et al., 2014) and post-exercise
feeding (Areta et al., 2013). Previously in elite youth U.K. soccer players
(Naughton et al., 2016), adult elite players of the Dutch league (Bettonviel et al.,
2016) and a mixed sex cohort of multisport Dutch athletes (Gillen et al., 2016)
skewed approached have been observed to protein feeding in the hierarchical
order of dinner>lunch>breakfast>snacks.
67
2.3.7. CARBOHYDRATE PERIODISATION
Whilst the role of high CHO availability in modulating exercise performance is
well documented, there is emerging evidence that deliberately restricting CHO
availability around carefully selected training sessions can enhance training
adaptation (Bartlett et al. 2015). Such a nutritional approach to training is often
referred to as the train-low: compete high model, surmising that although high
CHO availability should always be advised to promote performance, low CHO
availability enhances many of the key cell signaling pathways that regulate
oxidative adaptations of skeletal muscle.
In relation to endurance training, this concept has been communicated according
to the principle of “fuel for the work required” whereby CHO availability is
adjusted meal by meal and day by day in accordance with the upcoming training
workloads (Impey et al., 2016). Such a principle may have application to
professional soccer owing to the variations in training load across the weekly
micro-cycle as well as the absolute weekly loads occurring in different fixture
schedules e.g. one, two or three game week schedules.
Although researchers have used a variety of acute and chronic train-low
interventions to investigate the efficacy of CHO restriction and periodisation, not
all are practically relevant to the professional soccer player. Nonetheless,
restricting exogenous CHO intake prior to and during training sessions is a
potential method that professional soccer players can adopt. Indeed, when
glucose is consumed before and during six weeks of high-intensity intermittent
training, oxidative adaptations of the gastrocnemius and vastus lateralis muscles
are attenuated (Morton et al., 2009). Additionally, CHO feedings before, during
and after 2-h low-intensity cycling (50% Wmax) attenuated GLUT-4, PDK4,
AMPK, CD36, CPT-1 and UCP3 mRNA abundance in the hours after exercise.
Therefore, consuming a low CHO breakfast and restricting energy drinks that are
often consumed during training could be a viable method to augment training
adaptations.
68
In addition to restricting CHO prior to and during training sessions, there is also
the possibility to sleep with reduced muscle glycogen. In the traditional sleep low
model, athletes perform an evening training session, restrict CHO during
overnight recovery and then complete a fasted training session the following
morning (Bartlett et al., 2015). In this regard, when morning exercise is
commenced with glycogen <200 mmol/kg dw, AMPK, p38 and p53 activation is
enhanced (Steinberg et al., 2006; Chan et al., 2004; Bartlett et al., 2013). In
relation to the soccer player, it could be suggested that restricting CHO intake in
the afternoon and evening meal (so as to reduce absolute muscle glycogen re-
synthesis) could facilitate a practical model of sleep low so that the subsequent
morning training session is commenced with reduced endogenous and exogenous
CHO availability. Nonetheless, prior to prescribing soccer-specific models of
CHO perioidsation, there remains the definitive need to better understand the
habitual training loads and energy requirements of the professional player.
2.4. SUMMARY
The physical demands of soccer match play are now well documented and hence
the associated nutritional requirements also well accepted. In such situations,
high CHO availability is advised before, during and after so as to achieve high
muscle glycogen stores and promote performance and recovery. In contrast, the
physical demands of soccer training are less understood and is thought to be
affected by a multiple factors including weekly fixture schedule, player position
and starting status, coaches philosophy. As such, it is currently difficult to
prescribe accurate nutritional recommendations for soccer players. Through the
simultaneous use of GPS technology, assessment of energy intake and energy
expenditure, it is hoped that the data arising from the studies undertaken in this
thesis will help to inform contemporary nutritional recommendations for elite
soccer players.
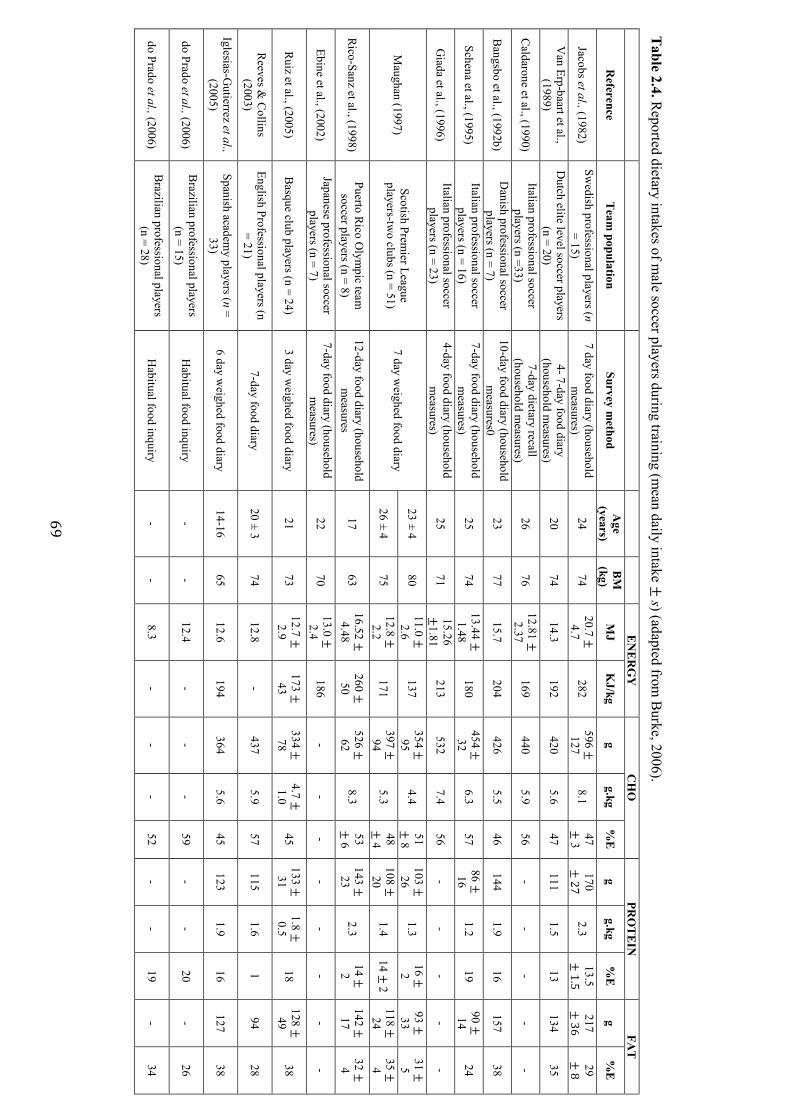
69
Table 2.4. R
eported dietary intakes of male soccer players during training (m
ean daily intake ± s) (adapted from
Burke, 2006).
E
NE
RG
Y
CH
O
PRO
TE
IN
FAT
Reference
Team
population Survey m
ethod A
ge (years)
BM
(kg)
MJ
KJ/kg
g g.kg
%E
g
g.kg %
E
g %
E
Jacobs et al., (1982) Sw
edish professional players (n = 15)
7 day food diary (household m
easures) 24
74 20.7 ±
4.7
282 596 ±
127
8.1 47
± 3
170 ±
27 2.3
13.5 ±
1.5 217
± 36
29 ±
8 V
an Erp-baart et al., (1989)
Dutch elite level soccer players
(n = 20) 4- 7-day food diary
(household measures)
20 74
14.3 192
420 5.6
47 111
1.5 13
134 35
Caldarone et al., (1990)
Italian professional soccer players (n =33)
7-day dietary recall (household m
easures) 26
76 12.81 ±
2.37
169 440
5.9 56
- -
- -
-
Bangsbo et al., (1992b)
Danish professional soccer
players (n = 7) 10-day food diary (household
measures0
23 77
15.7 204
426 5.5
46 144
1.9 16
157 38
Schena et al., (1995) Italian professional soccer
players (n = 16) 7-day food diary (household
measures)
25 74
13.44 ±
1.48 180
454 ±
32 6.3
57 86 ±
16
1.2 19
90 ±
14 24
Giada et al., (1996)
Italian professional soccer players (n = 23)
4-day food diary (household m
easures) 25
71 15.26 ±
1.81 213
532 7.4
56 -
- -
- -
Maughan (1997)
Scotish Premier League
players-two clubs (n = 51)
7 day weighed food diary
23 ± 4 80
11.0 ±
2.6 137
354 ±
95 4.4
51 ±
8 103 ±
26
1.3 16 ±
2
93 ±
33 31 ±
5
26 ± 4 75
12.8 ±
2.2 171
397 ±
94 5.3
48 ±
4 108 ±
20
1.4 14 ±
2 118 ±
24
35 ±
4
Rico-Sanz et al., (1998)
Puerto Rico Olym
pic team
soccer players (n = 8) 12-day food diary (household
measures
17 63
16.52 ±
4.48 260 ±
50
526 ±
62 8.3
53 ±
6 143 ±
23
2.3 14 ±
2
142 ±
17 32 ±
4
Ebine et al., (2002) Japanese professional soccer
players (n = 7) 7-day food diary (household
measures)
22 70
13.0 ±
2.4 186
- -
- -
- -
- -
Ruiz et al., (2005)
Basque club players (n = 24)
3 day weighed food diary
21 73
12.7 ±
2.9 173 ±
43
334 ±
78 4.7 ±
1.0
45 133 ±
31
1.8 ±
0.5 18
128 ±
49 38
Reeves &
Collins
(2003) English Professional players (n
= 21) 7-day food diary
20 ± 3 74
12.8 -
437 5.9
57 115
1.6 1
94 28
Iglesias-Gutierrez et al.,
(2005) Spanish academ
y players (n = 33)
6 day weighed food diary
14-16 65
12.6 194
364 5.6
45 123
1.9 16
127 38
do Prado et al., (2006) B
razilian professional players (n = 15)
Habitual food inquiry
- -
12.4 -
- -
59 -
- 20
- 26
do Prado et al., (2006) B
razilian professional players (n = 28)
Habitual food inquiry
- -
8.3 -
- -
52 -
- 19
- 34
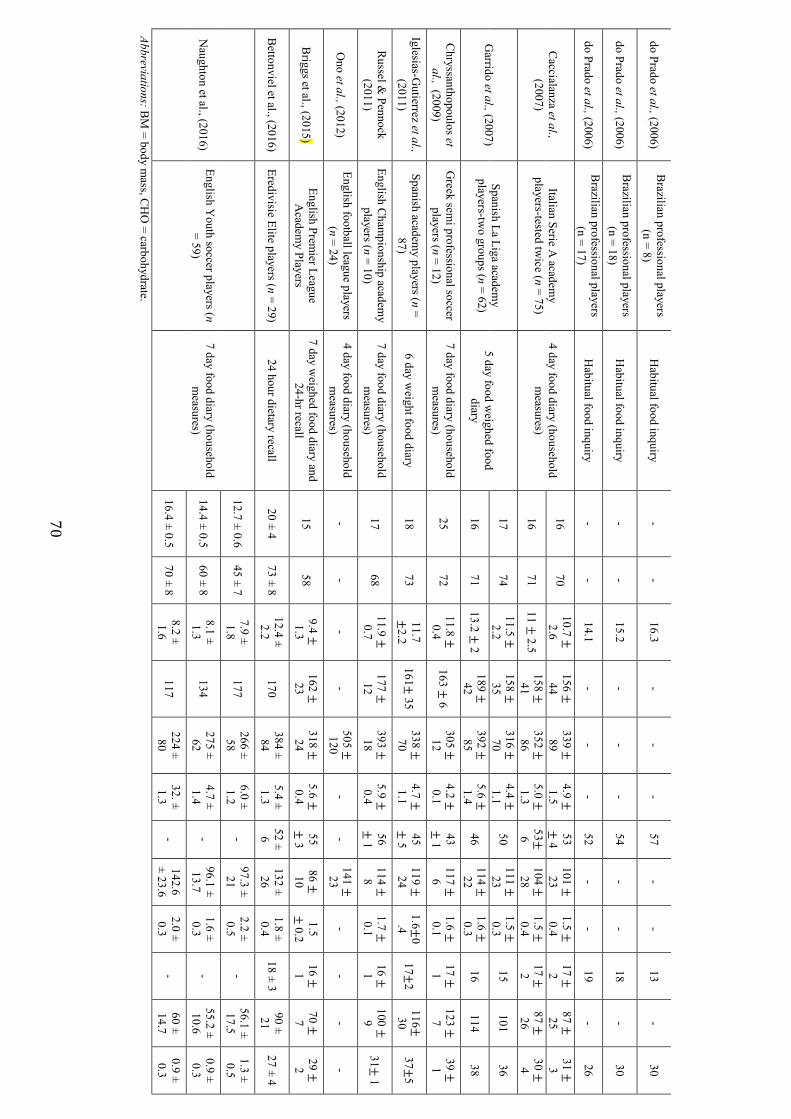
70
do Prado et al., (2006) B
razilian professional players (n = 8)
Habitual food inquiry
- -
16.3 -
- -
57 -
- 13
- 30
do Prado et al., (2006) B
razilian professional players (n = 18)
Habitual food inquiry
- -
15.2 -
- -
54 -
- 18
- 30
do Prado et al., (2006) B
razilian professional players (n = 17)
Habitual food inquiry
- -
14.1 -
- -
52 -
- 19
- 26
Caccialanza et al.,
(2007) Italian Serie A
academy
players-tested twice (n = 75)
4 day food diary (household m
easures)
16 70
10.7 ±
2.6 156 ±
44
339 ±
89 4.9 ±
1.5
53 ±
4 101 ±
23
1.5 ±
0.4 17 ±
2
87 ±
25 31 ±
3
16 71
11 ± 2.5
158 ±
41 352 ±
86
5.0 ±
1.3 53±
6
104 ±
28 1.5 ±
0.4
17 ±
2 87 ±
26
30 ±
4
Garrido et al., (2007)
Spanish La Liga academy
players-two groups (n = 62)
5 day food w
eighed food diary
17 74
11.5 ±
2.2 158 ±
35
316 ±
70 4.4 ±
1.1
50 111 ±
23
1.5 ±
0.3 15
101 36
16 71
13.2 ± 2
189 ±
42 392 ±
85
5.6 ±
1.4 46
114 ±
22 1.6 ±
0.3
16 114
38
Chryssanthopoulos et
al., (2009) G
reek semi professional soccer
players (n = 12) 7 day food diary (household
measures)
25 72
11.8 ±
0.4 163 ±
6 305 ±
12
4.2 ±
0.1 43
± 1
117 ±
6 1.6 ±
0.1
17 ±
1 123 ±
7
39 ±
1
Iglesias-Gutierrez et al.,
(2011) Spanish academ
y players (n = 87)
6 day weight food diary
18 73
11.7 ±
2.2 161±
35 338 ±
70
4.7 ±
1.1 45
± 5
119 ±
24 1.6±
0.4
17±2
116±30
37±5
Russel &
Pennock (2011)
English Championship academ
y players (n = 10)
7 day food diary (household m
easures) 17
68 11.9 ±
0.7
177 ±
12 393 ±
18
5.9 ±
0.4 56
± 1
114 ±
8 1.7 ±
0.1
16 ±
1 100 ±
9
31± 1
Ono et al., (2012)
English football league players (n = 24)
4 day food diary (household m
easures) -
- -
- 505 ±
120
- -
141 ±
23 -
- -
-
Briggs et al., (2015)
English Premier League
Academ
y Players 7 day w
eighed food diary and 24-hr recall
15 58
9.4 ±
1.3 162 ±
23
318 ±
24 5.6 ±
0.4
55 ±
3 86 ±
10
1.5 ±
0.2 16 ±
1
70 ±
7 29 ±
2
Bettonviel et al., (2016)
Eredivisie Elite players (n = 29) 24 hour dietary recall
20 ± 4 73 ± 8
12.4 ± 2.2
170 384 ±
84 5.4 ± 1.3
52 ± 6
132 ± 26
1.8 ± 0.4
18 ± 3 90 ± 21
27 ± 4
Naughton et al., (2016)
English Youth soccer players (n
= 59) 7 day food diary (household
measures)
12.7 ± 0.6 45 ± 7
7.9 ± 1.8
177 266 ±
58 6.0 ± 1.2
- 97.3 ±
21 2.2 ± 0.5
- 56.1 ± 17.5
1.3 ± 0.5
14.4 ± 0.5 60 ± 8
8.1 ± 1.3
134 275 ±
62 4.7 ± 1.4
- 96.1 ± 13.7
1.6 ± 0.3
- 55.2 ± 10.6
0.9 ± 0.3
16.4 ± 0.5 70 ± 8
8.2 ± 1.6
117 224 ±
80 32. ± 1.3
- 142.6 ± 23.6
2.0 ± 0.3
- 60 ± 14.7
0.9 ± 0.3
Abbreviations: BM = body m
ass, CH
O = carbohydrate.
71
CHAPTER 3
GENERL METHODOLOGY
This chapter provides details of methods that were employed in the experimental
studies undertaken in this thesis . Methods that were unique to a particular study
are presented in the methods section of that particular chapter.
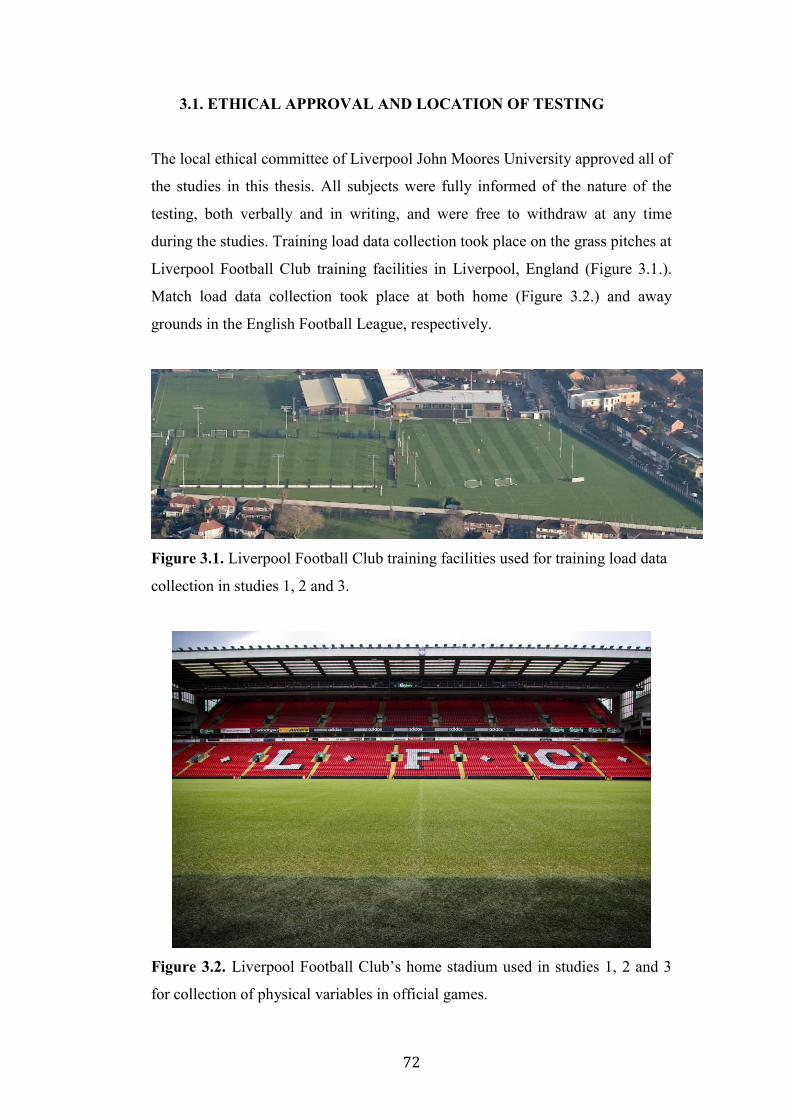
72
3.1. ETHICAL APPROVAL AND LOCATION OF TESTING
The local ethical committee of Liverpool John Moores University approved all of
the studies in this thesis. All subjects were fully informed of the nature of the
testing, both verbally and in writing, and were free to withdraw at any time
during the studies. Training load data collection took place on the grass pitches at
Liverpool Football Club training facilities in Liverpool, England (Figure 3.1.).
Match load data collection took place at both home (Figure 3.2.) and away
grounds in the English Football League, respectively.
Figure 3.1. Liverpool Football Club training facilities used for training load data
collection in studies 1, 2 and 3.
Figure 3.2. Liverpool Football Club’s home stadium used in studies 1, 2 and 3
for collection of physical variables in official games.
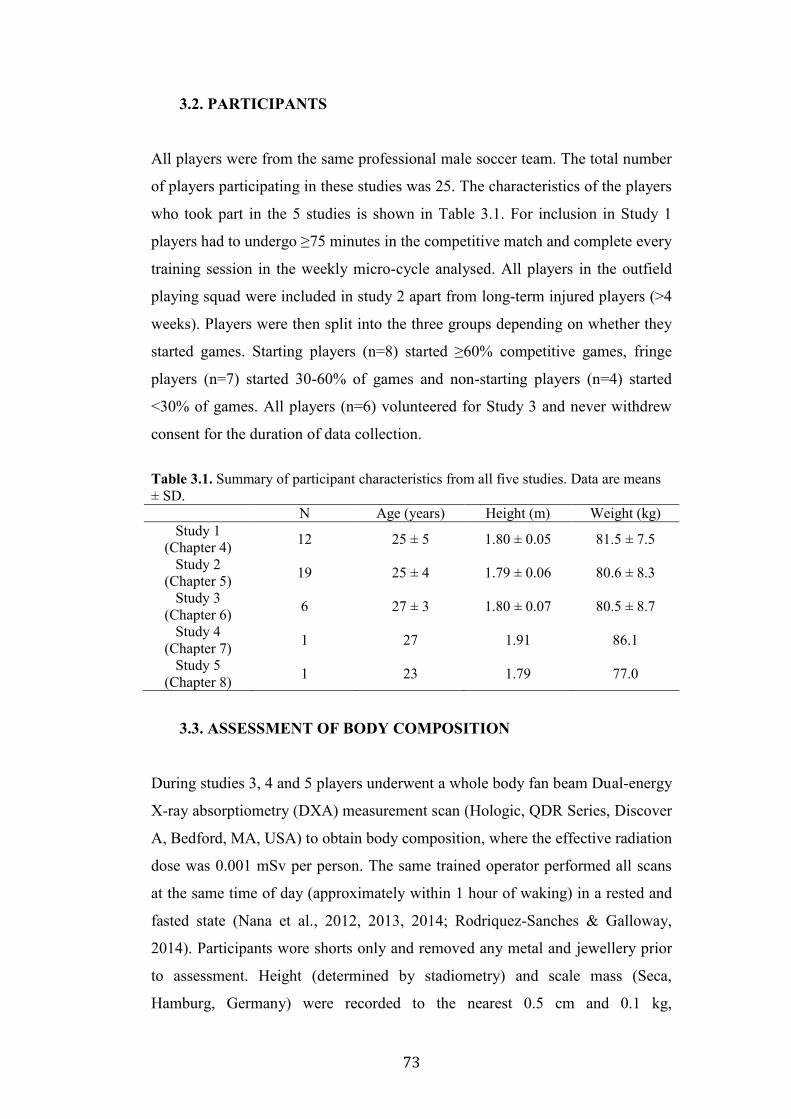
73
3.2. PARTICIPANTS
All players were from the same professional male soccer team. The total number
of players participating in these studies was 25. The characteristics of the players
who took part in the 5 studies is shown in Table 3.1. For inclusion in Study 1
players had to undergo ≥75 minutes in the competitive match and complete every
training session in the weekly micro-cycle analysed. All players in the outfield
playing squad were included in study 2 apart from long-term injured players (>4
weeks). Players were then split into the three groups depending on whether they
started games. Starting players (n=8) started ≥60% competitive games, fringe
players (n=7) started 30-60% of games and non-starting players (n=4) started
<30% of games. All players (n=6) volunteered for Study 3 and never withdrew
consent for the duration of data collection.
Table 3.1. Summary of participant characteristics from all five studies. Data are means ± SD. N Age (years) Height (m) Weight (kg)
Study 1 (Chapter 4) 12 25 ± 5 1.80 ± 0.05 81.5 ± 7.5
Study 2 (Chapter 5) 19 25 ± 4 1.79 ± 0.06 80.6 ± 8.3
Study 3 (Chapter 6) 6 27 ± 3 1.80 ± 0.07 80.5 ± 8.7
Study 4 (Chapter 7) 1 27 1.91 86.1
Study 5 (Chapter 8) 1 23 1.79 77.0
3.3. ASSESSMENT OF BODY COMPOSITION
During studies 3, 4 and 5 players underwent a whole body fan beam Dual-energy
X-ray absorptiometry (DXA) measurement scan (Hologic, QDR Series, Discover
A, Bedford, MA, USA) to obtain body composition, where the effective radiation
dose was 0.001 mSv per person. The same trained operator performed all scans
at the same time of day (approximately within 1 hour of waking) in a rested and
fasted state (Nana et al., 2012, 2013, 2014; Rodriquez-Sanches & Galloway,
2014). Participants wore shorts only and removed any metal and jewellery prior
to assessment. Height (determined by stadiometry) and scale mass (Seca,
Hamburg, Germany) were recorded to the nearest 0.5 cm and 0.1 kg,
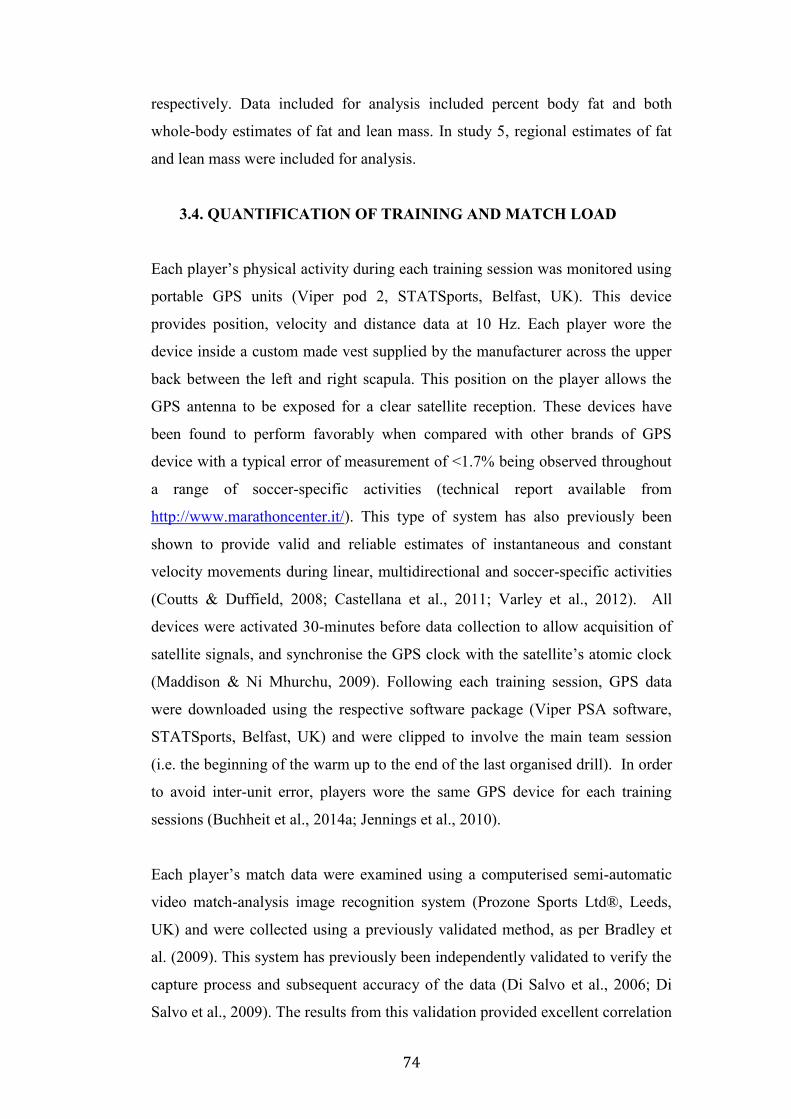
74
respectively. Data included for analysis included percent body fat and both
whole-body estimates of fat and lean mass. In study 5, regional estimates of fat
and lean mass were included for analysis.
3.4. QUANTIFICATION OF TRAINING AND MATCH LOAD
Each player’s physical activity during each training session was monitored using
portable GPS units (Viper pod 2, STATSports, Belfast, UK). This device
provides position, velocity and distance data at 10 Hz. Each player wore the
device inside a custom made vest supplied by the manufacturer across the upper
back between the left and right scapula. This position on the player allows the
GPS antenna to be exposed for a clear satellite reception. These devices have
been found to perform favorably when compared with other brands of GPS
device with a typical error of measurement of <1.7% being observed throughout
a range of soccer-specific activities (technical report available from
http://www.marathoncenter.it/). This type of system has also previously been
shown to provide valid and reliable estimates of instantaneous and constant
velocity movements during linear, multidirectional and soccer-specific activities
(Coutts & Duffield, 2008; Castellana et al., 2011; Varley et al., 2012). All
devices were activated 30-minutes before data collection to allow acquisition of
satellite signals, and synchronise the GPS clock with the satellite’s atomic clock
(Maddison & Ni Mhurchu, 2009). Following each training session, GPS data
were downloaded using the respective software package (Viper PSA software,
STATSports, Belfast, UK) and were clipped to involve the main team session
(i.e. the beginning of the warm up to the end of the last organised drill). In order
to avoid inter-unit error, players wore the same GPS device for each training
sessions (Buchheit et al., 2014a; Jennings et al., 2010).
Each player’s match data were examined using a computerised semi-automatic
video match-analysis image recognition system (Prozone Sports Ltd®, Leeds,
UK) and were collected using a previously validated method, as per Bradley et
al. (2009). This system has previously been independently validated to verify the
capture process and subsequent accuracy of the data (Di Salvo et al., 2006; Di
Salvo et al., 2009). The results from this validation provided excellent correlation
75
(r = 0.999; Total error 0.05, Limits of agreement 0.12) with average velocity
measured by timing gates. Similar correlations were also found with 15m sprints
(r = 0.970; Total error 0.23, Limits of agreement 0.85) and maximal 20m sprints
with left or right turns (r = 0.960; Total error 0.05, Limits of agreement 0.12).
Prozone systems were used throughout the thesis to quantify all physical loading
in matches. This system was used, as FIFA rules during the time of data
collection did not allow for the use of GPS in competitive matches.
Variables that were selected for analysis included duration, total distance,
average speed (total distance divided by training duration) and 6 different speed
categories. In studies 1 and 4, these speed categories were broken down into the
following thresholds: standing (0-0.6 km . h-1), walking (0.7-7.1 km . h-1),
jogging (7.2-14.3 km . h-1), running (14.4-19.7 km . h-1), high-speed running
(19.8-25.1 km . h-1), and sprinting (>25.1 km . h-1). In studies 2 and 3, running,
high-speed running and sprinting were the only speed thresholds selected for
analysis. The speed thresholds for each category are similar to those reported
previously in match analysis research (Bradley et al., 2009; Mohr et al., 2003;
Rampinini et al., 2007) and are commonly used day to day in professional soccer
clubs. Thresholds were optional to change for GPS units, however, in order to
provide continuity between both systems and when comparing to previous
research I used the aforementioned speed thresholds. Additionally, numerous
variables are now available with commercial GPS devices, including acceleration
and decelerations efforts and the estimation of metabolic power (Gaudino et al.,
2013). However, GPS technology may be unsuitable for the measurement of
instantaneous velocity during high-magnitude (>4m/s2) efforts (Akenhead et al.,
2014). With regards to metabolic power, no study at present is yet to fully
quantify the reliability and validity of such measures using commercial GPS
devices. Additionally, obvious implications of the interchangeability between
GPS and Prozone systems require caution when interpreting discrete movements
such as accelerations and decelerations. Therefore, only total distance and
distances covered at the aforementioned intensities are used throughout this
thesis. In study 1, in addition to the absolute distance covered within each speed
zone, the distance completed within each zone was also calculated as a
76
percentage of total distance completed so as to create an “intensity distribution
profile”.
3.5. MEASUREMENT OF ENERGY EXPENDITURE USING
DOUBLY LABELED WATER (DLW)
Energy expenditure was determined by using the DLW method. On the day prior
to start of data collection of the study, between the hours of 1400 to 1600,
players were weighed to the nearest 0.1kg (SECA, Birmingham, UK). Baseline
urine samples were then provided and collected into a 35 ml tube. Following
collection of baseline samples, players were administered orally with a single
bolus dose of hydrogen (deuterium 2H) and oxygen (18O) stable isotopes in the
form of water (2H218O) before they left the training ground. Isotopes were
purchased from Cortecnet (Voisins-Le-Bretonneux-France). The desired dose
was 10% 18O and 5% Deuterium and was calculated according to each
participants body mass measured to the nearest decimal place at the start of the
study, using the calculation:
18O dose = [0.65 (body mass, g) x DIE]/IE,
where DIE is the desired initial enrichment (DIE = 618.923 x body mass (kg)-
0.305) and IE is the initial enrichment (10%) 100,000 parts per million.
To ensure the whole dose was administered, the glass vials were refilled with
additional water which players were asked to consume. The following morning
(between 09:00-10:00) baseline weight samples were taken (SECA,
Birmingham, UK). Approximately every 24-hour, when players entered the
training ground (or hotel on the morning of game 2) they were weighed and
provided a urine sample in a 35 ml tube. This urine sample was not the first
sample of the day after waking as this was acting as a void pass throughout the
study. Urine samples were stored and frozen at -80°C in airtight 1.8 ml cryotube
vials for later analysis.
77
For the DLW analysis, urine was encapsulated into capillaries, which were then
vacuum distilled (Nagy, 1983), and water from the resulting distillate was used.
This water was analysed using a liquid water analyser (Los Gatos Research;
Berman et al., 2012). Samples were run alongside three laboratory standards for
each isotope and three International standards (Standard Light Artic Precipitate,
Standard Mean Ocean Water and Greenland Ice Sheet Precipitation; Craig, 1961,
Speakman, 1997) to correct delta values to parts per million. Isotope enrichments
were converted to EE using a two-pool model equation (Schoeller et al., 1986) as
modified by Schoeller (1988) and assuming a food quotient of 0.85. The results
from the EE data are expressed as a daily average from the 7-day data collection
period.
Doubly labeled water was used as it is the ‘gold standard’ in assessing EE in
free-living conditions (Ainslie et al., 2003). It doesn’t interfere with training or
matches and was therefore ideal to use in a professional soccer setting. Although
DLW is the gold standard of assessing EE, when validated and compared with a
respiration chamber, it was found that this method has a precision of 2-8%
depending on the isotope dose and length of the elimination period (Schoeller,
1988). Additionally, in a more recent validation, the DLW method was found to
be ~1-5% accurate, ~8% precision and intraclass correlation coefficients
(R=0.87-90) compared with whole-room indirect calorimetry (Melanson et al.,
2017).
3.6. ASSESSMENT OF TOTAL DIETARY INTAKE
Self-reported EI was assessed from 7-day food diaries for all players and
reported in kilocalories (kcal) and kilocalories per kilogram of lean body mass
(kcal.kg LBM). Macronutrient intakes were also analysed and reported in grams
(g) and grams per kilogram of body mass (g.kg-1). The period of 7 days is
considered to provide reasonably accurate estimations of habitual energy and
nutrient consumptions whilst reducing variability in coding error (Braakhuis et
al., 2003). On the day prior to data collection, food diaries were explained to
players by the lead researcher and an initial dietary habits assessment (24 h food
recall) was also performed. These assessments were used to establish habitual
78
eating patterns and subsequently allow follow up analysis of food diaries.
Additionally, they helped to retrieve any potential information that players’ may
have missed on their food diary input. Energy intake was also cross referenced
from the RFPM in order to have a better understanding of portion size and/ or
retrieve any information that players’ may have missed on their food diary input.
This type of method has been shown to accurately measure the EI of free-living
individuals (Martin et al., 2009). To further enhance reliability, and ensure that
players missed no food or drink consumption, food diaries and RFPM were
reviewed and cross-checked using a 24-hour recall by the lead researcher after
one day of entries (Thompson & Subar, 2008). As such, the lead researcher used
these three sources of energy (i.e. food diaries, 24 h recall and RFPM) intake
data in combination to collectively estimate daily energy and macronutrient
intake / distribution. To obtain energy and macronutrient composition, the
Nutritics professional dietary analysis software (Nutritics Ltd, Ireland) was used.
Energy and macronutrient intake was further assessed in relation to timing of
ingestion. Meals on training days were split into breakfast, morning snack, lunch,
afternoon snack, dinner and evening snack. Time and type of consumption was
used to distinguish between meals; breakfast (main meal consumed between 6-
9.30am), morning snack (foods consumed between the breakfast main meal and
the lunch), lunch (main meal consumed between 11.30-1.30pm), afternoon snack
(foods consumed between lunch and dinner), dinner (main meal consumed
between 5-8pm), and evening snack (foods consumed after dinner and prior to
sleep).
Meals on match days were split into pre-match meal (PMM), pre-match snack
(PMS), during match (DM), post-match (PM) and post-match recovery meal
(PMRM). Timing of events was used to distinguish between meals on match
days; PMM (main meal consumed 3 hours prior to kick off), PMS (foods
consumed between the PMM and entering the changing rooms after the cessation
of the warm up), DM (foods consumed from when the players entered the
changing rooms after the warm up until the final whistle or until they were
substituted), PM (foods consumed in the changing rooms after the match),
PMRM (main meal consumed <3 hours after the end of the match).
79
Throughout the duration of this study, meals were consumed at the club’s
training ground or home ground, a nearby hotel (where the players often reside
on match day) or alternatively, the players’ own homes or restaurants / cafes. For
meals provided at the training ground, home ground or hotel, menus are provided
on a buffet style basis where the options provided are dictated by the club
nutritionist and catering staff. Throughout the duration of the study, all meals
were consumed ad libitum and it was not compulsory to eat the meals provided
at the training / home ground or hotel. Whenever the team stayed in a hotel, the
club’s chef would travel and oversee the food preparation in order to ensure
consistency of service provision.
On days 3 and 6, players were provided with breakfast and lunch at the training
ground whilst on days 1 and 4 players were provided with lunch and dinner at the
training ground. On day 2, players were provided with breakfast at the training
ground and lunch and pre-match meal at a nearby hotel, which the club uses for
each home game. On day 5, players were provided with breakfast and pre-match
meal at the hotel. On day 7, players were provided with a lunch and post training
snack at the training ground and an evening meal at an away game hotel.
Breakfast options available daily included: eggs, beans, toast, porridge, muesli,
fruits and yoghurts. Lunch and dinner had different options that included 1 x red
meat option, 1 x poultry option, 1 x fish option, 3-4 CHO options (e.g. pasta,
rice, potatoes, quinoa), 2 x vegetable options alongside a salad bar and snacks
such as yoghurts, nuts, cereal bars and condiments. During training sessions,
players were provided with low calorie isotonic sports drinks (Gatorade G2),
water and upon request, isotonic energy gels (Science in Sport GO Isotonic
Gels). During games, players were provided with sports drinks (Gatorade Sports
Fuel), water and isotonic energy gels (Science in Sport GO Isotonic Gels). All
CHO provided during training and matches were consumed ad libitum.
Although there is no gold standard for assessing EI, we chose three common
methods for EI assessment. Food diaries have been found to have a moderate
mean bias for under-reporting across 96h (-2.89 MJ.day-1; 95% CI for bias= -
80
17.9% to -10.2%; p<0.001). In contrast the RFPM has reported a small mean bias
for underreporting across 96h for EI (-0.75 MJ.day-1; 95% CI for bias= -5.7% to -
2.2%, p<0.001) compared with a previously observer weighed method (Costello
et al. 2017). Additionally, 24h recalls can try to remove any additional
information that was forgot or left out from players. In house work was
conducted to ensure inter-researcher reliability of the methods was acceptable.
3.7. INTER-RESEARCHER RELIABILITY OF THE ENERGY
INTAKE METHODS
To assess inter-researcher reliability of EI data collection, three researchers (one
of whom was independent) individually assessed EI data for one day of one
player selected at random. No significant difference was observed (as determined
by one-way ANOVA) between researchers for energy (P=0.95), CHO (P=0.99),
protein (P=0.95) or fat (P=0.80) intake. Daily totals for researchers 1, 2 and 3
were as follows: EI = 3174, 3044 and 3013 kcals; CHO = 347, 353 and 332 g;
protein = 208, 201, and 194 g and fat = 106, 92 and 101 g, respectively.
81
CHAPTER 4
QUANTIFICATION OF PHYSICAL LOAD
DURING ONE, TWO AND THREE GAME
WEEK SCHEDULES IN PROFESSIONAL
SOCCER PLAYERS FROM THE ENGLISH
PREMIER LEAGUE: IMPLICATIONS
FOR CARBOHYDRATE PERIODISATION
The aim of this chapter was to examine physical loading practices in an English
Premier League club during three different weekly micro-cycles consisting of
different game frequencies. The full manuscript was published in the Journal of
Sports Sciences November 2015.
82
4.1. ABSTRACT
Muscle glycogen is the predominant energy source for soccer match play though
its importance for soccer training (where lower loads are observed) is not well
known. In an attempt to better inform CHO guidelines, physical load in English
Premier League soccer players (n=12) was quantified during a one, two and three
game week schedule (weekly training frequency was four, four and two sessions,
respectively). In a one game week, training load was progressively reduced
(P<0.05) in three days prior to match day (total distance = 5223 ± 406 m, 3097 ±
149 m and 2912 ± 192 m for days 1, 2 and 3, respectively). Whilst daily training
load and periodisation was similar in the one and two game weeks, total
accumulative distance (inclusive of both match and training load) was higher in a
two game week (32.5 ± 4.1 km) versus one game week (25.9 ± 2 km). In
contrast, daily training total distance was lower in the three game week (2422 ±
251 m) versus the one and two game weeks though accumulative weekly
distance was highest in this week (35.5 ± 2.4 km) and more time (P<0.05) was
spent in speed zones >14.4 km . h-1 (14, 18 and 23% in the one, two and three
game weeks, respectively). Considering that high CHO availability improves
physical match performance but high CHO availability attenuates molecular
pathways regulating training adaptation (especially considering the low daily
customary loads reported here e.g. 3-5 km per day), daily CHO intakes could
potentially be periodised according to weekly training and match schedules.
Key Words: carbohydrate, glycogen, high-intensity, periodisation
83
4.2. INTRODUCTION
Soccer is an invasive field game characterised by an intermittent activity profile
where brief periods of high intensity anaerobic type activity are superimposed on
a larger background of exercise that taxes the aerobic energy system (Drust et al.,
2000). The physical demands of soccer match play are well known where players
typically cover distances of 10-14 km per match (Dellal et al., 2011; Di Salvo et
al., 2007; Bloomfield et al., 2007; Bangsbo et al., 2006; Fernandes et al., 2007).
The vast majority of this distance has been previously classified as low to
moderate intensity (speeds 0–19.8 km . h-1) (Bradley et al., 2009), whereas high-
intensity running (speeds >19.8 km . h-1) accounts for ~8% of the total distance
completed (Rampinini et al., 2007).
In relation to sources of energy production for match play, muscle glycogen is
the predominant substrate, so much so that 50% of muscle fibres have been
classified as empty or partially empty of muscle glycogen at the end of a game
(Krustrup et al., 2006). As such, glycogen depletion is commonly cited as a
contributing factor for the progressive fatigue (i.e. reduction in high-intensity
running) observed towards the end of a game (Bangsbo, 1994; Bangsbo et al.,
1991; Mohr et al., 2003; Reilly & Thomas, 1976; Rampinini et al., 2009).
Accordingly, the nutritional recommendations for optimal match play
performance advise high CHO availability before, during and after games (Burke
et al., 2011; Burke et al., 2006) so as to promote high muscle glycogen stores
(Bangsbo et al., 1992; Balsom et al., 1999), maintain plasma glucose levels and
ensure the ability to perform technical and cognitive skills (Ali & Williams,
2009; Russell & Kingsley, 2014).
In contrast to match demands, the physical demands of training in elite
professional players are not currently well documented and are limited to reports
of a single week exposure (Owen et al., 2014), average values over a 10-week
period (Gaudino et al., 2013) and most recently, a season long analysis by our
group (Malone et al., 2015). The management of training load is traditionally
considered in weekly micro-cycles consisting of one game per week (i.e.
Saturday-to-Saturday schedule), though it is noteworthy that elite soccer players
84
often play two (e.g. Sunday-to-Saturday) or three (e.g. Sunday-Wednesday-
Saturday) games in a seven-day period. This is largely due to involvement in
numerous competitions (i.e. domestic league / cup competitions, European
competitions) and periods of intense fixture schedules such as the winter period
(Morgans et al., 2014a). Such scenarios place considerable demands on sports
scientists to monitor and manage training load to ensure optimal match day
performance and recovery (Morgans et al., 2014c; Nédélec et al., 2014) whilst
also preventing injury (Dellal et al., 2015; Dupont et al., 2010) and symptoms of
over-training (Morgans et al., 2014b).
Changes in game frequency and the associated training load also has obvious
implications for nutritional strategies given that the metabolic demands and
typical daily EE are likely to vary according to the specific weekly training
scenario. This is especially important for the role of CHO given that high CHO
availability will promote match day physical and technical performance while
deliberately reducing CHO availability during training may promote training
adaptations such as mitochondrial biogenesis (Bartlett et al., 2015), increase lipid
oxidation (Horowitz et al., 1997) and hence, potentially maintain a desirable
body composition (Morton et al., 2010; Milsom et al., 2015). Such data therefore
suggest that a periodised approach to CHO intake may be beneficial in order to
maximise the aforementioned factors. However, before CHO guidelines can be
prescribed for elite soccer players, there is a definitive need to better understand
the interaction and accumulation of both the training and match load during
differing weekly fixture/training schedules.
Accordingly, the aim of the present study was to simultaneously quantify both
training and match load during three different weekly game schedules. To this
end, outfield players from the English Premier League were monitored during a
one, two and three game per week schedule completed in the 2013-2014 season.
85
4.2.METHODS
4.3.1. PARTICIPANTS
Twelve elite outfield soccer players from an English Premier League team (mean
± SD: age 25 ± 5 years, body mass 81.5 ± 7.5 kg, height 1.80 ± 0.05 m)
participated in this study. The participating players consisted of three wide
defenders, three central defenders, three central midfielders, one wide midfielder,
and two centre forwards. All subjects were familiarised with the training
protocols prior to the investigation. This study was conducted according to the
requirements of the Declaration of Helsinki and was approved by the University
Ethics Committee of Liverpool John Moores University.
4.3.2. STUDY DESIGN
Training and match data were collected over 3 different 7-day periods during the
2013-2014 English Premier League soccer season. The weeks were taken from
the calendar months April, February and December for the one, two and three
game weeks, respectively. These weeks were chosen as they included the most
participants for the respective weeks throughout the entire season (one game
week n = 10, two game week n = 10 and three game week n = 7). Players were
selected if they performed ≥75 minutes in all competitive matches during each
different micro-cycle. Although there are other weeks that represent these
scenarios, these 3 different weeks met the essential prerequisites in being the
only 3 weeks during the in-season where players started all games and completed
all training sessions during the chosen week. An overview of the schedule for
each weekly micro-cycle can be found in Table 4.1. The one game week had 2
days off and 4 training days before the match. After match 1 in the two game
week, there was 1 recovery day and 4 training days before match 2. After match
1 in the two game weeks, there was 1 recovery day and 1 training day before
match 2 and the same schedule in between match 2 and 3. A total number of 10
training sessions (94 individual) and 6 games (51 individual) were observed
during this investigation. This study did not influence or alter training sessions in
any way. Training and match data collection for this study was carried out at the
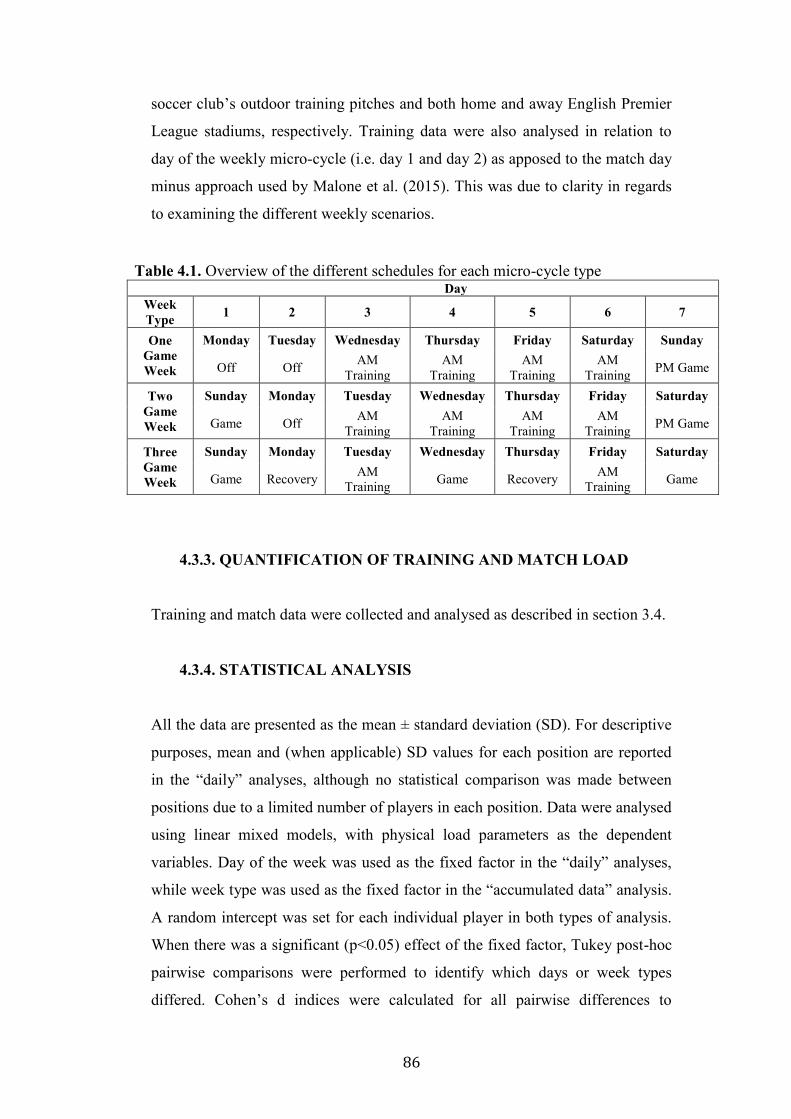
86
soccer club’s outdoor training pitches and both home and away English Premier
League stadiums, respectively. Training data were also analysed in relation to
day of the weekly micro-cycle (i.e. day 1 and day 2) as apposed to the match day
minus approach used by Malone et al. (2015). This was due to clarity in regards
to examining the different weekly scenarios.
4.3.3. QUANTIFICATION OF TRAINING AND MATCH LOAD
Training and match data were collected and analysed as described in section 3.4.
4.3.4. STATISTICAL ANALYSIS
All the data are presented as the mean ± standard deviation (SD). For descriptive
purposes, mean and (when applicable) SD values for each position are reported
in the “daily” analyses, although no statistical comparison was made between
positions due to a limited number of players in each position. Data were analysed
using linear mixed models, with physical load parameters as the dependent
variables. Day of the week was used as the fixed factor in the “daily” analyses,
while week type was used as the fixed factor in the “accumulated data” analysis.
A random intercept was set for each individual player in both types of analysis.
When there was a significant (p<0.05) effect of the fixed factor, Tukey post-hoc
pairwise comparisons were performed to identify which days or week types
differed. Cohen’s d indices were calculated for all pairwise differences to
Table 4.1. Overview of the different schedules for each micro-cycle type Day
Week Type 1 2 3 4 5 6 7
One Game Week
Monday Tuesday Wednesday Thursday Friday Saturday Sunday
Off Off AM Training
AM Training
AM Training
AM Training PM Game
Two Game Week
Sunday Monday Tuesday Wednesday Thursday Friday Saturday
Game Off AM Training
AM Training
AM Training
AM Training PM Game
Three Game Week
Sunday Monday Tuesday Wednesday Thursday Friday Saturday
Game Recovery AM Training Game Recovery AM
Training Game
87
determine an effect size (ES) for each significant difference between categories
of fixed factor. The absolute ES value was evaluated according to the following
thresholds: < 0.2 = trivial, 0.2-0.6 = small, 0.7-1.2 = moderate, 1.3-2.0 = large,
and > 2.0 = very large. The statistical analysis was carried out with R, version
3.0.3.
4.4. RESULTS
4.4.1. DAY-TO-DAY VARIATIONS IN TRAINING LOAD ACROSS
ONE, TWO AND THREE GAME WEEKS
As a global index of training and match load, both total distance and average
speed during training sessions and games are displayed in Figure 4.1. Statistical
comparisons between days regarding total distance and average speed within
each specific weekly scenario are discussed separately below. Duration of
activity and distance covered within specific speed zones are also shown in Table
4.1. and 4.2., respectively. In addition to the global indices of training and match
load (see below text), main effects (all P<0.01) across the 7-day period for
distance completed within each movement category were also observed within
each week (see Table 4.1. and 4.2.). For issues of brevity, pairwise comparisons
between specific days are symbolised within Table 4.1. and 4.2. To avoid
confusion between weeks and for presentation of data, days will be referred to as
day 1, day 2 etc. as opposed to the MD minus format used by Malone et al,
(2015).
4.4.2. ONE GAME WEEK SCHEDULE
There was a significant effect of day (P<0.01) for total distance and average
speed (see Figure 4.1.A and B). Specifically, in training total distance on day 4
was slightly higher than day 3 (estimated difference: 873 m, ES=0.3) but day 5
and day 6 were both slightly lower than day 3 (-1253 m, ES=0.4 and -1438 m,
ES=0.5) and moderately lower than day 4 (-2126 m, ES=0.8 and -2311 m,
ES=0.8), respectively (P<0.01 for all comparisons). However, day 5 and day 6
displayed no significant difference from each other (-185 m, ES=0.1; P=0.95).
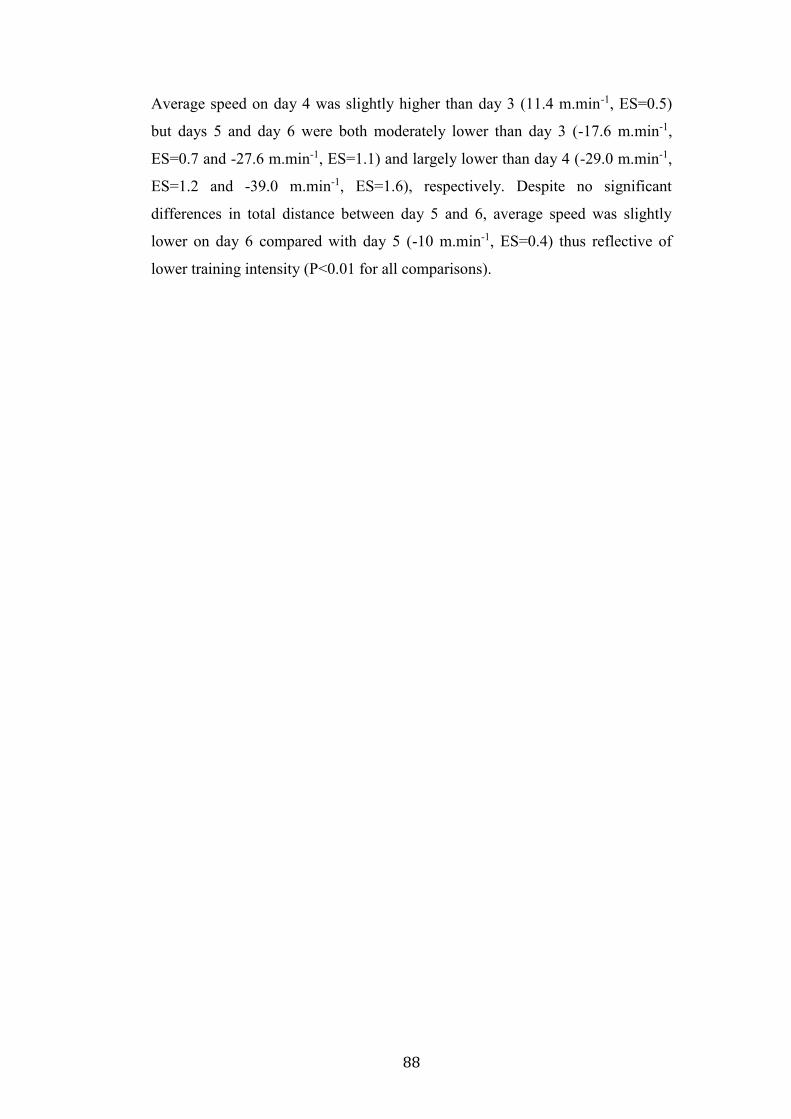
88
Average speed on day 4 was slightly higher than day 3 (11.4 m.min-1, ES=0.5)
but days 5 and day 6 were both moderately lower than day 3 (-17.6 m.min-1,
ES=0.7 and -27.6 m.min-1, ES=1.1) and largely lower than day 4 (-29.0 m.min-1,
ES=1.2 and -39.0 m.min-1, ES=1.6), respectively. Despite no significant
differences in total distance between day 5 and 6, average speed was slightly
lower on day 6 compared with day 5 (-10 m.min-1, ES=0.4) thus reflective of
lower training intensity (P<0.01 for all comparisons).
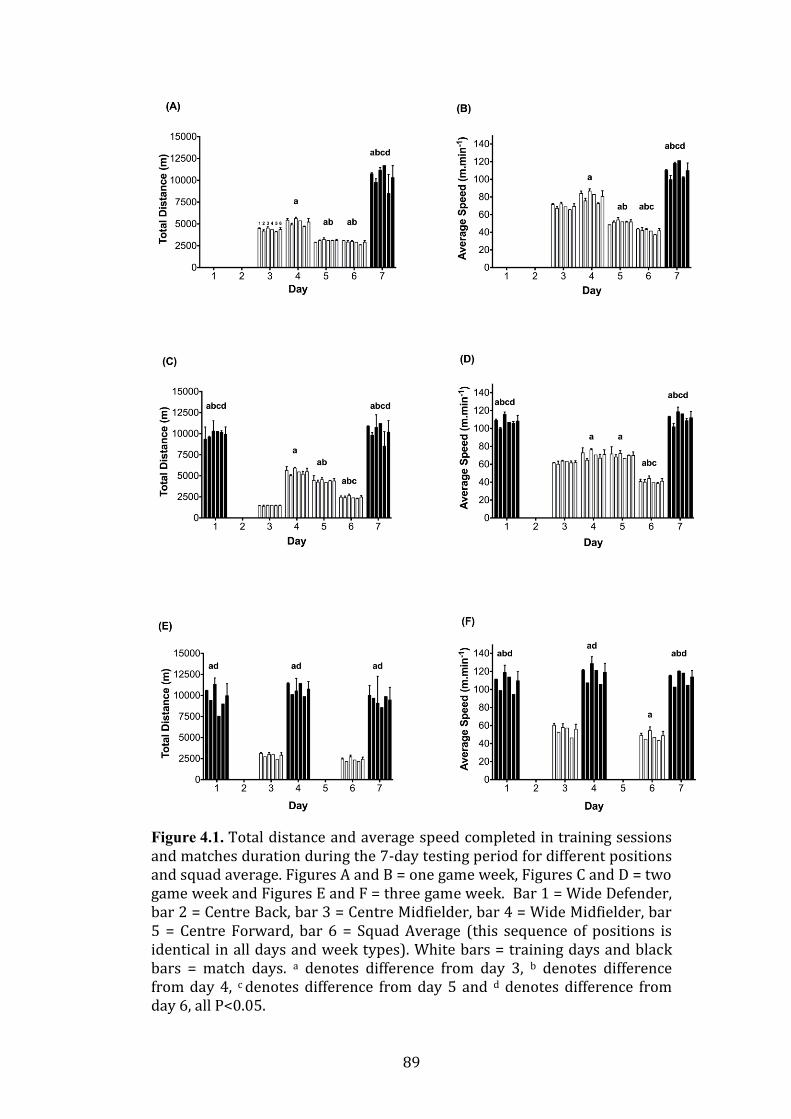
89
Figure 4.1. Total distance and average speed completed in training sessions and matches duration during the 7-day testing period for different positions and squad average. Figures A and B = one game week, Figures C and D = two game week and Figures E and F = three game week. Bar 1 = Wide Defender, bar 2 = Centre Back, bar 3 = Centre Midfielder, bar 4 = Wide Midfielder, bar 5 = Centre Forward, bar 6 = Squad Average (this sequence of positions is identical in all days and week types). White bars = training days and black bars = match days. a denotes difference from day 3, b denotes difference from day 4, c denotes difference from day 5 and d denotes difference from day 6, all P<0.05.
90
4.4.3. TWO GAME WEEK SCHEDULE
There was a significant effect (P<0.01) of day for total distance and average
speed (see Figure 4.1.C and D). Specifically, when compared to day 3, total
distance was moderately higher on day 4 (4040 m, ES=1.2), day 5 (2943 m,
ES=0.8) and day 6 (1018 m, ES=0.3) (all P<0.01). However, compared to day 4
total distance was slightly lower on day 5 (-1097 m, ES=0.3) and moderately
lower on day 6 (-3022 m, ES=0.9). Finally, total distance on day 6 was
moderately lower than day 5 (-1925 m, ES=0.6). No significant differences were
present between distance covered and average speed in games on day 1 and day
7 (247 m, ES=0.1 and 3.7 m.min-1, ES=0.1). Average speed, when compared to
day 3, was slightly higher on day 4 (8.7 m.min-1, ES=0.3) and day 5 (8.2 m.min-1,
ES=0.3) but moderately lower on day 6 (-20.1 m.min-1, ES=0.8) compared to day
3 (all P<0.01). Average speed on day 6 was also moderately lower compared to
day 4 (-29.7 m.min-1, ES=1.1) and day 5 (-29.2 m.min-1, ES=1.1) (both P<0.01)
though no significant differences existed between day 4 and 5 (-0.5 m.min-1,
ES<0.1). No significant difference was apparent regarding average speed
between games on day 1 and day 7 (3.7 m.min-1, ES=0.1).
91
Table 4.2. Training and m
atch duration during the 7-day testing periods for different positions and squad average
Day
1 2
3 4
5 6
7 O
ne Gam
e Week
WD
X
X
63
65 60
70 98
CB
X
X
63
65 60
70 98
CM
X
X
63
65 60
70 95 ± 3
WM
X
X
63
65 60
70 97
CF
X
X
63 65
60 70
98 Squad A
verage X
X
63
65 60
70a, b, c
94 ± 9a, b, c, d
Two G
ame W
eek
WD
86 ± 14
X
24 78
62 60
96 C
B
96 X
24
78 62
60 96
CM
89 ± 12
X
24 78
62 60
90 ± 10 W
M
96 X
24
78 62
60 96
CF
96 X
24
78 62
60 78 ± 14
Squad Average
92 ± 9a, b, c, d
X
24 78
a 62
a, b 60
a, b 91 ± 10
a, b, c, d T
hree Gam
e Week
WD
95
R
52 94
R
50 87 ± 11
CB
95
R
52 94
R
48 94
CM
95 ± 0
R
52 82 ± 16
R
50 75 ± 26
WM
66
R
52 94
R
50 72
CF
95 R
52
94 R
50
94 Squad A
verage 91 ± 11
a, d R
52
91 ± 9a
R
50 ± 1b
84 ± 15a, d
WD
= Wide D
efender, CB
= Centre B
ack, CM
= Centre M
idfielder, WM
= Wide M
idfielder, CF =
Centre Forw
ard, X = D
ay Off and R
= Recovery that includes a variety of activities such as cold w
ater im
mersion, foam
rolling, massage and pool related activities but no field based activity. B
old indicates data obtained from
matches. a denotes difference from
day 3, b denotes difference from day 4, c denotes
difference from day 5 and d denotes difference from
day 6, all P<0.05.
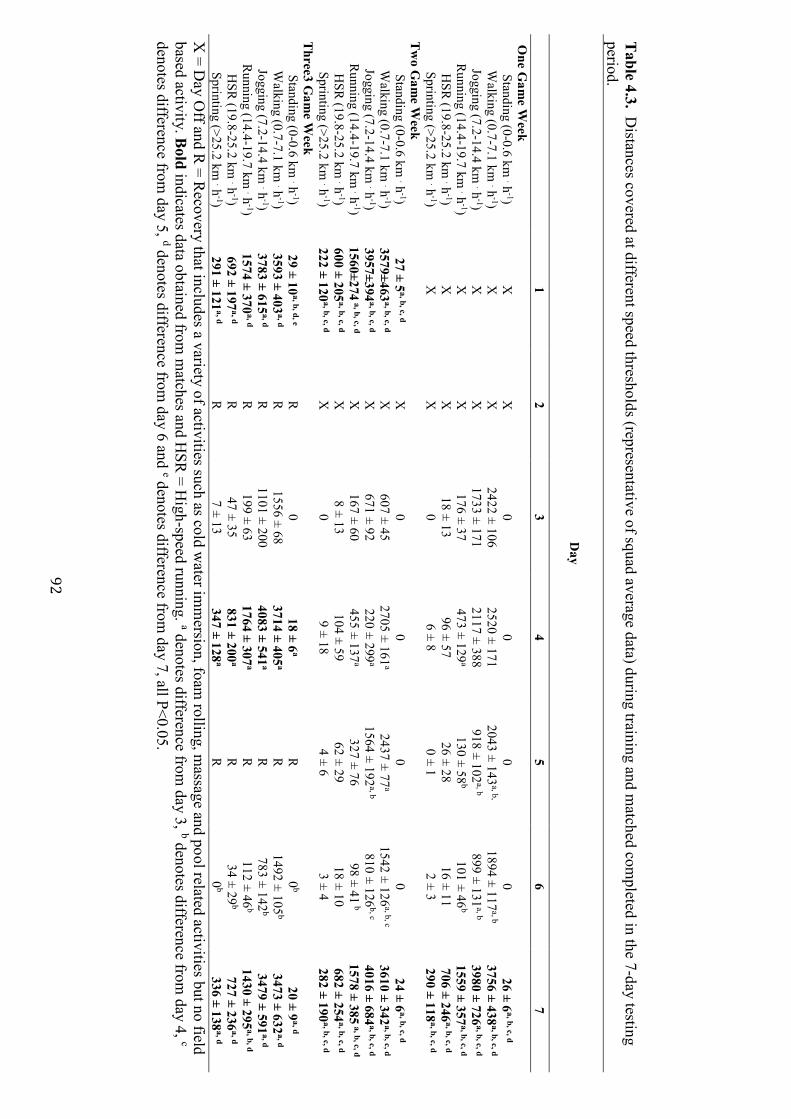
92
Table 4.3. D
istances covered at different speed thresholds (representative of squad average data) during training and matched com
pleted in the 7-day testing period.
Day
1 2
3 4
5 6
7 O
ne Gam
e Week
Standing (0-0.6 km
. h-1)
X
X
0 0
0 0
26 ± 6a, b, c, d
W
alking (0.7-7.1 km . h
-1) X
X
2422 ± 106
2520 ± 171 2043 ± 143
a, b, 1894 ± 117
a, b 3756 ± 438
a, b, c, d
Jogging (7.2-14.4 km . h
-1) X
X
1733 ± 171
2117 ± 388 918 ± 102
a, b 899 ± 131
a, b 3980 ± 726
a, b, c, d
Running (14.4-19.7 km
. h-1)
X
X
176 ± 37 473 ± 129
a 130 ± 58
b 101 ± 46
b 1559 ± 357
a, b, c, d
HSR
(19.8-25.2 km . h
-1) X
X
18 ± 13
96 ± 57 26 ± 28
16 ± 11 706 ± 246
a, b, c, d
Sprinting (>25.2 km . h
-1) X
X
0
6 ± 8 0 ± 1
2 ± 3 290 ± 118
a, b, c, d T
wo G
ame W
eek
Standing (0-0.6 km . h
-1) 27 ± 5
a, b, c, d X
0
0 0
0 24 ± 6
a, b, c, d
W
alking (0.7-7.1 km . h
-1) 3579±463
a, b, c, d X
607 ± 45
2705 ± 161a
2437 ± 77a
1542 ± 126a, b, c
3610 ± 342a, b, c, d
Jogging (7.2-14.4 km
. h-1)
3957±394a, b, c, d
X
671 ± 92 220 ± 299
a 1564 ± 192
a, b 810 ± 126
b, c 4016 ± 684
a, b, c, d
Running (14.4-19.7 km
. h-1)
1560±274 a, b, c, d
X
167 ± 60 455 ± 137
a 327 ± 76
98 ± 41 b
1578 ± 385 a, b, c, d
H
SR (19.8-25.2 km
. h-1)
600 ± 205a, b, c, d
X
8 ± 13 104 ± 59
62 ± 29 18 ± 10
682 ± 254a, b, c, d
Sprinting (>25.2 km
. h-1)
222 ± 120a, b, c, d
X
0 9 ± 18
4 ± 6 3 ± 4
282 ± 190a, b, c, d
Three3 G
ame W
eek
Standing (0-0.6 km . h
-1) 29 ± 10
a, b, d, e R
0
18 ± 6a
R
0b
20 ± 9a, d
W
alking (0.7-7.1 km . h
-1) 3593 ± 403
a, d R
1556 ± 68
3714 ± 405a
R
1492 ± 105b
3473 ± 632a, d
Jogging (7.2-14.4 km
. h-1)
3783 ± 615a, d
R
1101 ± 200 4083 ± 541
a R
783 ± 142
b 3479 ± 591
a, d
Running (14.4-19.7 km
. h-1)
1574 ± 370a, d
R
199 ± 63 1764 ± 307
a R
112 ± 46
b 1430 ± 295
a, b, d
HSR
(19.8-25.2 km . h
-1) 692 ± 197
a, d R
47 ± 35
831 ± 200a
R
34 ± 29b
727 ± 236a, d
Sprinting (>25.2 km
. h-1)
291 ± 121a, d
R
7 ± 13 347 ± 128
a R
0
b 336 ± 138
a, d X
= Day O
ff and R = R
ecovery that includes a variety of activities such as cold water im
mersion, foam
rolling, massage and pool related activities but no field
based activity. Bold indicates data obtained from
matches and H
SR = H
igh-speed running. a denotes difference from day 3, b denotes difference from
day 4, c
denotes difference from day 5, d denotes difference from
day 6 and e denotes difference from day 7, all P<0.05.
93
4.4.4. THREE GAME WEEK SCHEDULE
No significant difference was observed for total distance (589 m, ES=0.3,
P=0.89) during training undertaken on days 3 and 6 though average speed was
slightly lower on day 6 (-7.2 m.min-1, ES=0.2, P<0.01). Although total distance
did not differ between the 3 games undertaken, average speed was slightly higher
in match 2 (day 4) compared with match 1 (day 1) (9.6 m.min-1, ES=0.3, P<0.01)
and also slightly higher than match 3 (day 7) (5.3 m.min-1, ES=0.2, P=0.04).
4.4.5 ACCUMULATIVE WEEKLY LOADS
Weekly accumulative duration of activity, total distance and distance within
specific speed zones are displayed in Figure 4.2. A-F and are inclusive of both
training and matches. Figure 4.3. also displays the distance completed within
each zone, as expressed as a percentage of the total distance completed. For all of
the aforementioned parameters a significant effect of week was observed (all
P<0.001). Duration of accumulated activity was largely higher in two game week
compared with both the one game week (50 min, ES=1.7, P<0.001) and
moderately higher compared to the three game week (35 min, ES=1.2, P<0.01)
though no significant difference was apparent between one game week and three
game week (15 min, ES=0.5, P=0.19). The two game week (7684m, ES=1.6,
P<0.01) and three game week (9349m, ES= 2.0, P<0.01) produced largely higher
accumulative total distance than the one game week though the three game week
and two game week were not significantly different from each other (1665m,
ES=0.4, P=0.13). Significant differences (P<0.01) in distance in speed zone 0-0.6
km . h-1 were present between all week types such that increasing game
frequency progressively increased distance, either when expressed in absolute
value or as percentage of total distance covered. Walking distance (speed zone
0.7-7.1 km . h-1) was largely higher in two game week (2012m, ES=1.3, P<0.01)
and moderately higher in three game week (1627m, ES=1.0, P<0.05) compared
with one game week, though no significant differences were apparent between
two game week and three game week (385m, ES=0.2, P=0.79). However, when
expressed as a percentage of total distance, walking distance showed an opposite
tendency, being moderately higher in one game week compared to two game
94
week (6.4%, ES =1.2, P<0.01) and largely higher when compared to three game
week (9.6%, ES = 1.8, P<0.01). The difference between two game and three
game weeks was small (3.2%, ES = 0.6, P<0.01). Distance covered during
jogging (speed zone 7.2-14.3 km . h-1) displayed a similar pattern to walking such
that distance was largely higher in both two game week (3642m, ES=1.6,
P<0.01) and three game week (3881m, ES=1.7, P<0.01) compared with one
game week, though no significant differences were apparent between two game
week and three game week (238m, ES=0.1, P=0.9). In percentage values, there
was a small significant difference between two game week and one game week
(1.7 %, ES = 0.6, P<0.05), while the differences between three game week and
the one and two game week were not significant (<1.6 %, ES<0.5, both P>0.05).
Given the increase in game frequency, distances covered in running (speed zone
14.4-19.7 km . h-1), high speed running (speed zone 19.8-25.1 km . h-1) and
sprinting (speed zone >25.2 km . h-1) all displayed significant differences
(P<0.01) between all week types both when expressed as absolute or percentage
values. For running distance, two game week (1769m, ES=1.4; 3.0%, ES= 1.2)
and three game week (2560m, ES=2.0; 4.6%, ES=1.8) were largely higher than
one game week whilst three game week (791m, ES=0.6; 1.6%, ES = 0.6) was
also moderately greater than two game week. For high speed running distance,
two game week (652m, ES=0.9; 1.1%, ES = 0.6) and three game week (1417m,
ES=1.9; 2.9%, ES = 1.6) were, moderately and largely higher, respectively, than
the one game week whilst the three game week (764m, ES=1.0; 1.9%, ES = 1.0)
was also moderately greater than two game week. Finally, for sprint distance,
three game week was, respectively, largely and moderately higher than one game
week (659m, ES = 1.7; 1.6%, ES = 1.6), and two game week (413m, ES=1.1;
1.1%, ES =1.1), whilst two game week was also moderately higher than one
game week when examining absolute sprint distance (247m, ES = 0.6). However,
only a small difference was observed between one and two game week for sprint
distance as percentage (0.4%, ES = 0.4).
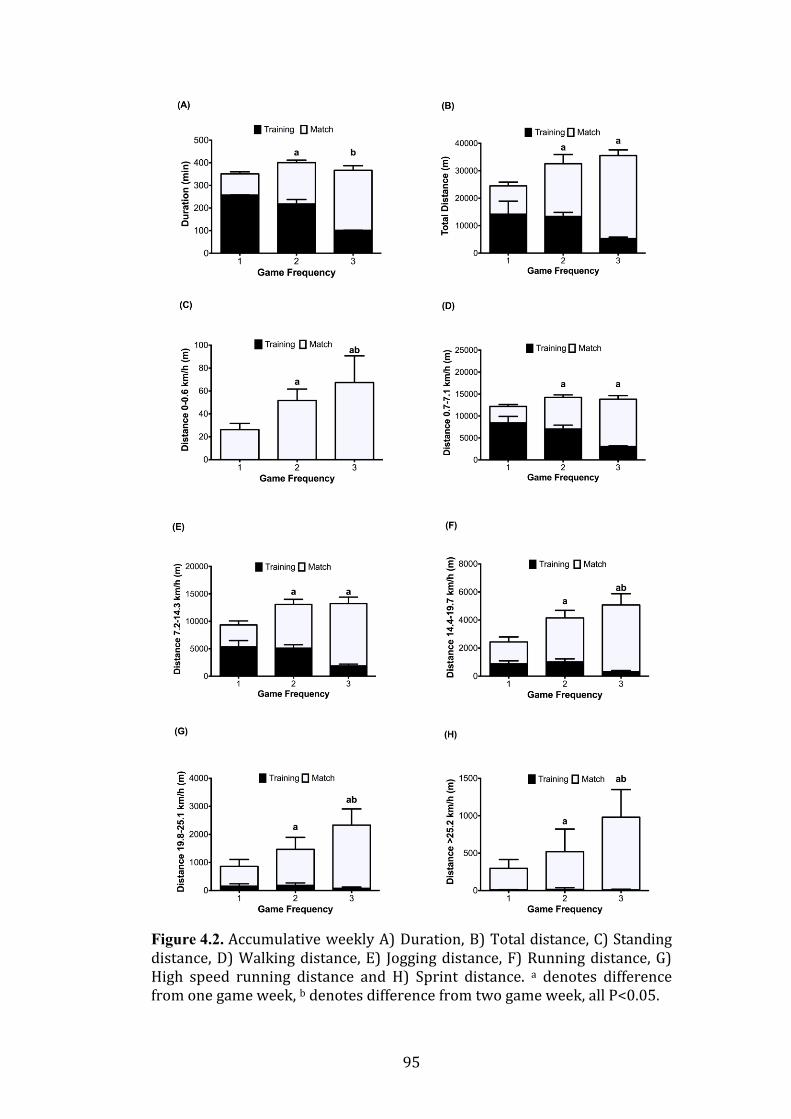
95
Figure 4.2. Accumulative weekly A) Duration, B) Total distance, C) Standing distance, D) Walking distance, E) Jogging distance, F) Running distance, G) High speed running distance and H) Sprint distance. a denotes difference from one game week, b denotes difference from two game week, all P<0.05.
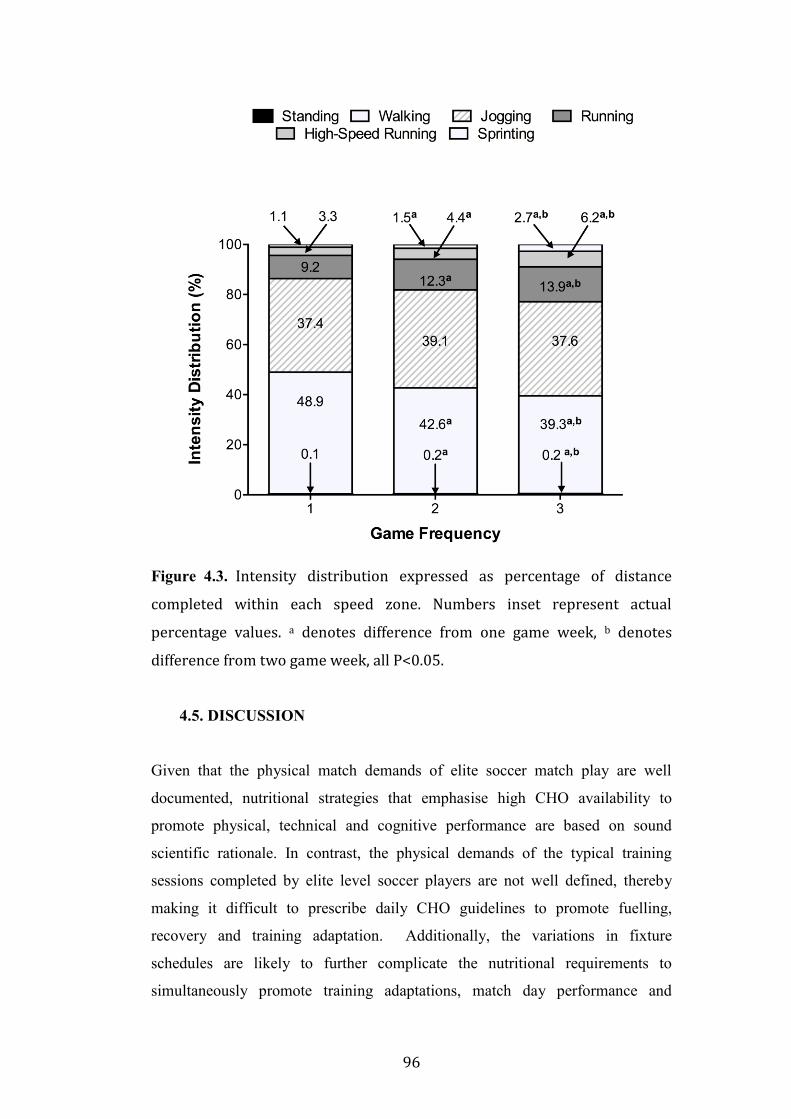
96
Figure 4.3. Intensity distribution expressed as percentage of distance
completed within each speed zone. Numbers inset represent actual
percentage values. a denotes difference from one game week, b denotes
difference from two game week, all P<0.05.
4.5. DISCUSSION
Given that the physical match demands of elite soccer match play are well
documented, nutritional strategies that emphasise high CHO availability to
promote physical, technical and cognitive performance are based on sound
scientific rationale. In contrast, the physical demands of the typical training
sessions completed by elite level soccer players are not well defined, thereby
making it difficult to prescribe daily CHO guidelines to promote fuelling,
recovery and training adaptation. Additionally, the variations in fixture
schedules are likely to further complicate the nutritional requirements to
simultaneously promote training adaptations, match day performance and
97
recovery. As such, a first report of daily training load and weekly-accumulated
load (reflective of both training and match demands) during one, two and three
game week schedules is provided above. Importantly, there were marked
differences in daily and accumulated loads within and between game schedules,
therefore having implications for the nutritional strategies that should be
implemented in different micro-cycles of the season.
In the one game per week micro-cycle, there was clear evidence of training
periodisation in the days leading into game day. For example, total distance and
average speed were greatest on day 4 (5223 ± 406 m; 80.7 ± 6.3 m/min) and
displayed progressive daily reductions on day 5 (3097 ± 149 m; 51.7 ± 2.5
m/min) and 6 (2912 ± 192 m; 41.7 ± 2.8 m/min), commensurate with a reduction
in gross training load and intensity. Such patterns of training periodisation are
different from previous observations from our group (also from the same
professional club) whereby evidence of periodisation was limited to the day
preceding game day only (i.e. Day 6), and was largely reflective of a reduction in
training duration as opposed to alterations in loading patterns (Malone et al.,
2015). Additionally, the load reported by Malone et al. (2015) was higher (e.g.
daily total distance 6-7 km) than that observed here, likely due to changes in
coaches in the different seasons and the sample size of the different positional
groups. Similarly, total distance observed here is lower than that reported
(average daily values from one week of 6871-11,860 m) in elite players from the
Scottish Premier League (Owen et al., 2014) but higher than that observed in
players from another English Premier League soccer team, where mean daily
values of 3618-4133 m (over a 10-week period) were observed (Gaudino et al.,
2013). Such data therefore clearly highlight the role of the managerial structure
and coaching staff in influencing daily training loads and in turn, the daily
energy and CHO cost of training.
In relation to specific training intensities, the majority of distance was completed
in the low to moderate speed zones whereas the distance completed in high
intensity zones were largely completed in the game itself (see Table 4.2., Figure
4.2. and Figure 4.3.). Such patterns of loading are likely a reflection of training
time focusing on tactical and technical elements of match play as opposed to
98
physical aspects of training. Additionally, these data also highlight the
importance of time engaged in match play per se in relation to potentially
maintaining the capacity to perform work in these high-intensity zones.
As expected, it was also observed that the total weekly accumulated loads were
lower in the one game week schedule compared with the two and three game
weeks. It is noteworthy that the total weekly load (hence energy cost) reported
here is considerably lower (e.g. ~25 km) than endurance sports (Esteve-Lanao et
al., 2005) where the competitive situation (like soccer) is also CHO dependent
(O’Brien et al., 1993). For example, the accumulative weekly distance
completed by British middle, long and marathon distance runners were 123, 138
and 107 km, respectively, when tapering for competition (Spilsbury et al., 2015).
Given such differences in both daily and accumulative weekly load, it could
therefore suggest that the traditional high dietary CHO guidelines (e.g. 6-10 g.kg-
1 body mass) commonly advised to endurance athletes and “team” sport athletes
may not always be appropriate for professional soccer players. This is especially
pertinent given recent data from our group and others demonstrating that high
CHO availability may actually attenuate training-induced adaptations of human
skeletal muscle (Bartlett et al., 2015). As such, the potential role of using
nutritional manipulations to maximise the training stimulus perhaps becomes
even more important in those situations where load is not necessarily high.
When considering the clear evidence of training periodisation between days, our
data also gives reasoning to the concept of nutritional periodisation whereby high
CHO availability (e.g. 6-10 g.kg-1 body mass) is promoted on the day prior to
match day (Bassau et al., 2002), on match day itself (Williams & Serratosa,
2006) and on the day after match day (Burke et al., 2006) thus promoting
fuelling and recovery, whereas high CHO availability may not necessarily be
required on the other training days. On the basis of the most recent CHO
guidelines for training and competition that take into account both intensity and
duration (Burke et al., 2011) and in conjunction with the data collected here, it
could be suggested that training days incorporating single sessions can be fuelled
accordingly by daily CHO intakes <4-5 g.kg-1 body mass. However, it must be
acknowledged that these suggested intakes may not be applicable for other clubs
99
owing to the fact that different clubs may have different training structures and
philosophies and players will also likely be training for different goals (e.g.
losing body fat, increasing lean mass etc). Further detailed studies of daily EE
(using measures such as DLW) and potentially other indicators of total load (e.g.
accelerations, decelerations, changes of direction etc) once deemed valid and
reliable (Akenhead et al., 2014), would therefore be required (across teams from
within and between different domestic leagues and countries) to more accurately
prescribe CHO guidelines for elite level soccer players.
Similar to the one game week schedule, there were also observed elements of
training periodisation in the two game week whereby total distance and average
speed were greatest on day 4 (5493 ± 421 m; 70.8 ± 5.4 m/min) compared with
day 5 (4395 ± 261 m; 70.0 ± 3.8 m/min) and day 6 (2470 ± 184 m; 41.0 ± 2.9
m/min). Given the requirement to recover from the initial game within this week,
training load was also lowest on day 3 i.e. 48 hours post-game one (1453 ± 65 m;
63.0 ± 2.0 m/min). Similar to the one game week, typical training intensity
during this micro-cycle was relatively comparable where the majority of time
was spent in low-to-moderate intensity zones (see Table 4.2.).
Due to the requirement to compete in two games per week, the total weekly
accumulated distance and duration of activity was higher than the one game
week schedule and also included significantly more time spent in the high-
intensity zones. The duration of activity was also higher in the two game week
versus the three game week, likely due to completion of an additional two
training sessions where the focus is on recovery from match 1 and also the
physical, technical and tactical preparation for match 2. In contrast, such training
goals have to be combined into fewer sessions in the three game week where
recovery tends to take priority. When taken together, it is likely that the concept
of CHO periodisation during training days may still be applicable in this 2 game
week schedule as long as high CHO intake (e.g. 6-10 g.kg-1 body mass) is
achieved on the day before match day, during match day and the day after match
day.
100
In contrast to the one and two game week schedules, training frequency in the
three game week schedule was limited to two sessions. Given the obvious focus
of these sessions (i.e. recovery and tactical sessions), markers of training
intensity and total distance were similar to that observed in the training sessions
occurring on the day preceding match day in both the one and two game week
schedules. However, due to competing in three games in the seven day period,
the total accumulative distance covered was greater compared with the one game
week. Moreover, due to the high intensity nature of matches, time spent in high-
intensity speed zones was greater in the three game week compared with both the
one and two game week schedule. Given the well documented role of muscle
glycogen in fuelling match play (Krustrup et al., 2006) and also the difficulty of
replenishing muscle glycogen stores in the 48-72 h post-game period (Krustrup
et al., 2011; Gunnarsson et al., 2013), such data therefore clearly highlights the
role of high daily CHO availability during this specific micro-cycle.
This type of weekly scenario is extremely common for those teams who are
competing in any European competitions and often compete in midweek games
as well as their own league games at the weekends. Games played at this
frequency over a short period of time potentially results in residual fatigue and
underperformance due to insufficient time for physical recovery whilst also
increasing the propensity of injury (Dupont et al., 2010). However, it is possible
that playing games this frequently and undergoing an adequate recovery, players
could actually use the game stimulus to maintain or even improve aerobic
capacity. If this pattern of loading is prevalent throughout the season, then the
need for higher CHO intakes should be increased accordingly.
Although this is the first report of training and match load during three different
game schedules, the data are not without limitations that are largely a reflection
of currently available technology and the practical demands of data collection in
an elite football setting. The ecological validity of this study would however be
considered high. Firstly, the simultaneous use of both GPS and Prozone® to
quantify training and match demands, respectively, has obvious implications for
the comparability of data between systems (Harley et al., 2011; Buchheit et al.,
2014b). Nevertheless, this is the approach to monitoring that is commonly
101
employed by sports scientists in the elite soccer environment and is currently a
difficult methodological issue to overcome. Secondly, the use of GPS per se to
make inferences on EE during training is also limited as methodological issues
associated with the technology (e.g. sampling frequency; Aughey, 2011) are
likely to underestimate the real energy requirements. Third, sessions were
clipped to encompass the entire training session (as opposed to provide drill by
drill breakdowns) and this may have led to a lower overall average training
intensity. Nevertheless, this was initially deemed this valid given that it is the
total training time data that are typically used to provide coaches with training
reports. Future studies providing drill-by-drill characteristics would now appear
warranted.
This study is also reflective of one team only (albeit reflective of a top English
Premier League team) and hence may not be representative of the customary
training demands of other domestic teams (Gaudino et al., 2013) or from other
countries (Owen et al., 2014) that may be influenced by different managerial and
coaching philosophies. For example, as players of a lower standard generally
undergo higher load during match play (Bradley et al., 2013) there is likely to be
a greater total requirement for CHO. Finally, although the chosen weekly
scenarios were on the basis of the number of players who completed all games
and training sessions, it is worth noting that the pattern of loading is likely to be
different during different phases of the season due to factors such as residual
fatigue. As such, there is a definitive need to more accurately quantify daily EE
(that would also take in account EE during any resistance training sessions) and
EI so as to more accurately inform nutritional periodisation strategies.
4.6. CONCLUSION
In summary, this study quantified for the first time, the daily training and
accumulative weekly load (reflective of both training and match play) in
professional soccer players during a one, two and three game per week schedule.
Importantly, it is reported that customary training loads (e.g. total distance
ranging from 3-5 km per day) are likely lower than other athletes in team (e.g.
Australian football) and endurance sports, as well as observing evidence of
102
periodisation of training load between days within each microcylce (i.e.
reduction of total distance and intensity when tapering for match day). When
taken together, these data support the concept of CHO periodisation whereby
CHO is altered in accordance with the daily training load as well as the
requirement to fuel and recover from match play. This concept is especially
relevant given that muscle glycogen is the predominant energy source for soccer
match play but also that consistently high levels of muscle glycogen may
attenuate training adaptations. Future studies providing more detailed measures
of EE and additional indicators of training load as well as players’ habitual EI are
now required to more accurately prescribe CHO guidelines for elite level soccer
players.
103
CHAPTER 5
QUANTIFICATION OF SEASONAL LONG
PHYSICAL LOAD IN SOCCER PLAYERS
WITH DIFFERENT STARTING STATUS
FROM THE ENGLISH PREMIER LEAGUE:
IMPLICATIONS FOR MAINTAINING
SQUAD PHYSICAL FITNESS
Having quantified the physical loading in three common micro-cycles in Study 1,
the important of participation in match play in contributing to the overall weekly
load was readily apparent. Accordingly, the aim of this chapter was to quantify
the differences in seasonal long workload in players of different starting status
from an English Premier League club. The full manuscript was published in the
International Journal of Sports Physiology and Performance August 2016.
104
5.1. ABSTRACT
Soccer players are likely to receive different physical loading patterns depending
on whether they regularly start matches or not. In an attempt to quantify the
accumulative training and match load during an annual season in English
Premier League soccer players classified as starters (n=8, started ≥60% of
games), fringe players (n=7, started 30-60% of games) and non-starters (n=4,
started <30%% of games). Players were monitored during all training sessions
and games completed in the 2013-2014 season with load quantified using GPS
and ProZone® technology, respectively. When including both training and
matches, total duration of activity (10678 ± 916, 9955 ± 947, 10136 ± 847 min;
P=0.50) and distance covered (816.2 ± 92.5, 733.8 ± 99.4, 691.2 ± 71.5 km;
P=0.16) was not different between starters, fringe and non-starters, respectively.
However, starters completed more (all P<0.01) distance running at 14.4-19.8 km . h-1 (91.8 ± 16.3 v 58.0 ± 3.9 km; ES=2.5), high speed running at 19.9-25.1 km .
h-1 (35.0 ± 8.2 v 18.6 ± 4.3 km; ES=2.3) and sprinting at >25.2 km . h-1 (11.2 ±
4.2, v 2.9 ± 1.2 km; ES=2.3) than non-starters. Additionally, starters also
completed more sprinting (P<0.01. ES=2.0) than fringe players who accumulated
4.5 ± 1.8 km. Such differences in total high-intensity physical work done were
reflective of differences in actual game time between playing groups as opposed
to differences in high-intensity loading patterns during training sessions. It is
concluded that unlike total seasonal volume of training (i.e. total distance and
duration), seasonal high-intensity loading patterns are dependent on players’
match starting status thereby having potential implications for training
programme design.
Key Words: GPS, Prozone, high-intensity zones, training load
105
5.2. INTRODUCTION
Soccer match play is characterised by brief bouts of high-intensity linear and
multidirectional activity interspersed with longer recovery periods of lower
intensity (Varley & Aughey, 2013). Elite players typically cover 10-14 km in
total distance per game (Dellal et al., 2011; Di Salvo et al., 2007; Bloomfield et
al., 2007; Bangsbo et al., 2006; Fernandes et al., 2007) where both high intensity
(speeds > 14.4 km . h-1) and very high-intensity running distance (speeds > 19.8
km . h-1) contribute ~25 and ~8% of the total distance covered, respectively
(Rampinini et al., 2007; Bradley et al., 2009). Top-class soccer players also
perform 150-250 intense actions per game (Mohr et al., 2003) and complete a
very high-intensity run approximately every 72 s (Bradley et al., 2009).
In order to successfully meet these demands, the physical preparation of elite
players has become an indispensable part of the professional game, with high
fitness levels required to cope with the ever-increasing demands of match play
(Iaia et al., 2009; Barnes et al., 2014). Nonetheless, despite nearly four decades
of research examining the physical demands of soccer match play (Reilly &
Thomas, 1976), the quantification of the customary training loads completed by
elite professional soccer players are not currently well known. For players of the
English Premier League, such reports are limited to a 4-week winter fixture
schedule (Morgans et al., 2014b), a 10-week period (Gaudino et al., 2013),
seasonal long analysis (Malone et al., 2015) and most recently, an examination of
the effects of match frequency in a weekly micro-cycle (Anderson et al., 2015;
Chapter 4). It is noteworthy that the absolute physical loads of total distance (e.g.
< 7 km), high intensity distance (e.g. < 600 m) and very high intensity distance
(e.g. < 400 m) collectively reported in these studies do not near recreate those
completed in matches. As such, although the typical current training practices of
professional players may be sufficient in order to promote recovery and readiness
for the next game (thus reducing risk of over-training and injury), it could also be
suggested that it is the participation in match play itself that is the most
appropriate stimulus for preparing players for the physical demands of match
play. This point is especially relevant considering previous evidence
demonstrating significant positive correlations between individual in season
106
playing time and aspects of physical performance including sprint performance
and muscle strength (Silva et al., 2011).
Such differences between match and training load can be particularly challenging
for fitness and conditioning staff given that players in a first team squad are
likely to receive different loading patterns, depending on whether they regularly
start matches or not. In this way, discrepancies in physical loads between players
could lead to differences in important components of soccer-specific fitness
which may subsequently present itself on match day when players not
accustomed to match loads are now required to complete the habitual physical
loads performed by regular starting players. The challenge of maintaining squad
physical fitness is also technically difficult, given both organisational and
traditional training practices inherent to professional soccer. For example, in the
English Premier League, it is not permitted for players to train on the same pitch
where the game was played for >15 minutes post-match. Furthermore, it is often
common practice for the entire playing squad to be given 1-2 days of recovery
following each game (consisting of complete inactivity or light recovery
activities only), especially in those instances where the fixture schedule consists
of the traditional Saturday-to-Saturday schedule (Anderson et al., 2015; Chapter
4).
With this in mind, the aim of the present study was to quantify the accumulative
training and match load (hence total accumulative physical load) across an
annual season in those players considered as regular starters, fringe players and
non-starters. To this end, outfield players from the English Premier league were
monitored (who competed in the 2013-2014 season) who were classified as
starters (starting ≥60% of games), fringe players (starting 30-60% of games) and
non-starters (starting <30% of games). It was hypothesised that both fringe and
non-starting players would complete significantly less total physical load
(especially in high-intensity zones) than starting players, thereby providing
practical applications for the development of soccer-specific conditioning
programs designed to maintain squad physical fitness.
107
5.3. METHODS
5.3.1. PARTICIPANTS
Nineteen professional outfield soccer players from an English Premier League
team (mean ± SD: age 25 ± 4 years, body mass 79.5 ± 7.8 kg, height 180.4 ± 6.4
cm) took part in the study. When quantifying data from the entire “in-season
analysis” there were 8 starters (mean ± SD: age 25 ±5 years, body mass 80.6 ±
8.3 kg, height 178.8 ± 6.3 cm), 7 fringe (mean ± SD: age 26 ± 4 years, body mass
79.7 ± 7.4 kg, height 181.0 ± 7.3 cm) and 4 non-starters (mean ± SD: age 23 ± 3
years, body mass 74.5 kg, height 181.5 ± 6.9 cm). Players with different position
on the field were tested: 5 wide defenders, 4 central defenders, 6 central
midfielders, 2 wide midfielders and 3 attackers. Long-term injuries were
excluded from this study if they were absent for on field training for duration >4
weeks. The study was conducted according to the requirements of the
Declaration of Helsinki and was approved by the university ethics committee of
Liverpool John Moores University.
5.3.2. STUDY DESIGN
Training and match data were collected over a 39-week period during the 2013-
2014 competitive season from August 2013 until May 2014. The team used for
data collection competed in 3 official domestic competitions across the season.
For the purposes of this current study, training sessions included for analysis
consisted of all of the ‘on pitch’ training each player was scheduled to undertake.
Sessions that were included in the analysis were team training sessions,
individual training sessions, recovery sessions and rehabilitation training
sessions. A total number of 181 team-training sessions (2182 individual), 159
rehab sessions (213 individual), 28 recovery sessions (179 individual), 43
competitive matches including substitute appearances (531 individual) and 12
non-competitive games including substitute appearances (33 individual) were
observed during this investigation. All data reported are for outdoor field based
sessions only. In the season of analysis, the players studied did not do any
additional aerobic/ high-intensity conditioning in the gym or an indoor facility.
108
However, all players did complete 1-3 optional gym based sessions per week
(typically consisting of 20-30 minute long sessions comprising upper and/or
lower body strength based exercises). When expressed as ‘total time’ engaged in
training activities (i.e. also inclusive of gym training) and games, the data
presented in the present paper therefore represent 78±10, 79±6 and 86±7% of
‘total time’ for starters, fringe players and non-starters, respectively. This study
did not influence or alter any session or game in any way nor did it influence the
inclusion of players in training sessions and/or games. Training and match data
collection for this study was carried out at the soccer club’s outdoor training
pitches (Figure 3.1.) and both home (Figure 3.2.) and away grounds in the
English Football League, respectively.
The season was analyzed both as a whole and in 5 different in-season periods
consisting of 4x8 weeks (periods 1-4) and 1x7 week period (period 5). Players
were split into 3 groups for the entire in season analysis and individually for each
in season period. The 3 groups consisted of “starters”, “fringe” and “non-
starters” and were split based on the percentage of games started for the entire in
season (n=8, 7 and 4, respectively) and during the individual period 1 (n=8, 5
and 6, respectively), period 2 (n=9, 5 and 5, respectively), period 3 (n=6, 8 and 5,
respectively), period 4 (n=8, 5 and 6, respectively) and period 5 (n=11, 2 and 6,
respectively). Starting players started ≥60% competitive games, fringe players
started 30-60% of games and non-starting players started <30% of games. The
first day of data collection period began in the week commencing (Monday) of
the first Premier League game (Saturday) and the last period ended after the final
Premier League game. Data for the entire in season and each individual period
was further divided into training and matches. As outlined previously, training
consisted of all ‘on pitch’ training sessions that were organised and planned by
the clubs coaches and staff and match data consisted of both competitive and
non-competitive games. No data from training or games from when players were
on International camps were collected.
5.3.3. QUANTIFICATION OF TRAINING AND MATCH LOAD
Training and match data were collected and analysed as described in section 3.4.
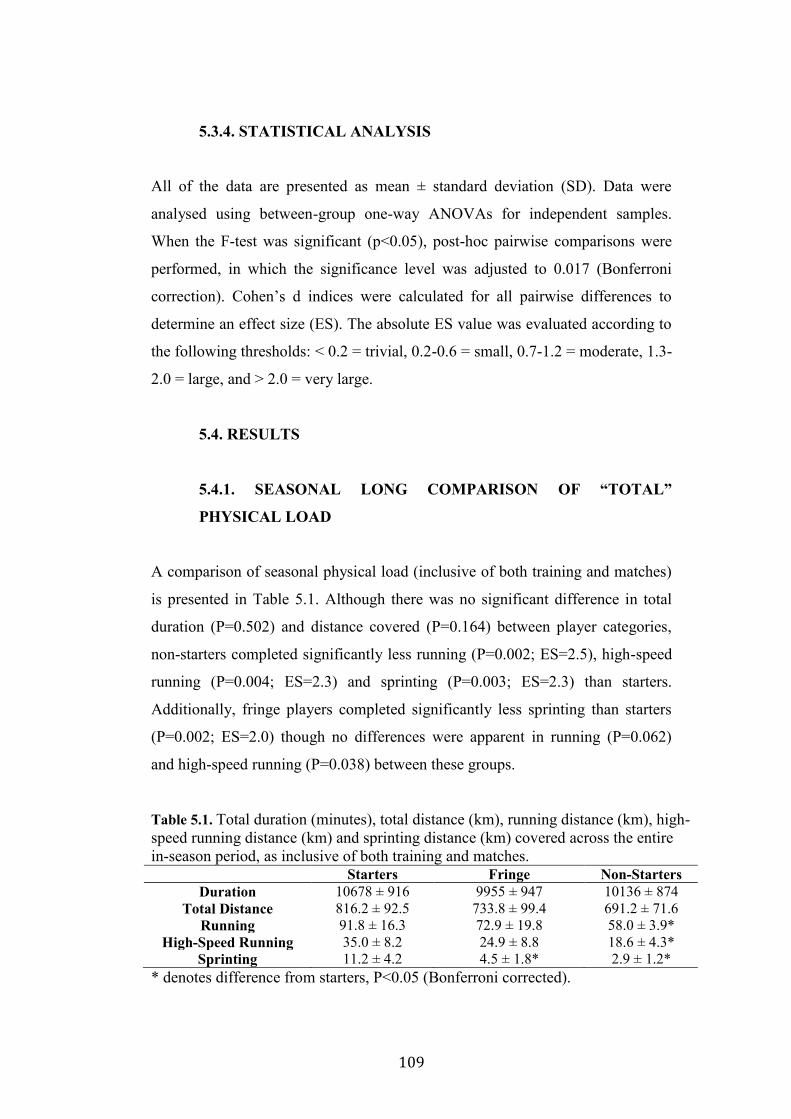
109
5.3.4. STATISTICAL ANALYSIS
All of the data are presented as mean ± standard deviation (SD). Data were
analysed using between-group one-way ANOVAs for independent samples.
When the F-test was significant (p<0.05), post-hoc pairwise comparisons were
performed, in which the significance level was adjusted to 0.017 (Bonferroni
correction). Cohen’s d indices were calculated for all pairwise differences to
determine an effect size (ES). The absolute ES value was evaluated according to
the following thresholds: < 0.2 = trivial, 0.2-0.6 = small, 0.7-1.2 = moderate, 1.3-
2.0 = large, and > 2.0 = very large.
5.4. RESULTS
5.4.1. SEASONAL LONG COMPARISON OF “TOTAL”
PHYSICAL LOAD
A comparison of seasonal physical load (inclusive of both training and matches)
is presented in Table 5.1. Although there was no significant difference in total
duration (P=0.502) and distance covered (P=0.164) between player categories,
non-starters completed significantly less running (P=0.002; ES=2.5), high-speed
running (P=0.004; ES=2.3) and sprinting (P=0.003; ES=2.3) than starters.
Additionally, fringe players completed significantly less sprinting than starters
(P=0.002; ES=2.0) though no differences were apparent in running (P=0.062)
and high-speed running (P=0.038) between these groups.
Table 5.1. Total duration (minutes), total distance (km), running distance (km), high-speed running distance (km) and sprinting distance (km) covered across the entire in-season period, as inclusive of both training and matches.
Starters Fringe Non-Starters Duration 10678 ± 916 9955 ± 947 10136 ± 874
Total Distance 816.2 ± 92.5 733.8 ± 99.4 691.2 ± 71.6 Running 91.8 ± 16.3 72.9 ± 19.8 58.0 ± 3.9*
High-Speed Running 35.0 ± 8.2 24.9 ± 8.8 18.6 ± 4.3* Sprinting 11.2 ± 4.2 4.5 ± 1.8* 2.9 ± 1.2*
* denotes difference from starters, P<0.05 (Bonferroni corrected).
110
5.4.2. SEASONAL LONG COMPARISON OF TOTAL
“TRAINING” AND “MATCH” PHYSICAL LOAD
A comparison of seasonal long training and match load is presented in Figure
5.1.A and B (for duration and total distance). In relation to matches, both fringe
and non-starters completed less duration of activity (both P<0.01; ES=2.7 and
5.7, respectively) and total distance (both P<0.01; ES=5.4 and 2.5, respectively)
compared with starters. Additionally, non-starters also completed less duration
(P=0.001; ES=0.7) and total distance than fringe players (P=0.001; ES=0.7). In
relation to training, differences were only apparent between non-starters and
starters where non-starters spent longer time training (P=0.003; ES=2.4) and
covered greater total distance (P=0.003; ES=2.3).
Figure 5.1. Accumulative season long A) duration and B) total distance in both
training and matches. Shaded bars = training and open bars = matches. * denotes
difference to starters (matches), # denotes difference to fringe players (matches), a
denotes difference to starters (training), P<0.05 (Bonferroni corrected).
111
5.4.3. SEASONAL LONG COMPARISON OF “TRAINING” AND
“MATCH” PHYSICAL LOAD IN HIGH-INTENSITY SPEED
ZONES
Seasonal long distance covered in running, high-speed running and sprinting in
both training and matches is displayed in Figure 5.2.A-C. In relation to matches,
both fringe and non-starters completed significantly less distance in running
(both P<0.01; ES=1.7 and 4.0, respectively), high-speed running (both P<0.01;
ES=2.0 and 3.4, respectively) and sprinting (both P<0.01; ES=2.2 and 2.6,
respectively) compared with starters. In addition, fringe players covered
significantly more distance in running than non-starters (P=0.008; ES=0.7).
However, no differences were apparent between fringe and non-starters for high-
speed running and sprinting (P=0.026 and 0.045; ES=0.7 and 0.5, respectively).
In contrast to match load, no differences were observed between groups for
distance completed in running, high-speed running and sprinting during training
(P=0.297, 0.658 and 0.802, respectively).
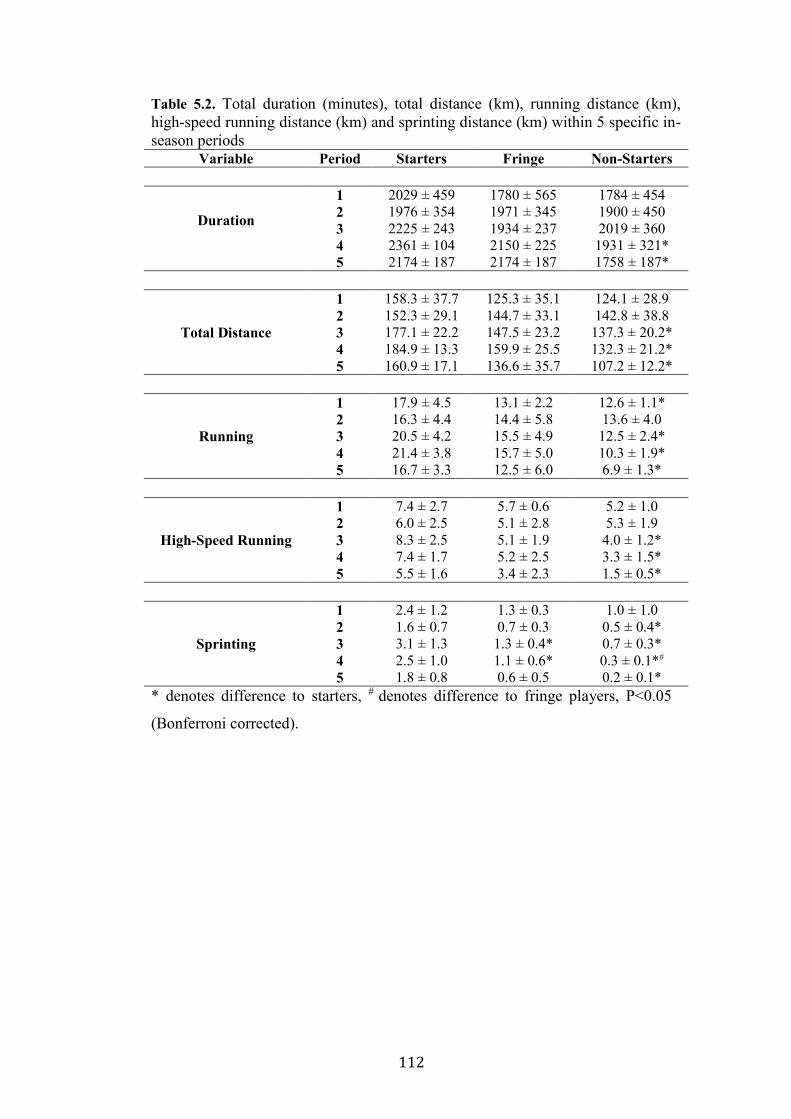
112
Table 5.2. Total duration (minutes), total distance (km), running distance (km), high-speed running distance (km) and sprinting distance (km) within 5 specific in-season periods
Variable Period Starters Fringe Non-Starters
Duration
1 2029 ± 459 1780 ± 565 1784 ± 454 2 1976 ± 354 1971 ± 345 1900 ± 450 3 2225 ± 243 1934 ± 237 2019 ± 360 4 2361 ± 104 2150 ± 225 1931 ± 321* 5 2174 ± 187 2174 ± 187 1758 ± 187*
Total Distance
1 158.3 ± 37.7 125.3 ± 35.1 124.1 ± 28.9 2 152.3 ± 29.1 144.7 ± 33.1 142.8 ± 38.8 3 177.1 ± 22.2 147.5 ± 23.2 137.3 ± 20.2* 4 184.9 ± 13.3 159.9 ± 25.5 132.3 ± 21.2* 5 160.9 ± 17.1 136.6 ± 35.7 107.2 ± 12.2*
Running
1 17.9 ± 4.5 13.1 ± 2.2 12.6 ± 1.1* 2 16.3 ± 4.4 14.4 ± 5.8 13.6 ± 4.0 3 20.5 ± 4.2 15.5 ± 4.9 12.5 ± 2.4* 4 21.4 ± 3.8 15.7 ± 5.0 10.3 ± 1.9* 5 16.7 ± 3.3 12.5 ± 6.0 6.9 ± 1.3*
High-Speed Running
1 7.4 ± 2.7 5.7 ± 0.6 5.2 ± 1.0 2 6.0 ± 2.5 5.1 ± 2.8 5.3 ± 1.9 3 8.3 ± 2.5 5.1 ± 1.9 4.0 ± 1.2* 4 7.4 ± 1.7 5.2 ± 2.5 3.3 ± 1.5* 5 5.5 ± 1.6 3.4 ± 2.3 1.5 ± 0.5*
Sprinting
1 2.4 ± 1.2 1.3 ± 0.3 1.0 ± 1.0 2 1.6 ± 0.7 0.7 ± 0.3 0.5 ± 0.4* 3 3.1 ± 1.3 1.3 ± 0.4* 0.7 ± 0.3* 4 2.5 ± 1.0 1.1 ± 0.6* 0.3 ± 0.1*# 5 1.8 ± 0.8 0.6 ± 0.5 0.2 ± 0.1*
* denotes difference to starters, # denotes difference to fringe players, P<0.05
(Bonferroni corrected).
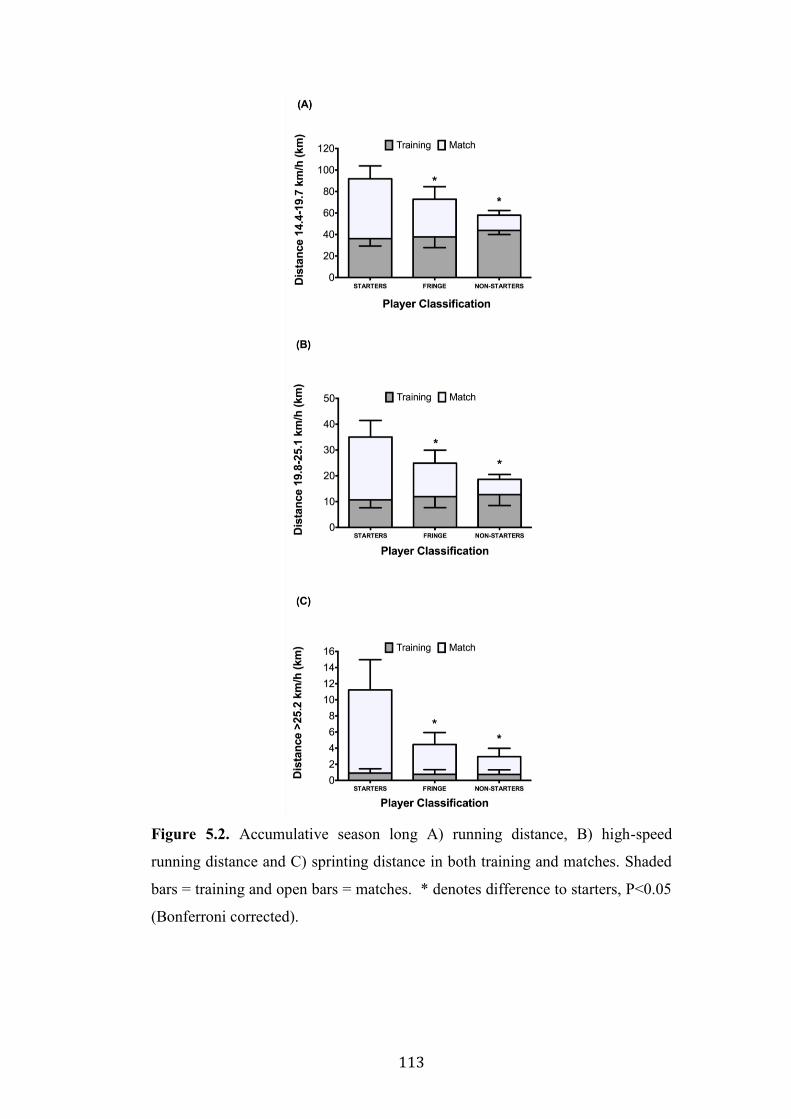
113
Figure 5.2. Accumulative season long A) running distance, B) high-speed
running distance and C) sprinting distance in both training and matches. Shaded
bars = training and open bars = matches. * denotes difference to starters, P<0.05
(Bonferroni corrected).
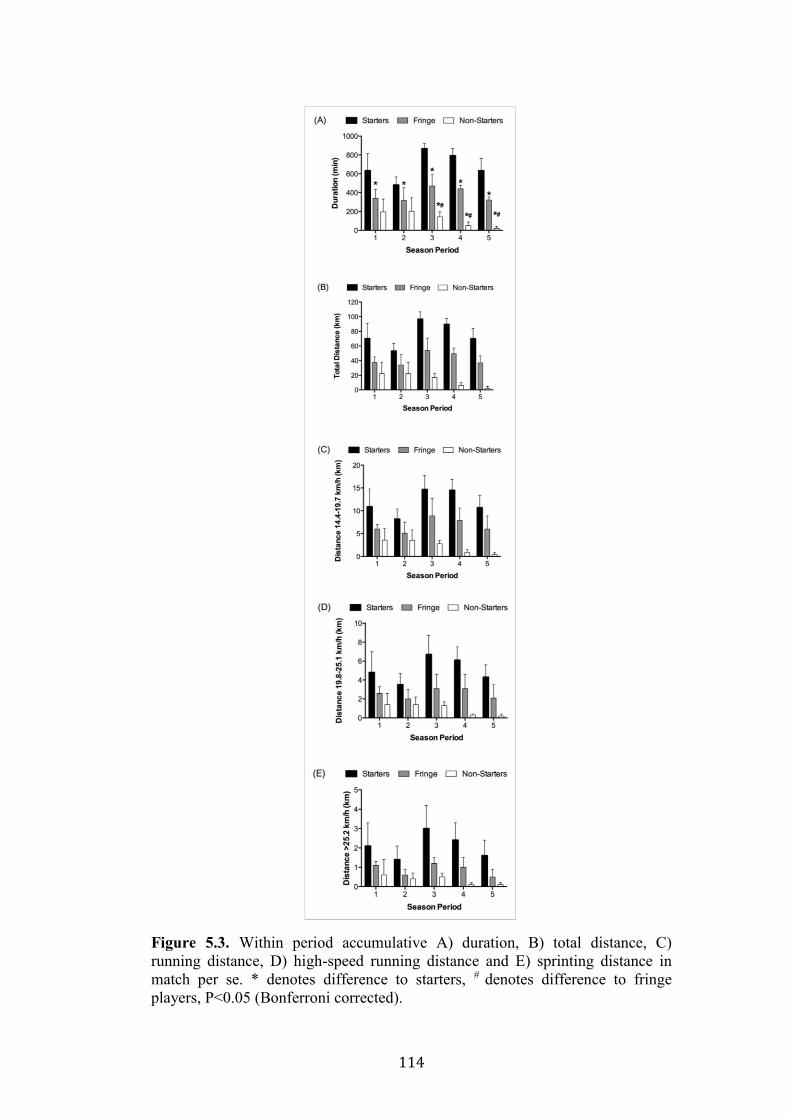
114
Figure 5.3. Within period accumulative A) duration, B) total distance, C) running distance, D) high-speed running distance and E) sprinting distance in match per se. * denotes difference to starters, # denotes difference to fringe players, P<0.05 (Bonferroni corrected).
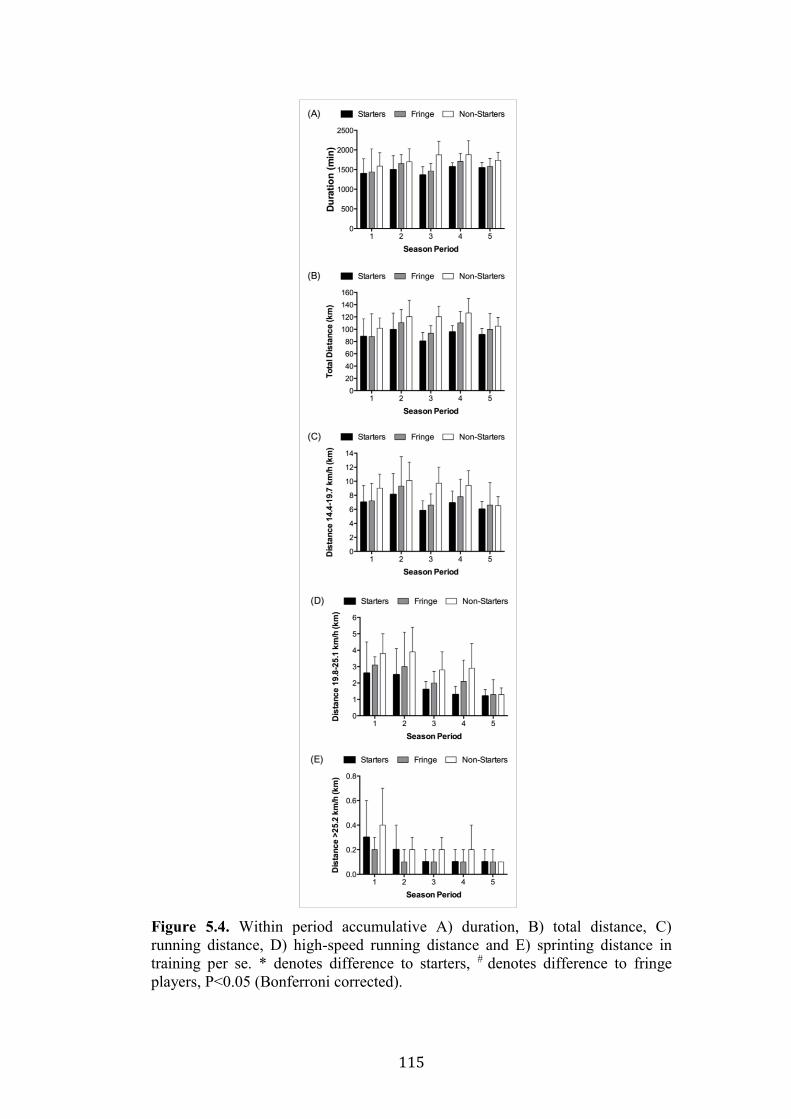
115
Figure 5.4. Within period accumulative A) duration, B) total distance, C) running distance, D) high-speed running distance and E) sprinting distance in training per se. * denotes difference to starters, # denotes difference to fringe players, P<0.05 (Bonferroni corrected).
116
5.4.4. COMPARISON OF “TOTAL” PHYSICAL LOAD WITHIN
SPECIFIC IN-SEASON PERIODS
Total duration, total distance and distance completed in high-intensity speed
zones within 5 in-season periods of the season are presented in Table 5.2. For
duration of total activity, significant differences were only observed in periods 4
(P=0.004; ES=1.9) and 5 (P=0.001; ES=2.2) where non-starters completed less
total duration of activity than starters, respectively. Similarly, non-starters also
completed less total distance than starters in periods 3-5 (all P<0.01,
respectively; ES=1.9, 3.1 and 3.4, respectively), less running in periods 1, 3, 4
and 5 (all P<0.01, respectively; ES=1.0, 2.3, 3.6 and 3.6, respectively), less high-
speed running in periods 3-5 (all P<0.01, respectively; ES=2.1, 2.6 and 3.0,
respectively) and less sprinting in periods 2-5 (all P<0.01, respectively; ES=1.6,
2.5, 3.0 and 2.5, respectively). Furthermore, starters completed more sprinting
distance than fringe in periods 3 and 4 (both P<0.01, respectively; ES=2.2 and
1.6, respectively) but fringe only differed from non-starters in period 4 only
where they completed more sprinting (P=0.006; ES=1.2).
5.4.5. COMPARISON OF “TRAINING” AND “MATCH”
PHYSICAL LOAD WITHIN IN-SEASON PERIODS
Duration of activity, total distance, running, high-speed running and sprinting in
matches are displayed in Figure 5.3.A-E. As expected, in periods 1-5, starters
had higher duration than both non-starters (all P<0.01; ES=2.7, 2.6, 13.2, 11.9
and 5.6, respectively) and fringe (all P<0.01; ES=1.9, 1.6, 4.0, 5.5 and 2.5,
respectively) whilst fringe players also exhibited higher durations than non-
starters in periods 3-5 (all P<0.01; ES=0.9, 1.3 and 2.3). Similarly, starters
covered higher total distances in periods 1-5 than both non-starters (all P<0.01;
ES=2.6, 2.5, 9.5, 12.8 and 5.9, respectively) and fringe (all P<0.01; ES=1.9, 1.6,
3.0, 5.1 and 2.4, respectively) and fringe players covered higher total distances
than non-starters in periods 3-5 (all P<0.01; ES=0.9, 1.3 and 2.3, respectively).
In relation to specific speed zones, starters completed more running in periods 1-
5 than non-starters (all P<0.01; ES=2.2, 2.1, 5.1, 7.2 and 4.7, respectively), more
117
high-speed running in periods 1-5 (all P<0.01; ES=1.8, 1.9, 3.5, 5.5 and 3.8) and
more sprinting in periods 2-5 (all P<0.01; ES=1.7, 2.8, 3.2 and 2.5). Moreover,
starters completed more running than fringe players in periods 3 (P=0.009;
ES=1.7) and 4 (P=0.001; ES=2.6), more high-speed running in periods 3
(P=0.003; ES=2.0) and 4 (P=0.004; ES=2.1) and more sprinting in periods 3
(P=0.001; ES=2.2) and 4 (P=0.012; ES=1.7). Fringe players also covered more
running distance in periods 3-5 (all P<0.01; ES=0.9, 1.3 and 2.3, respectively),
more high-speed running in periods 4 (P=0.002; ES=1.3) and 5 (P=0.008;
ES=2.2) and more sprinting in period 4 (P=0.003; ES=1.3) than non-starters.
Duration of activity, total distance, running, high-speed running and sprinting in
training are displayed in Figure 5.4.A-E. In contrast to matches, total duration of
activity was only different in period 3 (P=0.014; ES=1.8) where non-starters
trained for longer durations than starters. In addition, starters completed less
total distance in periods 3 and 4 compared to non-starters (both P<0.01; ES=2.5,
1.8, respectively) and non-starters also covered more total distance in period 3
than fringe players (P=0.007; ES=0.4). Non-starters also covered more running
than starters and fringe players in period 3 (both P<0.01; ES=2.1 and 0.6,
respectively) and more high-speed running than starters in period 4 (P=0.015;
ES=1.5). Finally, no differences were apparent between groups for sprinting
during periods 1-5 (P=0.506, 0.361, 0.605, 0.521 and 0.487).
5.5. DISCUSSION
The aim of the present study was to quantify the accumulative training and match
load (and total accumulative physical load) during an annual season in those
players considered as regular starters, fringe players and non-starters. Contrary to
our hypothesis, starting status had no effect on the apparent total volume
completed, as reflected by total duration of activity and total distance covered
during the season. Perhaps more important, however, was the observation of
significant differences in the pattern of activity completed within specific high-
intensity speed zones. In this regard, starters generally completed more distance
in running, high-speed running and sprinting zones than both fringe and non-
starting players. This effect was largely due to differences in game time between
118
groups as opposed to differences in training loading patterns. Given the role of
training intensity in promoting soccer-specific fitness (Iaia et al., 2009; Bangsbo,
2008; Dupont et al., 2004; Wells et al., 2014), our data therefore suggest that the
training practices of those players not deemed to be receiving appropriate game
time should be altered to include more emphasis on recreating the high-intensity
demands of match play, so as to potentially maintain overall squad fitness, game
readiness and reduce injury risk.
To the authors’ knowledge, this is the first study to report seasonal long physical
loads completed by elite professional soccer players. In the seasonal long
accumulation analysis, there was no evidence observed of starting status
affecting total duration of activity or total distance covered across the entire in-
season period (see Table 5.1.). For example, total duration and total distance
were similar in starters, fringe and non-starters. These distances are substantially
higher (e.g. approximately 400 km) than that observed in a competitive in-season
in other team sports such as Australian Football (Colby et al., 2014) likely due to
shorter seasons in the latter i.e. 22 weeks (18 weeks in the study) versus 39
weeks in the English Premier League.
Although no differences were observed in the seasonal long profile between
groups (i.e. duration and total distance covered), the proportion of this volume
made up from training and game is, as expected, significantly different between
groups. For example, in relation to training, starters displayed lower duration and
total distances than non-starters but not fringe players. This fact is, of course,
due to the fact that starting players engage in “recovery” training activities and
days after games as opposed to traditional training sessions (Morgans et al.,
2014b; Anderson et al., 2015). When quantifying match load, however, starters
displayed higher duration and total distance than both fringe players and non-
starters. Given the obvious difference between the physical and physiological
demands between training and matches (Morgans et al., 2014b; Anderson et al.,
2015), such data could potentially suggest that the long-term physiological
adaptations arising within these playing groups are likely very different. This
point is especially apparent when considering the large discrepancy between
intensity specific physical loads between groups. For example, starters covered
119
higher distances in running and high-speed running speed zones, respectively,
when compared with non-starters, but not fringe players (see Table 5.1.). In
addition, seasonal long distance covered whilst sprinting was also higher in
starters compared to both fringe players and non-starters. As such, these data
demonstrate that although players are able to maintain similar volume across the
in-season period, distance covered in high-intensity zones is considerably greater
in starters.
The differences in high-intensity loading patterns between groups is also
especially relevant when considering that such differences were not due to
alterations in training loads but rather, merely due to starters engaging in the
high-intensity activity associated with match play. Indeed, there were no
differences in running, high-speed running and sprinting in training per se
between starters, fringe players and non-starters. In contrast, starters displayed
higher distance in matches when running, high-speed running and sprinting
compared to fringe and non-starters (see Figure 5.2.A-C). Such data clearly
highlight that it is the participation in match play per se which represents the
most appropriate opportunity to achieve high-intensity loading patterns. The
practical implications of such discrepancies are important for designing training
programmes to maintain overall squad physical fitness and game readiness.
Indeed, the distances covered at these speeds during games display strong
associations to physical capacity (Krustrup et al., 2003; Krustrup et al., 2005) and
thus, players not consistently exposed to such stimuli during the season may
eventually display de-training effects when compared to that displayed in the
pre-season period (Iaia et al., 2009; Silva et al., 2011). Indeed, completion of
high-intensity activity (even at the expense of total physical load done) is both
sufficient and necessary to activate the molecular pathways that regulate skeletal
muscle adaptations related to both aerobic (Egan et al., 2010; Gillen et al., 2014)
and anaerobic (Iaia et al., 2008) performance. Additionally, when those players
classified as fringe or non-starters are then required to start games, a potential for
injury also exists due to the necessity to complete uncustomary loading patterns
(Gabbett, 2004).
120
In addition to the seasonal long physical loads, training and match load were also
quantified within 5 discrete discrete periods of the in-season period. In this
analysis, variations in physical load between groups were especially evident in
periods 3, 4 and 5, an effect that was especially apparent between starters and
both non-starters and fringe players for total duration, total distance and total
zone 6 activity (i.e. sprinting). Similar to the seasonal long analysis, these
differences between groups were also largely reflective of differences in game
time as opposed to training time. Such differences in loading within specific in-
season periods are likely due to tactical and technical differences associated with
specific fixture schedules. For example, in the present study, period 3 was the
winter fixture schedule (Morgans et al., 2014b) whereas periods 4 and 5 were
reflective of a period where the team under investigation was challenging for
domestic honors. In all of these periods, the management and coaching staff
displayed little squad rotation policies and hence, differences in loading
inevitably ensued.
Despite the novelty and practical application of the current study, our data are
not without limitations, largely a reflection of currently available technology and
the practical demands of data collection in an elite football setting. Firstly, the
simultaneous use of both GPS and Prozone® to quantify training and competitive
match demands, respectively, has obvious implications for the comparability of
data between systems (Harley et al., 2011; Buchheit et al., 2014). Nevertheless,
during the chosen season of study, it was against FIFA rules to wear GPS in
competitive matches. Whilst it is now within the rules to wear GPS in
competitive games, it is still not common policy due to managers’ preferences,
players’ comfort issues and poor signal strength due to the roofing in many
stadiums in the English Premier League. Secondly, data from games or training
from International camps were not reported given that the current research team
or clubs tactical and coaching staff did not control the loads of these practices.
Finally, this study is only reflective of one team (albeit reflective of a top English
Premier League team) and hence may not be representative of the customary
training and match demands of other domestic teams or teams from other
countries. When taken together, the simultaneous use of GPS in training and
121
games, quantification of load in additional settings and the use of wider based
samples all represent fruitful areas for future research.
Given that there were distinct differences in high-intensity distance completed
throughout the season, our data have obvious practical implications for training
programme design. In this regard, data suggest that players classified as fringe
and non-starters should engage in additional high-intensity training practices
and/or complete relevant time in non-competitive friendlies and U21 games in an
attempt to recreate the high-intensity physical load typically observed in
competitive first team games. This point is especially important given the
relevance and importance of high-intensity activity in both building and
maintaining aspects of soccer specific fitness. Furthermore, our observation of
more marked differences in periods 3, 4 and 5 of the season also suggest that
specific attention should be given to those periods of the season when tactical
choices dictate low-squad rotation policies. Future studies should now correlate
changes in physical load during the season to seasonal variation in soccer-
specific fitness components as well as introducing soccer-specific training
interventions at the relevant in-season periods (e.g. Iaia et al., 2015).
5.6. CONCLUSION
In summary, accumulative training and match load (and total accumulative
physical load) were quantified during an annual season in-season in those players
considered as regular starters, fringe players and non-starters for the first time.
Importantly, although it is reported that total duration of activity and total
distance covered was not different between playing groups, there were observed
differences in that starters generally completed more time in high-intensity zones
than fringe and non-starters players. Our data demonstrate the obvious
importance of participation in game time for completing such high-intensity
physical load. Such data suggest that the training practices of these latter groups
should potentially be manipulated in order to induce comparable seasonal
workloads.
122
CHAPTER 6
ENERGY INTAKE AND EXPENDITURE OF
PROFESSIONAL SOCCER PLAYERS OF
THE ENGLISH PREMIER LEAGUE:
EVIDENCE OF CARBOHYDRATE
PERIODISATION AND ‘SKEWING’ OF
MEAL DISTRIBUTION
Having quantified the physical loading patterns in Study 1 and 2, the aim of this
chapter was to subsequently examine the energy expenditure and energy intake
of soccer players from the English Premier League over an in-season micro-
cycle. This chapter was published as two companion papers in the International
Journal of Sports Nutrition and Exercise Metabolism in June and July 2017.
123
6.1. ABSTRACT
In an attempt to better inform the energy requirements of elite soccer players, EI
and EE was quantified in English Premier League soccer players (n=6) during a
7-day in-season period consisting of two match days (MD) and five training days
(TD), as assessed using food diaries (supported by the RFPM and 24 h recalls)
and the DLW method. Although mean daily EI (3186 ± 367 kcals) was not
different from (P>0.05) daily EE (3566 ± 585 kcals), EI was greater on (P<0.05)
MD (3789 ± 577 kcal; 61.1 ± 12.5 kcal.kg-1 LBM) compared with TD (2948 ±
686 kcal; 45.2 ± 12.2 kcal.kg-1 LBM, respectively). Differences in EI were
reflective of greater (P<0.05) daily CHO intake on MD (6.4 ± 2.2 g.kg-1)
compared with TD (4.2 ± 1.6 g.kg-1). Exogenous CHO intake was also different
(P<0.01) during training sessions (5.3 ± 10.3 g.hr-1) versus matches (31.9 ± 21.0
g.hr-1). In contrast, daily protein (205 ± 30 g, P=0.29) and fat intake (101 ± 20 g,
P=0.16) did not display any evidence of daily periodisation. It was also observed
that there was a skewed daily distribution of energy, CHO, protein and fat intake
on TD such that parameters were typically greater in lunch and dinner compared
with breakfast and snacks. Although players readily achieve current guidelines
for daily protein and fat intake, a higher daily CHO intake (6-8 g.kg-1) is
recommended on the day prior to and in recovery from match play so as to
promote muscle glycogen storage.
Keywords: glycogen, training load, soccer, GPS
124
6.2. INTRODUCTION
Despite four decades of research examining the physical demands of soccer
match play (Reilly & Thomas, 1976; Bloomfield et al., 2007; Carling et al.,
2008; Bush et al., 2015a; Bush et al., 2015b), the quantification of the customary
training loads completed by elite professional soccer players have only recently
been examined (Anderson et al., 2015; Anderson et al., 2016; Morgans et al.,
2014; Gaudino et al., 2014; Malone et al., 2015). Importantly, such data suggest
that training loads do not near recreate those experienced in match play in terms
of total distance (e.g. <7 km v ~10-12 km) high speed running distance (e.g.
<300 m v ~1000 m), sprint distance (e.g. <150 m v >300 m) and average speed
(e.g. <80 m/min v ~100-120 m/min). Daily training load during the weekly
micro-cycle also displays evidence of periodisation, the pattern of which appears
dependent on proximity to the game itself (Anderson et al., 2015) as well as the
number of games scheduled (Morgans et al., 2014; Anderson et al., 2015).
Given the apparent daily fluctuations in training load, it follows that EE may
vary accordingly and hence, EI could also be adjusted to account for the goals of
that particular day. Indeed, the concept of “fuelling for the work required” has
recently been suggested as a practical framework for which to apply nutritional
periodisation strategies to elite athletes (Impey et al., 2016). In this regard, such
strategies are intended to concomitantly promote components of training
adaptation (e.g. activation of regulatory cell signaling pathways) but yet, also
ensure adequate CHO (and energy) availability to promote competitive
performance, reduce injury risk and aid recovery (Burke et al., 2011; Chamari et
al., 2012; Burke et al., 2006). Despite such theoretical rationale, however, it is
currently difficult to prescribe accurate nutritional guidelines for professional
soccer players owing to a lack of study in the modern professional adult player
(Ebine et al., 2002; Maughan, 1997; Bettonviel et al., 2016). Furthermore, recent
inferences on contemporary fuelling guidelines for soccer players have been
suggested on the basis of quantifying training load using GPS per se (Anderson
et al., 2015), as opposed to simultaneous estimations of EI and direct
measurement of EE.
125
With this in mind, the aim of the present study was to therefore simultaneously
quantify EI, EE, training load and match load in professional soccer players. To
this end, a cohort of professional players from the English Premier League was
studied during a 7-day in season period in which two match days (MD) and five
training days (TD) were completed. Self reported EI and direct measurement of
EE was assessed using food diaries (supported by RFPM and 24 h diet recalls)
and the DLW method, respectively.
6.3. METHODS
6.3.1. PARTICIPANTS
Six male professional soccer players (who have all played International standard)
from an English Premier League first team squad (mean ± SD; age 27 ± 3 years,
body mass 80.5 ± 8.7 kg, height 180 ± 7 cm, body fat 11.9 ± 1.2 %, fat mass 9.2
± 1.6 kg, lean mass 65.0 ± 6.7 kg) volunteered to take part in the study. Players
with different positions on the field took part in the study and included 1 wide
defender, 1 central defender, 2 central midfielders (1 defending and 1 attacking),
1 wide midfielder and 1 center forward. All players remained injury free for the
duration of the study. The study was conducted according to the Declaration of
Helsinki and was approved by the University Ethics Committee of Liverpool
John Moores University.
6.3.2. STUDY DESIGN
Data collection was conducted during the English Premier League 2015-2016 in-
season across the months of November and December. An overview of the
schedule prior to, during and post testing period can be found in table 4.1.
Players continued with their normal in-season training that was prescribed by the
club’s coaching staff and were available to perform in two competitive games on
days 2 and 5 during data collection. The last competitive game where players
were able to take part in was 3 days prior to the commencement of data
collection. During data collection, game 1 kicked off at 20:05 hours and game 2
kicked off at 16:15 hours, both being home fixtures in European and domestic
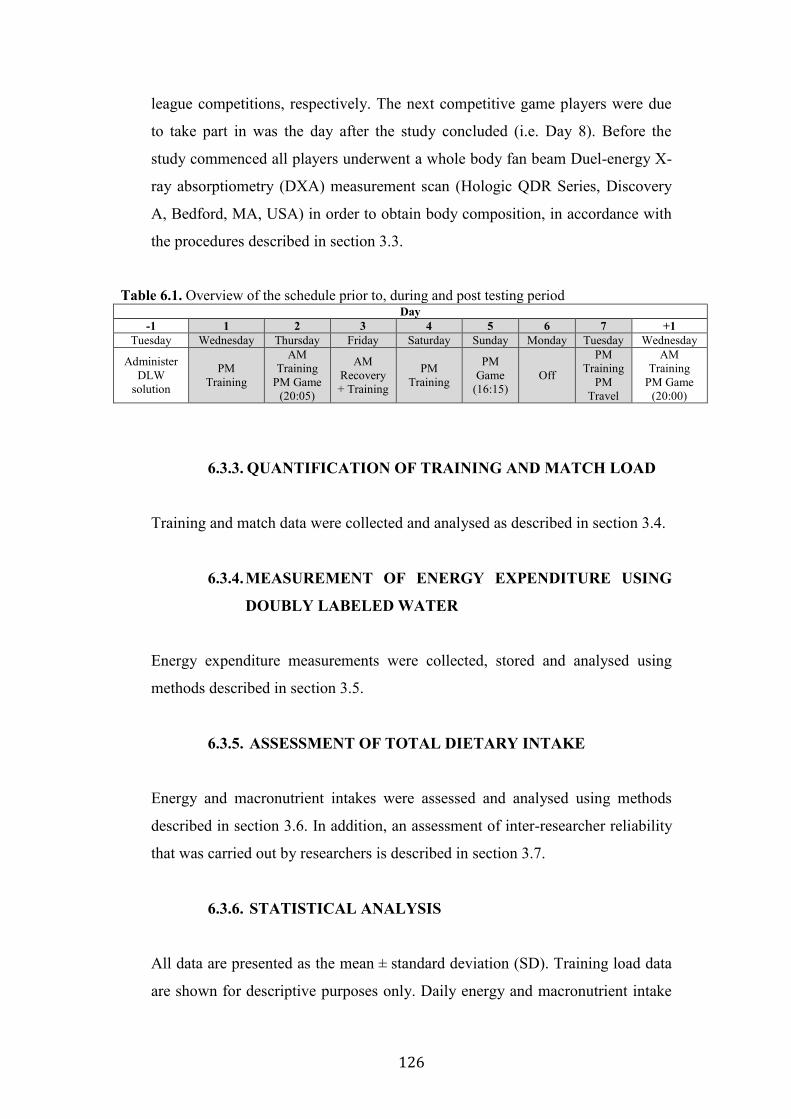
126
league competitions, respectively. The next competitive game players were due
to take part in was the day after the study concluded (i.e. Day 8). Before the
study commenced all players underwent a whole body fan beam Duel-energy X-
ray absorptiometry (DXA) measurement scan (Hologic QDR Series, Discovery
A, Bedford, MA, USA) in order to obtain body composition, in accordance with
the procedures described in section 3.3.
Table 6.1. Overview of the schedule prior to, during and post testing period Day
-1 1 2 3 4 5 6 7 +1 Tuesday Wednesday Thursday Friday Saturday Sunday Monday Tuesday Wednesday
Administer DLW
solution
PM Training
AM Training
PM Game (20:05)
AM Recovery + Training
PM Training
PM Game
(16:15) Off
PM Training
PM Travel
AM Training
PM Game (20:00)
6.3.3. QUANTIFICATION OF TRAINING AND MATCH LOAD
Training and match data were collected and analysed as described in section 3.4.
6.3.4. MEASUREMENT OF ENERGY EXPENDITURE USING
DOUBLY LABELED WATER
Energy expenditure measurements were collected, stored and analysed using
methods described in section 3.5.
6.3.5. ASSESSMENT OF TOTAL DIETARY INTAKE
Energy and macronutrient intakes were assessed and analysed using methods
described in section 3.6. In addition, an assessment of inter-researcher reliability
that was carried out by researchers is described in section 3.7.
6.3.6. STATISTICAL ANALYSIS
All data are presented as the mean ± standard deviation (SD). Training load data
are shown for descriptive purposes only. Daily energy and macronutrient intake
127
were analysed using one-way repeated measures ANOVAs. Meal distribution
data was analysed using linear mixed models with meal as the fixed factor. A
random intercept was set for each individual player. When there was a significant
(P < 0.05) effect of the fixed factor, Tukey post-hoc pairwise comparisons were
performed to identify which categories of the factor differed. This whole analysis
was performed separately for training and match days. After the normal
distribution of differences between data pairs was verified with Shapiro-Wilk
tests (P>0.05 for all variables), paired Student’s t tests (with statistical
significance set at P<0.05) were then used to assess: the differences between
energy and macronutrient intakes during match day one vs. match day two for
any meal, the differences between the average daily EI and EE, the difference
between CHO intake during training and matches, the difference between EI and
CHO intake on match days vs. training days, and changes in body mass from
before to after the study period. In all the analyses, statistical significance was set
at P<0.05. The statistical analysis was carried out with R, version 3.3.1.
6.4. RESULTS
6.4.1. QUANTIFICATION OF DAILY AND ACCUMULATIVE
WEEKLY LOAD
An overview of the individual daily training and match load and the
accumulative weekly load is presented in Tables 6.1. and 6.2., respectively.
6.4.2. QUANTIFICATION OF DAILY ENERGY AND
MACRONUTRIENT INTAKE
A comparison of daily energy and macronutrient intake is presented in Figure
6.1. Daily absolute and relative EI and CHO intake was significantly different
across the 7-day period (all P<0.05). Specifically, players reported greater
absolute and relative EI on day 2 (i.e. match day 1) compared with days 1 (both
P<0.05) and 3 (both P<0.05). On day 5 (i.e. match day 2), players reported
higher absolute and relative EI compared with days 1, 3, 4 and 6 (all P<0.05).
128
Additionally, players reported higher absolute and relative EI on day 7 compared
with day 4 (both P<0.05) as well as higher absolute EI on day 5 compared to day
2 (P=0.03).
In relation to CHO intake, both absolute (all P<0.01) and relative intake (all
P<0.01) was greater on day 2 compared to days 1, 3, 4 and 6. On day 5, both
absolute and relative CHO intakes were higher than days 1 (both P<0.02) and 6
(both P<0.02). Absolute CHO intake was also higher on day 5 compared to day
4 (P=0.05), but did not achieve significance when expressed relatively (P=0.06).
In contrast to energy and CHO intake, there was no significant difference
between days in the reported absolute protein (P=0.29), relative protein (P=0.31),
absolute (P=0.16), and relative fat (P=0.16) intake.
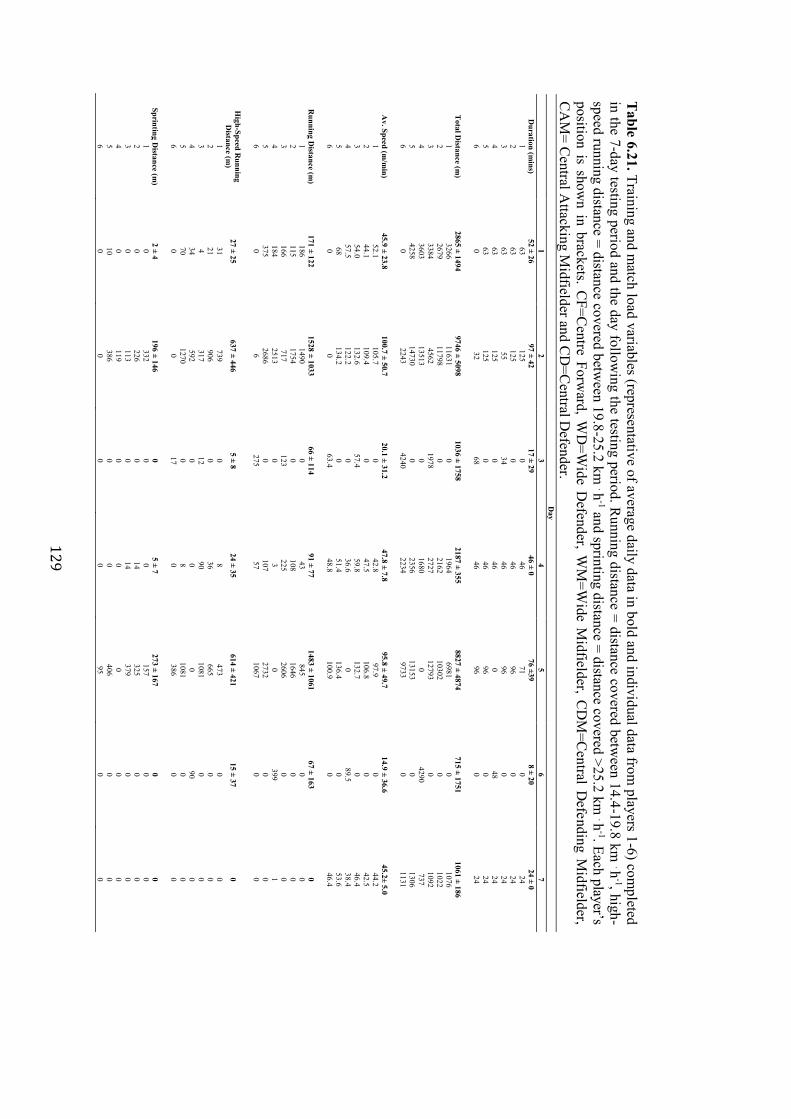
129
Table 6.21. Training and m
atch load variables (representative of average daily data in bold and individual data from players 1-6) com
pleted in the 7-day testing period and the day follow
ing the testing period. Running distance = distance covered betw
een 14.4-19.8 km . h
-1, high-speed running distance = distance covered betw
een 19.8-25.2 km . h
-1 and sprinting distance = distance covered >25.2 km . h
-1. Each player’s position is show
n in brackets. CF=C
entre Forward, W
D=W
ide Defender, W
M=W
ide Midfielder, C
DM
=Central D
efending Midfielder,
CA
M= C
entral Attacking M
idfielder and CD
=Central D
efender. D
ay
1 2
3 4
5 6
7 D
uration (mins)
52 ± 26 97 ± 42
17 ± 29 46 ± 0
76 ±39 8 ± 20
24 ± 0 1
63 125
0 46
71 0
24 2
63 125
0 46
96 0
24 3
63 55
34 46
96 0
24 4
63 125
0 46
0 48
24 5
63 125
0 46
96 0
24 6
0 32
68 46
96 0
24
Total D
istance (m)
2865 ± 1494 9746 ± 5098
1036 ± 1758 2187 ± 355
8827 ± 4874 715 ± 1751
1061 ± 186
1 3266
11631 0
1964 6981
0 1076
2 2679
11798 0
2162 10302
0 1022
3 3384
4562 1978
2727 12793
0 1092
4 3603
13513 0
1680 0
4290 737
5 4258
14730 0
2356 13153
0 1306
6 0
2243 4240
2234 9733
0 1131
Av. Speed (m
/min)
45.9 ± 23.8 100.7 ± 50.7
20.1 ± 31.2 47.8 ± 7.8
95.8 ± 49.7 14.9 ± 36.6
45.2± 5.0 1
52.1 105.7
0 42.8
97.9 0
44.2 2
44.1 109.4
0 47.5
106.8 0
42.5 3
54.0 132.6
57.4 59.8
132.7 0
46.4 4
57.5 122.2
0 36.6
0 89.5
38.4 5
68 134.2
0 51.4
136.4 0
53.6 6
0 0
63.4 48.8
100.9 0
46.4
R
unning Distance (m
) 171 ± 122
1528 ± 1033 66 ± 114
91 ± 77 1483 ± 1061
67 ± 163 0
1 186
1490 0
43 845
0 0
2 115
1754 0
108 1646
0 0
3 166
717 123
225 2606
0 0
4 184
2513 0
3 0
399 1
5 375
2686 0
107 2732
0 0
6 0
6 275
57 1067
0 0
High-Speed R
unning D
istance (m)
27 ± 25 637 ± 446
5 ± 8
24 ± 35 614 ± 421
15 ± 37 0
1 31
739 0
8 473
0 0
2 21
906 0
36 665
0 0
3 4
317 12
90 1081
0 0
4 34
592 0
0 0
90 0
5 70
1270 0
8 1081
0 0
6 0
0 17
0 386
0 0
Sprinting Distance (m
) 2 ± 4
196 ± 146 0
5 ± 7 273 ± 167
0 0
1 0
332 0
0 157
0 0
2 0
226 0
14 325
0 0
3 0
113 0
14 379
0 0
4 0
119 0
0 0
0 0
5 10
386 0
0 406
0 0
6 0
0 0
0 95
0 0
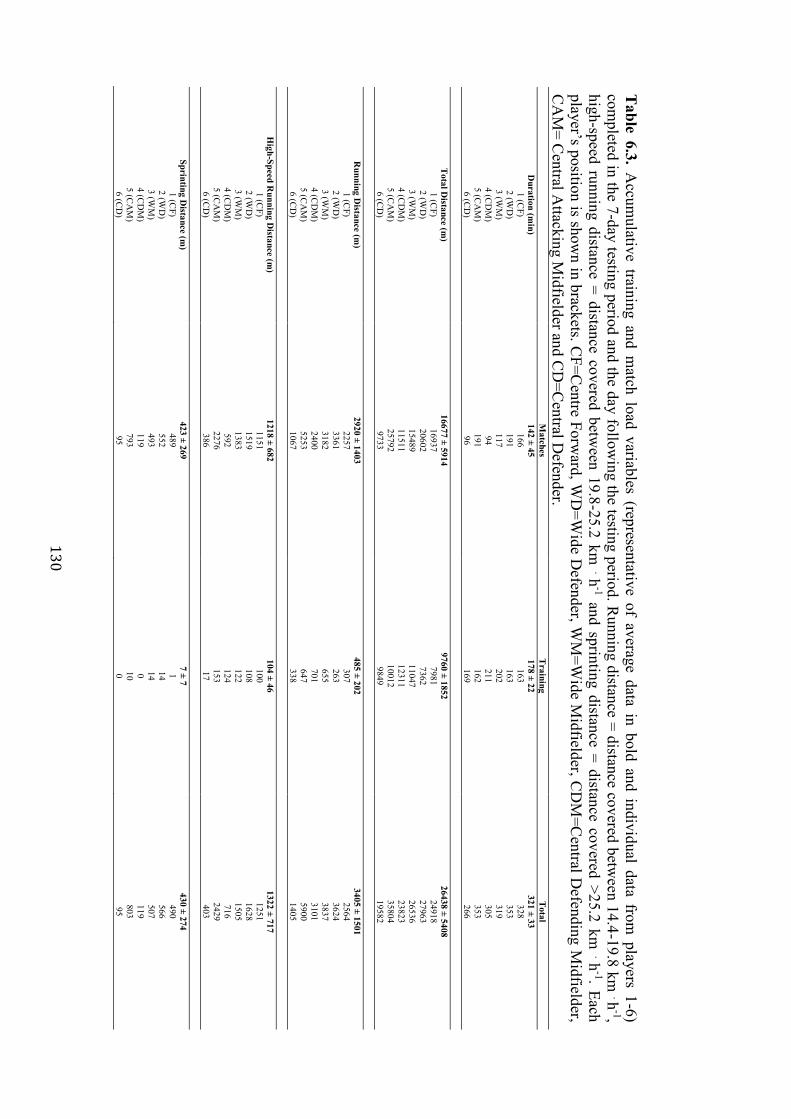
130
Table 6.3. A
ccumulative training and m
atch load variables (representative of average data in bold and individual data from players 1-6)
completed in the 7-day testing period and the day follow
ing the testing period. Running distance = distance covered betw
een 14.4-19.8 km . h
-1, high-speed running distance = distance covered betw
een 19.8-25.2 km . h
-1 and sprinting distance = distance covered >25.2 km . h
-1. Each player’s position is show
n in brackets. CF=C
entre Forward, W
D=W
ide Defender, W
M=W
ide Midfielder, C
DM
=Central D
efending Midfielder,
CA
M= C
entral Attacking M
idfielder and CD
=Central D
efender.
Matches
Training
Total
Duration (m
in) 142 ± 45
178 ± 22 321 ± 33
1 (CF)
166 163
328 2 (W
D)
191 163
353 3 (W
M)
117 202
319 4 (C
DM
) 94
211 305
5 (CA
M)
191 162
353 6 (C
D)
96 169
266
T
otal Distance (m
) 16677 ± 5914
9760 ± 1852 26438 ± 5408
1 (CF)
16937 7981
24918 2 (W
D)
20602 7362
27963 3 (W
M)
15489 11047
26536 4 (C
DM
) 11511
12311 23823
5 (CA
M)
25792 10012
35804 6 (C
D)
9733 9849
19582
R
unning Distance (m
) 2920 ± 1403
485 ± 202 3405 ± 1501
1 (CF)
2257 307
2564 2 (W
D)
3361 263
3624 3 (W
M)
3182 655
3837 4 (C
DM
) 2400
701 3101
5 (CA
M)
5253 647
5900 6 (C
D)
1067 338
1405
H
igh-Speed Running D
istance (m)
1218 ± 682 104 ± 46
1322 ± 717 1 (C
F) 1151
100 1251
2 (WD
) 1519
108 1628
3 (WM
) 1383
122 1505
4 (CD
M)
592 124
716 5 (C
AM
) 2276
153 2429
6 (CD
) 386
17 403
Sprinting Distance (m
) 423 ± 269
7 ± 7 430 ± 274
1 (CF)
489 1
490 2 (W
D)
552 14
566 3 (W
M)
493 14
507 4 (C
DM
) 119
0 119
5 (CA
M)
793 10
803 6 (C
D)
95 0
95
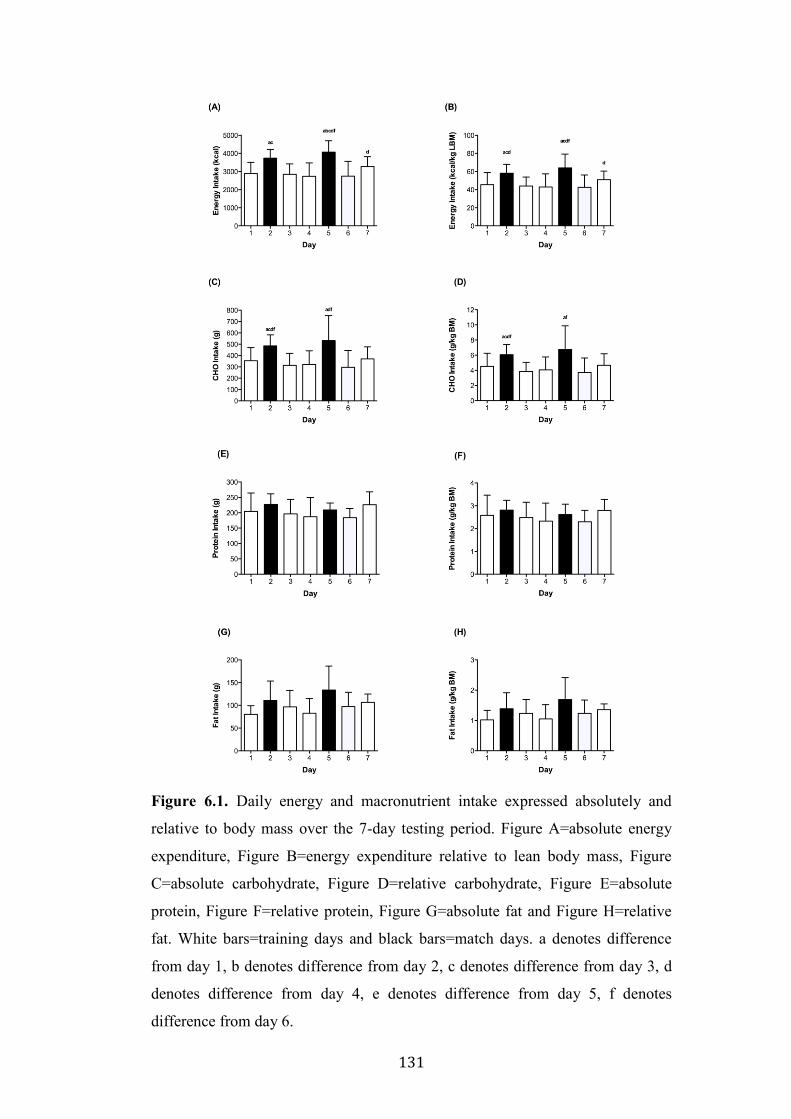
131
Figure 6.1. Daily energy and macronutrient intake expressed absolutely and
relative to body mass over the 7-day testing period. Figure A=absolute energy
expenditure, Figure B=energy expenditure relative to lean body mass, Figure
C=absolute carbohydrate, Figure D=relative carbohydrate, Figure E=absolute
protein, Figure F=relative protein, Figure G=absolute fat and Figure H=relative
fat. White bars=training days and black bars=match days. a denotes difference
from day 1, b denotes difference from day 2, c denotes difference from day 3, d
denotes difference from day 4, e denotes difference from day 5, f denotes
difference from day 6.
132
6.4.3. ENERGY AND MACRONUTRIENT INTAKE ON
TRAINING VS. MATCH DAYS
EI and EI relative to LBM were also greater (both P<0.05) on match days (3789
± 532 kcal; 61.1 ± 11.4 kcal·kg-1 LBM) compared with training days (2956 ± 374
kcal; 45.2 ± 9.3 kcal·kg-1 LBM, respectively). Additionally, CHO intake and
CHO intake relative to body mass were also greater (both P<0.05) on match days
(330 ± 98 g; 6.4 ± 2.2 g·kg-1) compared with training days (508 ± 152 g; 4.2 ±
1.4 g·kg-1).
6.4.4. ENERGY AND MACRONUTRIENT DISTRIBUTION
ACROSS MEALS ON TRAINING DAYS
There were significant differences in the reported absolute and relative energy
and macronutrient between meals consumed on training days (P<0.01 for all
examined absolute and relative EI variables; see Figure 6.2.). Specifically,
players consumed higher absolute and relative EI at dinner compared with
breakfast, morning, afternoon and evening snacks (P<0.01 for all comparisons).
Additionally, absolute and relative EI was also greater at lunch compared with
the morning and evening snacks (P<0.01). Absolute and relative CHO intakes
were higher at dinner compared with morning snack (both P<0.01), lunch (both
P<0.05) and evening snack (both P<0.01), with relative CHO intake also being
higher at dinner compared with breakfast (P=0.04).
Protein and relative protein intakes were greater at dinner compared with
breakfast, morning snacks, afternoon snacks and evening snacks (P<0.01 for all
comparisons). In addition, absolute and relative protein intakes were greater at
lunch compared with breakfast, morning snacks and evening snacks (P<0.01 for
all comparisons). Both absolute and relative protein intakes were also higher at
breakfast compared with evening snack (both P<0.02) and higher at the
afternoon snack compared with the evening snack (both P<0.01).
133
In relation to fat intake, both absolute and relative intakes were higher at dinner
compared with the morning, afternoon snacks and evening snacks (P<0.05 for all
comparisons). Additionally, fat intake was also higher at lunch compared with
the morning snack (P<0.01 for both absolute and relative intakes).
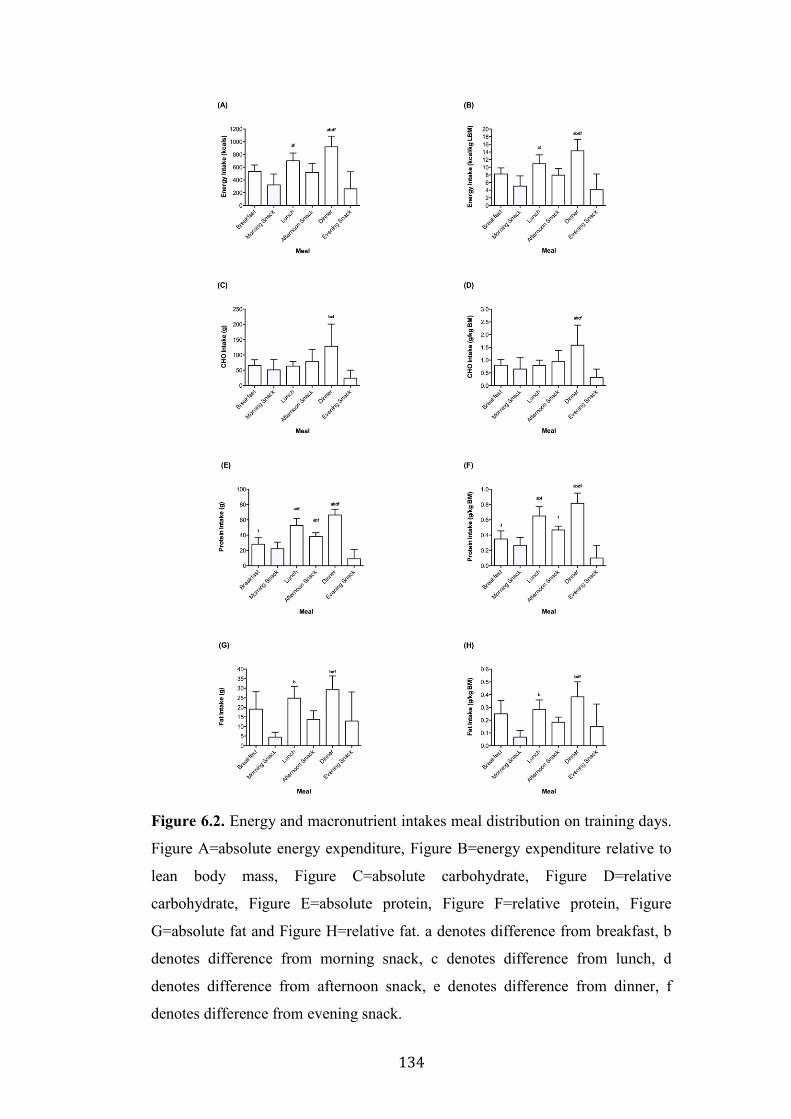
134
Figure 6.2. Energy and macronutrient intakes meal distribution on training days.
Figure A=absolute energy expenditure, Figure B=energy expenditure relative to
lean body mass, Figure C=absolute carbohydrate, Figure D=relative
carbohydrate, Figure E=absolute protein, Figure F=relative protein, Figure
G=absolute fat and Figure H=relative fat. a denotes difference from breakfast, b
denotes difference from morning snack, c denotes difference from lunch, d
denotes difference from afternoon snack, e denotes difference from dinner, f
denotes difference from evening snack.
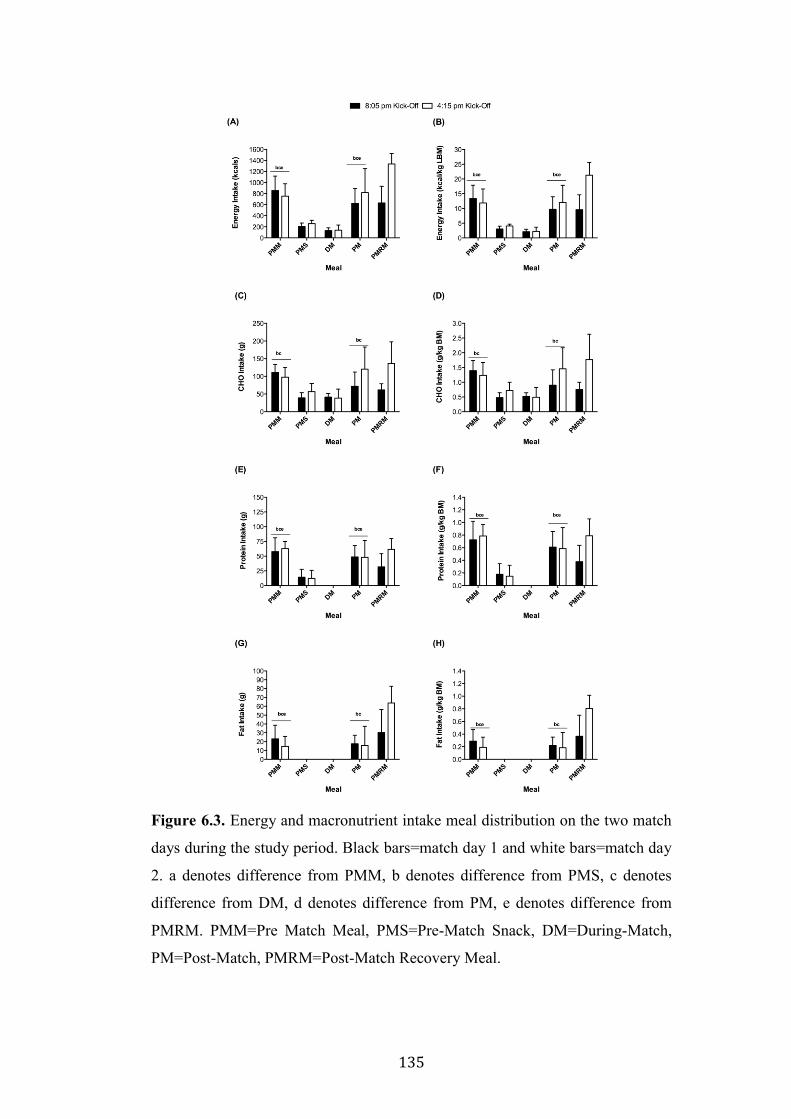
135
Figure 6.3. Energy and macronutrient intake meal distribution on the two match
days during the study period. Black bars=match day 1 and white bars=match day
2. a denotes difference from PMM, b denotes difference from PMS, c denotes
difference from DM, d denotes difference from PM, e denotes difference from
PMRM. PMM=Pre Match Meal, PMS=Pre-Match Snack, DM=During-Match,
PM=Post-Match, PMRM=Post-Match Recovery Meal.
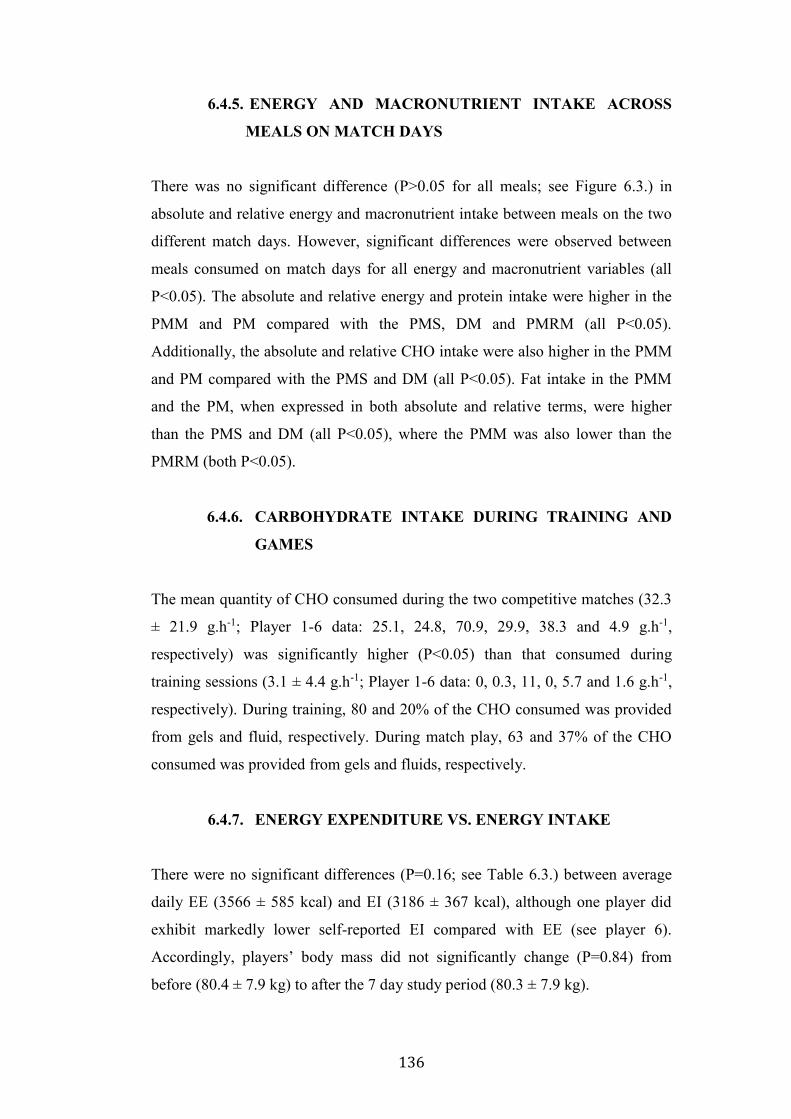
136
6.4.5. ENERGY AND MACRONUTRIENT INTAKE ACROSS
MEALS ON MATCH DAYS
There was no significant difference (P>0.05 for all meals; see Figure 6.3.) in
absolute and relative energy and macronutrient intake between meals on the two
different match days. However, significant differences were observed between
meals consumed on match days for all energy and macronutrient variables (all
P<0.05). The absolute and relative energy and protein intake were higher in the
PMM and PM compared with the PMS, DM and PMRM (all P<0.05).
Additionally, the absolute and relative CHO intake were also higher in the PMM
and PM compared with the PMS and DM (all P<0.05). Fat intake in the PMM
and the PM, when expressed in both absolute and relative terms, were higher
than the PMS and DM (all P<0.05), where the PMM was also lower than the
PMRM (both P<0.05).
6.4.6. CARBOHYDRATE INTAKE DURING TRAINING AND
GAMES
The mean quantity of CHO consumed during the two competitive matches (32.3
± 21.9 g.h-1; Player 1-6 data: 25.1, 24.8, 70.9, 29.9, 38.3 and 4.9 g.h-1,
respectively) was significantly higher (P<0.05) than that consumed during
training sessions (3.1 ± 4.4 g.h-1; Player 1-6 data: 0, 0.3, 11, 0, 5.7 and 1.6 g.h-1,
respectively). During training, 80 and 20% of the CHO consumed was provided
from gels and fluid, respectively. During match play, 63 and 37% of the CHO
consumed was provided from gels and fluids, respectively.
6.4.7. ENERGY EXPENDITURE VS. ENERGY INTAKE
There were no significant differences (P=0.16; see Table 6.3.) between average
daily EE (3566 ± 585 kcal) and EI (3186 ± 367 kcal), although one player did
exhibit markedly lower self-reported EI compared with EE (see player 6).
Accordingly, players’ body mass did not significantly change (P=0.84) from
before (80.4 ± 7.9 kg) to after the 7 day study period (80.3 ± 7.9 kg).
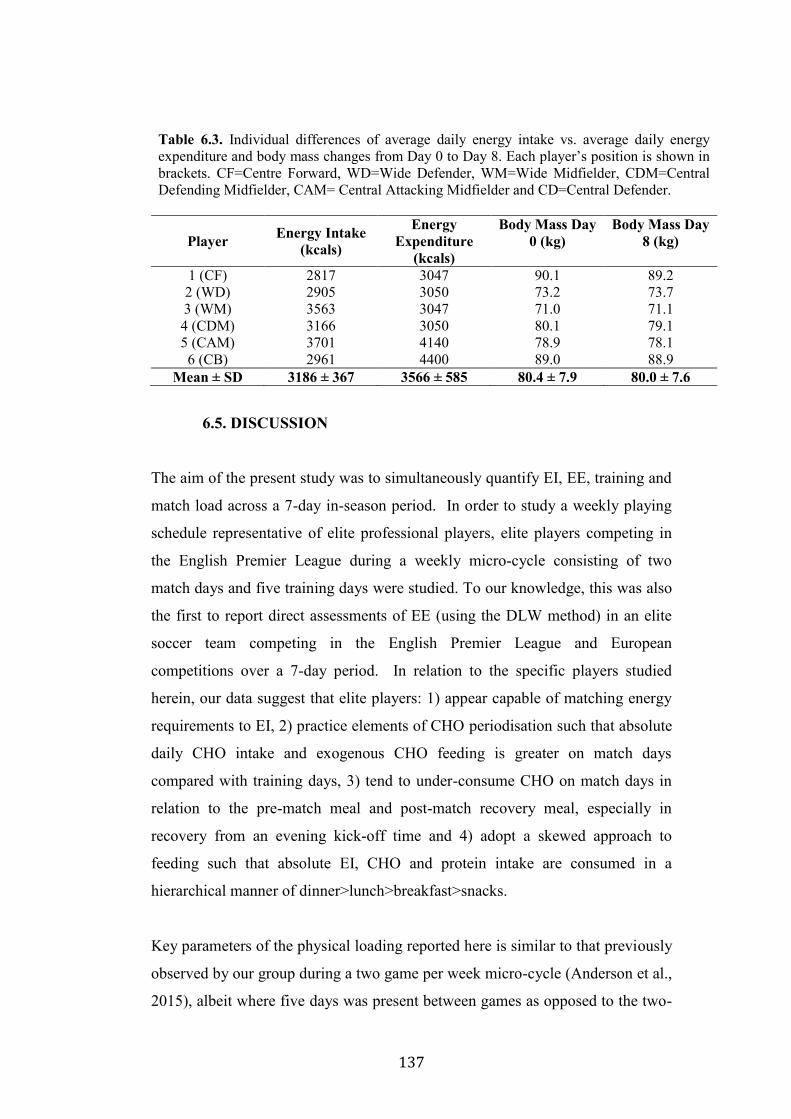
137
Table 6.3. Individual differences of average daily energy intake vs. average daily energy expenditure and body mass changes from Day 0 to Day 8. Each player’s position is shown in brackets. CF=Centre Forward, WD=Wide Defender, WM=Wide Midfielder, CDM=Central Defending Midfielder, CAM= Central Attacking Midfielder and CD=Central Defender.
Player Energy Intake (kcals)
Energy Expenditure
(kcals)
Body Mass Day 0 (kg)
Body Mass Day 8 (kg)
1 (CF) 2817 3047 90.1 89.2 2 (WD) 2905 3050 73.2 73.7 3 (WM) 3563 3047 71.0 71.1 4 (CDM) 3166 3050 80.1 79.1 5 (CAM) 3701 4140 78.9 78.1 6 (CB) 2961 4400 89.0 88.9
Mean ± SD 3186 ± 367 3566 ± 585 80.4 ± 7.9 80.0 ± 7.6
6.5. DISCUSSION
The aim of the present study was to simultaneously quantify EI, EE, training and
match load across a 7-day in-season period. In order to study a weekly playing
schedule representative of elite professional players, elite players competing in
the English Premier League during a weekly micro-cycle consisting of two
match days and five training days were studied. To our knowledge, this was also
the first to report direct assessments of EE (using the DLW method) in an elite
soccer team competing in the English Premier League and European
competitions over a 7-day period. In relation to the specific players studied
herein, our data suggest that elite players: 1) appear capable of matching energy
requirements to EI, 2) practice elements of CHO periodisation such that absolute
daily CHO intake and exogenous CHO feeding is greater on match days
compared with training days, 3) tend to under-consume CHO on match days in
relation to the pre-match meal and post-match recovery meal, especially in
recovery from an evening kick-off time and 4) adopt a skewed approach to
feeding such that absolute EI, CHO and protein intake are consumed in a
hierarchical manner of dinner>lunch>breakfast>snacks.
Key parameters of the physical loading reported here is similar to that previously
observed by our group during a two game per week micro-cycle (Anderson et al.,
2015), albeit where five days was present between games as opposed to the two-
138
day period studied here. Indeed, similar accumulative weekly high-speed running
(1322 v 1466 m, respectively) and sprint (430 v 519 m, respectively) distance
were observed. This result was expected given that such high-intensity loading
patterns are largely reflective of game time as opposed to training time
(Anderson et al., 2016). Interestingly, the weekly accumulative total distance
reported here was less than that observed previously (26.4 v 32.5 km), a finding
likely attributable to the greater frequency of training sessions completed by each
player during the five-day interim period (Anderson et al., 2015). Such data
reiterate how subtle alterations to the match and training schedule affects weekly
loading patterns.
The mean daily EI and EE data reported here suggest that elite players are
capable of matching overall weekly energy requirements. It is noteworthy,
however, that despite no player experiencing body mass loss or gain during the
study period, two players appeared to be under-reporting EI as evidenced by a
mismatch between EI versus EE data. The mean daily EE (3566 ± 585 kcals) and
EI (3186 ± 367 kcals) observed here agrees well that previously observed in
professional Japanese players (3532 ± 432 and 3113 ± 581 kcal, respectively)
where both DLW and 7-day food diaries were also used as measurement tools
(Ebine et al., 2002). Although these authors did not provide any data related to
physical loading, the similarity between studies is likely related to these
researchers also studying a two-game per week playing schedule where
consecutive games were also separated by two days. Interestingly, our EE data
are much lower than that reported by our group for professional rugby players
(5378 ± 645 kcal), thereby providing further evidence that nutritional guidelines
for team sports should be specific to the sport and athlete in question (Morehen
et al., 2016)
A limitation of the DLW technique is the inability to provide day-to-day EE
assessments hence data are expressed as mean EE for the 7-day data collection
period. Nonetheless, the players studied here appear to adopt elements of CHO
periodisation in accordance with the upcoming physical load and likely
differences in day-to-day EE. For example, both absolute and relative daily
energy and CHO intake was greater on match days (3789 ± 577 kcal and 6.4 ±
139
2.2 g.kg-1, respectively) compared with training days (2948 ± 686 kcal and 4.2 ±
1.4 g.kg-1, respectively). Such differences in daily EI also agrees with recent
observation from adult professional players of the Dutch league (Bettonviel et
al., 2016) where subtle differences were observed between match days, training
days and rest days (3343 ± 909, 3216 ± 834 and 2662 ± 680 kcal, respectively).
It is also noteworthy that there was an observed greater EI on day 7 (prior to
another match undertaken on day 8) versus day 4 (prior to match day 2). Such
differences may reflect additional EI that is consumed prior to and during
travelling (i.e. snacks provided on the bus) to the away game on day 8.
In the context of a two game week, however, it is likely that players did not
consume adequate CHO to optimise muscle glycogen storage in the day prior to
and in recovery from the games (Krustrup et al., 2006; Bassau et al., 2002). This
point is especially relevant considering the inability to fully replenish muscle
glycogen content in type II fibres 48 h after match play, even when CHO intake
is > 8 g.kg-1 body mass per day (Gunnarsson et al., 2013). In this present study, it
was also observed that CHO intakes would be considered sub-optimal in relation
to maximizing rates of post-match muscle glycogen re-synthesis (Jentjens &
Jeukendrup, 2003). Indeed, in contrast to the well-accepted guidelines of 1.2
g.kg-1 body mass for several hours post-exercise, it was observed that intakes of
<1 g.kg-1 were reported in the immediate period after match day 1 (i.e. the night-
time kick off). Such post-game intakes coupled with the relatively low absolute
daily intake (i.e. 4 g.kg-1) on the subsequent day would inevitably ensue that
absolute muscle glycogen re-synthesis was likely compromised, an effect that
may be especially prevalent in type II fibres (Gunnarsson et al., 2013). It is
noteworthy, however, that the high absolute protein intakes consumed in the
post-match period (i.e. >50 g) would likely potentiate rates of muscle glycogen
re-synthesis when consumed in the presence of sub-optimal CHO availability
(Van Loon et al., 2000).
In relation to match day itself, it could also be suggested that players did not
meet current CHO guidelines for which to optimise aspects of physical (Burke et
al., 2011), technical (Ali & Williams, 2009; Russell & Kingsley, 2014) and
cognitive (Welsh et al., 2002) performance. Interestingly, CHO intake during
140
match play was highest in players 3 and 5 who also tended to be the players
(midfielders) with the greatest physical load on match days. Positional
differences may therefore contribute to habitual fuelling strategies. When taken
together, data suggest that players may benefit from consuming greater amounts
of CHO in the day prior to and in recovery from match play (so as to optimise
muscle glycogen storage) as well as consume greater amounts of CHO during
exercise to maximise the aforementioned components of soccer performance. In
this regard, both the pre-match meal (< 1.5 g.kg-1 body mass) and CHO feeding
during match play (~30 g.h-1; four players consumed <30 g.h-1) could be
considered sub-optimal in relation to those studies (Wee et al., 2005; Foskett et
al., 2008) demonstrating higher CHO intakes (e.g. 2-3 g.kg-1 body mass and 60
g.h-1, respectively) induce physiological benefits that are facilitative of improved
high-intensity intermittent performance e.g. high pre-exercise glycogen stores,
maintenance of plasma glucose/CHO oxidation during exercise and muscle
glycogen sparing.
Although there is evidence of CHO periodisation during the week, players
reported consistent daily protein and fat intakes. Interestingly, absolute and
relative daily protein intakes were higher (205 ± 30 g) than that reported two
decades ago in British professional players (108 ± 26 g), whereas both CHO and
fat intake were relatively similar (Maughan, 1997). Our observed daily protein
intakes also agree well with those reported recently (150-200 g) in adult
professional players from the Dutch league (Bettonviel et al., 2016). Such
differences between eras are potentially driven by the increased scientific
research and resulting athlete (and coach) awareness of the role of protein in
facilitating training adaptations and recovery from both aerobic and strength
training (Moore et al., 2014; McNaughton et al., 2016).
Recent data also suggest that the timing and even distribution of daily protein
doses may have a more influential role in modulating muscle protein synthesis
rates in responses to both feeding alone (Mamerow et al., 2014) and post-
exercise feeding (Areta et al., 2013). In this regard, a skewed pattern of daily
protein intake in that absolute protein was consumed in a hierarchical order
where dinner>lunch>breakfast>snacks was observed. This finding also agrees
141
with our previous observations on the protein feeding patterns of elite youth
soccer players (Naughton et al., 2016) as well as adult players from the Dutch
league (Bettonviel et al., 2016) and a mixed sex cohort of Dutch athletes (Gillen
et al., 2016). Based on recent data suggesting that trained athletes (especially
those with higher lean mass) may require protein doses of approximately 40 g
(McNaughton et al., 2016) as well as the importance of protein feeding prior to
sleep (Res et al., 2012), our data suggest that breakfast and morning, afternoon
and bedtime snacks are key times to improve for the present sample. It must be
acknowledged, however, that protein requirements (both in absolute dosing and
timing) should be tailored to the specific population in question in accordance
with timing of training sessions, training load and moreover, individualised
training goals.
Additionally, it was also observed that CHO ingestion was significantly during
training sessions (3.1 ± 4.4 g.min-1) compared with matches (32.3 ± 21.9 g.min-
1). Furthermore, the breakfast and lunch (<1 g.kg-1) consumed on training days
(that effectively serve as the pre-training meal) also tended to be lower in CHO
content than that consumed in the PMM (1-1.5 g.kg-1). It is, of course, difficult
to ascertain whether such alterations to CHO fuelling patterns were a deliberate
choice of the player and/or a coach (sport scientist) led practice or moreover, an
unconscious choice. Nonetheless, such choices appear to be in accordance with
the “fuel for the work required” principle (Impey et al., 2016) in that carefully
chosen periods of reduced CHO availability may lead to work-efficient skeletal
muscle cell signaling processes that regulate components of training adaptation
(Bartlett et al., 2015; Hawley & Morton, 2015).
Despite the novelty and practical application of the current study, our data are
not without limitations, largely a reflection of the practical demands of data
collection in an elite football setting. Firstly, the simultaneous use of both GPS
and Prozone® to quantify training and competitive match demands, respectively,
has implications for the comparability of data between systems (Harley et al.,
2011; Buchheit et al., 2014). However, it is not yet common policy to use GPS
during competitive games due to managers’ preferences, players’ comfort issues
and poor signal strength due to roofing in many of the stadiums in the English
142
Premier League. Secondly, this study is reflective of only six players from one
team only (albeit reflective of a top English Premier League team) and hence
may not be representative of the customary training and nutritional habits of
other teams. Nonetheless, players were deliberately recruited from different
playing positions in an attempt to provide a more representative sample of
professional soccer players. Thirdly, as with all dietary analysis studies, our data
may be limited by both under-reporting and inter-researcher variability in ability
to assess dietary intakes. Indeed, whilst there were no significant group mean
changes in body mass over the data collection period, two of our subjects did
appear to under report whereas four of the subjects reported EI data that was
comparable (within 200 kcal) to EE data. Finally, both of the games studied here
represented home games and hence the nutritional choices are likely to be
influenced by the philosophy and service provision of the club coaching and
catering staff.
6.6. CONCLUSION
In summary, this study simultaneously quantified for the first time the daily
physical loading, EI and EE during a weekly micro-cycle of elite level soccer
players from the English Premier League. Although players appear capable of
matching daily energy requirements to EI, elements of CHO periodisation in that
players consumed higher amounts of CHO on match days versus training days
were also observed. Moreover, CHO intakes were below that which is currently
recommended for when players are completing 2 competitive games in close
proximity to one another. Additionally, whilst daily protein intake was consistent
throughout the week, absolute daily protein intake was greater than previously
reported in the literature and was consumed in a hierarchical manner such that
dinner > lunch > breakfast > snacks. These data suggest that players may benefit
from consuming greater amounts of CHO in the day prior to and in recovery
from match play so as to optimise muscle glycogen storage. Furthermore,
attention should also be given to even distribution of daily protein intake so as to
potentially promote components of training adaptation.
143
CHAPTER 7
CASE STUDY: ENERGY INTAKE AND
ENERGY EXPENDITURE IN A PREMIER
LEAGUE GOALKEEPER DURING A
TYPICAL IN-SEASON MICRO-CYCLE
Whilst studies 1-3 focused on outfield players, it is currently difficult to prescribe
nutritional guidelines for the soccer goalkeeper due to a lack of understanding of
training load and energy expenditure. The aim of this chapter was to therefore
quantify physical load, energy intake and energy expenditure of an English
Premier League goalkeeper.
144
7.1. ABSRACT
Professional goalkeepers (GK) in elite soccer have different match and likely
different training demands than their outfield teammates. Due to a lack of
scientific understanding of the energy demands and actual demands of GK
training, it is difficult to provide GK specific nutritional recommendations.
Therefore, in an attempt to further understand the nutritional requirements of a
GK, the aim of this study was to provide a case-study account of a GKs typical
daily training loads, average daily EE and daily EI as assessed using GPS and
ProZone®, food diaries (supported by the RFPM and 24 h recalls) and the DLW
method. Although mean daily EE (2894 kcals) and EI (3160 kcals) were similar,
EI was greater on MD (3475 kcals) compared with TD (3034 kcals). Differences
in EI were reflective of greater daily CHO intake on MD (3.3 g.kg-1) compared
with TD (2.3 g.kg-1). In contrast, daily protein (2.4 g.kg-1) and fat intake (1.9
g.kg-1) did not display any evidence of daily periodisation. A skewed daily
distribution of energy, CHO, protein and fat intake on TD such that parameters
were typically greater in lunch and dinner compared with breakfast and snacks
was also observed. Additionally, the GK failed to meet current recommendations
for meals on match day that could facilitate an improvement in performance and
post-match recovery. Although the GK is currently meeting his energy demands,
it is recommend he adopts a more balanced approach to protein feeding
throughout the day and increases CHO consumption around matches in order to
potentially facilitate performance and recovery improvements.
145
7.2. INTRODUCTION
The GK in soccer is required to demonstrate a high level of proficiency in
various actions related to both defensive and offensive aspects of the game
(Welsh, 1999). In competitive matches, a GK covers significantly less total
distance (5611 ± 613 m vs. 10841 ± 950 m) and distance in high-intensity speed
zones (>19.8 km . h-1) than their outfield teammates (56 ± 34 m vs. 980 ± 294 m)
(Di Salvo et al., 2008; Bradley et al., 2010). Rather, the demands of a GK are
assessed mainly on his ability to perform high-intensity movements and
explosive actions which are separated by longer walking and jogging periods that
allow for recovery (Ziv & Lidor, 2011). They are required to have high levels of
concentration throughout the game in order to be prepared to perform unexpected
actions. In training sessions, GKs often train separately from the rest of the squad
and thus, are likely to have different training demands to outfield players.
Typically, GKs are taller, heavier and have higher levels of body fat than players
in other positions in the team (Milsom et al., 2015; Sutton et al., 2009). This is
undoubtedly a cause for concern as excess fat mass acts as a dead mass in
activities in which the body is lifted repeated against gravity (Reilly, 1996). In
this regard, practitioners strive to implement different nutritional strategies that
support the physical and mental demands of a GKs training and match program.
It is also of importance to educate these players on food ‘choices’, as many of the
foods that are traditionally prescribed by club support staff are high in energy
and CHO due to the demands of outfield positions (Anderson et al., 2017,
Chapter 6). Nevertheless, no data currently exists examining the EE and EI of an
elite professional GK, nor is there any information regarding training load in the
typical weekly micro-cycle. It is therefore difficult to currently provide position
specific nutritional guidelines for GKs.
With this in mind, the aim of this case study was to quantify training load, match
load, EE and EI of an International-standard English Premier League GK over a
weekly micro-cycle. This will enable sports nutritionists to have a more detailed
understanding of nutritional requirements in order to tailor programs specific to
the needs of GK.
146
7.3. METHODS
7.3.1. OVERVIEW OF THE PLAYER
The player is a 27-year old male professional GK (body mass 86.1 kg, height 191
cm, body fat 11.9 %, fat mass 9.8 kg, lean mass 69.5 kg) who is internationally
capped and currently competing in the English Premier League. He made his
professional debut when he was 18 and has been a regular starter at his club for
2.5 seasons prior to this study commencing. Due to competing in regular weekly
league matches and success in both domestic and European cup competitions the
player is often competing in games every 3-4 days. Throughout his 2.5 years at
the club and at the time of study he was clear of injury and a regular starter for
his club and country.
7.3.2. STUDY DESIGN
The data collection was conducted during the English Premier League 2015-
2016 season. This player underwent a body composition assessment in line with
section 3.3. The training and match load were collected and analysed as
described in section 3.4. However, although the same methods were used for data
collection, a specific GK GPS device was used to assess training load (Version
G5, Catapult Innovations, Melbourne, Australia). Throughout the study period,
the player took part in 6 training sessions (which were monitored using GPS) and
2 competitive games to (which were monitored via Prozone®). Energy
expenditure measurements were collected, stored and analysed using methods
described in section 3.5. Energy and macronutrient intakes were assessed and
analysed using methods described in section 3.6. The study was conducted
according to the requirements of the Declaration of Helsinki and was approved
by the university ethics committee of Liverpool John Moores University.
147
7.3.3. MEASUREMENT OF ENERGY EXPENDITURE USING
DOUBLY LABELED WATER
Energy expenditure measurements were collected, stored and analysed using
methods described in section 3.5.
7.3.4. ASSESSMENT OF TOTAL DIETARY INTAKE
Energy and macronutrient intakes were assessed and analysed using methods
described in section 3.6.
7.4. RESULTS
7.4.1. QUANTIFICATION OF DAILY AND ACCUMULATIVE
WEEKLY LOAD
An overview of the individual daily training and match load and the
accumulative weekly load is presented in Table 7.1.
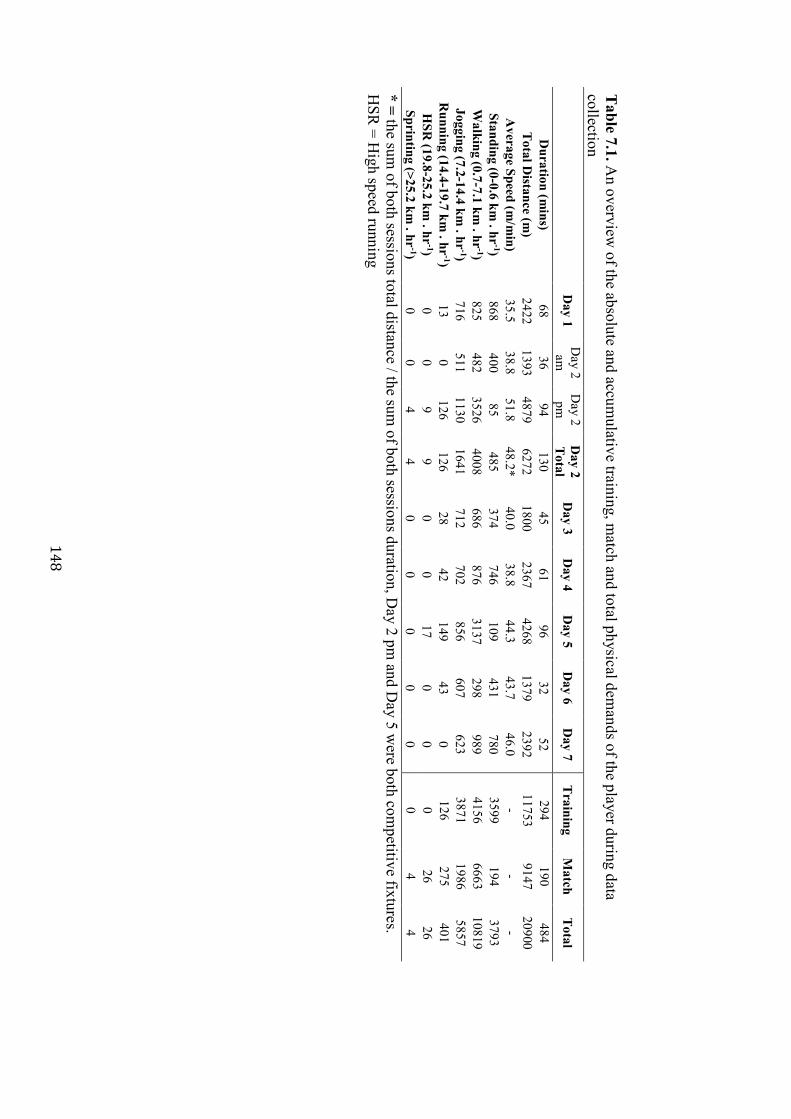
148
Table 7.1. A
n overview of the absolute and accum
ulative training, match and total physical dem
ands of the player during data collection
D
ay 1 D
ay 2 am
D
ay 2 pm
D
ay 2 T
otal D
ay 3 D
ay 4 D
ay 5 D
ay 6 D
ay 7 T
raining M
atch T
otal
Duration (m
ins) 68
36 94
130 45
61 96
32 52
294 190
484 T
otal Distance (m
) 2422
1393 4879
6272 1800
2367 4268
1379 2392
11753 9147
20900 A
verage Speed (m/m
in) 35.5
38.8 51.8
48.2* 40.0
38.8 44.3
43.7 46.0
- -
- Standing (0-0.6 km
. hr-1)
868 400
85 485
374 746
109 431
780 3599
194 3793
Walking (0.7-7.1 km
. hr-1)
825 482
3526 4008
686 876
3137 298
989 4156
6663 10819
Jogging (7.2-14.4 km . hr
-1) 716
511 1130
1641 712
702 856
607 623
3871 1986
5857 R
unning (14.4-19.7 km . hr
-1) 13
0 126
126 28
42 149
43 0
126 275
401 H
SR (19.8-25.2 km
. hr-1)
0 0
9 9
0 0
17 0
0 0
26 26
Sprinting (>25.2 km . hr
-1) 0
0 4
4 0
0 0
0 0
0 4
4 * = the sum
of both sessions total distance / the sum of both sessions duration, D
ay 2 pm and D
ay 5 were both com
petitive fixtures. H
SR = H
igh speed running
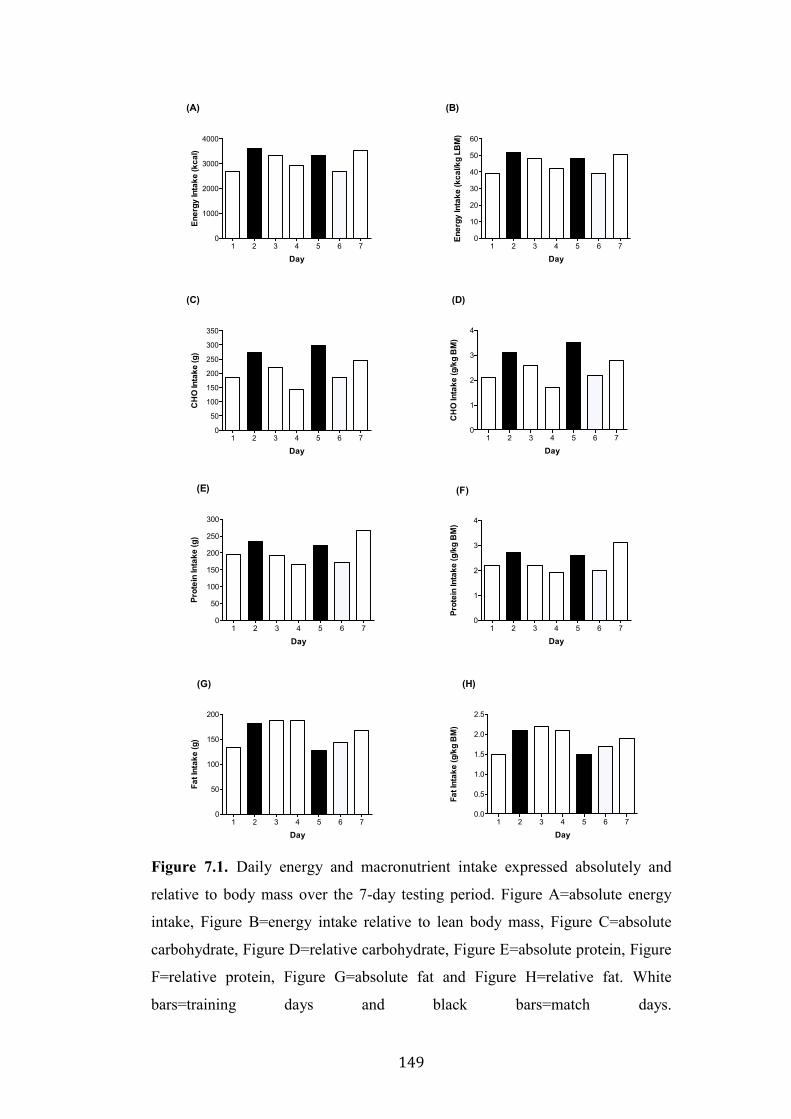
149
Figure 7.1. Daily energy and macronutrient intake expressed absolutely and
relative to body mass over the 7-day testing period. Figure A=absolute energy
intake, Figure B=energy intake relative to lean body mass, Figure C=absolute
carbohydrate, Figure D=relative carbohydrate, Figure E=absolute protein, Figure
F=relative protein, Figure G=absolute fat and Figure H=relative fat. White
bars=training days and black bars=match days.
1 2 3 4 5 6 70
1000
2000
3000
4000
Day
Ener
gy In
take
(kca
l)
(A)
1 2 3 4 5 6 70
50
100
150
200
250
300
350
Day
CH
O In
take
(g)
(C)
1 2 3 4 5 6 70
1
2
3
4
Day
Prot
ein
Inta
ke (g
/kg
BM
)
(F)
1 2 3 4 5 6 70
10
20
30
40
50
60
Day
Ener
gy In
take
(kca
l/kg
LBM
)
(B)
1 2 3 4 5 6 70.0
0.5
1.0
1.5
2.0
2.5
Day
Fat I
ntak
e (g
/kg
BM
)
(H)
1 2 3 4 5 6 70
1
2
3
4
DayC
HO
Inta
ke (g
/kg
BM
)
(D)
1 2 3 4 5 6 70
50
100
150
200
250
300
Day
Prot
ein
Inta
ke (g
)
(E)
1 2 3 4 5 6 70
50
100
150
200
Day
Fat I
ntak
e (g
)
(G)
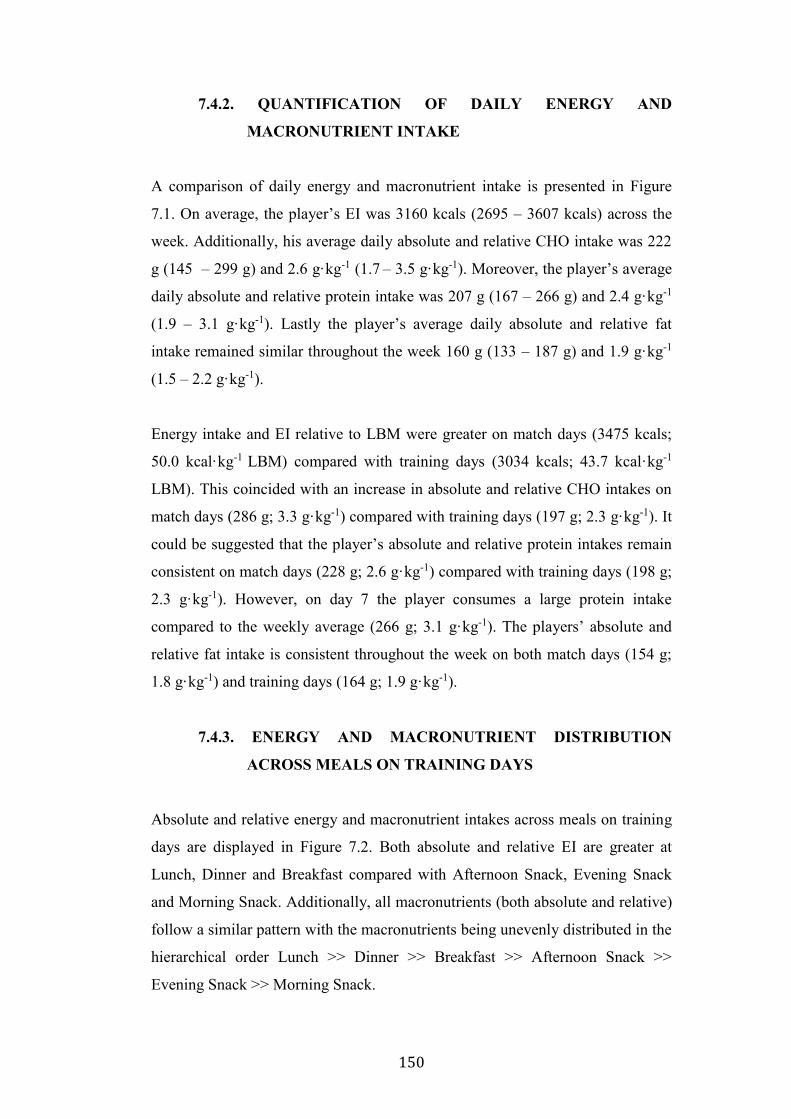
150
7.4.2. QUANTIFICATION OF DAILY ENERGY AND
MACRONUTRIENT INTAKE
A comparison of daily energy and macronutrient intake is presented in Figure
7.1. On average, the player’s EI was 3160 kcals (2695 – 3607 kcals) across the
week. Additionally, his average daily absolute and relative CHO intake was 222
g (145 – 299 g) and 2.6 g·kg-1 (1.7 – 3.5 g·kg-1). Moreover, the player’s average
daily absolute and relative protein intake was 207 g (167 – 266 g) and 2.4 g·kg-1
(1.9 – 3.1 g·kg-1). Lastly the player’s average daily absolute and relative fat
intake remained similar throughout the week 160 g (133 – 187 g) and 1.9 g·kg-1
(1.5 – 2.2 g·kg-1).
Energy intake and EI relative to LBM were greater on match days (3475 kcals;
50.0 kcal·kg-1 LBM) compared with training days (3034 kcals; 43.7 kcal·kg-1
LBM). This coincided with an increase in absolute and relative CHO intakes on
match days (286 g; 3.3 g·kg-1) compared with training days (197 g; 2.3 g·kg-1). It
could be suggested that the player’s absolute and relative protein intakes remain
consistent on match days (228 g; 2.6 g·kg-1) compared with training days (198 g;
2.3 g·kg-1). However, on day 7 the player consumes a large protein intake
compared to the weekly average (266 g; 3.1 g·kg-1). The players’ absolute and
relative fat intake is consistent throughout the week on both match days (154 g;
1.8 g·kg-1) and training days (164 g; 1.9 g·kg-1).
7.4.3. ENERGY AND MACRONUTRIENT DISTRIBUTION
ACROSS MEALS ON TRAINING DAYS
Absolute and relative energy and macronutrient intakes across meals on training
days are displayed in Figure 7.2. Both absolute and relative EI are greater at
Lunch, Dinner and Breakfast compared with Afternoon Snack, Evening Snack
and Morning Snack. Additionally, all macronutrients (both absolute and relative)
follow a similar pattern with the macronutrients being unevenly distributed in the
hierarchical order Lunch >> Dinner >> Breakfast >> Afternoon Snack >>
Evening Snack >> Morning Snack.
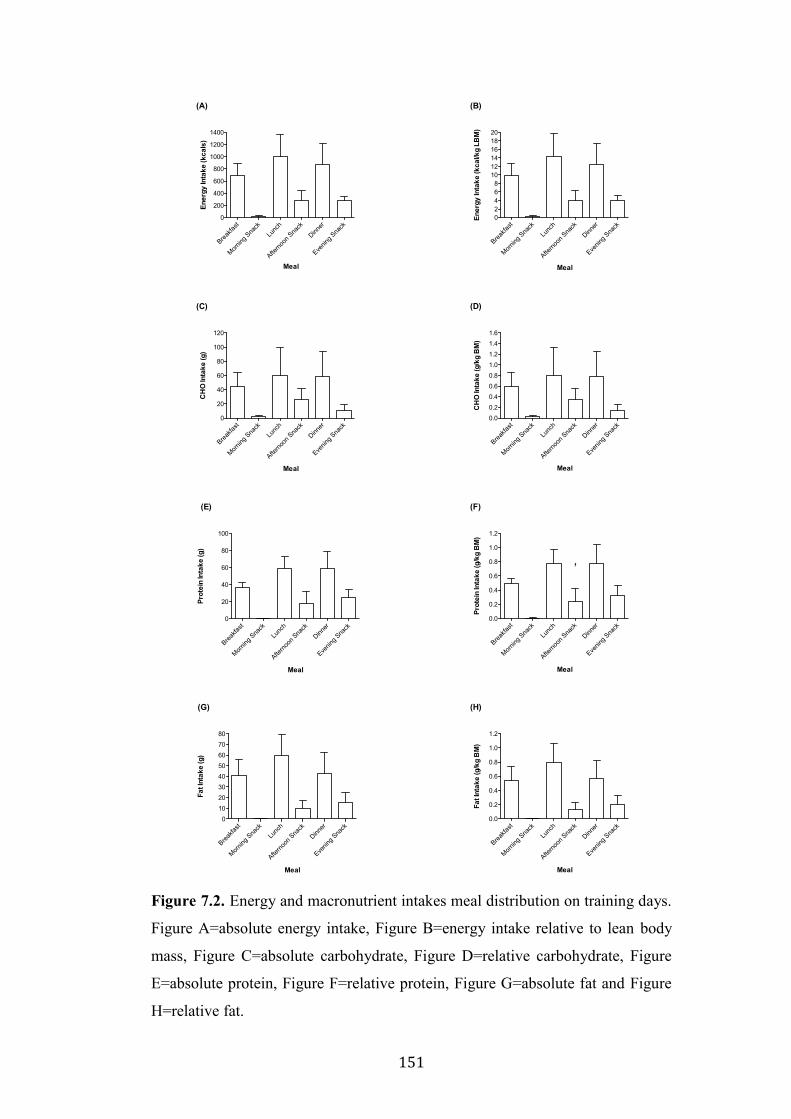
151
Figure 7.2. Energy and macronutrient intakes meal distribution on training days.
Figure A=absolute energy intake, Figure B=energy intake relative to lean body
mass, Figure C=absolute carbohydrate, Figure D=relative carbohydrate, Figure
E=absolute protein, Figure F=relative protein, Figure G=absolute fat and Figure
H=relative fat.
Breakfa
st
Morning
Sna
ckLu
nch
Afterno
on S
nack
Dinner
Evenin
g Sna
ck0
200
400
600
800
1000
1200
1400
Meal
Ener
gy In
take
(kca
ls)
(A)
Breakfa
st
Morning
Sna
ckLu
nch
Afterno
on S
nack
Dinner
Evenin
g Sna
ck0
20
40
60
80
100
120
Meal
CH
O In
take
(g)
(C)
Breakfa
st
Morning
Sna
ckLu
nch
Afterno
on Sna
ck
Dinner
Evenin
g Sna
ck0
20
40
60
80
100
Meal
Prot
ein
Inta
ke (g
)
(E)
Breakfa
st
Morning
Snack
Lunc
h
Afterno
on Sna
ck
Dinner
Evenin
g Sna
ck0
1020304050607080
Meal
Fat I
ntak
e (g
)
(G)
Breakfa
st
Morning
Sna
ckLu
nch
Afterno
on S
nack
Dinner
Evenin
g Sna
ck02468
101214161820
Meal
Ener
gy In
take
(kca
l/kg
LBM
)
(B)
Breakfa
st
Morning
Snack
Lunc
h
Afterno
on Sna
ck
Dinner
Evenin
g Sna
ck0.00.20.40.60.81.01.21.41.6
MealC
HO
Inta
ke (g
/kg
BM
)
(D)
Breakfa
st
Morning
Snack
Lunc
h
Afterno
on Sna
ck
Dinner
Evenin
g Sna
ck0.0
0.2
0.4
0.6
0.8
1.0
1.2
Meal
Prot
ein
Inta
ke (g
/kg
BM
)
(F)
f
Breakfa
st
Morning
Sna
ckLu
nch
Afterno
on S
nack
Dinner
Evenin
g Sna
ck0.0
0.2
0.4
0.6
0.8
1.0
1.2
Meal
Fat I
ntak
e (g
/kg
BM
)
(H)
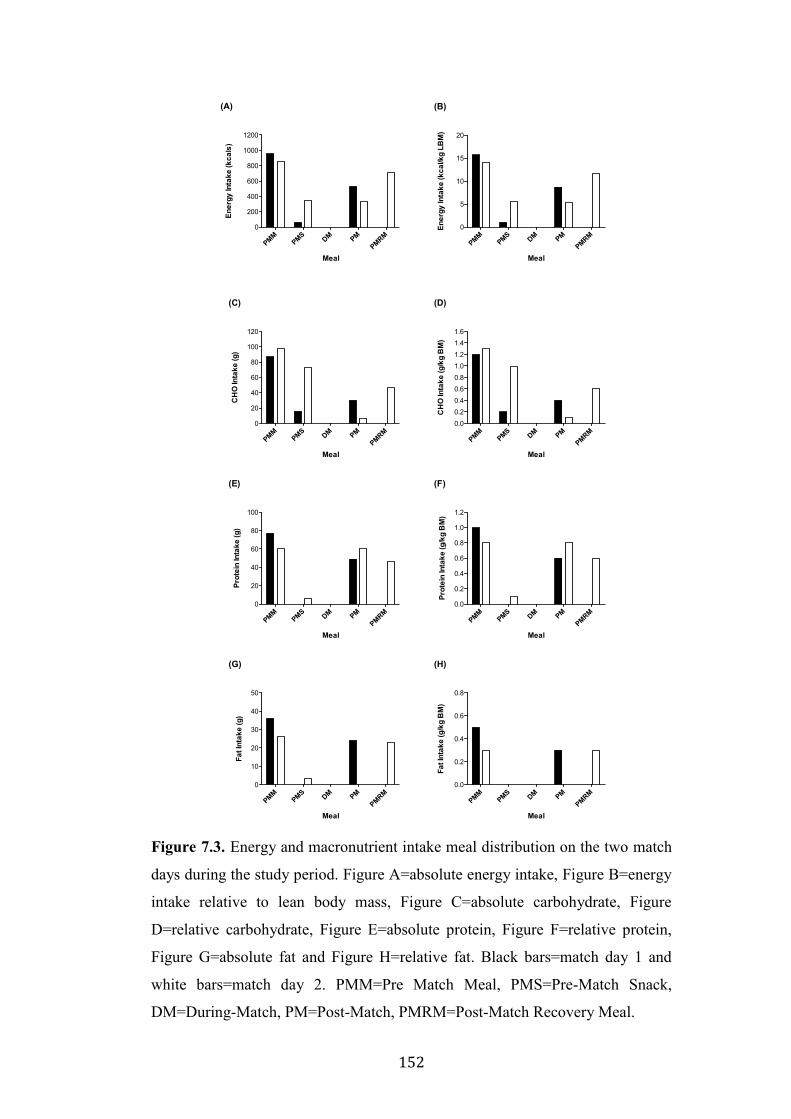
152
Figure 7.3. Energy and macronutrient intake meal distribution on the two match
days during the study period. Figure A=absolute energy intake, Figure B=energy
intake relative to lean body mass, Figure C=absolute carbohydrate, Figure
D=relative carbohydrate, Figure E=absolute protein, Figure F=relative protein,
Figure G=absolute fat and Figure H=relative fat. Black bars=match day 1 and
white bars=match day 2. PMM=Pre Match Meal, PMS=Pre-Match Snack,
DM=During-Match, PM=Post-Match, PMRM=Post-Match Recovery Meal.
PMMPMS DM PM
PMRM0
200
400
600
800
1000
1200
Meal
Ener
gy In
take
(kca
ls)
(A)
PMMPMS DM PM
PMRM0
20
40
60
80
100
120
Meal
CH
O In
take
(g)
(C)
PMMPMS DM PM
PMRM0
20
40
60
80
100
Meal
Prot
ein
Inta
ke (g
)
(E)
PMMPMS DM PM
PMRM0
10
20
30
40
50
Meal
Fat I
ntak
e (g
)
(G)
PMMPMS DM PM
PMRM0
5
10
15
20
Meal
Ener
gy In
take
(kca
l/kg
LBM
)
(B)
PMMPMS DM PM
PMRM0.00.20.40.60.81.01.21.41.6
Meal
CH
O In
take
(g/k
g B
M)
(D)
PMMPMS DM PM
PMRM0.0
0.2
0.4
0.6
0.8
1.0
1.2
Meal
Prot
ein
Inta
ke (g
/kg
BM
)
(F)
PMMPMS DM PM
PMRM0.0
0.2
0.4
0.6
0.8
Meal
Fat I
ntak
e (g
/kg
BM
)
(H)
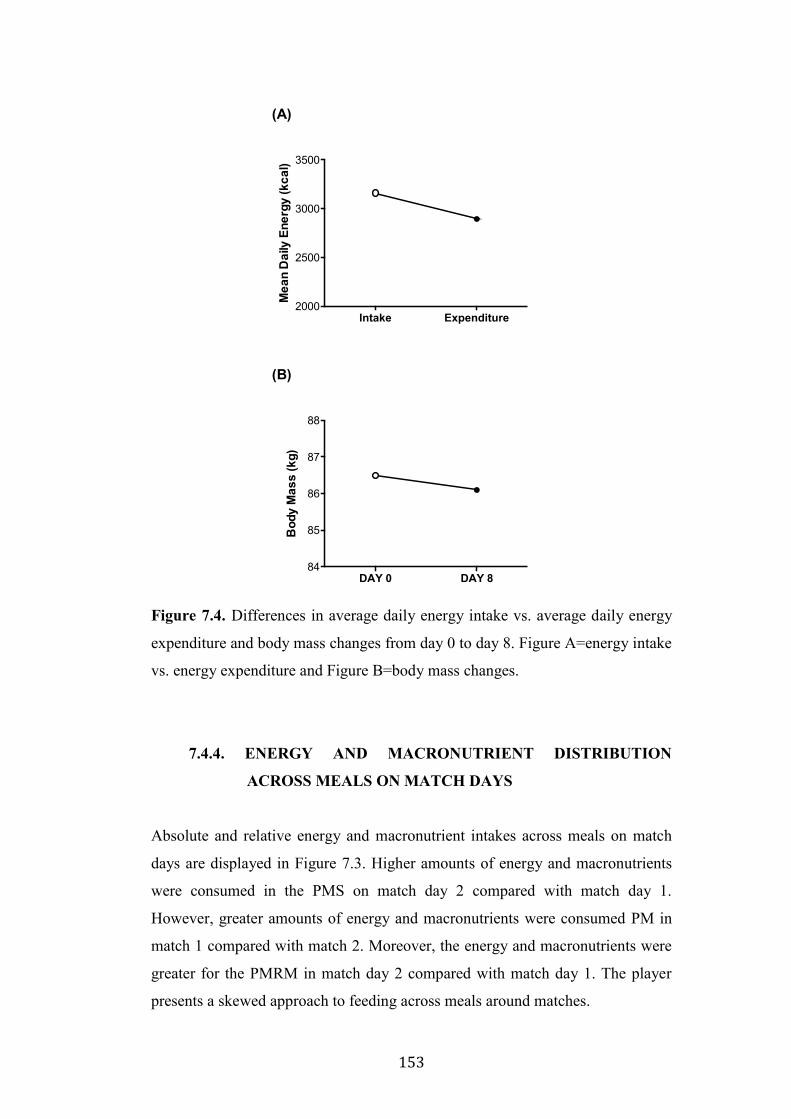
153
Figure 7.4. Differences in average daily energy intake vs. average daily energy
expenditure and body mass changes from day 0 to day 8. Figure A=energy intake
vs. energy expenditure and Figure B=body mass changes.
7.4.4. ENERGY AND MACRONUTRIENT DISTRIBUTION
ACROSS MEALS ON MATCH DAYS
Absolute and relative energy and macronutrient intakes across meals on match
days are displayed in Figure 7.3. Higher amounts of energy and macronutrients
were consumed in the PMS on match day 2 compared with match day 1.
However, greater amounts of energy and macronutrients were consumed PM in
match 1 compared with match 2. Moreover, the energy and macronutrients were
greater for the PMRM in match day 2 compared with match day 1. The player
presents a skewed approach to feeding across meals around matches.
DAY 0 DAY 884
85
86
87
88
Bod
y M
ass
(kg)
(B)
Intake Expenditure2000
2500
3000
3500
Mea
n D
aily
Ene
rgy
(kca
l)
(A)
154
7.4.5. CARBOHYDRATES DURING TRAINING AND GAMES
Throughout the duration of this study the player only consumed bottled water
during training and matches.
7.4.6. ENERGY EXPENDITURE VS. ENERGY INTAKE
The average daily EI and EE along with any subsequent body mass changes over
the examination period are shown in Figure 7.4. On average, the player was
consuming 3160 kcals and expending 2894 kcals, giving an average daily surplus
of 266 kcals. Over the weekly micro-cycle the player subsequently lost -0.4 kg in
body mass.
7.5. DISCUSION
The aim of the present study was to simultaneously quantify EI, EE, training and
match load across a 7-day in-season period for an English Premier League GK.
In order to study a weekly playing schedule representative of an elite GK, a
player who was competing in a micro-cycle consisting of two match days and 5
training days were studied. This is the first to report direct measurements of EE
(using the DLW method) in an elite English Premier League GK. In relation to
the specific GK studied, our data suggest that he: 1) slightly exceeds energy
demands when assessed using the current dietary method, 2) practices elements
of CHO periodisation such that CHO intake is greater on match days compared
with training days, 3) tends to under-consume CHO on match days in relation to
the pre-match meal and post-match recovery and 4) adopts a skewed approach to
feeding such that absolute EI, CHO and protein intake are consumed in a
hierarchical manner of lunch>dinner>breakfast>snacks.
For the first time, key parameters of physical loading are reported here for GKs
during training and are remarkably similar to loads produced from the same
team’s outfield players (TD=2422 m vs. 2865 m; HID=0 m vs. 32 m) during the
same competitive week (Anderson et al., 2017; Chapter 6). However, the training
loads for outfield players when two matches are played over a weekly micro-
155
cycle are typically focused around physical recovery and preparation for the next
competitive match (Anderson et al., 2015; Chapter 4). As such, further research
is required to examine GKs typical weekly training loads over a one-game per
week schedule and compare against outfield players. In addition to training,
match load is less than reported previously (TD= 4879m vs. 5611m; HID=13 vs.
56 m) (Di Salvo et al., 2008; Bradley et al., 2010) and to other outfield positions
(Anderson et al., 2015; Anderson et al., 2017; Chapters 4 and 6). Therefore, the
accumulative weekly load is considerably less than reported in outfield players.
Indeed, it is extremely useful to understand the movement demands of GKs and
these data give a valuable insight into the training and accumulatively weekly
demands, allowing a more detailed understanding of the energy requirements
during training and matches. However, the demands of GKs are assessed mainly
on their ability to perform high-intensity movements and explosive actions (such
as jumps and dives) using quick reaction speed, which often increases the load
and increases the players perceived exertion (Ziv & Lidor, 2011). Until
validation work is published on recent developments in GPS units regarding GK
specific actions, the research is limited to the movement demands only.
The mean daily EI and EE data reported here suggest that an elite GK is
generally capable of matching overall weekly energy requirement. It is notable,
however, that the player experienced a -0.4 kg loss in body mass over the study
period despite over consuming on average 266 kcals per day (1862 kcals over the
week). The mean daily EE (2894 kcals) was considerably less than that observed
in outfield players using this method previously (3566 kcals), although EI was
similar here (3160 kcals) compared to outfield players (3186 kcals) (Anderson et
al., 2017; Chapter 6).
A limitation of the DLW technique is the inability to provide day-to-day EE
assessments hence data are expressed as mean EE for the 7-day data collection
period. Nevertheless, the GK studied here appears to adopt elements of CHO
periodisation in accordance with match play and training demands. For example,
both absolute and relative daily energy and CHO intake was greater on match
days (3475 kcal and 3.3 g.kg-1, respectively) compared with training days (3034
kcal and 2.3 g.kg-1, respectively). Such differences in daily EI also agree with
156
recent observation from adult professional outfield players of the Dutch league
(Bettonviel et al., 2016) where subtle differences were observed between match
days, training days and rest days (3343 ± 909, 3216 ± 834 and 2662 ± 680 kcal,
respectively). It is also noteworthy that a greater energy, CHO and protein intake
on day 7 (prior to another match undertaken on day 8) versus days 1 and 4 (prior
to match day 1 and 2) were observed. Such differences may reflect additional
high CHO and high protein foods that are made available and consumed prior to
and during travelling (i.e. snacks provided on the bus) to the away game on day
8. This trend is similar to that observed in the outfield positions during this
competitive week (Anderson et al., 2017; Chapter 6).
Although it is not currently known, it is unlikely that GK need to consume CHO
in quantities similar to outfield players in order to optimise muscle glycogen
storage in the day prior and in recovery from games (Krustrup et al., 2006;
Bassau et al., 2002). However, in the present study, CHO intakes that would be
considered sub-optimal in relation to maximizing any worthy muscle glycogen
re-synthesis were observed (Jentjens & Jeukendrup, 2003). Indeed, whilst it is
likely that the GKs would still require 1.2 g.kg-1 body mass in the immediate
hour after match play, reported intakes of < 0.4 g.kg-1 in the immediate period
after match day 1 (i.e. the night-time kick off) were observed. Such post-game
intakes coupled with the relatively low absolute daily CHO intakes (i.e. 2.3 g.kg-
1) on the subsequent day would likely ensure that the player is competing with
low muscle glycogen. It is noteworthy, however, that the high absolute protein
intakes consumed in the post-match period (i.e. >50 g) would likely potentiate
rates of muscle glycogen re-synthesis when consumed in the presence of sub-
optimal CHO availability (Van Loon et al., 2000).
In relation to match day itself, it could also be suggested that the player did not
meet current CHO guidelines for which to optimise aspects of physical (Burke et
al., 2011), technical (Ali & Williams, 2009; Russell & Kingsley, 2014) and
cognitive (Welsh et al., 2002) performance. Although Anderson et al. (2017;
Chapter 6) observed there were positional differences in CHO fuelling strategies
during games, with midfield players’ intakes being highest and reflective of their
physical load, the GK consumed only bottled water and caffeine to increase
157
cognitive performance during match play (Foskett et al., 2009). It could be
suggested that in order to maintain plasma glucose during matches, elite level
GK should consume CHO based supplements.
In addition to the GK undergoing CHO periodisation throughout the weekly
micro-cycle, he also tends to consume higher protein on match days (228 g)
compared with training days (198 g). Moreover, fat intakes ranged from 127 to
187 g but displayed no evident of periodisation. Interestingly, these protein
intakes were higher than British professional outfield players (108 ± 26 g),
whereas average fat were similar (118 ± 24 g), respectively (Maughan, 1997).
These protein intakes are similar to that observed in outfield players (205 ± 30 g)
and also with those reported recently (150-200 g) in adult professional players
from the Dutch League (Bettonviel et al., 2016). These differences have possibly
derived from increased scientific research and a greater player awareness of the
importance of protein in facilitating training adaptations and recovery from both
aerobic and strength training (Moore et al., 2014; McNaughton et al., 2016).
Recent data suggests that not only the total daily intake of protein, but the timing
and even distribution of protein doses may have more influential role in
modulating muscle protein synthesis rates in responses to both feeding alone
(Mamerow et al., 2014) and post-exercise feeding (Areta et al., 2013). In the
present study it was observed that this GK undertakes a skewed pattern of daily
protein intake in that absolute protein was consumed in a hierarchical order
where lunch>dinner>breakfast>snacks. This finding also agrees with our
previous observations on the protein feeding patterns of elite outfield players
(Anderson et al., 2017; Chapter 6) and elite youth soccer players (Naughton et
al., 2016) as well as adult players from the Dutch league (Bettonviel et al., 2016)
and a mixed sex cohort of Dutch athletes (Gillen et al., 2016). Based on recent
data suggesting that trained athletes (especially those with higher lean mass) may
require protein doses of approximately 40 g (McNaughton et al., 2016) as well as
the importance of protein feeding prior to sleep (Res et al., 2012), our data
suggest that breakfast and morning, afternoon and bedtime snacks are key times
to improve for the present sample. However, protein requirements (both in
absolute dosing and timing) should be tailored to the specific population in
158
question in accordance with timing of training sessions, training load and
moreover, individualised training goals.
7.6. CONCLUSION
In summary, this study simultaneously quantified for the first time the daily
physical loading, EI and EE during a weekly micro-cycle of an elite level soccer
GK from the English Premier League. Although he appears capable of matching
daily energy requirements to EI, he practices elements of CHO periodisation in
that he consumes higher amounts of CHO on match days versus training days.
Moreover, his CHO intakes before, during and after matches are below that what
is currently recommended for soccer players, albeit outfield players.
Additionally, whilst daily protein intake was high throughout the week and
higher to that reported previously, it was consumed such that lunch > dinner >
breakfast > snacks. These data suggest that this professional GK may benefit
from consuming greater amounts of CHO around the proximity of matches as to
optimise performance and recovery. Furthermore, attention should be given to
the even distribution of daily protein intake so as to potentially promote
components of training adaptations.
159
CHAPTER 8
CASE STUDY: ENERGY INTAKE AND
ENERGY EXPENDITURE IN A PREMIER
LEAGUE SOCER PLAYER DURING
REHABILITATION FROM ACL INJURY
Having now quantified the physical loading, energy expenditure and energy
intakes of fully fit players (both outfield players and the GK), the aim of this
chapter was to examine the energy expenditure and current energy intakes of a
soccer player from the English Premier League who was recovering from an
anterior cruciate ligament reconstruction.
160
8.1. ABSTRACT
Major injury in professional soccer imposes lengthy periods of immobilization
and rehabilitation which present major challenges in maintaining muscle mass
and function. There is an obvious nutritional challenge to the practitioner to
attempt to prevent muscle atrophy due to lack of information on players daily EE
and whether that is being matched by daily EI. A 10-month case study with a
specific focus on week 6 to quantify EE and EI for a professional soccer player
of the English Premier League is presented. Over a 10-month period, this case
study characterised rates of muscle atrophy and hypertrophy (as assessed by
DXA) during a rehabilitation after an anterior cruciate ligament (ACL) injury. In
week 6, a specific focus was made on the EE (as assessed by DLW) and EI.
Throughout weeks 1-6 the athlete was advised to adhere to a low CHO-high
protein diet (2-3 g.kg-1). In weeks 1-6, total body mass decreased by 1.9 kg,
attributable to a 0.6 and 1.2 kg loss in lean and fat mass, respectively. For week 6
the athlete expended 3178 kcals and consumed 2765 kcals on average daily
across the 7-day period. In weeks 5-38 the athlete was advised to adhere to a
moderate CHO-high protein diet (3-5 g.kg-1). Throughout this period, the athlete
increased his total body mass by 3.9 kg, attributable to a 2.9 and 0.7 kg increase
in lean and fat mass, respectively. The athlete successfully completed his
rehabilitation and resumed training and matches at first team competitive level
with an improved anthropometric and physical profile.
Key Words: carbohydrate, protein, injury, rehabilitation
161
8.2. INTRODUCTION
Anterior cruciate ligament injuries are common and potentially serious injuries in
soccer that often require surgical reconstruction (Brophy et al., 2012). After ACL
reconstruction, an athlete’s return to play time is between 4 and 9 months
(Zaffagnini et al., 2014), thus presenting a long rehabilitation period consisting
of a gradual transition through different phases. For example, the initial post-
operation recovery phase (i.e. where the athlete is to gain normal symmetrical
gait), the progressive loading phase (i.e. where the athlete builds loading in order
to commence running), the unilateral load phase (i.e. where the athlete completes
outdoor pitch rehabilitation focusing on running mechanics) and the football
specific phase (i.e. where the athlete begins to re-integrate into training and
match play).
Such phases are likely to be subject to different nutritional requirements. In the
initial post operation recovery phase, the athlete is only partly mobile or
sometimes completely immobile at the joint (Grant, 2013). This severely restricts
the use of the muscle group in the lower limbs and results in a period of muscle
disuse. Under such conditions, there is a progressive loss of LBM (Wall et al.,
2013), a decline in functional strength (White et al., 1984), a reduction in (local)
metabolic rate (Haruna et al., 1994), a decline in insulin sensitivity and increased
local fat deposition (Richter et al., 1989).
In a previous case study by our group, it was reported that the rehabilitation of an
English Premier League soccer player recovering from ACL surgery and
reported a loss of 5.8 kg and 0.8 kg gain in muscle and fat mass in the first 8
weeks of injury, respectively (Milsom et al., 2014). Throughout this period,
practitioners commented that it was difficult to provide nutritional
recommendations due to lack of knowledge on the athletes daily EE. In order to
provide more accurate recommendations for EI, knowledge of the daily EE for a
period in the first 8 weeks of rehabilitation from ACL reconstruction would be
beneficial to the sports nutritionist.
162
With this in mind, the aims of this case study were to quantify EE and EI in a
player who was undergoing a period of rehabilitation from an ACL injury. To
this end average daily EE and daily energy and macronutrient intake were
quantified using the DLW and self-reported food diaries (supported by the
RFPM and 24 h diet recalls), respectively.
8.3. METHODS
8.3.1. OVERVIEW OF THE PLAYER, INJURY AND SURGERY
The player is a 23-year old male professional soccer player who is internationally
capped and currently competing in the English Premier League. At the time of
injury, the athlete’s physical characteristics were as follows: age, 23 years old;
body mass, 77 kg; height 179 cm. The athlete had been a full-time professional
player since age 18 and had therefore been engaged in daily structured soccer-
specific training for 5 years. He has previously had 2 lateral meniscus tears (both
knees) with the current injured knee and the un-injured knee being 4 and 3 years
prior to this current injury, respectively. The athlete’s muscle injuries were
limited to 1 right hamstring tear 1 year prior to injury and at the time of injury
the athlete was engaged in daily field-based soccer-specific training, 3 resistance
training session per week (1 focusing on lower limbs and 2 focusing on upper
limbs) and one-two competitive games per week. The athlete had a training
history of 2 resistance sessions per week (both primarily focusing on the lower
limbs) for ~7 years.
The athlete presented with a total rupture of the ACL ligament in his left knee.
The injury occurred during a landing motion in a first team training session.
After injury and before the study commenced the player underwent a whole body
fan beam DXA measurement scan using the methods outlined in section 3.3.
This scan was performed routinely throughout the rehabilitation on weeks 6, 12,
18, 28 and 38 following surgery. Surgery was performed 6 days after injury
occurrence and involved surgical ligament repair using a patella tendon graft to
replace the damaged ACL. He wasn’t immobilised at any point during the
rehabilitation although he spent 6 days post operation non-weight bearing.
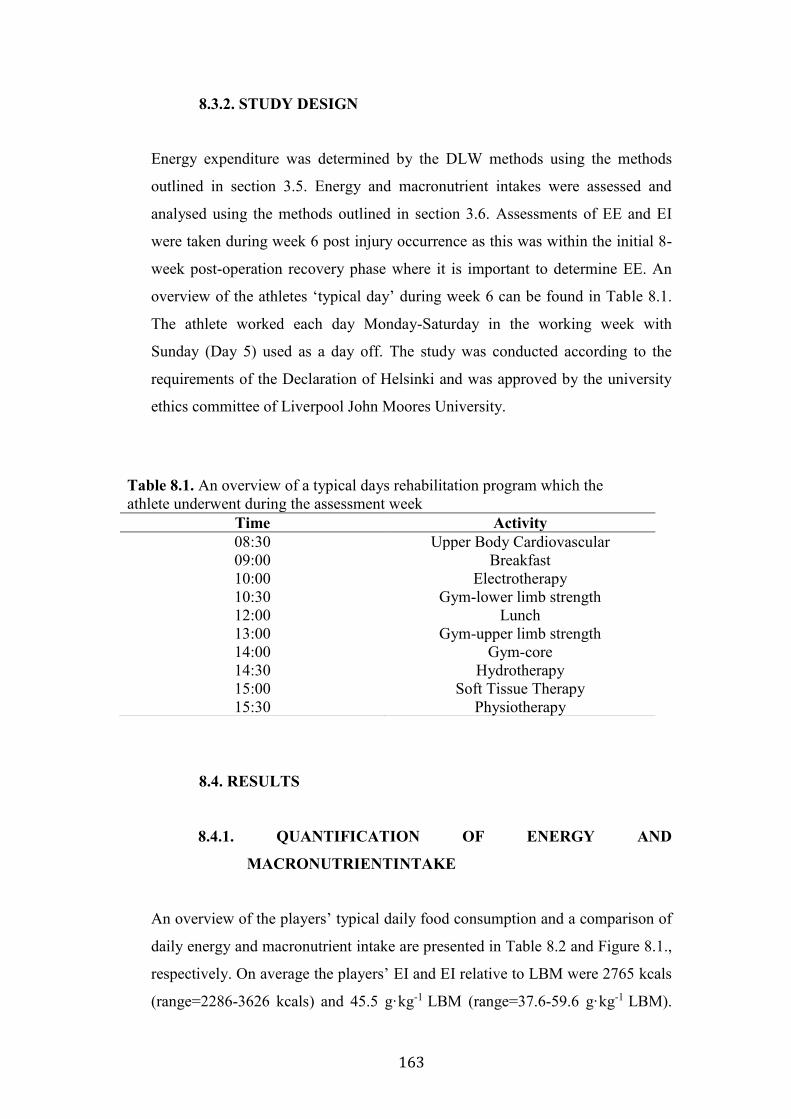
163
8.3.2. STUDY DESIGN
Energy expenditure was determined by the DLW methods using the methods
outlined in section 3.5. Energy and macronutrient intakes were assessed and
analysed using the methods outlined in section 3.6. Assessments of EE and EI
were taken during week 6 post injury occurrence as this was within the initial 8-
week post-operation recovery phase where it is important to determine EE. An
overview of the athletes ‘typical day’ during week 6 can be found in Table 8.1.
The athlete worked each day Monday-Saturday in the working week with
Sunday (Day 5) used as a day off. The study was conducted according to the
requirements of the Declaration of Helsinki and was approved by the university
ethics committee of Liverpool John Moores University.
8.4. RESULTS
8.4.1. QUANTIFICATION OF ENERGY AND
MACRONUTRIENTINTAKE
An overview of the players’ typical daily food consumption and a comparison of
daily energy and macronutrient intake are presented in Table 8.2 and Figure 8.1.,
respectively. On average the players’ EI and EI relative to LBM were 2765 kcals
(range=2286-3626 kcals) and 45.5 g·kg-1 LBM (range=37.6-59.6 g·kg-1 LBM).
Table 8.1. An overview of a typical days rehabilitation program which the athlete underwent during the assessment week
Time Activity 08:30 Upper Body Cardiovascular 09:00 Breakfast 10:00 Electrotherapy 10:30 Gym-lower limb strength 12:00 Lunch 13:00 Gym-upper limb strength 14:00 Gym-core 14:30 Hydrotherapy 15:00 Soft Tissue Therapy 15:30 Physiotherapy
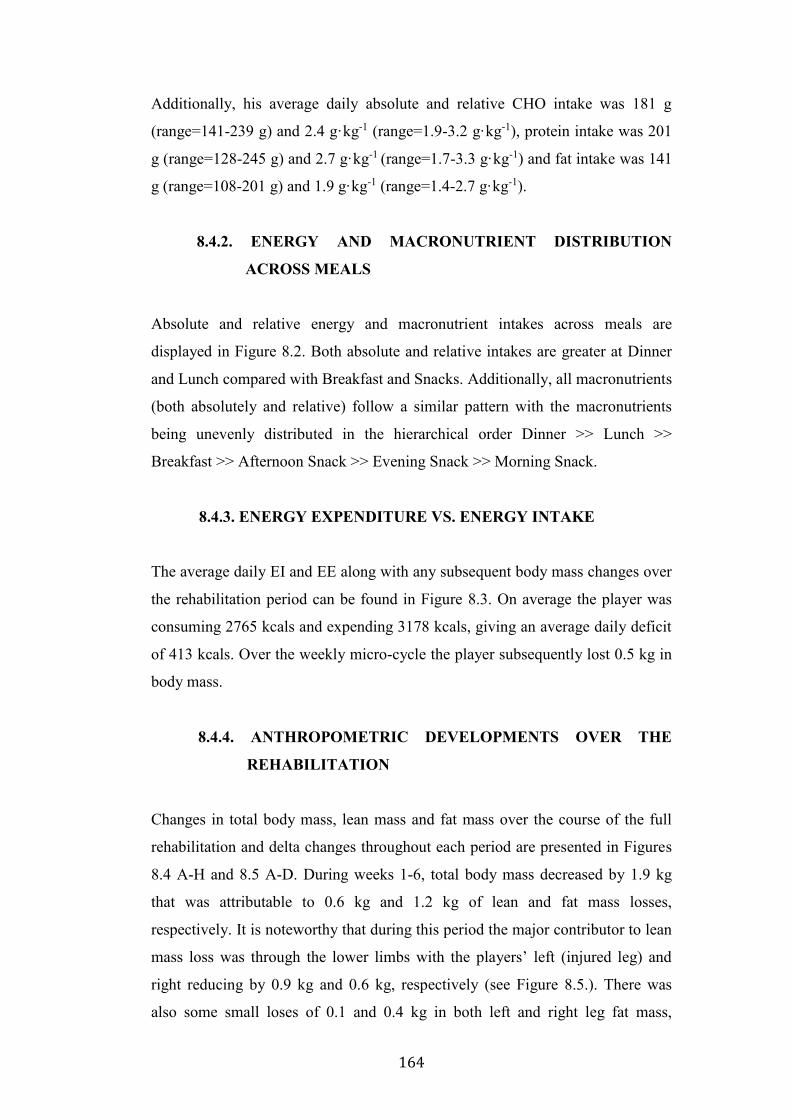
164
Additionally, his average daily absolute and relative CHO intake was 181 g
(range=141-239 g) and 2.4 g·kg-1 (range=1.9-3.2 g·kg-1), protein intake was 201
g (range=128-245 g) and 2.7 g·kg-1 (range=1.7-3.3 g·kg-1) and fat intake was 141
g (range=108-201 g) and 1.9 g·kg-1 (range=1.4-2.7 g·kg-1).
8.4.2. ENERGY AND MACRONUTRIENT DISTRIBUTION
ACROSS MEALS
Absolute and relative energy and macronutrient intakes across meals are
displayed in Figure 8.2. Both absolute and relative intakes are greater at Dinner
and Lunch compared with Breakfast and Snacks. Additionally, all macronutrients
(both absolutely and relative) follow a similar pattern with the macronutrients
being unevenly distributed in the hierarchical order Dinner >> Lunch >>
Breakfast >> Afternoon Snack >> Evening Snack >> Morning Snack.
8.4.3. ENERGY EXPENDITURE VS. ENERGY INTAKE
The average daily EI and EE along with any subsequent body mass changes over
the rehabilitation period can be found in Figure 8.3. On average the player was
consuming 2765 kcals and expending 3178 kcals, giving an average daily deficit
of 413 kcals. Over the weekly micro-cycle the player subsequently lost 0.5 kg in
body mass.
8.4.4. ANTHROPOMETRIC DEVELOPMENTS OVER THE
REHABILITATION
Changes in total body mass, lean mass and fat mass over the course of the full
rehabilitation and delta changes throughout each period are presented in Figures
8.4 A-H and 8.5 A-D. During weeks 1-6, total body mass decreased by 1.9 kg
that was attributable to 0.6 kg and 1.2 kg of lean and fat mass losses,
respectively. It is noteworthy that during this period the major contributor to lean
mass loss was through the lower limbs with the players’ left (injured leg) and
right reducing by 0.9 kg and 0.6 kg, respectively (see Figure 8.5.). There was
also some small loses of 0.1 and 0.4 kg in both left and right leg fat mass,
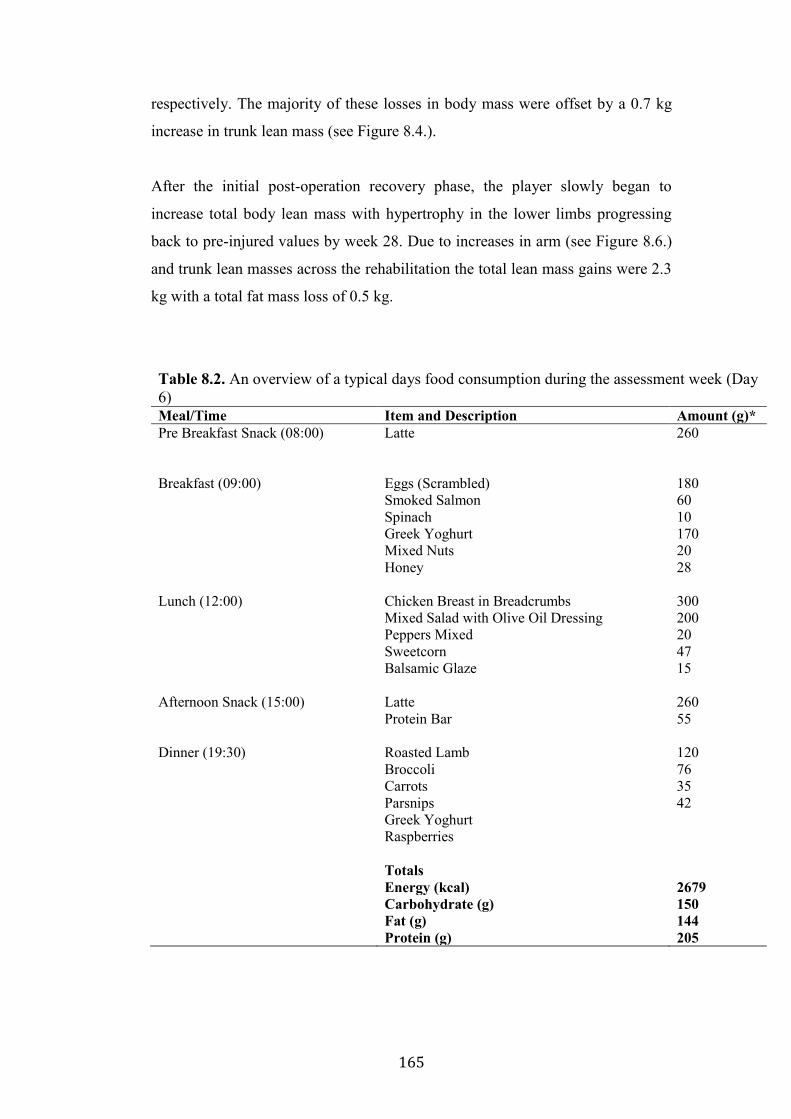
165
respectively. The majority of these losses in body mass were offset by a 0.7 kg
increase in trunk lean mass (see Figure 8.4.).
After the initial post-operation recovery phase, the player slowly began to
increase total body lean mass with hypertrophy in the lower limbs progressing
back to pre-injured values by week 28. Due to increases in arm (see Figure 8.6.)
and trunk lean masses across the rehabilitation the total lean mass gains were 2.3
kg with a total fat mass loss of 0.5 kg.
Table 8.2. An overview of a typical days food consumption during the assessment week (Day 6) Meal/Time Item and Description Amount (g)* Pre Breakfast Snack (08:00) Latte 260 Breakfast (09:00) Eggs (Scrambled) 180 Smoked Salmon 60 Spinach 10 Greek Yoghurt 170 Mixed Nuts 20 Honey 28 Lunch (12:00) Chicken Breast in Breadcrumbs 300 Mixed Salad with Olive Oil Dressing 200 Peppers Mixed 20 Sweetcorn 47 Balsamic Glaze 15 Afternoon Snack (15:00) Latte 260 Protein Bar 55 Dinner (19:30) Roasted Lamb 120 Broccoli 76 Carrots 35 Parsnips 42 Greek Yoghurt Raspberries Totals Energy (kcal) 2679 Carbohydrate (g) 150 Fat (g) 144 Protein (g) 205
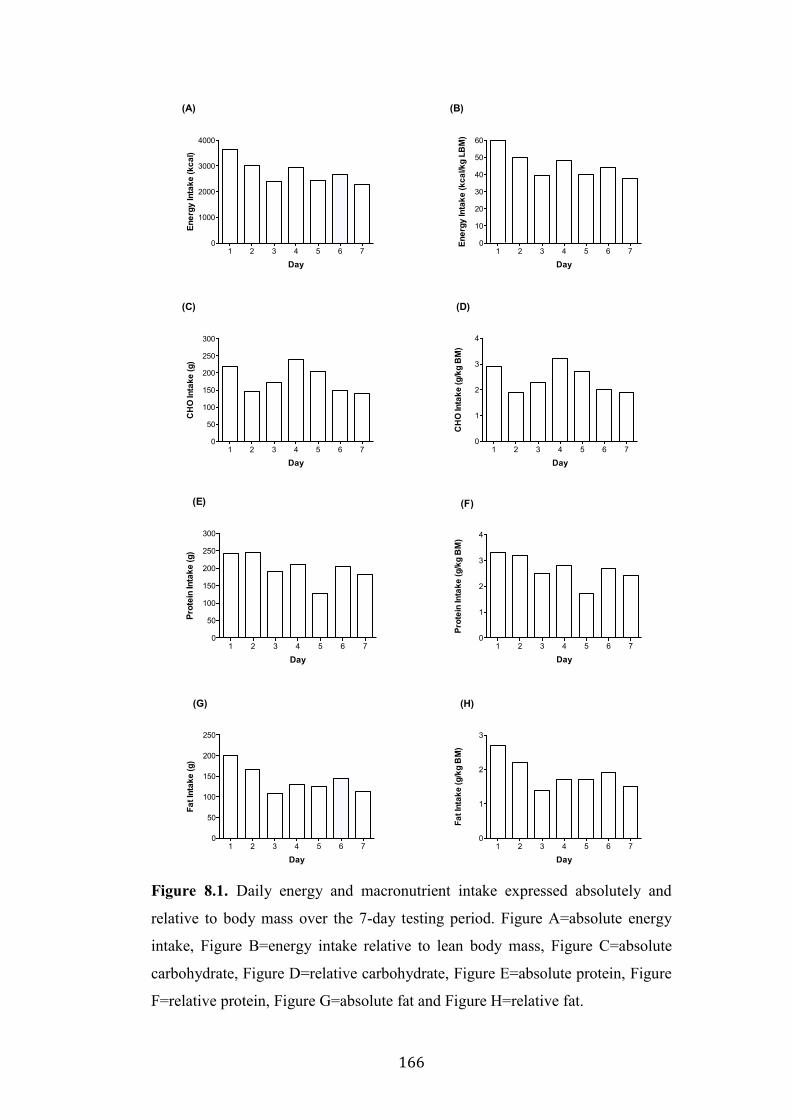
166
Figure 8.1. Daily energy and macronutrient intake expressed absolutely and
relative to body mass over the 7-day testing period. Figure A=absolute energy
intake, Figure B=energy intake relative to lean body mass, Figure C=absolute
carbohydrate, Figure D=relative carbohydrate, Figure E=absolute protein, Figure
F=relative protein, Figure G=absolute fat and Figure H=relative fat.
1 2 3 4 5 6 70
1000
2000
3000
4000
Day
Ener
gy In
take
(kca
l)
(A)
1 2 3 4 5 6 70
50
100
150
200
250
300
Day
CH
O In
take
(g)
(C)
1 2 3 4 5 6 70
1
2
3
4
Day
Prot
ein
Inta
ke (g
/kg
BM
)
(F)
1 2 3 4 5 6 70
10
20
30
40
50
60
Day
Ener
gy In
take
(kca
l/kg
LBM
)
(B)
1 2 3 4 5 6 70
1
2
3
Day
Fat I
ntak
e (g
/kg
BM
)
(H)
1 2 3 4 5 6 70
1
2
3
4
DayC
HO
Inta
ke (g
/kg
BM
)
(D)
1 2 3 4 5 6 70
50
100
150
200
250
300
Day
Prot
ein
Inta
ke (g
)
(E)
1 2 3 4 5 6 70
50
100
150
200
250
Day
Fat I
ntak
e (g
)
(G)
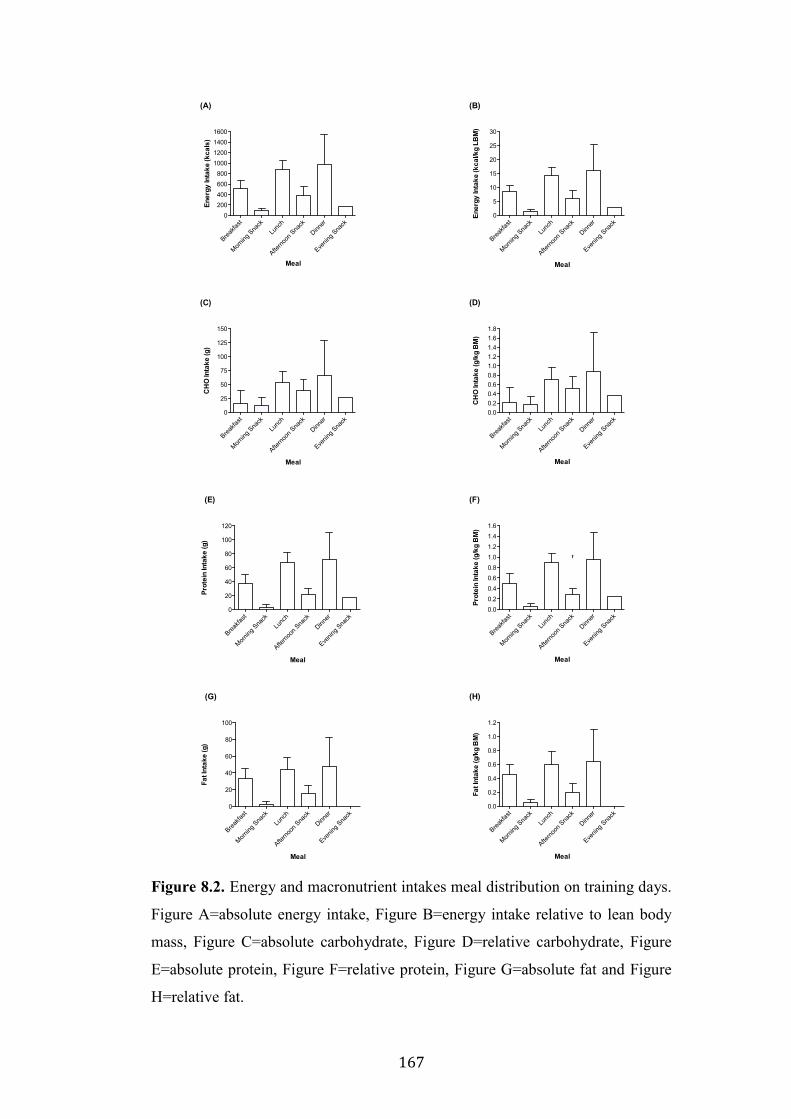
167
Figure 8.2. Energy and macronutrient intakes meal distribution on training days.
Figure A=absolute energy intake, Figure B=energy intake relative to lean body
mass, Figure C=absolute carbohydrate, Figure D=relative carbohydrate, Figure
E=absolute protein, Figure F=relative protein, Figure G=absolute fat and Figure
H=relative fat.
Breakfa
st
Morning
Sna
ckLu
nch
Afterno
on S
nack
Dinner
Evenin
g Sna
ck0
200400600800
1000120014001600
Meal
Ener
gy In
take
(kca
ls)
(A)
Breakfa
st
Morning
Sna
ckLu
nch
Afterno
on S
nack
Dinner
Evenin
g Sna
ck0
25
50
75
100
125
150
Meal
CH
O In
take
(g)
(C)
Breakfa
st
Morning
Sna
ckLu
nch
Afterno
on Sna
ck
Dinner
Evenin
g Sna
ck0
20
40
60
80
100
120
Meal
Prot
ein
Inta
ke (g
)
(E)
Breakfa
st
Morning
Sna
ckLu
nch
Afterno
on S
nack
Dinner
Evenin
g Sna
ck0
20
40
60
80
100
Meal
Fat I
ntak
e (g
)
(G)
Breakfa
st
Morning
Sna
ckLu
nch
Afterno
on S
nack
Dinner
Evenin
g Sna
ck0
5
10
15
20
25
30
Meal
Ener
gy In
take
(kca
l/kg
LBM
)
(B)
Breakfa
st
Morning
Snack
Lunc
h
Afterno
on Sna
ck
Dinner
Evenin
g Sna
ck0.00.20.40.60.81.01.21.41.61.8
MealC
HO
Inta
ke (g
/kg
BM
)
(D)
Breakfa
st
Morning
Snack
Lunc
h
Afterno
on Sna
ck
Dinner
Evenin
g Sna
ck0.00.20.40.60.81.01.21.41.6
Meal
Prot
ein
Inta
ke (g
/kg
BM
)
(F)
f
Breakfa
st
Morning
Sna
ckLu
nch
Afterno
on S
nack
Dinner
Evenin
g Sna
ck0.0
0.2
0.4
0.6
0.8
1.0
1.2
Meal
Fat I
ntak
e (g
/kg
BM
)
(H)
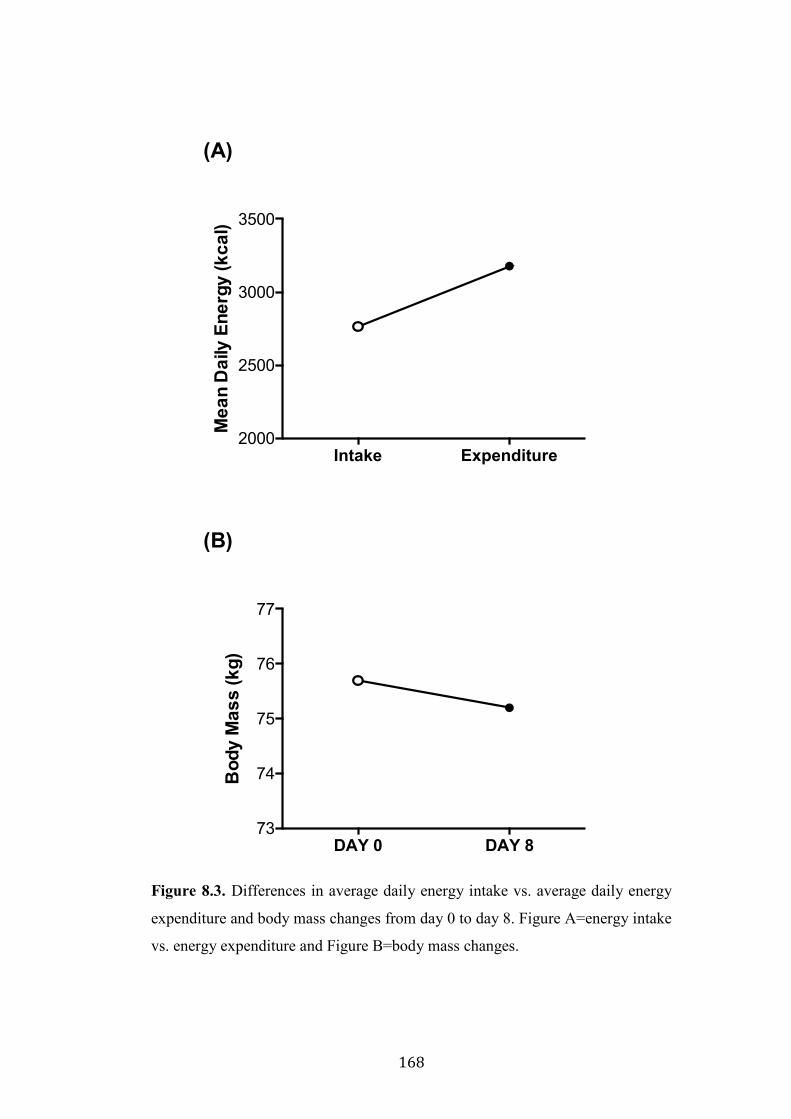
168
Figure 8.3. Differences in average daily energy intake vs. average daily energy
expenditure and body mass changes from day 0 to day 8. Figure A=energy intake
vs. energy expenditure and Figure B=body mass changes.
DAY 0 DAY 873
74
75
76
77
Bod
y M
ass
(kg)
(B)
Intake Expenditure2000
2500
3000
3500M
ean
Dai
ly E
nerg
y (k
cal)
(A)
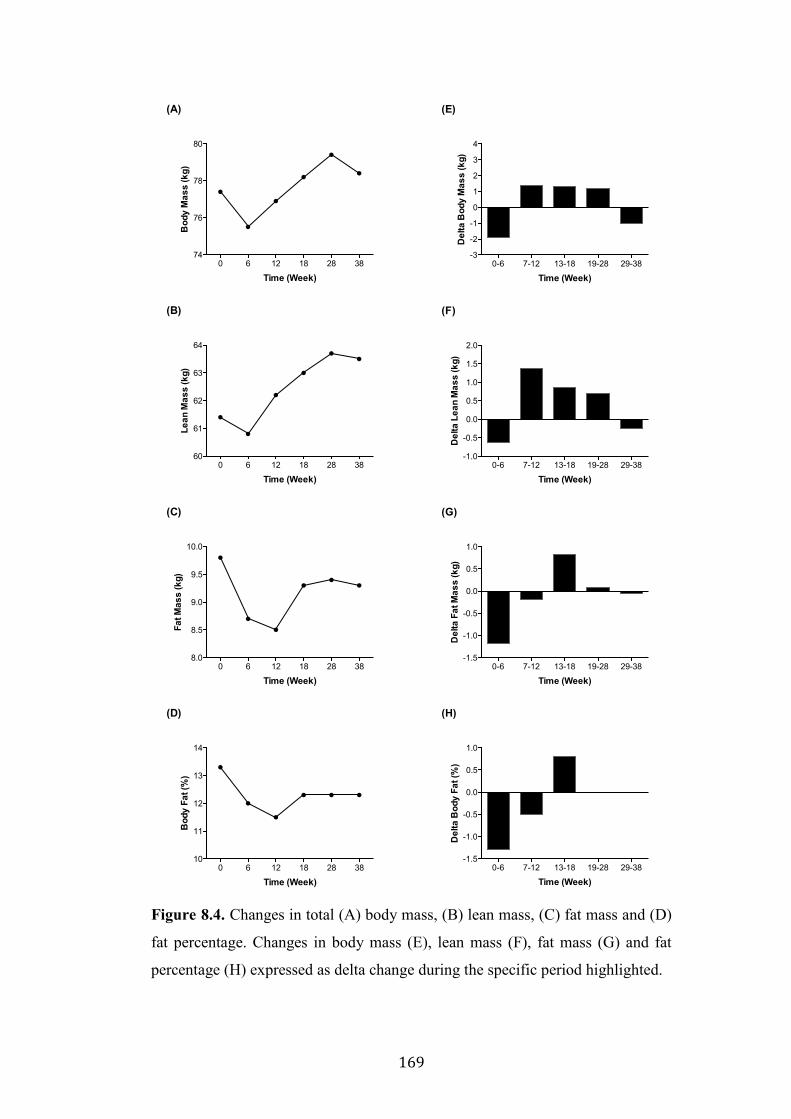
169
Figure 8.4. Changes in total (A) body mass, (B) lean mass, (C) fat mass and (D)
fat percentage. Changes in body mass (E), lean mass (F), fat mass (G) and fat
percentage (H) expressed as delta change during the specific period highlighted.
0 6 12 18 28 3874
76
78
80
Time (Week)
Bod
y M
ass
(kg)
(A)
0 6 12 18 28 3860
61
62
63
64
Time (Week)
Lean
Mas
s (k
g)
(B)
0 6 12 18 28 388.0
8.5
9.0
9.5
10.0
Time (Week)
Fat M
ass
(kg)
(C)
0 6 12 18 28 3810
11
12
13
14
Time (Week)
Bod
y Fa
t (%
)
(D)
0-6 7-12 13-18 19-28 29-38-3
-2
-1
0
1
2
3
4
Time (Week)
Del
ta B
ody
Mas
s (k
g)
(E)
0-6 7-12 13-18 19-28 29-38-1.0
-0.5
0.0
0.5
1.0
1.5
2.0
Time (Week)
Del
ta L
ean
Mas
s (k
g)
(F)
0-6 7-12 13-18 19-28 29-38-1.5
-1.0
-0.5
0.0
0.5
1.0
Time (Week)
Del
ta F
at M
ass
(kg)
(G)
0-6 7-12 13-18 19-28 29-38-1.5
-1.0
-0.5
0.0
0.5
1.0
Time (Week)
Del
ta B
ody
Fat (
%)
(H)
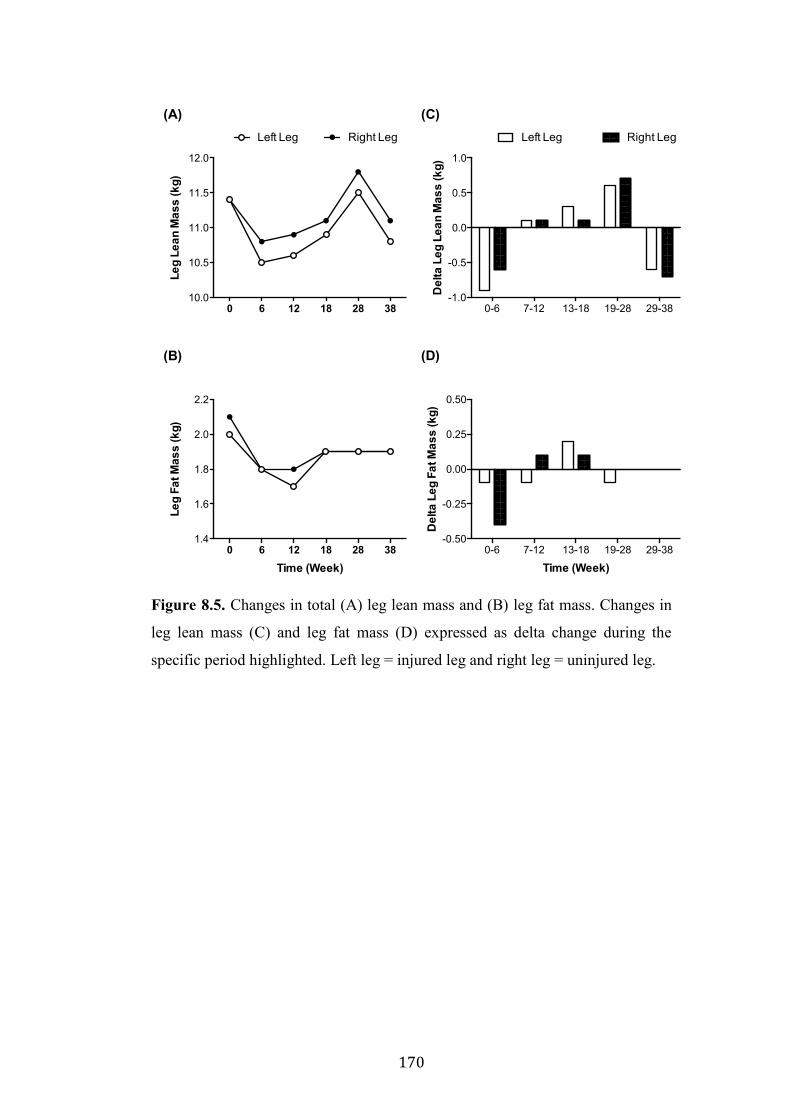
170
Figure 8.5. Changes in total (A) leg lean mass and (B) leg fat mass. Changes in
leg lean mass (C) and leg fat mass (D) expressed as delta change during the
specific period highlighted. Left leg = injured leg and right leg = uninjured leg.
0 6 12 18 28 3810.0
10.5
11.0
11.5
12.0Le
g Le
an M
ass
(kg)
(A)Right LegLeft Leg
0 6 12 18 28 381.4
1.6
1.8
2.0
2.2
Time (Week)
Leg
Fat M
ass
(kg)
(B)
0-6 7-12 13-18 19-28 29-38-1.0
-0.5
0.0
0.5
1.0
Del
ta L
eg L
ean
Mas
s (k
g)
(C)Right LegLeft Leg
0-6 7-12 13-18 19-28 29-38-0.50
-0.25
0.00
0.25
0.50
Time (Week)
Del
ta L
eg F
at M
ass
(kg)
(D)
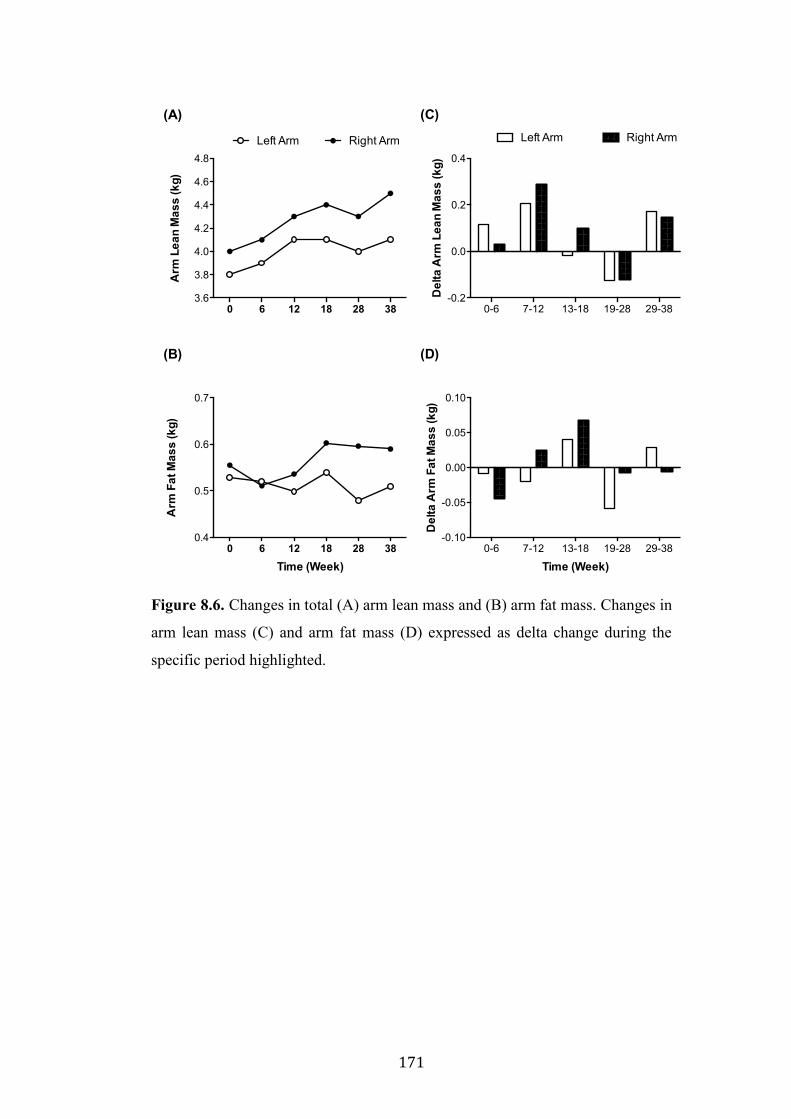
171
Figure 8.6. Changes in total (A) arm lean mass and (B) arm fat mass. Changes in
arm lean mass (C) and arm fat mass (D) expressed as delta change during the
specific period highlighted.
0 6 12 18 28 383.6
3.8
4.0
4.2
4.4
4.6
4.8A
rm L
ean
Mas
s (k
g)
(A)
Left Arm Right Arm
0 6 12 18 28 380.4
0.5
0.6
0.7
Time (Week)
Arm
Fat
Mas
s (k
g)
(B)
0-6 7-12 13-18 19-28 29-38-0.2
0.0
0.2
0.4
Del
ta A
rm L
ean
Mas
s (k
g)
(C)Right ArmLeft Arm
0-6 7-12 13-18 19-28 29-38-0.10
-0.05
0.00
0.05
0.10
Time (Week)
Del
ta A
rm F
at M
ass
(kg)
(D)
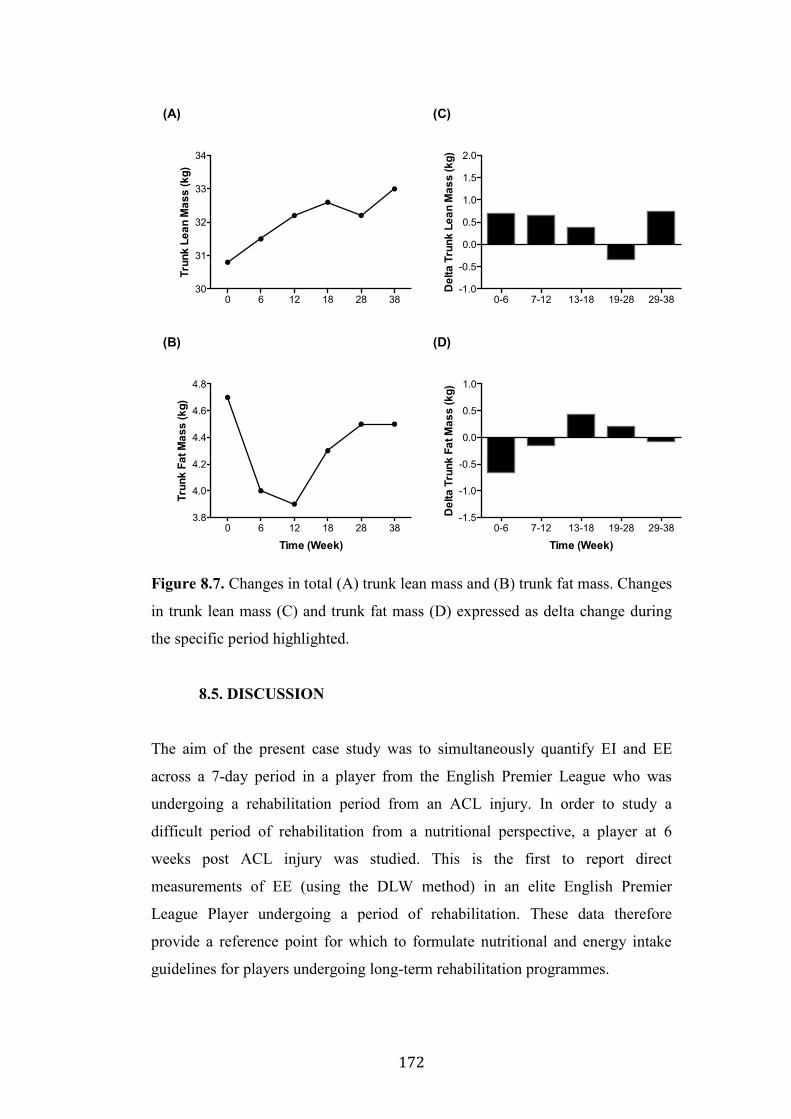
172
Figure 8.7. Changes in total (A) trunk lean mass and (B) trunk fat mass. Changes
in trunk lean mass (C) and trunk fat mass (D) expressed as delta change during
the specific period highlighted.
8.5. DISCUSSION
The aim of the present case study was to simultaneously quantify EI and EE
across a 7-day period in a player from the English Premier League who was
undergoing a rehabilitation period from an ACL injury. In order to study a
difficult period of rehabilitation from a nutritional perspective, a player at 6
weeks post ACL injury was studied. This is the first to report direct
measurements of EE (using the DLW method) in an elite English Premier
League Player undergoing a period of rehabilitation. These data therefore
provide a reference point for which to formulate nutritional and energy intake
guidelines for players undergoing long-term rehabilitation programmes.
0 6 12 18 28 3830
31
32
33
34
Trun
k Le
an M
ass
(kg)
(A)
0 6 12 18 28 383.8
4.0
4.2
4.4
4.6
4.8
Time (Week)
Trun
k Fa
t Mas
s (k
g)
(B)
0-6 7-12 13-18 19-28 29-38-1.0
-0.5
0.0
0.5
1.0
1.5
2.0
Del
ta T
runk
Lea
n M
ass
(kg)
(C)
0-6 7-12 13-18 19-28 29-38-1.5
-1.0
-0.5
0.0
0.5
1.0
Time (Week)
Del
ta T
runk
Fat
Mas
s (k
g)
(D)
173
The mean daily EI and EE data reported here suggest that this player was
completing this period of rehabilitation in an energy deficit. As such, a loss of
both lean and fat mass during the initial 6-week period (see Figure 8.4.) was
observed. Additionally, over the 7-day period of energy intake and expenditure
assessment the athlete experienced a -0.5 kg loss on body mass. It is notable that
this player has less EI (2765 vs. 3186 ± 367 kcals) and expenditure (3187 vs.
3566 ± 585 kcals) than players from the same team in outfield positions that are
regularly training and playing (Anderson et al., 2017; Chapter 6). Therefore, it is
clear that players undergoing a period of rehabilitation are required to
subsequently alter their nutritional intake.
With regards to the players’ body composition changes, the largest rates of
atrophy were observed in the initial 1-6 weeks post injury. This is similar to the
increased muscle atrophy in this period observed by this group previously
(Milsom et al., 2015) and also the large atrophy rates observed in randomised
controlled trials (Wall et al., 2013). Indeed, in the case study on a player from the
same team, there was a lean mass loss of 5.8 kg which was attributable to a 3.8
kg loss in trunk mass and a 1.4 and 0.8 kg loss in the injured and non-injured legs
respectively (Milsom et al., 2014). In the present study, there was a lean mass
loss of 0.6 kg that was attributable to an increase of 0.7 kg in the trunk lean mass
and a decrease 0.9 and 0.6 kg in the injured and non-injured leg, respectively.
Such differences between studies are likely due to the different energy intake
consumed by each player e.g. the player here reported higher energy intake
(2765 kcals) than that previously (1970 kcals) (Milsom et al., 2014).
Additionally, in the present case study the player was also undergoing load (see
Table 8.1.) (albeit was non-weight bearing for the 5 days post surgery) from
immediately after the surgical operation, whereas in Milsom et al. (2014) the
player was completely immobilised for the initial 4-weeks post surgery and
limited to 90° flexion for the 4-weeks after. Additionally, the player in the
present study was undergoing structured upper and lower body strength
programs within week 1 of rehabilitation although detailed loading data on this
period is not presented in the present case study. It is likely that both the
nutritional and training alterations in the present case study are likely
contributors to the reduced loss in lean body mass. Therefore, restrictions in
174
programming in the initial stages after injury along with any energy restrictions
are likely to have a significant influence on the body composition changes during
this time.
In addition to the differences in energy intakes and training programmes post
surgery, the player in the present study had slightly higher CHO (2.4 vs. 1.8 g.kg-
1) and protein (2.7 vs. 2.5 g.kg-1) intakes than previously reported (Milsom et al.,
2014). The high protein intakes reported here (e.g. 2.7 g.kg-1) are likely to be
extremely important during an energy deficit given previous data that high
protein intakes can attenuate the loss of lean mass (Churchward-Venne et al.,
2013). However, protein intakes were similar to that of Milsom et al. (2015)
during the initial phase and it is likely that the reduced energy deficit (as
achieved via increased CHO intake) and the structured upper and lower body
resistance programs all contributed to the attenuated lean body mass in the trunk
and arms, and also minimised loss in the lower limbs.
As discussed previously, the initial post operation recovery phase is crucial in
minimising lean body mass loss and fat mass gain in the athlete. However, if this
period is successfully completed, then further, more progressive gains can be
made in the periods after in order to 1) continue to develop physical and
anthropometric qualities beyond pre injury condition and 2) aid the rehabilitation
from injury with the strengthening of the lower limbs, more importantly the
injured limb. It is demonstrated here a progressive increase in both lean muscle
mass whilst minimising fat mass loss. However, it is acknowledged that further
information on each phase of this rehabilitation is beyond the scope of this study
and provides a fruitful area for more research.
Despite the novelty and practical aspects of the current study, our data are not
without limitations, largely a reflection of the practical demands of data
collection in an elite football setting. Most limitations have been mentioned in
this thesis previously (Chapter 6). Additionally, although an overview of load is
provided during the study, due to the large volumes of different work the player
is undergoing, it is difficult to quantify work exactly. Also, only one microcycle
is provided and in order to have an understanding of the energy demands during
175
the full rehabilitation period, this study would have to be replicated at numerous
stages throughout the rehabilitation process. Of particular interest would be
during the initial 2-weeks post injury although this is logistically difficult in the
applied setting. Furthermore, unlike traditional randomised controlled trials
incorporating large sample cohorts, this study provided a ‘real world’ example of
one player only and hence data are limited to the specific context of this injury
and rehabilitation programme.
8.6. CONCLUSION
In summary, this study simultaneously quantified for the first time, the daily
energy and macronutrient intakes and average daily EE of an elite professional
soccer player undergoing a period of rehabilitation from an ACL injury. Our data
confirm the role of energy availability and physical loading in minimising rates
of muscle atrophy during the initial eight weeks following ACL reconstructive
surgery.
176
CHAPTER 9
SYNTHESIS OF FINDINGS
177
9.1. SYNTHESIS OF FINDINGS
The purpose of the following chapter is to provide an overview of the conceptual
and theoretical interpretation of the data arising from this thesis in relation to the
aims and objectives outlined in Chapter 1. A general discussion is presented
where specific attention is given to how the present data has advanced out
understanding of the training load and energy requirements of professional
soccer. Finally, a review of limitations of the experimental chapters is presented
followed by recommendations for future research.
9.2. ACHIEVEMENT OF THE AIMS AND OBJECTIVES
The primary aim of the present thesis was to quantify the physical loading (both
training and match play), EE and EI of elite professional soccer players from the
English Premier League. On the basis of characterising the habitual loading
patterns and typical EE, a secondary aim was to formulate contemporary
nutritional guidelines in accordance with the concept of nutritional periodisation.
If the aims of the thesis were achieved, it was proposed that data from this thesis
would assist sports scientists, sports nutritionists and soccer players themselves
to make more informed decisions about nutrition and training requirements in
order to improve overall performance and recovery. The aims of this thesis were
achieved through the completion of 5 inter-linked studies (Chapters 4, 5, 6, 7 and
8).
Aim 1
To quantify training and match load during different weekly micro-cycle
scenarios in an English Premier League Team (Study 1, Chapter 4).
The physical and nutritional demands of soccer match play have long been
known. However, research on absolute training loads in professional soccer is
limited and training load data related to the variations in fixture schedules are
likely to further complicate nutritional requirements. It is therefore considered a
difficult task by the nutritionist to provide nutritional recommendations for
178
training demands and that of different fixture schedules. The data presented in
this chapter demonstrated that daily training load and weekly-accumulated load
(reflective of both training and match demands) during one-, two- and three-
game week schedules show marked differenced within- and between-game
schedules. As such, these data have implications for the nutritional strategies that
should be implemented in different micro-cycles of the season. Specifically, the
data from Study 1 suggested that CHO should be manipulated according to the
physical demands of the weekly micro-cycle.
Aim 2
To quantify training and match load over the course of an entire
competitive in season and examine the differences in load between groups of
players who are categorised into starting status (Study 2, Chapter 5).
Having identified the typical daily load occurred by ‘starting’ players in Study 1,
the aim of Study 2 was to quantify any differences in load that could occur in
players with different starting status. By categorising players into 3 groups of
starting status and monitoring their accumulative load over the entire season, the
data suggest that total seasonal volume of training (i.e. total distance and
duration) remained similar between groups. However, seasonal high-intensity
loading patterns are dependent on players’ match starting status. These data
demonstrate the importance of training program design between individuals
across an entire season in order to give comparable seasonal workloads across
groups.
Aim 3
To quantify training load, match load, EE and EI of English Premier
League players during a typical in-season micro-cycle (Chapter Study 3,
Chapter 6)
Given the apparent fluctuations in daily training load observed in Study 1 it was
suggested that EE may vary accordingly and hence, EI could also be adjusted to
179
account for the goals of that particular day. The data presented in this chapter
demonstrated a weekly overview of the habitual CHO periodisation strategies
that are used by an English Premier League team. Additionally, the EE of
Premier League soccer players was quantified for the first time. Ultimately, these
data suggest that whilst CHO intake may be suitable to meet the energy
requirements on training days, players do not appear to meet current CHO
guidelines for preparation for and completion of soccer match play.
Aim 4
To quantify EE and EI in English Premier League players undergoing
different situations than typical starting outfield players (Chapters 7 and 8).
Given that Study 1, 2 and 3 focused on outfield players, Study 4 and 5 utilised
case-study design to quantify the physical load, energy intake and energy
expenditure in a professional GK and an injured player undergoing long-term
rehabilitation from an ACL injury. Importantly, these data highlight differences
in energy requirements from outfield players and therefore provide a platform for
which to formulate specific nutritional guidelines for two special populations.
9.3. GENERAL DISCUSSION OF THE FINDINGS
9.3.1.1. EFFECTS OF MATCH SCHEDULE ON LOADING
The physical demands of soccer match play have been studied in extensive detail
for over four decades (Reilly & Thomas, 1976; Di Salvo et al., 2006; Di Salvo et
al., 2009; Russell et al., 2016). During this period, researchers have tended to
examine the effects of different situational variables of match play on physical
performance including player position (Bradley et al., 2009; Bradley et al., 2011;
Bloomfield et al., 2007; Di Salvo et al., 2007; Mohr et al., 2003), playing
formation (Bradley et al., 2011), playing standard (Bradley et al., 2013) and era
(Barnes et al., 2014). Such research has allowed sport scientists to devise
specific training and nutritional guidelines for match play based on the players’
180
physical profile. For example, central midfielder’s cover the most total distance
in the team (Bloomfield et al., 2007) and wide midfielders and wide defenders
cover a greater amount of high speed running and sprinting (Bradley et al., 2009)
potentially leading to a greater dependence on CHO availability in preparation,
during and in recovery from match play.
In contrast to the match demands, the physical demands of training in elite
players have only recently started to be examined. Reasons for this are
potentially due to the only recent advances and rise of GPS technology in team
sports (Cummins et al., 2012; Dellaserra et al., 2014; Scott et al 2016). Prior to
completion of this thesis, research on training load in professional soccer has
produced an examination of average values over a 10-week period (Gaudino et
al., 2013), absolute values over a single week exposure (Owen et al., 2014), a
season long analysis into periodisation strategies used by an elite club (Malone et
al., 2015), a congested fixture period (Morgans et al., 2015) and most recently,
average values (and ranges) over the season for each day when one game per
week was being played (Akenhead et al., 2016).
Although the absolute and habitual loads undertaken by soccer players are
starting to become clearer, numerous situational variables are likely to also affect
the training load, and thus the nutritional requirements. In Chapter 4 of this
thesis, both training and match load during three different weekly game
schedules were examined. Players were monitored in training and matches over a
one (Saturday-to-Saturday), two (Sunday-to-Saturday) and three game per week
(Sunday-Wednesday-Sunday) fixture schedule. Our findings demonstrate that
training load is significantly less than match load even in a one game per week
schedule (see Figure 4.1.). Additionally, in the two game per week schedule the
addition of a competitive match at the start of the week only reduces the load
experienced on day 3 (match day +2) although the absolute volume and distance
covered at high intensity are more augmented from the one game per week. This
however, should not change much of the implications for CHO periodisation and
similar strategies can be evident for both weeks. Therefore, strategies should aim
at enhancing recovery (Gunnarsson et al., 2013; Krustrup et al., 2011),
optimizing adaptations through manipulating CHO availability in order to
181
promote training adaptations (Bartlett et al., 2015), maintaining desired body
composition (Milsom et al., 2015; Morton et al., 2010) and promote muscle
glycogen storage in the days and hours before competition (Krustup et al., 2006).
In the three game per week schedule, the increase in match frequency
significantly increased player’s exposure to increased volume and work in high-
intensity speed zones (see Figure 4.2). Additionally, given there is only 2 days
between competitive matches, CHO intake should be high on each day of the
micro-cycle in order to optimally fuel match play and promote recovery after
match play cessation (Krustrup et al., 2006; Gunnarsson et al., 2013; Krustup et
al., 2011).
Given the increased time between fixtures, the one- and two- game per week
schedules lend themselves to the concept of CHO periodisation. In doing so,
strategies should aim at manipulating the CHO intake by “fuelling for the work
required”, previously suggested as a framework for endurance athletes (Impey et
al., 2016). In this regard, such strategies are intended to concomitantly promote
components of training adaptations (e.g. activation of regulatory cell signaling
pathways) but yet, also ensure adequate CHO and energy availability to promote
competitive performance, reduce injury risk and aid recovery (Burke et al., 2011;
Chamari et al., 2012; Burke et al., 2006).
9.3.1.2. EFFECTS OF STARTING STATUS
Evidence of the methodological manipulation of training load in the recovery
from and in the build up to a competitive fixture illustrate the importance of the
match to the overall planning and preparation strategies used within soccer
(Malone et al., 2015). It is noteworthy of the dominant role which match play
appears in the weekly micro-cycle and is typically associated with the highest
physical load (Anderson et al., 2015; Chapter 4). This is the case for parameters
such as total distance (e.g. < 7 km v ~10-13 km) (Bangsbo et al., 2006), high-
speed running distance (e.g. < 300 m v > 900 m), sprinting distance (e.g. < 150
m v > 200 m) (Di Salvo et al., 2010) and average speed (e.g. < 80 m/min v ~100-
120 m/min (Anderson et al., 2015, Chapter 4). Although the typical current
training practices of professional players may be sufficient in order to promote
182
recovery and readiness for the next game (thus reducing risk of over-training and
injury), it could also be suggested that it is the participation in match play itself
that is the most appropriate stimulus for preparing players for the physical
demands of match play. This point is especially relevant considering previous
evidence demonstrating significant positive correlations between individual in
season playing time and aspects of physical performance including sprint
performance and muscle strength (Silva et al., 2011). More recently, Morgans et
al. (2017) demonstrated evidence of improved counter movement jump height
being proportional to the amount of high-intensity distance covered in match
play itself. Therefore, it is evident that match play is a potent stimulus in the
development of physical qualities associated with soccer.
To give a practical overview of the situation in a professional team from the
English Premier League, a playing squad consists of ~22 outfield players, ~12
players often go without this match stimulus during the weekly micro-cycle, with
a maximum of 3 players coming on as substitutes. Therefore, these players are
not experiencing the same loads to that of players comprising the starting 10
outfield players. Such situations have obvious implications for both training load
scheduling and nutritional intake. In Chapter 5 of this thesis, outfield players
from the English Premier League were monitored over an entire in season period
and classified players as starters (>60% of games), fringe players (30-60% of
games) or non-starters (starting <30% of games). Our findings indicated that the
starting status had no apparent effect on total volume (duration and total
distance) completed over the season. Perhaps more important, however, was the
observation of significant differences in the pattern of activity completed in high
intensity speed zones which players are often far away from in training itself
(Anderson et al., 2015; Chapter 5). In this regard, it is acknowledged that starters
generally completed more distance in running, high-speed running and sprinting
speed zones than both fringe and non-starting players. Additionally, this was
largely due to time spent in the game itself as opposed to differences in training
load patterns.
Given the role of high intensity training in promoting soccer-specific match
fitness (Iaia et al., 2009; Bangsbo, 2008; Dupont et al., 2004; Wells et al., 2014),
183
the role of match time exposure on key physical performance characteristics
associated to soccer (Silva et al., 2011) and the role of high-intensity distance
providing a physiological stimulus for muscular power (Morgans et al., 2017),
soccer players training load is likely to be different depending on whether they’re
starting regular fixtures or not. Therefore, soccer players who are not receiving
sufficient match playing time should have altered training load to include more
emphasis on recreating the high intensity demands of match play. The practical
implications of the differences in load over starting status are important for the
evaluation and re-designing of training programs in order to maintain overall
squad physical fitness and game readiness. Undeniably the distances covered in
the high intensity zones during games display strong associations to physical
capacity (Krustrup et al., 2003; Krustrup et al., 2005) and thus, if a player is not
consistently exposed to these loads in the weekly micro-cycle and over the
course of a season, then players who aren’t exposed to game time may present
with a detraining effect over a season (Silva et al., 2011). The completion of such
high intensity load, even at the expense of total physical work done is both
sufficient and necessary to activate the molecular pathways that regulate skeletal
muscle adaptions related to both aerobic (Egan et al., 2010; Gillen & Gibala,
2014) and anaerobic (Iaia et al., 2008) performance. Additionally, when those
players classified as fringe or non-starters are then required to start a match, a
potential for injury exists due to the necessity to complete uncustomary loading
patterns (Malone et al., 2017b; Gabbett, 2004). However, higher levels of
chronic training loads (previous 21 days) and higher levels of intermittent
aerobic fitness reduce the injury risk associated with these distances in soccer
players (Malone et al., 2017b). Training strategies that ‘mimic’ the external
demands of match play have recently been established and could be a potential
training tool to use with players the day of or after a competitive game in order to
provide a significant match stimulus (Lacome et al., 2017).
9.3.1.3. EFFECTS OF POSITIONAL STATUS
On an individual basis, load can often become complex and lead to
complications in load management such as that of each players positional and
tactical role in the team. Researchers have long identified positional differences
184
in soccer match play (Bradley et al., 2009; Bradley et al., 2011; Bloomfield et al.,
2007; Di Salvo et al., 2007; Mohr et al., 2003). In training, initial research
observed positional differences in the outfield playing squad (Malone et al.,
2015). It was reported that central midfielders and wide defenders covered the
highest total distance with central defenders displaying the lowest values.
Additionally, wide midfielders also tended to cover greater high intensity
distance than central defenders. More recently, Akenhead et al. (2016)
demonstrated positional differences in training load for another team. Similarly,
central midfielders covered were reportedly ~8-16% greater total distance than
central defenders, wide defenders and forwards. However, in this study, no
differences in high intensity distance were evident between positions. In the
present thesis, Anderson et al. (2015; Chapter 4) presented differences between
positions for total distance with wide defenders, central midfielders and wide
attackers covering greater distance than central defenders and attackers, although
it must be stressed that no statistical tests were run on this data due to the small
sample size. Additionally, although data weren’t reported in this chapter, wide
defenders, wide attackers and attackers covered greater distance at high intensity
during the one- game week training than central defenders and central
midfielders. This was particularly evident on day 4 where the training load was
at its highest and training was performed with large numbers (e.g.. 10v10), large
pitch sizes (e.g. 75x60m) and long durations (i.e. 2x15 minutes). These types of
training sessions often encompass players in game like situations performing
actions like they would in competitive match play. Additionally, in data collected
but not presented in Anderson et al., (2015; Chapter 4), on days like day 3 where
training content consists of low numbers (e.g. 5v5), small pitch sizes (e.g.
30x25m) and short duration (e.g. 2-3 minutes) then no real positional differences
were observed. Such data is reflective of that suggested before (Morgans et al.,
2014) and illustrate the role of different managerial and coaching structure in the
overall training process and outcome. An area for future research exists in
examining the positional differences of training in soccer players, which could
allow further individualization of training and nutritional programs.
Outfield players have dominated the small amount of training load research to
date and very little is known about current load endured by elite level GKs
185
during training. Considering the GKs importance to the team, this is very
surprising and offers fruitful areas of research and examination. In competitive
matches the GK covers significantly less distance (5611 ± 613 vs. 10841 ± 950
m) and distance in high intensity speed zones (>19.8 km . h-1) than their outfield
teammates (56 ± 34 m vs. 980 ± 294 m) (Di Salvo et al., 2008; Bradley et al.,
2010). However, it is understood that the demands of a GK are assessed on their
ability to perform high-intensity movements and explosive actions, which are
separated by longer walking and jogging periods that allow for recovery (Ziv &
Lidor, 2011). Professional soccer clubs that employ specific GK coaches to work
their players often train separately from the rest of the team for the majority of
the session. Therefore, it is likely that GK different training loads than outfield
players.
In Chapter 7 of this thesis, an elite GKs training and match load over the course
of a typical weekly in season micro-cycle was monitored. For the first time, key
parameters of physical loading were reported for GK during training sessions,
some of which were remarkably similar to the outfield positions loads during the
same competitive week such as total distance (2422 m vs. 2865 m) and high
intensity distance (0 m vs. 32 m) (Anderson et al., 2017; Chapter 6). However,
such loads were observed in a two game per week fixture schedule (Thursday-
Sunday) and are likely to differ greatly to the outfield players when the physical
emphasis is not on recovery and preparation for the upcoming fixture (Nedelec et
al., 2015). Indeed, it is important to understand such typical training load values
for GKs, as well as specific movement functions such as the ability to produce
high intensity and explosive movements such as jumping, diving and returning
from a dive. Until recently, such variables could not be recorded during training
sessions, but now a recent development of GK specific algorithms in GPS units
have allowed for day to day collection. However, such devices are yet to be
validated in scientific research and thus, are unable to be published in this thesis.
An interesting and valuable area for future research would be to validate and
publish the training and match demands of elite soccer GKs.
186
9.3.2. ENERGY REQUIREMENTS OF SOCCER PLAYERS
9.3.2.1. ENERGY EXPENDITURE
Given the daily fluctuations in training load reported in Study 1, energy
expenditure may vary accordingly. Such knowledge of fluctuations in energy
expenditure would allow energy intake to be adjusted to account for the goals of
that particular day. The concept of “fuelling for the work required” has recently
been suggested as a practical framework for which to apply nutritional
periodisation strategies to endurance athletes (Impey et al., 2016). This
framework encompasses strategies which are intended to concomitantly promote
components of training adaptation (e.g. activation of regulatory cell signaling
pathways) but yet, also ensure adequate CHO and energy availability to promote
competitive performance, reduce injury risk and aid recovery (Burke et al., 2011;
Chamari et al., 2012; Burke et al., 2006). Despite such theoretical rationale, it is
difficult to prescribe accurate nutritional guidelines for professional soccer
players. Prior to this thesis, only one study has provided direct assessments of EE
in the modern professional adult player who found that players competing in two
competitive fixtures per week expended 3532 ± 408 kcals on average per day
(Ebine et al., 2002). However, this study was performed on professional Japanese
players and is not considered reflective of a team competing in the English
Premier League and European Competitions.
In order to provide direct assessments of EE, players are required to be
monitored in free-living conditions. Assessments of EE can be done using the
DLW method while avoiding any interference with training activities (Montoye
et al., 1996). However, a limitation of the DLW technique is the inability to
provide day-to-day EE assessments. Therefore, in Chapter 6 of this thesis EE
was monitored over a 7-day in season period that consisted of two match days
and 5 training days in elite players from the English Premier League. Average
daily EE of 3566 ± 585 kcals were reported, similar to that of Japanese players
(Ebine et al., 2002). This can allow us to design specific average daily guidelines
over a competitive week in order to create an equal, positive or negative energy
187
balance, maximise recovery, adaptation and preparation for the next competitive
fixture.
9.3.2.2. ENERGY AND MACRONUTRIENT INTAKE
If the energy requirements of soccer players are known, the knowledge of current
nutritional intakes are key in order to alter intakes accordingly. Nutritional
assessments of soccer players have primarily focused around the elite youth
population with very few studies conducted in the senior elite professional player
(see Table 2.2.). Most recently, Bettonviel et al. (2016) studied energy and
macronutrient intakes across different days in elite Dutch players. Additionally,
energy and macronutrient intakes have been examined in players from the United
Kingdom two decades ago (Maughan, 1997) and more recently, CHO and
protein intake have been reported in players from the English Football League
(Ono et al., 2012). One of the key conclusions from these studies is that protein
has subsequently increased over eras which is potentially driven by the increased
scientific research and resulting athlete (and coach) awareness of the role of
protein in facilitating adaptations and recovery from both aerobic and strength
training (Moore et al., 2014; McNaughton et al., 2016). However, information
was unclear about nutritional practices of players from an elite club in the
English Premier League who were operating on a two game per week schedule.
In order to better understand the current nutritional practices of soccer players
from the English Premier League, Chapter 6 of this thesis examined the habitual
nutritional intakes over a 7-day in season period where two competitive matches
were played. A similar EI of 3186 ± 367 kcals to those reported in Japanese
players 3113 ± 581 kcals was observed (Ebine et al., 2002). Additionally,
evidence of CHO periodisation in accordance with upcoming physical load and
likely differences in day-to-day EE was also observed. Both absolute and relative
daily energy and CHO intake was greater on match days (3789 ± 532 kcal and
6.4 ± 2.2 g.kg-1, respectively) compared with training days (2948 ± 347 kcal and
4.2 ± 1.4 g.kg-1, respectively). Therefore, it is suggested that soccer players who
are competing in two competitive matches per week are not consuming adequate
CHO to optimise muscle glycogen storage in the day before and in recovery from
188
games (Bussau et al., 2002; Krustrup et al., 2006). This is especially relevant
considering the inability to fully replenish muscle glycogen content in type II
fibers 48 hr after match play, even when CHO intake is > 8 g.kg-1 body mass per
day (Gunnarsoson et al., 2013).
Additionally, players reported higher daily protein intakes (205 ± 30 g) than
reported two decades ago in British professional players (108 ± 26 g), whereas
both CHO and fat intakes were relatively similar (Maughan, 1997). However,
our daily protein intakes agreed with those reported more recently (150-200 g) in
adult professional players from the Dutch league (Bettonviel et al., 2016). As
aforementioned, differences in protein intakes between eras are potentially
driven by the increased scientific research and resulting athlete (and coach)
awareness of the role of protein in facilitating training adaptations and recovery
from both aerobic and strength training (Moore et al., 2014; McNaughton et al.,
2016). The data from Chapter 6 of this thesis gives practitioners areas to
significantly improve quantity of CHO intakes on training days and also different
areas of macronutrient intakes such as the quantity and timings of feedings, often
called the distribution of macronutrient intakes. The data from this Chapter has
allowed us to develop nutritional targets for players to achieve on both training
and match days in order to improve current CHO feeding practices.
9.3.2.3. ENERGY AND MACRONUTRIENT DISTRIBUTION
Further to the quantification of daily energy and macronutrient intake, it is also
important to consider the daily “distribution” of energy and macronutrient
intakes. There is a vast amount of research supporting this rationale for CHO
intakes in relation to promoting pre-match CHO loading and post-match muscle
glycogen resynthesis (Ivy et al., 1988a; Ivy et al., 1988b). Similar to CHO intake,
timing and distribution of protein doses may have more of an influential role in
modulating muscle protein synthesis when compared with the absolute dose of
protein intake per se, an effect which is evident on response to both feeding
alone (Mamerow et al., 2014) and post exercise feeding (Areta et al., 2013;
MacNaughton et al., 2016). Research on the daily distribution of energy and
macronutrient intakes has been undertaken in elite youth players from an English
189
soccer team (Naughton et al., 2016), adult elite players of the Dutch league
(Bettonviel et al., 2016) and a mixed sex cohort of multisport Dutch athletes
(Gillen et al., 2016), all of whom observed a skewed approach to protein feeding
across the day.
Information regarding the distribution of energy, CHO and macronutrient intakes
would allow practitioners to alter current practices to allow for greater adaptation
and performance, specifically around training and matches. In Chapter 6 of this
thesis, the daily distribution of energy and macronutrient intakes on both training
and match days was quantified. It was observed that players adopt a skewed
approach to feeding on training days such that absolute EI, CHO and protein
intake are consumed in a hierarchical manner of dinner>lunch>breakfast>snacks.
In addition, players tended to under consume CHO on match days in relation to
the pre- and post-match meals, especially in recovery from an evening kick-off
time. In relation to training days, it is clear that players should distribute their
macronutrients more evenly across the day with regular 30-40 g servings of
protein at each meal in order to maximise adaptations (Mamerow et al., 2014;
Areta et al., 2013; MacNaughton et al., 2016). Recommendations for
improvements for soccer players in this regard can be to educate and create
awareness around typical protein doses in common foods.
On match day itself, players often cited not wanting to experience the feelings of
a “heavy stomach” in the build-up and during the match as their reason behind
consuming a lower energy and CHO based pre-match meal. Therefore, different
strategies should be adopted in order to meet the 1-4 g.kg-1 CHO guidelines in
the 1-4 hours prior to matches (Burke et al., 2011). Such strategies should focus
around the consumption of medium to high GI CHO in the hours before
competition in order to remove the feelings of a “heavy stomach” due to
decreased fiber and gluten found in these foods. However, if these foods are
provided for the pre match meal, CHO should be provided during the match in
order to maintain plasma glucose levels and CHO stores during competition
(Burke et al., 1998). In addition to the pre-match meal, the post-match recovery
meal requires significant attention in this cohort, especially after an evening
kick-off where players are choosing to attempt to go to sleep rather than consume
190
a post-match meal. Players should consume a post-match meal of 1.2 g.kg-1 for 4
hours after cessation of exercise in order to maximise muscle glycogen
resynthesis (Jentjens & Jeukendrup, 2003). Possible ways to overcome this issue
is to provide players with a “recovery pack” after games, such packs should
consist of high CHO and high protein.
9.3.2.4. ENERGY AND MACRONUTRIENT INTAKE IN THE
GOALKEEPER
The GK in professional soccer often undergoes separate training load and
displays significantly less load during matches compared to their outfield
teammates (Di Salvo et al., 2008; Bradley et al., 2010). However, the GK is often
subject to consuming foods alongside their outfield teammates, foods that are
predominantly high in CHO and served on the basis that outfield players are
required to have high CHO intakes. Typically, GKs are taller, heavier and have
higher levels of body fat than players in other positions in the team (Milsom et
al., 2015; Sutton et al., 2009). The latter potentially being down to poor diet
choices, which are in line with outfield players’ requirements. Indeed this is a
cause for concern as fat mass acts as a dead weight in activities when the body is
lifted against gravity (Reilly, 1996). GKs are required to move their bodies in a
powerful, explosive and efficient manor in order to be effective in their role
within the team. Therefore, it would be highly beneficial to observe a GKs
energy and macronutrient intakes across a weekly micro-cycle
In Chapter 7 of this thesis, an elite professional GKs energy and macronutrient
intakes across a weekly micro-cycle consisting of two competitive matches was
examined. The observed average daily EI of the GK was 3160 kcals across the
weekly micro-cycle, however this ranged from 2695 – 3607 kcals. This was
reflective in a form of CHO periodisation similar to that observed in outfield
players (Anderson et al., 2017; Chapter 6). Although the GK consumed similar
protein intakes to his outfield teammates (2.4 g·kg-1 vs. 2.6 g·kg-1), he consumes
considerably higher fat intake (1.9 g·kg-1 vs. 1.3 g·kg-1) and appeared to self-
select a low CHO high fat diet
191
9.2.2.5. ENERGY AND MACRONUTRIENT INTAKE IN THE
INJURED ATHLETE
In recent years, the pressure for a fast return from injury, along with maintained
performance upon return has initiated the increase in sports science support of
injured athletes. For major injuries in professional soccer, players can often
impose upon lengthy periods of rehabilitation, which present major challenges in
maintaining lean muscle mass and function. ACL injuries are common and
potentially serious injuries in soccer often requiring surgical reconstruction
(Brophy et al., 2012). After ACL reconstruction, an athlete’s return to play time
has been shown to be between 4 and 9 months (Zaffagnini et al., 2014). A time
period of this duration requires gradual transition through different phases in
order to redevelop a fully functioning, recovered athlete. However, research on
training load, EE and EI in professional soccer players undergoing a period of
rehabilitation is scarce. One study performed by our group previously (Milsom et
al., 2015) provided a case study account of the nutrition, training and
rehabilitation program and the subsequent body composition changes at different
stages of the rehabilitation. This gives practitioners a better understanding and
guide on areas to focus on for improving current practice. Nevertheless, one
difficulty expressed by the authors was that typical EE were unknown. In order
to provide improved and more accurate nutritional programs over a rehabilitation
period, accurate information regarding the EE of players during specific phases
is required. Additionally, it is also important to understand the current energy
and macronutrient intakes and the distribution, which they are consumed in order
to maximise training adaptations during this period (Mamerow et al., 2014; Areta
et al., 2013; MacNaughton et al., 2016). Correct practice in this area can provide
positive outcomes in regards to the body composition changes over the
rehabilitation period enabling a faster, safer and more effective return to play.
In Chapter 8 of this thesis, direct measurements of EE (using the DLW method)
were quantified for the first time in an elite English Premier League player
undergoing a period of rehabilitation. Additionally, the players daily energy and
macronutrient intakes were also quantified across the same 7-day period. In
relation to this specific player, our data suggest that he exhibited a significant
192
average energy deficit, has a wide range of energy and macronutrient intakes
from day-to-day, has a skewed energy and macronutrient intake across meals.
The data from this case study can allow future nutritional and training programs
to be implemented allowing for subtle changes around specific meal feeding and
overall daily nutritional intake.
9.3.3. CONTEMPORARY TRAINING AND NUTRITIONAL
GUILDELINES FOR SOCCER PLAYERS
9.3.3.1. TRAINING GUIDELINES
Through the completion of Chapters 4 and 5, it is clear that during a one-game
per week schedule there is significant periodisation within the weekly training
load. From a physiological perspective this is essential in order to provide
enough recovery from the previous competitive fixture (Nedelec et al., 2015),
provide higher volume and intensity training loads early in the micro-cycle in
order to provide a physical overload stimulus, with volume decreasing as match
day approaches to facilitate decay of the fatigue component (Impellizzeri et al.,
2004; Malone et al., 2015; Anderson et al., 2015; Chapter 4). However, it is clear
from Chapter 4 of this thesis that match play itself provides the highest physical
stimulus during the weekly micro-cycle. Additionally, in Chapter 5 of this thesis
it was found that fringe players and non-starters performed less high-intensity
and sprint distance than players who were regularly starting fixtures. Therefore,
fringe and non-starting players should perform additional high-intensity work
when they are not performing in the weekly fixture in order to provide a similar
physical stimulus as the starting group (see Table 9.1.). Strategies to provide a
similar external output to matches have recently been investigated and have been
adopted in the present recommendations in order to provide match like
adaptations to ~60 minutes of match play (Lacome et al., 2017). Prior to
considering any nutritional strategy, it is essential to identify the physical loading
patters experienced across the target training cycle. As an example, a weekly
training schedule that has been summerised can be found in Table 9.1 which then
provides a framework for a suggested nutritional periodisation strategy to follow.
193
9.3.3.2. MATCH DAY NUTRITION
Nutrition on match day has a significant impact on physical and technical
performance (Williams & Serratosa, 2006). Despite clear nutritional guidelines
for match play available in the literature, it appears that the present players
studied did not fully adhere to such recommendations. In relation to match
performance, increased feeding at the pre-match meal to ~2g.kg-1 body mass and
increase feeding through breaks in play to ~60 g.h-1 is suggested. Such strategies
are likely to induce physiological benefits that are facilitative of improved high-
intensity intermittent performance by maximising muscle glycogen and liver
stores pre-game and maintaining plasma glucose in order to spare muscle and
liver glycogen, respectively (Convertino et al., 1996; Coyle, 2004; Coyle, 1992).
In addition to the performance benefits of meals, in relation to a two game per
week schedule, there is an obvious nutritional requirement to maximise muscle
glycogen storage in the 24-48 h after the game (Krsutrup et al., 2006; Bassau et
al., 2002). Intakes in the present study would be considered sub-optimal in
relation to maximizing rates of post-match muscle glycogen resynthesis (Jentjens
& Jeukendrup, 2003). In addition, this seems to be more pronounced when an
evening kick off (19:45) occurs with players opting for attempted sleep rather
than promoting muscle glycogen resynthesis. Therefore, it is suggested that the
current practices can be altered and different approaches should be employed to
the feeding strategies employed on match day. An example of CHO intakes on
match day along with practical examples can be found in Table 9.2.
9.3.3.3. TRAINING DAY NUTRITION
It is clear from this thesis that training loads are significantly less than that
experienced during matches. Therefore, the CHO guidelines on training days are
not required to be as high as match day (see Table 9.2.). However, as suggested
in Chapter 6, when two competitive matches are played over the weekly micro-
cycle there becomes a need to increase CHO intakes in order to maximise muscle
glycogen resynthesis and storage between competitive fixtures. Therefore,
similar dietary intakes to the Friday and Sunday (for the starters) will be required
in the days between fixtures.
194
In addition to the absolute daily intakes on training days, Chapter 6 of this thesis
also observed skewed energy and macronutrient intakes across meals. Providing
a balanced approach across to meals to energy and macronutrients, with a
particular reference to protein can play an influential role in modulating muscle
protein synthesis. Protein intakes were skewed in the hierarchical manner
dinner>lunch>breakfast>snacks. The data from this Chapter suggest that
improvements can be made at breakfast, morning, afternoon and evening snacks.
It is therefore recommended that ~30g of protein should be consumed with each
meal displayed in table 9.2. in order to maximise adaptation.
9.3.3.4. CARBOHYDRATE PERIODISATION IN SOCCER
It is important that players are appropriately fueled for training sessions in order
to maximise their capabilities to perform technical and cognitive skills (Ali &
Williams, 2009; Russell & Kingsley, 2014) and also maintain a high level of
physical performance (Harper et al., 2017). Nonetheless, it is likely that players
adopt a subconscious “fuel for the work” required approach due to training times,
lack of CHO provisions in training sessions and an understanding of CHO
loading for matches. From a practical perspective, it is becoming clear that CHO
availability should be manipulated in a day-by-day and meal-by-meal manner
depending on the upcoming and previous workloads. A practical model for CHO
and/ or energy periodisation according to the principle of “fuel for the work
required” for a one game per week micro-cycle in professional soccer context is
displayed in Table 9.2. In this model, moderate CHO is available prior to training
sessions in order to maintain training intensity (Widrick et al., 1993; Yeo et al.,
2008; Hulston et al., 2010). During training sessions, no CHO is provided in
order to maximise adaptations of a “train low” strategy (Morton et al., 2009).
Training sessions during the week were deemed not necessary to provide
exogenous CHO for fuel, as muscle glycogen would likely not be fully depleted
by the end of the session with regards to the data observed in Chapter 4.
Immediately post-training sessions, a high CHO based lunch in order to replenish
muscle glycogen stores is suggested, as muscles are more receptive to CHO
feeding after exercise has been performed (Ivy et al., 1998). However, careful
195
attention must be paid to training load as each club can potentially have much
higher or lower training loads and therefore CHO intakes will have to be adjusted
accordingly. Table 9.2. illustrates a practical example of training for the current
nutritional framework presented.
Essentially, this model can be adapted for when two competitive games are
played in the weekly micro-cycle For example, Saturday-Wednesday-Saturday
fixture schedules as often experienced in the English Premier League when
teams are competing in major European Competitions alongside the domestic
campaign. This can be done following the MD approach as outlined in Table 9.2.
For example, Saturday is MD, Sunday is MD+1, Monday is MD+2 and Tuesday
is MD-1 and so forth.
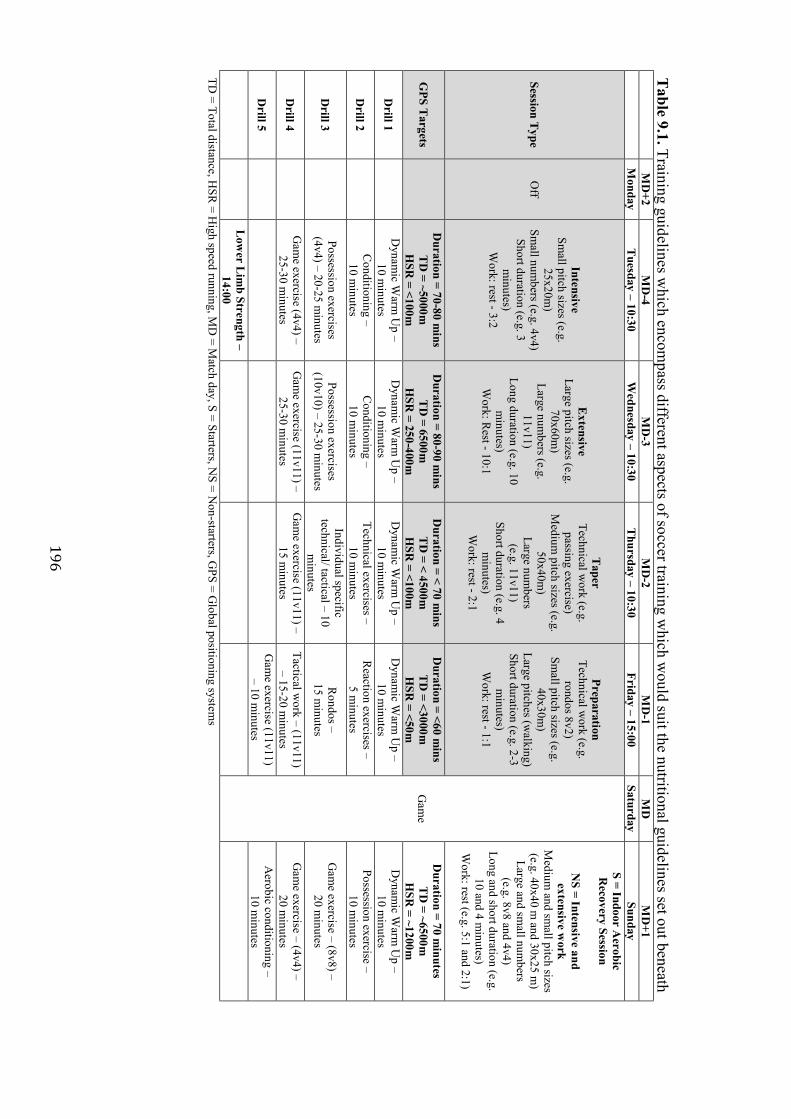
196
Table 9.1. Training guidelines w
hich encompass different aspects of soccer training w
hich would suit the nutritional guidelines set out beneath
M
D+2
MD
-4 M
D-3
MD
-2 M
D-1
MD
M
D+1
M
onday T
uesday – 10:30 W
ednesday – 10:30 T
hursday – 10:30 Friday – 15:00
Saturday Sunday
Session Type
Off
Intensive Sm
all pitch sizes (e.g. 25x20m
) Sm
all numbers (e.g. 4v4)
Short duration (e.g. 3 m
inutes) W
ork: rest - 3:2
Extensive
Large pitch sizes (e.g. 70x60m
) Large num
bers (e.g. 11v11)
Long duration (e.g. 10 m
inutes) W
ork: Rest - 10:1
Taper
Technical work (e.g.
passing exercise) M
edium pitch sizes (e.g.
50x40m)
Large numbers
(e.g. 11v11) Short duration (e.g. 4
minutes)
Work: rest - 2:1
Preparation Technical w
ork (e.g. rondos 8v2)
Small pitch sizes (e.g.
40x30m)
Large pitches (walking)
Short duration (e.g. 2-3 m
inutes) W
ork: rest - 1:1
Gam
e
S = Indoor Aerobic
Recovery Session
N
S = Intensive and extensive w
ork M
edium and sm
all pitch sizes (e.g. 40x40 m
and 30x25 m)
Large and small num
bers (e.g. 8v8 and 4v4)
Long and short duration (e.g. 10 and 4 m
inutes) W
ork: rest (e.g. 5:1 and 2:1)
GPS T
argets
Duration = 70-80 m
ins T
D = ~5000m
H
SR = <100m
Duration = 80-90 m
ins T
D = 6500m
H
SR = 250-400m
Duration = < 70 m
ins T
D = < 4500m
H
SR = <100m
Duration = <60 m
ins T
D = <3000m
H
SR = <50m
Duration = 70 m
inutes T
D = ~6500m
H
SR = ~1200m
Drill 1
D
ynamic W
arm U
p – 10 m
inutes D
ynamic W
arm U
p – 10 m
inutes D
ynamic W
arm U
p – 10 m
inutes D
ynamic W
arm U
p – 10 m
inutes D
ynamic W
arm U
p – 10 m
inutes
Drill 2
C
onditioning – 10 m
inutes C
onditioning – 10 m
inutes Technical exercises –
10 minutes
Reaction exercises –
5 minutes
Possession exercise – 10 m
inutes
Drill 3
Possession exercises
(4v4) – 20-25 minutes
Possession exercises (10v10) – 25-30 m
inutes
Individual specific technical/ tactical – 10
minutes
Rondos –
15 minutes
Gam
e exercise – (8v8) – 20 m
inutes
Drill 4
G
ame exercise (4v4) –
25-30 minutes
Gam
e exercise (11v11) – 25-30 m
inutes G
ame exercise (11v11) –
15 minutes
Tactical work – (11v11)
– 15-20 minutes
Gam
e exercise – (4v4) – 20 m
inutes
Drill 5
Gam
e exercise (11v11) – 10 m
inutes A
erobic conditioning – 10 m
inutes
Low
er Lim
b Strength – 14:00
TD = Total distance, H
SR = H
igh speed running, MD
= Match day, S = Starters, N
S = Non-starters, G
PS = Global positioning system
s
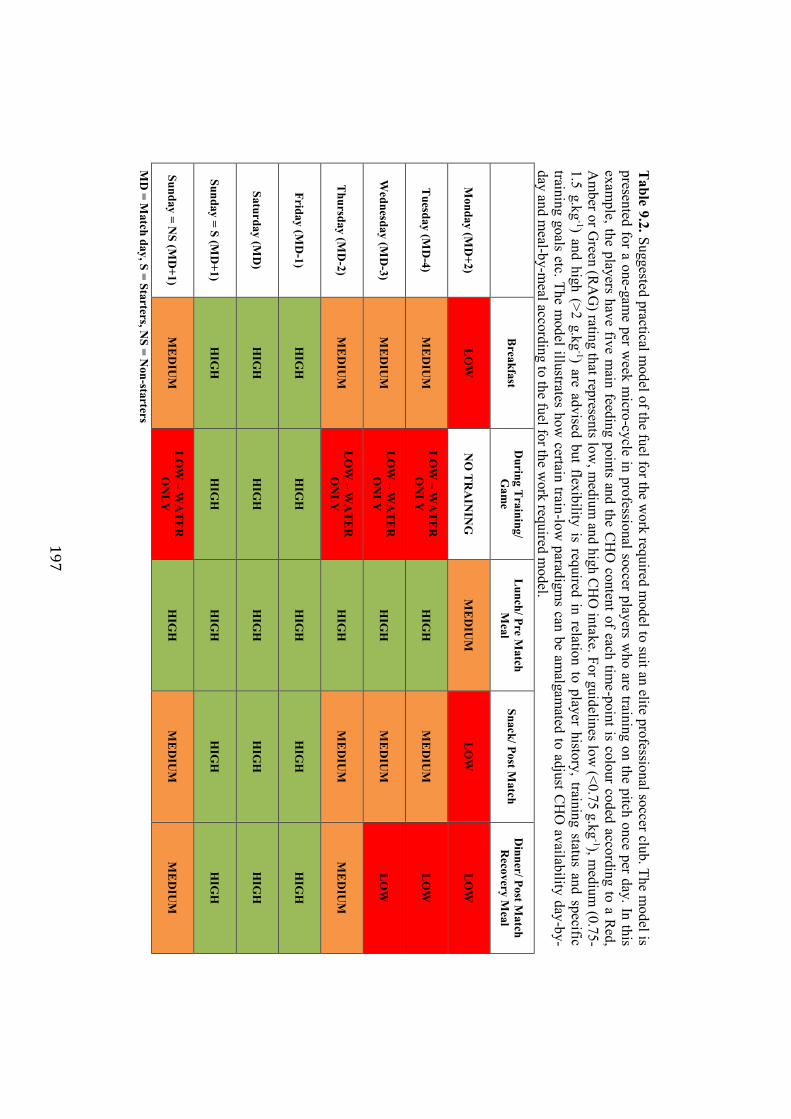
197
Table 9.2. Suggested practical m
odel of the fuel for the work required m
odel to suit an elite professional soccer club. The model is
presented for a one-game per w
eek micro-cycle in professional soccer players w
ho are training on the pitch once per day. In this exam
ple, the players have five main feeding points and the C
HO
content of each time-point is colour coded according to a R
ed, A
mber or G
reen (RA
G) rating that represents low
, medium
and high CH
O intake. For guidelines low
(<0.75 g.kg-1), m
edium (0.75-
1.5 g.kg-1) and high (>2 g.kg
-1) are advised but flexibility is required in relation to player history, training status and specific training goals etc. The m
odel illustrates how certain train-low
paradigms can be am
algamated to adjust CH
O availability day-by-
day and meal-by-m
eal according to the fuel for the work required m
odel.
B
reakfast D
uring Training/
Gam
e L
unch/ Pre Match
Meal
Snack/ Post Match
Dinner/ Post M
atch R
ecovery Meal
Monday (M
D+2)
LO
W
NO
TR
AIN
ING
M
ED
IUM
L
OW
L
OW
Tuesday (M
D-4)
ME
DIU
M
LO
W – W
AT
ER
O
NL
Y
HIG
H
ME
DIU
M
LO
W
Wednesday (M
D-3)
ME
DIU
M
LO
W – W
AT
ER
O
NL
Y
HIG
H
ME
DIU
M
LO
W
Thursday (M
D-2)
ME
DIU
M
LO
W – W
AT
ER
O
NL
Y
HIG
H
ME
DIU
M
ME
DIU
M
Friday (MD
-1) H
IGH
H
IGH
H
IGH
H
IGH
H
IGH
Saturday (MD
) H
IGH
H
IGH
H
IGH
H
IGH
H
IGH
Sunday = S (MD
+1) H
IGH
H
IGH
H
IGH
H
IGH
H
IGH
Sunday = NS (M
D+1)
ME
DIU
M
LO
W – W
AT
ER
O
NL
Y
HIG
H
ME
DIU
M
ME
DIU
M
MD
= Match day, S = Starters, N
S = Non-starters
198
9.4. GENERAL DISCUSSION
Although this thesis provides valuable information around the typical loading
patterns, average daily EE and daily energy and macronutrient intakes of English
Premier League soccer players, it must be acknowledged that this is highly
observational. The observational findings from this thesis have provided the
information to develop a practical nutritional model for elite soccer players.
However, experimental research studies discussed below are now required in
order to test the theoretical nutritional framework outlined from the results of this
thesis.
9.5. RECOMMENDATIONS FOR FUTURE RESEARCH
The data presented in this thesis has largely adopted assessments of training load
in order to make inferences on nutritional requirements. However, there is now a
definitive need to better understand the direct energy and CHO cost of soccer
specific training sessions across the weekly micro-cycle. To this end, a number
of suggested areas for future research are presented below:
1. Quantification of muscle glycogen utilization during field based training
where muscle biopsies are collected before and after a typical pitch based
training session.
2. Quantification of muscle glycogen availability across the weekly micro-cycle
where muscle biopsies are obtained on multiple days to examine if players’
habitual CHO intakes are sufficient to maintain glycogen availability day-to-day.
3. Examining the effects of undertaking an acute pitch based training session
with high or low CHO availability on the molecular regulators of training
adaptation, akin to the fuel for the work required principle.
4. Examining the chronic muscle and performance adaptations induced by
completing a block of soccer-specific training with high or low CHO availability.
199
In summary, the work undertaken in this thesis has quantified the typical
physical loading patterns of professional soccer players according to fixture
schedule, starting status and in special populations such as the goalkeeper and
injured player. Additionally, the quantification of energy intake and energy
expenditure (using DLW) also provides the first report of energy expenditure in
elite Premiership soccer players. When taken together, these data therefore
provide a theoretical framework for soccer-specific nutritional guidelines
especially in relation to the concept of nutritional (specifically, carbohydrate)
periodisation. Further studies are now required to quantify the specific energy
and carbohydrate cost of habitual training sessions completed.
200
CHAPTER 10
REFERENCES
201
Achten, J., & Jeukendrup, A.E. (2003). Heart rate monitoring: Applications and limitations. Sports Medicine, 33, 517-538. Andersson, H., Krustrup, P., & Mohr, M. (2007) Differences in movement pattern, heart rate and fatigue development in international versus national league matches of Swedish and Danish elite female soccer players [abstract]. Journal of Sports Science and Medicine, 6, 109. Anderson, L.F., Johansson, K., & Solvoll, K. (2002). Usefulness of a short food frequency questionnaire for screening of low intake of fruit and vegetable and for intake of fat. European Journal of Public Health, 12, 208-213. Arvidsson, D., Slinde, F., Larsson, S., & Hulthen, L. (2007). Energy cost of physical activities in children: validation of SenseWear armband. Medicine and Science in Sports and Exercise, 39, 2076-2084. Aughey, R.J. (2011). Applications of GPS technologies to field sports. International Journal of Sports Physiology and Performance, 6, 295-310. Akenhead, R., French, D., Thompson, K.G., & Hayes, P.R. (2014). The acceleration dependent validity and reliability of 10 Hz GPS. Journal of Science and Medicine in Sport, 17, 562-566. Akenhead, R., Harley, J.A., & Tweddle, S.P. (2016). Examining the external training load of an English Premier League football team with special reference to acceleration. Journal of Strength and Conditioning Research, 30, 2424-2432. Alexiou, H., & Coutts, A.J. (2008). A comparison of methods used for quantifying internal training load in woman soccer players. International Journal of Sports Physiology and Performance, 3, 320-330. Ali, A., & Farrally, M. (1991). Recording soccer players’ heart rates during matches. Journal of Sports Sciences, 9, 183-189. Ali, A., & Williams, C. (2009). Carbohydrate ingestion and soccer skill performance during prolonged intermittent exercise. Journal of Sports Sciences, 27, 1499-1508. Anderson, L., Orme, P., Di Michele, R., Close, G.L., Morgans, R., Drust, B., & Morton, J.P. (2015). Quantification of training load during one-, two- and three-game week schedules in professional soccer players from the English Premier League: implications for carbohydrate periodization. Journal of Sports Sciences, 4, 1-10. Anderson, L., Orme, P., Di Michele, R., Close, G.L., Milsom, J., Morgans, R., … Morton, J.P. (2016). Quantification of Seasonal Long Physical Load in Soccer Players With Different Starting Status From the English Premier League: implications for Maintaining Squad Physical Fitness. International Journal of Sports Physiology and Performance, 11, 1038-1046.
202
Anderson, L., Orme, P., Naughton, R.J., Close, G.L., Milsom, J., Rydings, D., … Morton, J.P. (2017a). Energy intake and expenditure of professional soccer players of the English Premier League: evidence of carbohydrate periodization. International Journal of Sports Nutrition and Exercise Metabolism, 27, 228-238. Anderson, L., Naughton, R.J., Close, G.L., Di Michele, R., Morgans, R., Drust, B., & Morton, J.P. (2017b). Daily distribution of macronutrient intakes of professional soccer players from the English Premier League. International Journal of Sports Nutrition and Exercise Metabolism, 28, 1-18. Areta, J.L., Burke, L.M., Ross, M.L., Camera, D.M., West, D.W., Broad, E.M., Coffey, V.G. (2013). Timing and distribution of protein ingestion during prolonged recovery from resistance exercise alters myofibrillar protein synthesis. The Journal of Physiology, 591, 2319-2331. Astrand, P., & Rodahl, K. (1986). Textbook of Work Physiology. New York: McGraw Hill. Bangsbo, J. (1994). Physiology of soccer – with special reference to fatigue. Acta Physiologica Scandinavica, 151, 1-155. Bangbo, J. (2008). Aerobic and Anaerobic training in soccer: with special emphasis on training of youth players (Fitness training in soccer I). Bagsvaerd: Ho & Storm. Bangsbo, J., Graham, T.E., Kiens, B., & Saltin, B. (1992a). Elevated muscle glycogen and anaerobic energy production during exhaustive exercise in man. Journal of Physiology, 451, 205-227.
Bangsbo, J., Norregaard, L., & Thorsoe, F. (1992b). The effect of carbohydrate diet on intermittent exercise performance. International Journal of Sports Medicine, 13, 152-157.
Bangsbo, J., Mohr, M., & Krustrup, P. (2006). Physical and metabolic demands of training and match-play in the elite football player. Journal of Sports Sciences, 24, 665-674. Bangsbo, J., Nørregaard, L., & Thørso, F. (1991). Activity profile of competition soccer. Canadian Journal of Sports Sciences, 16, 110-116. Barrett, S., Midgley, A., & Lovell, R. (2014). PlayerLoad: reliability, convergent validity, and influence of unit position during treadmill running. International Journal of Sports Physiology and Performance, 9, 945-952. Barros, R., Misuta, M.S., Menezes, R.P., Figueroa, P.J., Moura, F.A., Cunha, S.A., … Leite, N.J. (2007). Analysis of the distances covered by first division Brazilian soccer players obtained with automatic tracking method. Journal of Sports Science and Medicine, 6, 233-242.
203
Bartlett, J.D., Hawley, J.A., & Morton, J.P. (2015). Carbohydrate availability and exercise training adaptation: Too much of a good thing? European Journal of Sports Science, 15, 3-12. Barnes, C., Archer, D.T., Hogg, B., Bush, M., & Bradley, P.S. (2014). The evolution of physical and technical performance parameters in the English Premier League. International Journal of Sports Medicine, 35, 1095-1100. Balsom, P.D., Wood, K., Olsson, P., & Ekblom, B. (1999). Carbohydrate intake and multiple sprint sports: with special reference to football (soccer). International Journal of Sports Medicine, 20, 48-52.
Bettonviel, A.EO., Brinkmans, N.Y.J., Russcher, K., Wardenaar, F.C., & Witard, O.C. (2016). Nutritional status and daytime pattern of protein intake on match, post-match, rest and training days in senior professional and youth elite soccer players. International Journal of Sports Nutrition and Exercise Metabolism, 26, 285-293.
Berman, E.S., Fortson, S.L., Snaith, S.P., Gupta, M., Baer, D.S., Chery, I., … Speakman, J.R. (2012). Direct analysis of delta2H and delta180 in natural and enriched human urine using laser-based, off-axis integrated cavity output spectroscopy. Analytical Chemistry, 84, 9768-9773. Bloomfield, J., Polman, R., & O’Donoghue, P. (2007). Physical demands of different positions in FA Premier League Soccer. Journal of Sports Science and Medicine, 6, 63-70. Booth, F.W., & Thomason, D.B. (1991). Molecular and cellular adaptation of muscle in response to exercise perspectives of various models. Physiological Reviews, 71, 541-585. Borrensen, J., & Lambert, M.L. (2009). The quantification of training load, the training response and the effect on performance. Sports Medicine, 39, 779-795. Bouchard, C., Rankinen, T. (2001). Individual differences in response to regular physical activity. Medicine in Science Sport and Exercise, 33, 446-451. Boyd, L.J., Ball, K., & Aughey, R.J. (2011). The reliability of MinimaxX accelerometers for measuring physical activity in Australian football. International Journal of Sports Physiology and Performance, 10, 106-111. Braakhuis, A.J., Meredith, K., Cox, G.R., Hopkins, W.G., & Burke, L.M. (2003). Variability in estimation of self-reported dietary intake data from elite athletes resulting from coding by different sports dietitians. International Journal of Sport Nutrition, 13, 152-165. Brage, S., Brage, N., Franks, P.W., Ekelund, U., & Wareham, N.J. (2005). Reliability and validity of the combined heart rate and movement sensor Actiheart. European Journal of Clinical Nutrition, 59, 517-524.
204
Bradley, P.S., Di Mascio, M., Peart, D., Olsen, P., & Sheldon, B. (2010). High-intensity activity profiles of elite soccer players at different performance levels. Journal of Strength and Conditioning Research, 24, 2343-2351. Bradley, P.S., Lago-Penas, C., Rey, E., & Gomez Diaz, A. (2013). The effect of high and low percentage ball possession on physical and technical profiles in English FA premier league soccer matches. Journal of Sports Sciences, 31, 1261-1270. Bradley, P.S., Sheldon, W., Wooster, B., Olsen, P., Boanas, P., & Krustrup, P. (2009). High-intensity running in English FA Premier League soccer matches. Journal of Sports Sciences, 27, 159-168. Bradley, W.J., Cavanagh, B., Douglas, W., Donovan, T.F., Twist, C., Morton, J.P., & Close, G.L. (2015). Energy intake and expenditure assessed ‘in-season’ in an elite European rugby union squad. European Journal of Sports Sciences, 15, 469-479. Briggs, M.A., Cockburn, E., Rumbold, P.L.S., Rae, G., Stevenson, E.J., & Russell, M. (2015). Assessment of energy intake and energy expenditure of male adolescent academy-level soccer players during a competitive week. Nutrients, 7, 8392-8401. Brink, M.S., Visscher, C., Coutts, A.J., & Lemmink, K.A.P.M. (2012). Changes in perceived stress and recovery in overreached young elite soccer players. Scandinavian Journal of Medicine & Science in Sports, 22, 285-292. Brophy, R.H., Schmitz, L., Wright, R.W., Dunn, W.R., Parker, R.D., Andrish, J.T., … Spindler, K.P. (2012). Return to play and future ACL injury risk following ACL reconstruction in soccer athletes from the MOON group. American Journal of Sports Medicine, 40, 2517-2522. Borg, G. (1970). Perceived exertion as an indicator of somatic stress. Scandanavian Journal of Rehabilitation medicine, 2, 92-98. Borresen, J., & Lambert, M.I. (2009). The quantification of training load, the training response and the effect on performance. Sports Medicine, 39, 779-795. Buchheit, M., Al Haddad, H., Simpson, B.M., Palazzi, D., Bourdon, P.C., Di Salvo, V., & Mendez-Villanueva, A. (2014a). Monitoring accelerations with GPS in football: Time to slow down? International Journal of Sports Physiology and Performance, 9, 442-445. Buchheit, M., Allen, A., Poon, T.K., Modonutti, M., Gregson, W., & Di Salvo, V. (2014b). Integrating different tracking systems in football: multiple camera semi-automatic system, local position measurement and GPS technologies. Journal of Sports Sciences, 32, 1844-1857. Burke, L.M. (2015). Dietary assessment methods for the athlete: Pros and cons of different methods. Sports Science Exchange, 28, 1-6.
205
Burke, L.M., Hawley, J.A., Wong, S.H.S., & Jeukendrup, A.E. (2011). Carbohydrates for training and competition. Journal of Sports Sciences, 29, 17-27. Burke, L.M., Loucks, A.B., & Broad, N. (2006). Energy and carbohydrate for training and recovery. Journal of Sports Sciences, 24, 675-685. Burgess, D., & Drust, B. (2012). Developing a physiology-based sports science support strategy in the professional game. In M. Williams, (Eds.), Science and Soccer: Developing elite performers (pp. 372-389). Owon, UK: Routledge. Burgess, D.J., Naughton, G., & Norton, K.I. (2006). Profile of movement demands of national football players in Australia. Journal of Science and Medicine in Sport, 9, 334-341. Bush, M.D., Archer, D.T., Hogg, R., & Bradley, P.S. (2015a). Factors influencing physical and technical variability in the English Premier League. International Journal of Sports Physiology and Performance, 10, 865-872. Bush, M., Barnes, C., Archer, D.T., Hogg, B., & Bradley, P.S. (2015b). Evolution of match performance parameters for various playing positions in the English Premier League. Human Movement Science, 39, 1-11. Bussau, V.A., Fairchild, T.J., Rao, A., Steele, P., & Fournier, PA. (2002). Carbohydrate loading in human muscle: an improved 1 day protocol. European Journal of Applied Physiology, 87, 290-295.
Caccialanza, R., Cameletti, B., & Cavallaro, G. (2007). Nutritional intake of young Italian high-level soccer players: under-reporting is the essential outcome. Journal of Sports Sciences and Medicine, 6, 538-542.
Caldarone, G., Tranquilli, C., & Giampietro, M. (1990). Assessment of the nutritional state of top level football players. In. G. Santilli (Eds.), Sports medicine applied to football (pp. 133-141). Rome: Instituto dietitian Scienza della Sport del Coni.
Campbell, V.A., & Dodds, M.L. (1967). Collecting dietary information from groups of older people. Journal of the American Dietary Association, 51, 29-33. Carling, C., Bloomfield, J., Nielsen, L., & Reilly, T. (2008). The role of motion analysis in elite soccer: contemporary performance measurement techniques and work rate data. Sports Medicine, 38, 839-862. Castagna, C., Impellizzeri, F.M., Chaouachi, A., Bordon, C., & Manzi, V. (2011). Effect of training intensity distribution on aerobic fitness variables in elite soccer players: A case study. Journal of Strength and Conditioning Research, 25, 66-71.
206
Castellana, J., Casamichana, D., Calleja-Gonzalez, J., Roman, J.S., & Ostojic, S.M. (2011). Reliability and accuracy of 10 Hz GPS devices for short-distance exercise. Journal of Sports Science and Medicine, 10, 233-234. Ceesay, S.M., Prentice, A.M., Day, K.C., Murgatroyd, P.R., Goldberg, G.R., Scott, W., & Spurr, G.B. (1989). The use of heart rate monitoring in the estimation of energy expenditure: a validation study using indirect whole-bod calorimetry. British Journal of Nutrition, 61, 175-186. Chamari, K., Haddad, M., Wong del, P., Dellal, A., & Chaouachi, A. (2012). Injury rates in professional soccer players during Ramadan. Journal of Sports Sciences, 30, 93-102.
Chryssanthopoulos, C., Kontzinos, K., Petridou, A., & Maridaki, M. (2009). Nutritional intake of semi-professional soccer players during a week in the competitive season. Serbian Journal of Sports Sciences, 3, 19-27.
Chen, K.Y., & Bassett Jr, D.R. (2005). The technology of accelerometry-based activity monitors: Current and future. Medicine and Science in Sports and Exercise, 11, 490-500. Christensen, C., Frey, H., Foenstelien, E., Aadland, E. & Refsum, H. (1983). A critical evaluation of energy expenditure estimates based on individual O2 consumption/ heart rate curves and average daily heart rate. The American Journal of Clinical Nutrition, 37, 468-472. Churchward-Venne, T.A., Murphy, C.H., Longland, T.M., & Phillips, S.M. (2013). Role of protein and amino acids in promoting lean mass accretion with resistance exercise and attenuating lean mass loss during energy deficit in humans. Amino Acids, 45, 231-240. Convertino, V.A., Armstrong, L.E., Coyle, E.F., Mack, G.W., Sawka, M.N., Senay, L.C.Jr., & Sherman, W.M. (1996). American college of sports medicine position stand-exercise and fluid replacement. Medicine and Science in Sports and Exercise, 28, R1-R7. Coyle, E.F. (1992). Carbohydrate feeding during exercise. International Journal of Sports Medicine, 13, 126-128. Coyle, E.F. (2004). Fluid and fuel intake during exercise. Journal of Sports Sciences, 22, 39-59. Coutts, A.J., Rampinini, E., Marcora, S.M., Castagna, C., & Impellizzeri, F.M. (2009). Heart rate and blood lactate correlates of perceived exertion during small-sided soccer games. Journal of Science and Medicine in Sport, 12, 79-84. Coutts, A.J., & Duffield, R. (2010). Validity and reliability of GPS devices for measuring movement demands of team sports. Journal of Science and Medicine in Sport, 13, 133-135.
207
Cometti, G., Maffiuletti, N.A., Pousson, M., Chatard, J.C., & Maffulli, N. (2001). Isokinetic strength and anaerobic power of elite, subelite and amateur French soccer players. International Journal of Sport Medicine, 22, 45-51. Craig, H. (1961). Standard for Reporting Concentrations of Deuterium and Oxygen-18 in Natural Waters. Science, 133, 1833-1834. Cummins, C., Orr, R., O’Connor, H. & West, C. (2013). Global positioning systems (GPS) and microtechnology sensors in Team Sports: A systematic review. Sports Medicine, 43, 1025-1042. Davidson, L., McNeil, G., Haggarty, P., Smith, J.S., & Franklin, M.F. (1997). Free-living energy expenditure of adult men assessed by continuous heart-rate monitoring and doubly-labelled water. British Journal of Nutrition, 78, 695-708. Dellaserra, C.L., Gao, Y., & Ransdell, L. (2014). Use of integrated technology in team sports: A review of opportunities, challenges, and future directions for athletes. Journal of Strength and Conditioning Research, 28, 556-573. Di Salvo, V., Benito, P.J., Calderon, F.J., Di Salvo, M., & Piozzi, F. (2008). Activity profiles of elite goalkeepers during football match-play. Journal of Sports Medicine and Physical Fitness, 48, 443-446. Di Salvo, V., Collins, A., McNeil, B., & Cardinale, M. (2006). Validation of ProZone: A new video-based performance analysis system. International Journal of Performance Analysis in Sports, 6, 108-109. Di Salvo, V., Baron, R., Tschan, H., Calderon Montero, F.J., Bechl, N., & Pigozzi, F. (2007). Performance characteristics according to playing position in elite soccer. International Journal of Sports Medicine, 28, 222-227. Di Salvo, V., Gregson, W., Atkinson, G., Tordoff, P., & Drust, B. (2009). Analysis of high intensity activity in Premier League soccer. International Journal of Sports Medicine, 30, 205-212. Di Salvo, V., Baron, R., Gonzalàlez-Haro, C., Gormasz, C., Pigozzi, F., & Bachl, N. (2010). Sprinting analysis of elite soccer players during European Champions League and UEFA Cup matches. Journal of Sports Sciences, 28, 1489-1494. DeLany, J.P., & Lovejoy, J.C. (1996). Energy expenditure. Endocrinology Metabolism, 25, 831-846. Dellal, A., Chamari, K., Wong, D.P., Ahmaidi, S., Keller, D., Barros, R., … Carling, C. (2011). Comparisons of physical and technical performance in European soccer match-play: FA Premier League and La Liga. European Journal of Sports Science, 11, 51-59. Dellal, A., da Silva, C.D., Hill-Haas, S., Wond, D.P., Natali, A.J., De Lima, J.R., … Karim, C. (2012). Heart rate monitoring in soccer: interests and limits during
208
competitive match play and training, practical application. Journal of Strength and Conditioning Research, 26, 2890-2906. Dellal, A., Lago-Peñas, C., Rey, E., Chamari, K., & Orhant, E. (2013). The effects of a congested fixture period on physical performance, technical activity and injury rate during matches in a professional soccer team. British Journal of Sports Medicine, 49, 390-394. Dellal, A., Owen, A., Wong, D.P., Krustrup, P., van Exsel, M., & Mallo, J. (2012). Technical and physical demands of small vs. large sided games in relation to playing position in elite soccer. Human Movement Science, 31, 957-969. Djaoui, L., Wong, D.P., Pialoux, V., Hautier, C., Da Silva, C.D., Chamari, K., & Dellal, A. (2013). Physical activity during a prolonged congested period in a top-class European football team. Asian Journal of Sports Medicine, 5, 47-53.
do Prado, W.L., Botero, J.P., Guerra, R.L.F., Rodrigues, C.L., Cuvello, L.C., & Damaso, A.R. (2006). Anthropometric profile and macronutrient intake in professional Brazilian soccer players according to their field position. Revista Brasileira de Medicina Esporte, 12, 52-55.
Dupont, G., Nédélec, M., McCall, A., McCormack, D., Berthoin, S., & Wisløff, U. (2010). Effect of 2 soccer matches in a week on physical performance and injury rate. American Journal of Sports Medicine, 38, 1752-1758. Drust, B., Cable, N.T., & Reilly, T. (2000). Investigation of the effects of the pre-cooling on the physiological response to soccer-specific intermittent exercise. European Journal of Applied Physiology, 81, 11-17. Drust, B., Atkinson, G., & Reilly, T. (2007). Future perspectives in the evaluation of the physiological demands of soccer. Sports medicine, 37, 783-805. Ebine, N., Rafamantanantsoa, H.H., Nayuki, Y., Yamanaka, K., Tashima, K., Ono, T., Saitoh, S., & Jones, P.J. (2002). Measurement of total energy expenditure by the doubly labeled water method in professional soccer players. Journal of Sports Sciences, 20, 391-397. Edwards, J.E., Lindeman, A.K., Mikesky, A.E., & Stager, J.M. (1993). Energy balance in highly trained female endurance runners. Medicine and Science in Sport and Exercise, 25, 1398-1404. Egan, B., Carson, B.P., Garcia-Roves, P.M., Chibalin, A.V., Sarsfield, F.M., Barron, N., … O’Gorman, D.J. (2010). Exercise intensity-dependent regulation of PGC-1α mRNA abundance is associated with differential activation of upstream signalling kinases in human skeletal muscle. Journal of Physiology, 588, 1779-1790.
209
Esteve-Lanao, J., San Juan, A.F., Earnest, C.P., Foster, C., & Lucia, A. (2005). How do endurance runners actually train? Relationship with competition performance. Medicine and Science in Sports and Exercise, 37, 496-504. Faude, O., Koch, T., & Meyer, T. (2012). Straight sprinting is the most frequent action in goal situations in professional football. Journal of Sports Sciences, 30, 625-631. Ferguson-Stegall, L., McCleave, E.L., Ding, Z., Doerner, P.G., Wang, B., Liao, Y.H. … Ivy, J.L. (2011). Postexercise carbohydrate-protein supplementation improves subsequent exercise performance and intracellular signaling for protein synthesis. Journal of Strength and Conditioning Research, 25, 1210-1224. Fernandes, O., Caixinha, P., & Malta, P. (2007). Techno-tactics and running distance analysis using one camera. Journal of Sports Science and Medicine, 6, 204-205. Fernandes, S.R. (2002). Heart rate during soccer match play. Doctoral thesis, Universidade Federal de Sao Paulo, Sao Paulo, Brazil. Foskett, A., Ali, A., & Gant, N. (2009). Caffeine enhances cognitive function and skill performance during simulated soccer activity. International Journal of Sports Nutrition and Exercise Metabolism, 19, 410-423. Foskett, A., Williams, C., Boobis, L., & Tsintzas, K. (2008). Carbohydrate availability and energy metabolism during intermittent running. Medicine and Science in Sports and Exercise, 40, 96-103. Foster, C., Florhaug, J.A., Franklin, J., Gottschall, L., Hrovatin, L.A., Parker, S., … Dodge, C. (2001). A new approach to monitoring exercise training. Journal of Strength and Conditioning Research, 15, 109-115. Fruin, M., & Rankin, J. (2004). Validity of a multi-sensor armband in estimating rest and exercise energy expenditure. Medicine and Science in Sport and Exercise, 36, 1063-1069. Gabbett, T.J. (2004). Influence of training and match intensity on injuries in rugby league. Journal of Sports Science, 22, 409.417. Gabbett, T.J. (2016). The training-injury prevention paradox: should athletes be training smarter and harder? British Journal of Sports Medicine, 50, 273-280. Galbo, H. (1983). Hormonal and metabolic adaptations to exercise. New York: Thime-Stratton. Galbo, H. (1992). Exercise physiology: Humoral function. Sport Science Reviews, 1, 65-93.
210
Garcia, E.S., Espirito-Santo, L.C., Garcia, A.M.C., & Nunes, V. (2005). Energy expenditure of professional soccer players during official games. Medicine and Science in Sports and Exercise, 37, 87.
Garrido, G., Webster, A.L., & Chamorro, M. (2007). Nutritional adequacy of different menu settings in elite Spanish adolescent soccer players. International Journal of Sports Nutrition and Exercise Metabolism, 11, 421-432.
Gaudino, P., Iaia, F.M., Alberti, G., Strudwick, A.J., Atkinson, G., & Gregson, W. (2013). Monitoring training in elite soccer players: systematic bias between running speed and metabolic power data. International Journal of Sports Medicine, 34, 963-968. Gersovitz, M., Madden, J.P., & Smiciklas-Wright, H. (1978). Validity of the 24-hr dietary recall and seven-day record for group comparisons. Journal of American Dietary Association, 73, 48-55.
Giada, F., Zuliani, G., Baldo-Enzi, G., Palmieri, E., Volpato, S., Vitale, E., … Colozzi, A., (1996). Lipoprotein profile, diet and body composition in athletes practicing mixed and anaerobic activates. Journal of Sports Medicine and Physical Fitness, 36, 211-216.
Gillen, J.B., & Gibala, M.J. (2014). Is high-intensity interval training a time-efficient exercise strategy to improve health and fitness? Applied Journal of Physiology, Nutrition and Metabolism, 39, 409-412. Gunnarsson, T.P., Bendiksen, M., Bischoff, R., Christensen, P.M., Lesivig, B., Madsen, K., … Bangsbo, J. (2013). Effect of whey protein- and carbohydrate-enriched diet on glycogen resynthesis during the first 48 h after a soccer game. Scandinavian Journal of Medicine & Science in Sports, 23, 508-515. Grant, J.A. (2013). Updating recommendations for rehabilitation after ACL reconstruction: A review. Clinical Journal of Sports Medicine, 23, 501-502. Hackett, A.F. (2007). Dietary survey methods. In: MacLaren, D (ed.) Nutrition and Sports 1ed. UK. Hackett, A.F. (2009). Recording dietary intake as an aid to exercise performance. UK Strength and Conditioning Association, 16, 12-16. Harley, J.A., Lovell, R.J., Barnes, C.A., Portas, M.D., & Weston, M. (2011). The interchangeability of GPS and semiautomated video-based performance data during elite soccer match play. Journal of Strength and Conditioning Research, 25, 2334-2336. Harper, L.D., Stevenson, E.J., Rollo, I., & Russell, M. (2017). The influence of a 12% carbohydrate-electrolyte beverage on self-paced soccer-specific exercise performance. Journal of Science and Medicine in Sport, (epub ahead of print).
211
Haruna, Y., Suzuki, Y., Kawakubo, K., Yanagibori, R., & Gunji, A. (1994). Decremental reset in basal metabolism during 20-days bed rest. Acta Physiologica Scandinavica Supplementum, 616, 43-49. Hautala, A.J., Kiviniemi, A.M., Makikallio, T.H., Kinnunen, H., & Nissila, S. (2006). Individual differences in the responses to endurance and resistance training. European Journal of Applied Physiology, 96, 535-542. Hawley, J.A., & Morton, J.P. (2014). Ramping up the signal: promoting enurance training adaptation in skeletal muscle by nutritional manipulation. Clinical Experimental Pharmacology and Physiology, 41, 608-613. Helgerud, J., Engen, L.C., Wisløff et al. (2001). Aerobic training improves soccer performance. Medicine and Science in Sport & Exercise, 33, 1925-1931. Hewitt, A., Wither, R., & Lyons, K. (2007). Match analyses of Australian international woman soccer players using an athlete tracking device. Journal of Sports Science and Medicine, 6, 107. Hill-Haas, S.V., Dawson, B., Impellizzeri, F.M., & Coutts, A.J. (2011). Physiology of small-sided games training in football: A systematic review. Sports Medicine, 41, 199-220. Hills, A.P., Mokhtar, N., & Byrne, N.M. (2014). Assessment of physical activity and energy expenditure: an overview of objective measures. Frontiers in Nutrition, 16, 1-5. Holmes, L. (2002). A physiological analysis of work-rate in English female football players. Insight FA Coaches Associational Journal, 5, 55-59. Hoff, J., Wisloff, U., Engen, L.C., Kemi, O.J., & Helgrud, J. (2002). Soccer specific aerobic endurance training. British Journal of Sports Medicine, 36, 218-221. Horowitz, J.F., Mora-Rodriguez, R.O., Byerley, L., & Coyle, E.F. (1997). Lipolytic suppression following carbohydrate ingestion limits fat oxidation during exercise. American Journal of Physiology, 273, 768 – 775. Hulston, C.J., Venables, M.C., Mann, C.H., Martin, A., Philp, A., Barr, K., Jeukendrup, A.E. (2010). Training with low muscle glycogen enhances fat metabolism in well trained cyclists. Medicine and Science in Sports and Exercise, 42, 2046-2065. Iaia, F.M. (2009). High-intensity training in football. International Journal of Sports Physiology and Performance, 4, 291-306. Iaia, F.M., Thomassen, M., Kolding, H., Gunnarsson, T., Rostgaard, T., Nordsborg, N., … Bangsbo, J. (2008). Reduced volume but increased training intensity elevates muscle Na+-K+ pump alpha1-subunited and NHE1 expression
212
as well as short-term work capacity in humans. American Journal of Physiology and Regulatory Integrative and Comparative Physiology, 294, 966-974. Iaia, F.M., Fiorenza, M., Perri, E., Alberti, G., Millet, G.P., & Bangsbo, J. (2015). The effect of two speed endurance regimes on performance of soccer players. PLoS One, 10, 1-16.
Iglsias-Gutierrez, E., Garcia-Roves, P.M., Rodriquez, C., Braga, S., Garcia-Zapico, P., & Patterson, A.M. (2005). Food habits and nutritional status assessment of adolescent soccer players. A necessary and accurate approach. Canadian Journal of Applied Physiology, 30, 18-32.
Iglesias-Gutierrez, E., Garcia, A., Garcia-Zapico, P., Perez-Landaluce, J., Patterson, A.M., & Garcia-Roves, P.M. (2011). Is there a relationship between the playing position of soccer players and their food and macronutrient intake? Applied Physiology of Nutrition and Metabolism, 37, 225-232.
Impellizzeri, F.M., Marcora, S.M., Castagna, C., et al. (2006). Physiological and performance effects of generic versus specific aerobic training in soccer players. International Journal of Sports Medicine, 27, 483-492. Impellizzeri, F.M., Rampinini, E., Coutts, A.J., Sassi, A., & Marcora, S.M. (2004). The use of RPE-based training load in soccer. Medicine in Science Sports and Exercise, 36, 1042-1047. Impellizzeri, F.M., Rampinini, E., & Marcora, S.M. (2005). Physiological assessment of aerobic training in soccer. Journal of Sports Science, 23, 583-592. Impey, S.G., Hammond, K.M., Shepherd, S.O., Sharples, A.P., Stewart, C., Limb, M., … Morton, J.P. (2016). Fuel for the work required: a practical approach to amalgamating train-low paradigms for endurance athletes. Physiological Reports, 4, e12803. International Atomic Energy Agency. (2009). Assessment of body composition and total energy expenditure in humans using stable isotope techniques. IAEA human health series 3. Vienna, Austria. Ivy, J.L. (1998). Glycogen resynthesis after exercise: effect of carbohydrate intake. International Journal of Sports Medicine, 19, 142-145. Ivy, J.L. (2004). Regulation of muscle glycogen repletion, muscle protein synthesis and repair following exercise. Journal of Sports Science and Medicine, 1, 131-138. Ivy, J.L., Katz, A.L., Cutler, C.L., Sherman, W.M., & Coyle, E.F. (1988a). Muscle glycogen resynthesis after exercise: effect of time of carbohydrate ingestion. Journal of Applied Physiology, 64, 1480-1485.
213
Ivy, J, L., Lee, M.C., Brozinick, J.T., JR., & Reed, M.J. (1988b). Muscle glycogen storage after different amounts of carbohydrate ingestion. Journal of Applied Physiology, 65, 2018-2023. Jacobs, I., Westlin, N., Karlsson, J., Rasmusson, M., & Houghton, B. (1982). Muscle glycogen and diet in elite soccer players. European Journal of Applied Physiology, 48, 297-302. Jakicic, J., Marcus, M., Gallagher, K., Randall, C., Thomas, E., Goss, F., & Robertson, R. (2004). Evaluation of the SenseWear Pro armband to assess energy expenditure during exercise. Medicine and Science in Sport and Exercise, 36, 897-904. James, N. (2006). The role of notational analysis in soccer coaching. International Journal of Sports Science & Coaching, 1, 185-198. Jennings, D., Cormack, S., Coutts, A.J., Boyd, L.J., & Aughey, R.J. (2010). Variability of GPS units for measuring distance in team sport movements. International Journal of Sports Physiology and Performance, 5, 565-569. Jentjens, R., & Jeukendrup, A. (2003). Determinants of post-exercise glycogen sysnthesis during short-term recovery. Sports Medicine, 33, 117-144. Jeong, T., Bartlett, J.D., Joo, C., Louhelainen, J., Close, G.L., Morton, J.P., & Drust. B. (2015). Acute simulated soccer-specific training increases PGC-1α mRNA expression in human skeletal muscle. Journal of Sports Sciences, 33, 1493-1503. Johannsen, D., Calabro, M., Stewart, J., Franke, W., Rood, J., & Welk, G. (2010). Accuracy of armband monitors for measuring daily energy expenditure in healthy adults. Medicine and Science in Sports and Exercise, 42, 2134-2140. Johnston, R.J., Watsford, M.L., Kelly, S.J., Pine, M.J., & Spurrs, R.W. (2014). Validity and interunit reliability of 10 Hz and 15 Hz GPS units for assessing athlete movement demands. The Journal of Strength and Conditioning Research, 26, 758-765. Kelly, S.J., Murphy, A.J., Watsford, M.L., Austin, D., & Rennie, M. (2015). Reliability and validity of sports accelerometers during static and dynamic testing. International Journal of Sports Physiology and Performance, 10, 106-111. Kristjansdottir, A.G., Andersen, L.F., Haraldsdottir, J., de Almeida, M.D., & Thorsdottir, I. (2006). Validity of a questionnaire to assess fruit and vegetable intake in adults. European Journal of Clinical Nutrition, 60, 408-415. Krustrup, P., Mohr, M., Steensberg, A., Bencke, J., Kjer, M., & Bangsbo, J. (2006). Muscle and blood metabolites during a soccer game: Implications for sprint performance. Physical Fitness and Performance, 38, 1165-1174.
214
Krustup, P., Ørtenblad, N., Nielsen, J., Nybo, L., Gunnarsson, T.P., Iaia, F.M., … Bangsbo, J. (2011). Maximal voluntary contraction force, SR function and glycogen resynthesis during the first 72 h after a high-level competitive soccer game. European Journal of Applied Physiology, 111, 2987-2995. Krustrup, P., Mohr, M., Amstrup, T., Rysgaard, T., Johansen, J., Steensberg, A., … Bangsbo J. (2003). The yo-yo intermittent recovery test: physiological response, reliability, and validity. Medicine and Science in Sports and Exercise Science, 35, 697-705. Krustrup, P., Mohr, M., Ellingsgaard, H., & Bangsbo, J. (2005). Physical demands during an elite female soccer game: importance of training status. Medicine and Science in Sports and Exercise Science, 37, 1242-1248. Lacome, M., Simpson, B.M., Cholley, Y., Lambert, P., & Buchheit, M. (2017). Small-sided games in elite soccer: does one size fits all? International Journal of Sports Physiology and Performance, 17, 1-24. Lambert, M.I., Mbambo, Z.H., & St Clair Gibson, A. (1998). Heart rate during training and competition for long distance running. Journal of Sports Sciences, 16, 85-90. LaMonte, M.J., & Ainsworth, B.E. (2001). Quantifying energy expenditures and physical activity in the context of dose response. Medicine and Science in Sport and Exercise, 33, 370-380. Larsson, P. (2003). Global positioning system and sport-specific testing. Sports Medicine, 33, 1093-1101. Laursen, P.B., & Jenkins, D.G. (2002). The scientific basis for high-intensity interval training: optimising training programmes and maximizing performance in highly trained endurance athletes. Sports Medicine, 32, 53-73. Liden, C., Wolowicz, M., Stivoric, J., Teller, A., Kasabach, C., Vishnubhalta, S., … Boehmke, S. (2002a). Characterization and implications of the sensors incorporated into the SenseWear armband for energy expenditure and activity detection. Bodymedia Incorporated White Papers, 7, 1-7. Liden, C., Wolowicz, M., Stivoric, J., Teller, A., Vishnubhalta, S., Pelletier, R., … Boehmke, S. (2002b). Accuracy and reliability of the SenseWear armband as an energy expenditure assessment device. Body Media Incorporated White Papers, 8, 1-15. Livesey, G., & Elia, M. (1998). Estimation of energy expenditure, net carbohydrate utilization, and net fat oxidation and synthesis by indirect calorimetry: evaluation of errors with special reference to the detailed composition of fuels. American Journal of Clinical Nutrition, 47, 608-628.
215
Livingstone, M.B.E. (1997). Heart rate monitoring: The answer for assessing energy expenditure and physical activity in population studies? British Journal of Nutrition, 78, 869-871. Maddison, R., & Ni Mhurchu, C. (2009). Global positioning system: a new opportunity in physical activity measurement. International Journal of Behavioral Nutrition and Physical Activity, 6, 73. Magkos, F., & Yannakoulia, M. (2003). Methodology of dietary assessment in athletes: concepts and pitfalls. Current Opinion in Clinical Nutrition & Metabolic Care, 6, 539-549. Malone, J.J., Di Michele, R., Morgans, R., Burgess, D., Morton, J.P., & Drust, B. (2015). Seasonal training-load quantification in elite English premier league soccer players. International Journal of Sports Physiology and Performance, 10, 489-497. Malone, J.J., Lovell, R., Varley, M.C., & Coutts, A.J. (2017a). Unpacking the black box: Applications and considerations for using GPS devices in sport. International Journal of Sports Physiology and Performance, 12, 218-226. Malone, S., Owen, A., Mendes, B., Hughes, B., Collins, K., & Gabbett, T. (2017b). High-speed running and sprinting as an injury risk factor in soccer: can well developed physical qualities reduce the risk? Journal of Science and Medicine in Sport, (epub ahead of print). Manore, M., & Thompson, J. (2006). Energy requirements of the athlete: Assessment and evidence of energy efficiency. In L. Burke & V. Deakin (Eds.), Clinical sports nutrition (3rd edition) (pp. 113-134). Sydney, NSW: McGraw-Hill. Manzi, V., Bovenzi, A., Impellizzeri, F.M., Carminati, I., & Castagna, C. (2013). Individual training-load and aerobic-fitness variables in premiership soccer players during the precompetitive season. Journal of Strength and Conditioning Research, 27, 631-636. Manzi, V., Iellamo, F., Impellizzeri, F.M., D’Ottavio, S., & Castagna, C. (2009). Relation between individualized training impulses and performance in distance runners. Medicine and Science in Sport and Exercise, 41, 2090-2096. Manzi, V., D’Ottavio S., Impellizzeri, F.M., Chaouachi, A., Chamari, K., & Castagna, C. (2010). Profile of weekly training load in elite male professional basketball players. Journal of Strength and Conditioning Research, 24, 399-406. Martin, C.K., Han, H., Coulon, S.M., Allen, H.R., Champagne, C.M., & Anton, S.D. (2009). A novel method to remotely measure food intake of free-living people in real-time: The remote food photography method (RFPM). British Journal of Nutrition, 101, 446-456.
216
Matthews, D.K., Fox, E.L., & Tanzi, D. (1996). Physiological responses during exercise and recovery in a football uniform. Journal of Applied Physiology, 26, 611-615. Maughan, R.J. (1997). Energy and macronutrient intakes of professional football (soccer) players. British Journal of Sports Medicine, 31, 45-47. Macnaughton, L.S., Wardle, S.L., Witard, O.C., McGlory, C., Hamilton, D.L., Jeromson, S., … Tipton, K.D. (2016). The response of muscle protein synthesis following whole-body resistance exercise is greater following 40 g than 20 g of ingested whey protein. Physiological Reports, 4, e12893. Mamerow, M.M., Mettler, J.A., English, K.L., Casperson, S.L., Arentson-Lantz, E., Sheffield-Moore, M., … Paddon-Jones, D. (2014). Dietary protein distribution positively influences 24-h muscle protein synthesis in healthy adults. Journal of Nutrition, 144, 876-880. McCrory, M.A., Mole, P.A., Nommsen-Rivers, L.A., & Dewey, K.G. (1997). Between-day and within-day variation in the relation between heart rate and oxygen consumption: effect on the estimation of energy expenditure by heart-rate monitoring. American Journal of Clinical Nutrition, 66, 18-25. Milsom, J., Barreira, P., Burgess, D.J., Iqbal, Z., & Morton, J.P. (2014). Case study: Muscle atrophy and hypertrophy in a premier league soccer player during rehabilitation from ACL injury. International Journal of Sports Nutrition and Exercise Metabolism, 24, 543-552. Milsom, J., Naughton, R., O’Boyle, A., Iqbal, Z., Morgans, R., Drust, B., & Morton, J.P. (2015). Body composition assessment of English Premier League soccer players: a comparative DXA analysis of first team, U21 and U18 squads. Journal of Sports Sciences, 33, 1799-1806. Miyagi, O., Ohashi, J., & Kitagawa, K. (1999). Motion characteristics of an elite soccer player during a game: communications to the Fourth World Congress of Science and Football. Journal of Sports Science, 17, 816. Melanson, E.L., & Freedson, P.S. (1996). Physical activity assessment: a review of methods. Critical Reviews in Food Science and Nutrition, 36, 385-396. Melanson, E.L., Swibas, T., Kohrt, W.M., Catenacci, V.A., Creasy, S.A., Plasqui, G., … Berman, E.S.F. (2017). Validation of the doubly labeled water method using off-axis integrated cavity output spectroscopy and isotope ratio mass spectrometry. American Journal of Physiology, Endocrinology and Metabolism. (epub ahead of print). Mohr, M., Krustrup, P., & Bangsbo, J. (2003). Match performance of high-standard soccer players with special reference to development of fatigue. Journal of Sports Sciences, 21, 439-449.
217
Mohr, M., Krustrup, P., Nybo, L., Nielsen, J.J., & Bangsbo, J. (2004). Muscle temperature and sprint performance during soccer matches – beneficial effect of re-warm-up at half-time. Scandinavian Journal of Medicine & Science in Sports, 14, 156-162. Montoye, H.J., Kemper, H.C.G., & Saris, W.H.M. (1996). Measuring physical activity and energy expenditure. Champaign (IL): Human Kinetics. Moore, D.R., Churchward-Venne, T.A., Witard, O., Breen, L., Burd, N.A., Tipton, K.D., & Phillips, S.M. (2014). Protein ingestion to stimulate myofibrilar protein synthesis requires greater relative protein intakes in healthy older versus younger men. Journal of Gerontology Biological Sciences & Medical Sciences, 70, 57-62. Morehen, C.M., Bradley, W.J., Clarke, J., Twist, C., Hambly, C., Speakman, J.R., … Close, G.L. (2016). The assessment of total energy expenditure during a 14-day in-season period of professional rugby league players using the Doubly Labelled Water method. International Journal of Sport Nutrition and Exercise Metabolism, 26, 464-472. Morgan, W.P. (1973). Psychological factors influencing perceived exertion. Medicine and Science in Sports, 5, 97-103. Morgans, R., Orme, P., Anderson, L., & Drust, B. (2014a). Principles and practices of training in soccer. Journal of Sport and Health Science, 3, 251-257. Morgans, R., Orme, P., Anderson, L., Drust, B., & Morton, J.P. (2014b). An intensive winter fixture schedule induces a transient fall in salivary IgA in English premier league soccer players. Research in Sports Medicine, 22, 346-354. Morgans, R., Adams, D., Mullen, R.H., McLellan, C., & Williams, M.D. (2014c). Technical and physical performance over and English Championship league season. International Journal of Sport Science and Coaching, 14, 493-503. Morgans, R., Di Michele, R., & Drust, B. (2017). Soccer match-play represents an important component of the power training stimulus in Premier League players. International Journal of Sports Physiology and Performance, 19, 1-12. Morton, J.P., Croft, L., Bartlett, J.D., Maclaren, D.P.M., Reilly, T., Evens, L., … Drust, B. (2009). Reduced carbohydrate availability does not modulate training-induced heat shock protein adaptations but does up regulate oxidative enzyme activity in human skeletal muscle. Journal of Applied Physiology, 106, 1513-1521. Morton, J.P., Robertson, C., Sutton, L., MacLaren, D.P.M. (2010). Making the weight: a case study from professional boxing. International Journal of Sport Nutrition and Exercise Metabolism, 20, 80-85.
218
Nagy, K. (1983). The Doubly Labelled Water (3HH180) Method: a Guide to its Use. Los Angeles, CA: UCLA Publication 12-1417. Naughton, R.J., Drust, B., O’Boyle, A., Morgans, R., Abayomi, J., Davies, L.G., Morton, J.P., & Mahon, E. (2016). Daily distribution of carbohydrate, protein and fat intake in elite youth academy soccer players over a 7-day training period. International Journal of Sports Nutrition and Exercise Metabolism, 26, 473-480. Nédélec, M., McCall, A., Carling, C., Legall, F., Berthoin, S., Dupont, G. (2014). Recovery in soccer: part I – post-match fatigue and time course of recovery. Sports Medicine, 42, 997-1015. Odetoyinbo, K., Wooster, B., & Lane, A. (2007). The effect of a succession of matches on the activity profiles of professional soccer players. Journal of Sports Science and Medicine, 6, 16.
Ono, M., Kennedy, E., Reeves, S., & Cronin, L. (2012). Nutrition and culture in professional football. A mixed method approach. Appetite, 58, 98-104.
Owen, A.L., Wong, D.P., Dunlop, G., Groussard, C., Kebsi, W., Dellal, A., … Zouhal, H. (2014). High intensity training and salivary immunoglobulin-a responses in professional top-level soccer players: effect of training intensity. Journal of Strength and Conditioning Research, 30, 2460-2469.
Owen, A.L., Wong, D.P., McKenna, M., & Dellal, A. (2011). Heart rate responses and technical comparisons between small- vs. Large-sided games in elite professional soccer. Journal of Strength and Conditioning Research, 25, 2104-2110.
O’Brien, M.J., Viguie, C.A., Mazzeo, R.S., & Brooks, G.A. (1993). Carbohydrate dependence during marathon running, Medicine and Science in Sports & Exercise, 25, 1009-1017. Park, J., Kazuko, I.T., Kim, E., Kim, J., & Yoon, J. (2014). Estimating free-living human energy expenditure: Practical aspects of the doubly labeled water method and its applications. Nutrition Research and Practice, 8, 241-248. Rampinini, E., Alberti, C., Florenza, M., Riggio, M., Sassi, R., Borges, T.O., & Coutts, A.J. (2015). Accuracy of GPS devices for measuring high-intensity running in field based team sports. International Journal of Sports Medicine, 36, 49-53. Rampinini, E., Coutts, A.J., Castagna, C., Sassi, R., & Impellizzeri, F.M. (2007). Variation in top level soccer match performance. International Journal of Sports Medicine, 28, 1018-1024. Rampinini, E., Impellizzeri, F.M., Castagna, C., Coutts, A.J., & Wisløff, U. (2009). Technical performance during soccer matches of the Italian Serie A League: Effect of fatigue and competitive level. Journal of Science and Medicine in Sport, 12, 227-233.
219
Randers, M.B., Mujika, I., Hewitt, A., Santisteban, J., Bischoff, R., Solano, R., … Mohr, M. (2010). Application of four different football match analysis systems: A comparative study. Journal of Sports Sciences, 28, 171-182. Randers, M.B., Jensen, J.M., & Krustrup, P. (2007). Comparison of activity profile during matches in the Danish and Swedish premier league and matches in Nordic royal league tournament. Journal of Sports Science and Medicine, 6, 16. Rebro, S.M., Patterson, R.E., Kristal, A.R., & Cheney, C.L. (1998). The effect of keeping food records on eating patterns. Journal of the American Dietary Association, 98, 1163-1165.
Reeves, S., & Collins, K. (2003). The nutritional and anthropometric status of Gaelic football players. International Journal of Sport Nutrition and Exercise Metabolism, 13, 539-548.
Reilly, T. (1996). Fitness assessment. In T. Reilly (Ed.), Science and soccer (pp. 25-47). London: E & FN Spon. Reilly, T., & Thomas, V. (1979). Estimated daily energy expenditures of professional association footballers. Ergonomics, 22, 541-548. Reilly, T. (2007). The training process. In T. Reilly (Ed.), The Science of Training-Soccer: A Scientific Approach to Developing Strength, Speed and Endurance (pp. 1-19). London: Routledge. Reinzi, E., Drust, B., Reilly, T., Carter, J.E., & Martin, A. (2000). Investigation into anthropometric and work-rate profiles of elite South American international soccer players. Journal of Sports Medicine and Physical Fitness, 40, 162-169. Res, P.T., Groen, B., Pennings, B., Beelen, M., Wallis, G.A., Gijsen, A.P., … Van Loon, L.J. (2012). Protein ingestion before sleep improves postexercise overnight recovery. Medicine and Science in Sports and Exercise, 44, 1560-1569. Richter, E., Kiens, B., Mizuno, M., & Strange, S. (1989). Insulin action in human thighs after one-legged immobilization. Journal of Applied Physiology, 67, 19-23.
Rico-Sanz, J., Frontera, W.R., Mole, P.A., Rivera, M.A., Rivera-Brown, A., & Meredith, C.N. (1998). Dietary and performance assessment of elite soccer players during a period of intense training. International Journal of Sports Nutrition, 8, 230-240.
Ruiz, F., Irazusta, A., Gil, S., Irazusta, J., Casis, L., & Gil, J. (2005). Nutritional intake in soccer players of different ages. Journal of Sports Sciences, 23, 235-242.
220
Russell, M., & Kingsley, M. (2014). The efficacy of acute nutritional interventions on soccer skill performance. Sports Medicine, 44, 957-970.
Russel, M., & Pennock, A. (2011). Dietary analysis of young professional soccer players for 1 week during the competitive season. Journal of Strength and Conditioning Research, 25, 1816-1823.
Russell, M., Sparkes, W., Northeast, J., Cook, C.J., Love, T.D., Bracken, R.M., & Kilduff, L.P. (2016). Changes in acceleration and deceleration capacity throughout professional soccer match play. Journal of Strength and Conditioning Research, 30, 2839-2844.
Rohode, H., & Espersen, T. (1988). Work intensity during soccer training and match-play. In T. Reilly, A. Lees, K. Davids, & W.J. Murphy (Eds.), Science and Football (1st Edition) (pp. 68-75). London, United Kingdom: E and FN Spon.
Saltin, B. (1973). Metabolic fundamentals in exercise. Medicine and Science in Sports, 5, 137-146.
Sassi, R., Reilly, T., & Impellizzeri, F.A. (2005). A comparison of small-sided games and interval training in elite professional soccer players. In T. Reilly, J. Cabri, & A. Duarte (Eds.), Science and Football V (1st Edition) (pp. 341-343). London, United Kingdom: Routledge.
Schena, F., Pattini, A., & Mantovanelli, S. (1995). Iron status in athletes involved in endurance and prevalently anaerobic sports. In. C. V. Kies & J.A. Driskell (Eds.), Sports nutrition: Minerals and electrolytes. (pp. 65-79). Boca Raton, FL: CRC Press.
Schoeller, D.A. (1988). Measurement of energy expenditure in free-living humans by using doubly labeled water. Journal of Nutrition, 118, 1278-1289. Schoeller, D.A., & Delany, J.P. (1998). Human energy balance: what have be learned from the doubly labeled water method? American Journal of Clinical Nutrition, 68, 927-979. Schoeller, D. A., Ravussin, E., Schutz, Y., Acheson, K. J., Baertschi, P., & Jequier, E. (1986). Energy expenditure by doubly labeled water: validation in humans and proposed calculation. American Journal of Physiology, 250, R823-830. Schoeller, D.A., & van Santen, E. (1982). Measurement of energy expenditure in humans by doubly labelled water. Journal of Applied Physiology, 53, 955-959. Schutz, Y., Chambaz, A. (1997). Could a satellite-based navigation system (GPS) be used to assess the physical activity of individuals. European Journal of Clinical Nutrition, 51, 338-339. Scott, B.R., Locki, R.G., Knight, T.J., Clark, A.C., & Janse de Jonge, X.A.K. (2013). A comparison of methods to quantify the in-season training load in
221
professional soccer players. International Journal of Sports Physiology and Performance, 8, 195-202. Scott, M.T., Scott, T.J., & Kelly, V.G. (2016). The validity and reliability of global positioning systems in team sport: a brief review. Journal of Strength and Conditioning Research, 28, 1649-1655. Scott, D., & Drust, B. (2007). Work-rate analysis of elite female soccer players during match play. Journal of Sports Science and Medicine, 6, 107. Secher, N.H., Ruberg-Larsen, N., Binkhorst, R.A., & Bonde-Petersen, F. (1974). Maximal oxygen uptake during arm cranking and combined arm plus leg exercise. Journal of Applied Physiology, 36, 515-518. Seliger, V. (1968). Energy metabolism in selected physical exercise. Internationale Zeitechrift fur Angewandte Physiologie, 25, 104-120. Silva, J.R., Magalães, J.F., Ascensão, A.A., Oliveira, E.M., Sebba, A.F., & Rebelo, A.N. (2011). Individual match playing time during the season affects fitness related parameters of male professional soccer players. Journal of Strength and Conditioning Research, 25, 2729-2739. Speakman, J.R. (1997). Doubly Labelled Water; Theory and Practice. London: Chapman & Hall. Speakman, J.R., & Roberts, S.B. (1995). Recent advances in the doubly labeled water technique. Obese Research, 3, 1-74. Spilsbury, K.L., Fudge, B.W., Ingham, S.A., Faulkner, S.H., & Nimmo, M.A. (2015). Tapering strategies in elite British endurance runners. European Journal of Sport Sciences, 15, 367-373. Spurr, G.B., Prentice, A.M., Murgatroyd, P.R., Goldberg, G.R., Reina, J.C., & Christman, N.T. (1988). Energy expenditure from minute-by-minute heart-rate recording: comparison with indirect calorimetry. American Journal of Clinical Nutrition, 48, 552-559. Stolen, T., Chamari, K., Castagna, C., & Wisloff, U. (2005). Physiology of Soccer: An updated. Sports Medicine, 35, 501-536. Strudwick, T., & Reilly, T. (2001). Work-rate profiles of elite premier league football players. Insight FA Coaches Association Journal, 59. Suarez-Arrones, L., Torreńo, N., Requena, B., Sáez De Villarreal, E., Casamichana, D., Barbero-Alvarez, J.C., & Mungula-Izquierdo, D. (2015). Match-play activity profile in professional soccer players during official games and the relationship between external and internal load. Journal of Sports Medicine and Physical Fitness, 55, 1417-1422.
222
Taylor, M. (2012). Validation of the BodyMedia Mini armband to estimate energy expenditure of female basketball players during variable intensity-game like conditions. Pitssburgh (PA): University of Pittsburgh. Thatcher, R., & Batterham, A.M. (2004). Development and validation of a sport-specific exercise protocol for elite youth soccer players. Journal of Sports Medicine and Physical Fitness, 44, 15-22. Thompson, F., & Subar, A. (2008). Dietary assessment methodology. In A. M. Coulston, & C.J. Boushey (Eds.), Nutrition in the prevention and treatment of disease (pp. 3-39). San Diego, CA: Academic Press. Tierney, P.J., Young, A., Clarke, N.D., & Duncan, M.J. (2016). Match play demands of 11 versus 11 professional football using Global Positioning System tracking: Variations across common playing formations. Human Movement Science, 49, 1-8. Torreńo, N., Mungula-Izquierdo, D., Coutts, A., de Villarreal, E.S., Asian-Clemente, J., & Suarez-Arrones, L. (2016). Relationship between external and internal loads of professional soccer players during full matches in official games using global positioning systems and heart-rate technology. International Journal of Sports Physiology and Performance, 11, 940-946. Turcotte, L.P., Kiens, B., & Richter, E.A. (1991). Saturation kinetics of palmitate uptake in perfused skeletal muscle. Federation of European Biochemical Societies, 279, 327-329.
Van Erp-Baart, A.M.J., Saris, W.H.M., Binkhorst, R.A., Vos, J.A., & Elvers, J.W.H. (1989). Nationwide survey on nutritional habits in elite athletes. Part I: Energy, carbohydrate, protein, and fat intake. International Journal of Sports Medicine, 10, 3-10.
Van Gool, D., Van Gerven, D., & Boutmans, J. (1983). Heart rate telemetry during a soccer game: A new methodology. Journal of Sports Sciences, 1, 154. Varley. M.C., & Aughey, R.J. (2013). Acceleration profiles in elite Australian soccer. International Journal of Sports Medicine, 34, 34-39. Varley, M.C., Fairweather, I.H., & Aughey, R.J. (2012). Validity and reliability of GPS for measuring instantaneous velocity during acceleration, deceleration, and consistent motion. Journal of Sports Sciences, 30, 121-127. Viru, A., & Viru, M. (2000). Nature of training effects. In W. E. Garret Jr, & D.T. Kirkendall (Eds.), Exercise and Sport Science (pp. 67-95). Philadelphia: Lippincott Williams Wilkins. Vuckovic, N., Rittenbaugh, C., Taren, D.L., & Tobar, M. (2000). A qualitative study of participants’ experiences with dietary assessments. Journal of the American Dietary Association, 100, 1023-1028.
223
Waldron, M., Worsfold, P., Twist, C., & Lamb, K. (2011). Concurrent validity and test-retest reliability of a global positioning systems (GPS) and timing gates to assess sprint performance variables. Journal of Sports Sciences, 29, 1613-1619. Wall, B.T., Dirks, M.L., & Van Loon, L.J.C. (2013). Skeletal muscle atrophy during short-term disuse: implications for age related sarcopenia. Ageing Research Reviews, 12, 898-906. Wallace, J.L., & Norton, K.I. (2014). Evolution of World Cup soccer final games 1966-2010: game structure, speed and play patterns. Journal of Science and Medicine in Sport, 17, 223-228. Wee, S., Williams, C., Tsintzas, K., & Boobis, L. (2005). Ingestion of a high-glycemic index meal increases muscle glycogen storage at rest but augments its utilization during subsequent exercise. Journal of Applied Physiology, 99, 707-714. Wells, C., Edwards, A., Fysh, M., & Drust, B. (2014). Effects of high-intensity running training on soccer specific fitness in professional male players. Applied Physiology, Nutrition and Metabolism, 39, 763-769. Welsh, A. (1999). The soccer goalkeeping handbook – The authoritative guide for players and coaches. Chicago, IL: Master Press. Welsh, R.S., Davis, J.M., Burke, J.R., & Williams, H.G. (2002). Carbohydrates and physical/mental performance during intermittent exercise to fatigue. Medicine and Science in Sports and Exercise, 34, 723-731. Westerterp, K.R. (1999). Assessment of physical activity level in relation to obesity: current evidence and research issues. Medicine in Science, Sport and Exercise, 31, 522-525. Westerterp, K.R., & Plasqui, G. (2004). Physical activity and human energy expenditure. Current Opinion in Clinical Nutrition, Metabolism and Care, 7, 607-613. White, M., Davies, C., & Brooksby, P. (1984). The effects of short-term voluntary immobilization on the contractile properties of the human tricpe surae. Quarterly Journal of Experimental Physiology and Cognate Medical Services, 69, 685-691. Wicks, J.R., Olridge, N.B., Nielsen, L.K., & Vickers, C.E. (2011). Heart rate index-A simple method for prediction of oxygen uptake. Medicine and Science in Sports and Exercise, 43, 2005-2012. Widrick, J.J., Costill, D.L., Fink, W.J., Hickey, M.S., McConell, G.L., & Tanaka, H. (1993). Carbohydrate feedings and exercise performance: effect of initial muscle glycogen concentrations. Journal of Applied Physiology, 74, 2998-3005.
224
Williams, C., & Serratose, L. (2006). Nutrition on match day. Journal of Sports Sciences, 24, 687-697. Williamson, D.A., Allen, H.R., Martin, P.D., Alfonso, A., Gerald, B., & Hunt, A. (2004). Digital photography: a new method for estimating food intake in cafeteria settings. Eat Weight Disorders, 9, 24-28. Williamson, D.A., Allen, H.R., Martin, P.D., Alfonso, A.J., Gerald, B., & Hunt, A. (2003). Comparison of digital photography to weighed and visual estimation of portion sizes. Journal of the American Dietary Association, 103, 1139-1145. Wilmore, J.H., & Haskell, W.L. (1972). Body composition and endurance capcity of professional football players. Journal of Applied Physiology, 33, 564-567. Wragg, C.B., Maxwell, N.S., Doust, J.H. (2000). Evaluation of the reliability and validity of a soccer-specific field test of repeated sprinting ability. European Journal of Applied Physiology, 83, 77-83. Yeo, W.K., Patron, C.D., Garnham, A.P., Burke, L.M., Carey, A.L., & Hawley, J.A. (2008). Skeletal muscle adaptation and performance responses to once versus twice every second day endurance training regimens. Journal of Applied Physiology, 105, 1462-1470. Zaffagnini, S., Grassi, A., Marcheggiani Muccioli, G.M., Tsapralis, K., Ricci, M., Bragonzoni, L., … Marcacci, M. (2014). Return to sport after anterior cruciate ligament reconstruction in professional soccer players. The Knee, 21, 731-735. Zanetti, S., Pumpa, K.L., Wheeler, K.W., & Pyne, D.B. (2014). Validity of the SenseWear armband to assess Energy Expenditure during intermittent exercise and recovery in Rugby Union Players. Journal of Strength and Conditioning Research, 28, 1090-1095. Ziv, G., & Lidor, R. (2011). Physical characteristics, physiological attributes, and on-field performances of soccer goalkeepers. International Journal of Sports Physiology and Performance, 6, 509-524. Zubillaga, A., & Gorospe, G. (2007). Match analysis of 2005-06 Champions League final with Amisco system. Journal of Sports Science and Medicine, 6 supplementum 10, 6th World congress on science and football. Antalya, Turkey.

225
APPENDICES
226
European College of Sports Scientists, Vienna, Austria, July 2016.
QUANTIFICATION OF NUTRITIONAL INTAKE DURING A CONGESTED
FIXTURE PERIOD IN PLAYERS FROM THE ENGLISH PREMIER
LEAGUE
Anderson, L.1,2, Orme P.1,2, Naughton, R.2, Close, G.L.2, Louis, J.1,2, Morgans, R.1,
Drust, B.1,2 and Morton, J.P.2
1: Liverpool Football Club (Liverpool, UK), 2: LJMU (Liverpool, UK)
Introduction
Muscle glycogen is the primary energy source during soccer match play (Krustrup et al.
2006). In times of fixture congestion (i.e. consecutive matches every 2-3 days), it has
therefore been suggested that soccer players consume high daily carbohydrate (CHO)
intake (>6 g/kg) in an attempt to promote muscle glycogen re-synthesis and match day
physical performance (Anderson et al. 2015). The aim of this study was to therefore
quantify daily energy intake and macronutrient composition in English Premier League
(EPL) soccer players undergoing a period of fixture congestion.
Methods
Six professional EPL (from one team) soccer players (mean ± SD; age: 27 ± 3 years,
body mass: 80.5 ± 8.7 kg, height: 180 ± 7 cm, body fat: 11.9 ± 1.2%, lean body mass,
LBM: 65.0 ± 6.7 kg) completed daily food diaries alongside the remote food
photographic method (RFPM) over a 7-day period consisting of 2 competitive games
(Day 2 and 5) and 5 training sessions (Day 1, 3, 4, 6 and 7). Data were analysed for total
daily energy, CHO, protein and fat intake using dietary analysis software (Nutritics Ltd,
Ireland).
227
Results
Energy intake was greater on (P<0.05) match days (MD) (3789 ± 577 kcal and 61.1 ±
12.5 kcal/kg LBM) compared with training days (TD) (2948 ± 686 kcal and 45.2 ± 12.2
kcal/kg LBM, respectively). Similarly, CHO intake was also greater (P<0.05) on MD
(6.4 ± 2.2 g/kg) compared with TD (4.2 ± 1.6 g/kg). In contrast, neither protein (2.7 ±
0.4 g/kg v 2.5 ± 0.7 g/kg) nor fat intake (1.5 ± 0.6 g/kg v 1.2 ± 0.2 g/kg) was different
between MD and TD, respectively. CHO intake during matches (35.8 ± 21.5 g/min) was
also different (P<0.05) from that consumed during training sessions (5.5 ± 10.3 g/min).
Discussion
In accordance with current sports nutrition guidelines (Burke et al. 2011), we conclude
elite soccer players consume apparently adequate energy and CHO intake for the typical
loads observed on MD versus TD. However, on the basis of a congested fixture period
(i.e. 2 days between games), we suggest players should consume higher daily energy and
CHO intakes (similar to those reported on MD) on TD between matches so as to
promote glycogen re-synthesis in recovery from match play and prepare for the
subsequent game.
References
Anderson L et al. (2015). J Sports Sci 4: 1-10.
Burke L.M et al. (2011). J Sports Sci 29: 17-27.
Gunnarsson T.P et al. (2013). Scand J Med Sci Spor 23: 508-515.
Krustrup P et al. (2006). Phys Fit Perf 38: 1165-1174.
Related Documents