Quantification of Perfusion fMRI Using a Numerical Model of Arterial Spin Labeling That Accounts for Dynamic Transit Time Effects Luis Hernandez-Garcia, * Gregory R. Lee, Alberto L. Vazquez, Chun-Yu Yip, and Douglas C. Noll A new approach to modeling the signal observed in arterial spin labeling (ASL) experiments during changing perfusion condi- tions is presented in this article. The new model uses numerical methods to extend first-order kinetic principles to include the changes in arrival time of the arterial tag that occur during neuronal activation. Estimation of the perfusion function from the ASL signal using this model is also demonstrated. The estimation algorithm uses a roughness penalty as well as prior information. The approach is demonstrated in numerical simu- lations and human experiments. The approach presented here is particularly suitable for fast ASL acquisition schemes, such as turbo continuous ASL (Turbo-CASL), which allows subtrac- tion pairs to be acquired in less than 3 s but is sensitive to arrival time changes. This modeling approach can also be ex- tended to other acquisition schemes. Magn Reson Med 54: 955–964, 2005. © 2005 Wiley-Liss, Inc. Key words: brain; fMRI; arterial spin labeling; perfusion; blood flow We recently presented a new two-coil approach to contin- uous arterial spin labeling (CASL), (dubbed Turbo-CASL) (1), that significantly enhances the temporal resolution of ASL measurements while the SNR of the measurement is maintained. An additional benefit of the technique is that its sensitivity to transit time changes can be leveraged to increase the sensitivity to brain responses. In brief, Turbo- CASL consists of a continuous labeling experiment in which the control image is collected immediately after the tagging pulse, but before the tag reaches the plane of in- terest. The tagged image is collected when the tissue con- centration of the label reaches its maximum. With Turbo- CASL one can collect samples at a much faster rate com- pared to standard CASL techniques, and still allow for a long labeling time. In our previous publication (1) we showed that the Turbo-CASL method also had an advan- tage in terms of SNR per unit of time, even though the amount of accumulated tag is not allowed to reach its steady-state maximum. The method is very sensitive to transit time changes. This makes quantification of perfu- sion more difficult, but it can also serve to exaggerate the perfusion increases that occur during activation and hence improve detection power, as shown in our previous work. In this follow-up paper we address the quantification is- sues that arise as a result of these transit time changes. Quantification of blood flow from ASL measurements is a difficult problem that requires the measurement of many parameters. A number of models have been presented to quantify perfusion, for a number of ASL acquisition schemes. These models are largely based on the first-order kinetics of the wash-in and wash-out of the inversion label into the tissue, taking into account its T 1 decay and ex- change properties. The current models aim to quantify the microvascular perfusion, and consequently the larger ar- terial signal is routinely suppressed by the use of crusher gradients or postinversion delays. These delays have the added benefit of desensitizing the signal to the arterial transit time (ATT) (2– 4). These models were developed for the cases of steady-state flow and transit time (5–10). Un- der such circumstances, the uptake of the arterial tag can be modeled as a linear system. However, in addition to the flow increase, neuronal activation is also accompanied by a reduction in the ATT of approximately 10 –20%, as observed by Gonzalez-At et al. (10) and Yang et al. (11). In the case of Turbo-CASL, we have calculated (1,12) that the signal can potentially change approximately 15% by a transit time change alone using the existing models. As a result, the ASL signal observed in our Turbo-CASL approach has nonlinear characteristics that are not easily explained by existing models, and likely distort the under- lying flow response. In this study we extended the general framework of the kinetics of the arterial label to the case in which flow and transit times change dynamically in a given paradigm. We then developed and implemented a method to estimate perfusion given an ASL signal from the model. We present phantom and human data demonstrat- ing the use of the method. THEORY We formulated a simple numerical model for ASL based on the same principles used in the previously described analytic models (5,7). To incorporate the transit time ef- fects, we modeled the movement and decay of the inver- sion tag from the tagging location to the imaging location by using the well-known transport equation in one dimen- sion with an additional term for T 1 relaxation. Once the tag reaches the exchange location (which is the same as the imaging location), we use a first-order exchange for the uptake of the tag by the tissue compartment (5,7). fMRI Laboratory, University of Michigan, Ann Arbor, Michigan, USA. Department of Biomedical Engineering, University of Michigan, Ann Arbor, Michigan, USA. Grant sponsor: Raynor Foundation; Grant sponsor: Center for Biomedical Engineering, Research and fMRI Laboratory, University of Michigan. *Correspondence to: Luis Hernandez-Garcia, Ph.D., UM fMRI Laboratory, 2360 Bonisteel Ave., Ann Arbor, MI 48109-2108. E-mail: [email protected] Received 14 January 2005; revised 19 April 2005; accepted 17 May 2005. DOI 10.1002/mrm.20613 Published online 9 September 2005 in Wiley InterScience (www.interscience. wiley.com). Magnetic Resonance in Medicine 54:955–964 (2005) © 2005 Wiley-Liss, Inc. 955

Welcome message from author
This document is posted to help you gain knowledge. Please leave a comment to let me know what you think about it! Share it to your friends and learn new things together.
Transcript
Quantification of Perfusion fMRI Using a NumericalModel of Arterial Spin Labeling That Accounts forDynamic Transit Time Effects
Luis Hernandez-Garcia,* Gregory R. Lee, Alberto L. Vazquez, Chun-Yu Yip, andDouglas C. Noll
A new approach to modeling the signal observed in arterial spinlabeling (ASL) experiments during changing perfusion condi-tions is presented in this article. The new model uses numericalmethods to extend first-order kinetic principles to include thechanges in arrival time of the arterial tag that occur duringneuronal activation. Estimation of the perfusion function fromthe ASL signal using this model is also demonstrated. Theestimation algorithm uses a roughness penalty as well as priorinformation. The approach is demonstrated in numerical simu-lations and human experiments. The approach presented hereis particularly suitable for fast ASL acquisition schemes, suchas turbo continuous ASL (Turbo-CASL), which allows subtrac-tion pairs to be acquired in less than 3 s but is sensitive toarrival time changes. This modeling approach can also be ex-tended to other acquisition schemes. Magn Reson Med 54:955–964, 2005. © 2005 Wiley-Liss, Inc.
Key words: brain; fMRI; arterial spin labeling; perfusion; bloodflow
We recently presented a new two-coil approach to contin-uous arterial spin labeling (CASL), (dubbed Turbo-CASL)(1), that significantly enhances the temporal resolution ofASL measurements while the SNR of the measurement ismaintained. An additional benefit of the technique is thatits sensitivity to transit time changes can be leveraged toincrease the sensitivity to brain responses. In brief, Turbo-CASL consists of a continuous labeling experiment inwhich the control image is collected immediately after thetagging pulse, but before the tag reaches the plane of in-terest. The tagged image is collected when the tissue con-centration of the label reaches its maximum. With Turbo-CASL one can collect samples at a much faster rate com-pared to standard CASL techniques, and still allow for along labeling time. In our previous publication (1) weshowed that the Turbo-CASL method also had an advan-tage in terms of SNR per unit of time, even though theamount of accumulated tag is not allowed to reach itssteady-state maximum. The method is very sensitive totransit time changes. This makes quantification of perfu-sion more difficult, but it can also serve to exaggerate the
perfusion increases that occur during activation and henceimprove detection power, as shown in our previous work.In this follow-up paper we address the quantification is-sues that arise as a result of these transit time changes.
Quantification of blood flow from ASL measurements isa difficult problem that requires the measurement of manyparameters. A number of models have been presented toquantify perfusion, for a number of ASL acquisitionschemes. These models are largely based on the first-orderkinetics of the wash-in and wash-out of the inversion labelinto the tissue, taking into account its T1 decay and ex-change properties. The current models aim to quantify themicrovascular perfusion, and consequently the larger ar-terial signal is routinely suppressed by the use of crushergradients or postinversion delays. These delays have theadded benefit of desensitizing the signal to the arterialtransit time (ATT) (2–4). These models were developed forthe cases of steady-state flow and transit time (5–10). Un-der such circumstances, the uptake of the arterial tag canbe modeled as a linear system.
However, in addition to the flow increase, neuronalactivation is also accompanied by a reduction in the ATTof approximately 10–20%, as observed by Gonzalez-At etal. (10) and Yang et al. (11). In the case of Turbo-CASL, wehave calculated (1,12) that the signal can potentiallychange approximately 15% by a transit time change aloneusing the existing models.
As a result, the ASL signal observed in our Turbo-CASLapproach has nonlinear characteristics that are not easilyexplained by existing models, and likely distort the under-lying flow response. In this study we extended the generalframework of the kinetics of the arterial label to the case inwhich flow and transit times change dynamically in agiven paradigm. We then developed and implemented amethod to estimate perfusion given an ASL signal from themodel. We present phantom and human data demonstrat-ing the use of the method.
THEORY
We formulated a simple numerical model for ASL basedon the same principles used in the previously describedanalytic models (5,7). To incorporate the transit time ef-fects, we modeled the movement and decay of the inver-sion tag from the tagging location to the imaging locationby using the well-known transport equation in one dimen-sion with an additional term for T1 relaxation. Once the tagreaches the exchange location (which is the same as theimaging location), we use a first-order exchange for theuptake of the tag by the tissue compartment (5,7).
fMRI Laboratory, University of Michigan, Ann Arbor, Michigan, USA.Department of Biomedical Engineering, University of Michigan, Ann Arbor,Michigan, USA.Grant sponsor: Raynor Foundation; Grant sponsor: Center for BiomedicalEngineering, Research and fMRI Laboratory, University of Michigan.*Correspondence to: Luis Hernandez-Garcia, Ph.D., UM fMRI Laboratory,2360 Bonisteel Ave., Ann Arbor, MI 48109-2108. E-mail: [email protected] 14 January 2005; revised 19 April 2005; accepted 17 May 2005.DOI 10.1002/mrm.20613Published online 9 September 2005 in Wiley InterScience (www.interscience.wiley.com).
Magnetic Resonance in Medicine 54:955–964 (2005)
© 2005 Wiley-Liss, Inc. 955
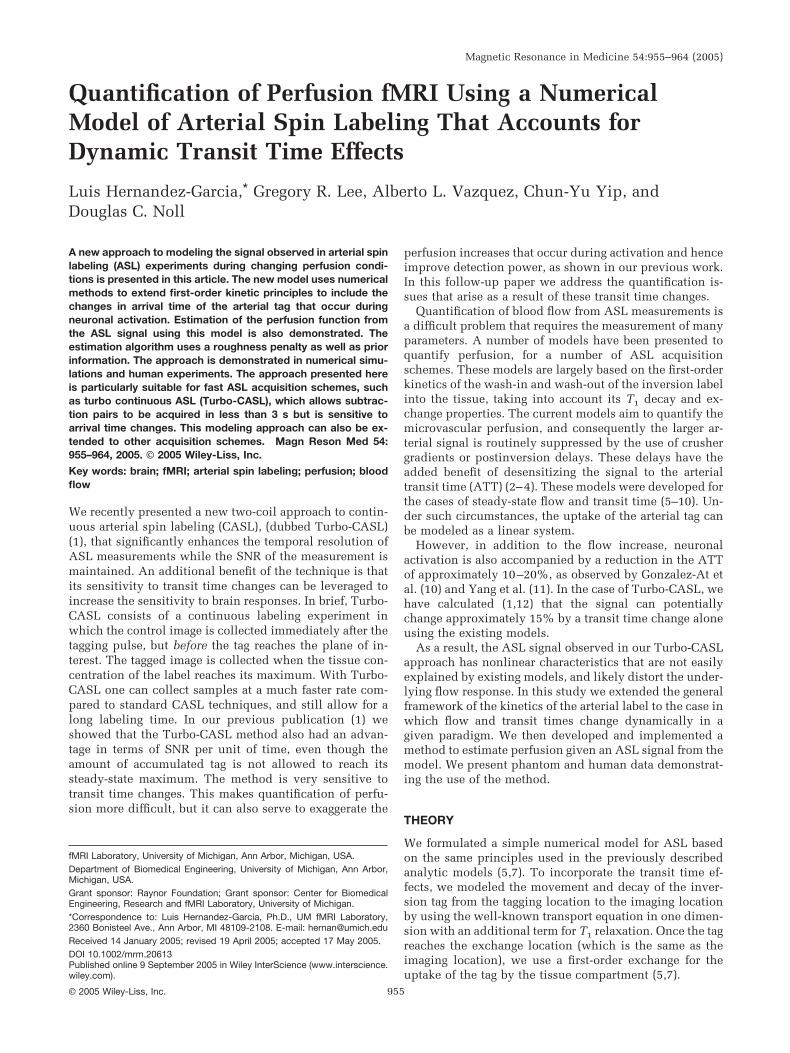
As depicted in Fig. 1, the model considers the arterialpath from the tagging location to the exchange location asa set of discrete compartments that feed into each other.Let A(x,t) be the amount of tag (in units of magnetization)at position x and time t. Let us consider the longitudinalrelaxation of the tag as it moves toward the exchange site.The passage of the tag through the arterial compartment,A(x,t), can be characterized in general by the transportequation with a decay term that accounts for the relaxationof the label, and a second term that accounts for the ex-change of the tag into the tissue (perfusion):
�A�x,t��t
� � Vart�t� ��A�x,t�
�x� R1art � A�x,t� � f�t� � A�x,t�
[1]
where Vart(t) is the time-varying mean arterial velocityfunction that reflects the observed changes in transit timealong the path, R1art represents the longitudinal relaxationof the tag while it is in the arteries, and f(t) is the perfusionrate. Perfusion of the tag into the tissue is considerednegligible (f(t) � 0) from the tagging plane until the ex-change site, corresponding to the voxel of interest, so priorto that location we can write
�A�x,t��t
� � Vart�t� ��A�x,t�
�x� R1art � A�x,t� [2]
Note that the pulsatility of the arterial flow can be builtinto the mean velocity function if desired, although weassume that the effect of pulsatility is negligible in thiswork. Let the voxel of interest be located at a distance xd
from the tagging site. At that location, the tag is partlytaken up from the arteries by the tissue compartment (de-fined as tissue as well as microvasculature) at a variablerate f(t) (the perfusion function of interest).
The tissue uptake at the voxel of interest is then de-scribed by:
�T�t��t
� f�t� � A�xd,t� �f�t��
� T�t� � R1tis � T�t� [3]
where T(t) is the tag content at the voxel of interest, � is thebrain–blood partition coefficient, and R1tis is the longitu-dinal relaxation rate of the tag while it is in the tissue. It isassumed that the tag will spend enough time in the tissueto decay completely before it reaches the venous compart-ment, so the outflow term in Eq. [3] is neglected and thevenous contribution to the signal is not considered. It must
be noted that Eq. [3] is mostly the same formulation of theASL problem at steady-state conditions proposed by oth-ers (5,7). The key difference is the input to the tissue, as weconsider the ATT (and hence the mean arterial velocity) tobe a time-varying function. While this is a small effect inthe steady-state regime, it is very significant in the Turbo-CASL regime for functional MRI experiments.
The initial conditions of this problem are that A(x,0) �0 for all x, and T(0) � 0. The system is driven by a tagginginput function:
A�0,t� � M0art � � � RF�t� [4]
in which Mart0 is the arterial magnetization, � is the inver-
sion efficiency factor, and RF(t) is the radiofrequencypulse train used for the labeling scheme of interest. In theboth CASL and Turbo-CASL, RF(t) is a boxcar with theappropriate duty cycle. In pulsed techniques, such asflow-sensitive alternating inversion recovery (FAIR), thesystem is driven by an input function that is applied everytwo TRs into the labeling region only:
A�x,t� � � for x � �0.x�,t � �2 � n� TR] [5]
In other words, every two TRs, the inversion pulse intro-duces a fresh tag into the slab. The rest of the time, themovement of the arterial contents is described by Eqs. [1]and [2]. In this case, xs is equivalent to the slab width inthe slice-selective case, and the to the whole system in thenonselective case. The gap between the labeling slab andthe imaging slice is xd – xs.
In the presence of flow crusher gradients to spoil arterialsignal, the usual ASL subtraction signal is given by T(t).The nonlinearity posed by the time-varying Vart(t) func-tion makes finding a closed-form solution to the systemquite challenging, but this formulation lends itself nicelyto a numerical implementation in which the evolution ofA(x,t) and T(t) are computed for all time steps using ascheme such as the Lax-Wendroff algorithm. Note that it isnot possible to perform Runge-Kutta simulations, becausethe system includes partial derivatives.
Estimation
In practice, the parameter of interest is the flow functionf(t) given an ASL signal, but because the instantaneousvelocity function, Vart(t), is also unknown, we need theability to simultaneously estimate the perfusion and meanarterial velocity functions given an ASL time series. Thiscan be done by iteratively minimizing a cost function thatconsists of the least-squares difference between the pre-dicted and measured signals.
This estimation problem is challenging because it isnonlinear and underdetermined (we need to estimate twoN-vectors, f and Vart, from a single N-vector of ASL mea-surements). There are a number of techniques we canapply to the problem to make it more manageable. Fortu-nately, we have prior knowledge about the unknown vec-tors that we can use to constrain the fitting algorithm. Suchprior knowledge includes the range of values that arephysiologically reasonable for perfusion and transit timeunder resting and activation conditions (10–14). (Onecould further narrow this range by measuring the baseline
FIG. 1. Depiction of the numerical ASL model as a series of com-partments. Transport and first-order exchange rate drive the move-ment of labeled spins into the tissue.
956 Hernandez-Garcia et al.
perfusion of each individual subject in a standard CASLexperiment.)
From previous studies (1,10,14) of transit time underrest and activation, we can clearly infer that there is a highdegree of correlation between the mean arterial velocityand the perfusion vectors (a 50% increase in perfusionduring activation is typically accompanied by a 10% de-crease in transit time). While we do not yet know the exactrelationship between the two parameters, we can make afirst-order Taylor series approximation of the change invelocity from the change in perfusion, i.e., assume that theincrease in mean arterial velocity from baseline is linearlyrelated to the increase in perfusion relative to baseline, or
Vart�t� � Vart�0�
Vart�0�� �
f�t� � f�0�
f�0�[6]
where Vart(0) and f(0) refer to the resting mean velocityand perfusion (initial conditions), respectively. This as-sumption allows us to eliminate the Vart(t) vector from thesearch space and make the problem well-determined bymaking a measurement of ATT during resting state only.Note that such a transit time measurement is required forTurbo-CASL techniques (1,13), and in this case it alsoyields the initial value of the velocity function.
In addition to constraining the search for the flow func-tion to a physiologically plausible range (e.g., from 0 to 3mL/s/g), we also can expect the perfusion response func-tion to be smooth and continuous, and thus impose aroughness penalty onto the cost function in the form of aderivative of the perfusion estimate.
In summary, given this prior information and the ASLsubtraction signal, y(t), we can estimate the perfusion timecourse by searching for the function (f(t)) that minimizes acost function consisting of the least-squares difference be-tween the synthesized data and the modeled signal, plusthe magnitude of the time derivative of f(t) weighted by aroughness penalty factor, . The perfusion estimate func-tion is given by
f�t� � argminf�t���y�t� � y�t�� � �ddt
f�t��� [7]
This minimum can be found iteratively by a number ofsearch algorithms, such as conjugate gradient descent,simplex, etc. As discussed below, we found the Levenberg-Marquardt algorithm to be well suited for the task.
MATERIALS AND METHODS
Simulations
To investigate the feasibility of iterative estimation ap-proaches, we performed a set of simulations of ASL exper-iments during an event-related activation paradigm con-sisting of three activations separated by 15-s intervals overa 100-s scanning period. The simulated peak perfusionincrease from a single event’s response was 40% followinga gamma-variate function. The mean arterial velocity wasassumed to increase up to 8% from its baseline propor-tionately with perfusion increases. This synthetic perfu-sion function was sampled at TR seconds.
The ASL signal was simulated for both the turbo andstandard CASL approaches using the acquisition parame-ters in Table 1 and the model described in the Theorysection. Specifically, we updated the tag contents in all thespace compartments (�x) along the arterial path and thetissue compartment at finite (�t) time intervals over theexperimental period. The updates were computed follow-ing the Lax-Wendroff algorithm. To update the tag con-tents, the perfusion and velocity functions were up-sampled to �t. The system was modified to include theeffect of the tag “destruction” that occurs during imagingby setting the amount of built-up label to zero in both thearterial and tissue compartments.
The ASL signal was calculated by downsampling thetissue function back to TR seconds, and separating thesamples from every other acquisition into “tagged” and“control” time series. These two time series were sinc-interpolated and subtracted to yield the final ASL signal,as is typically done in ASL protocols (15,16). We thencompared the flow to the ASL signal over time to assess thesystematic errors in each approach.
Estimation: Determining an Appropriate RoughnessPenalty
We estimated the perfusion function from the simulatedTurbo-CASL signals under noiseless and 10% whiteGaussian noise conditions. We used the Levenberg-Mar-quardt search algorithm, as implemented in Matlab’s (TheMathworks, South Natick, MA) lsqnonlin function. Wespecified the cost function to be Eq. [7]. The upper andlower bounds allowed for the solution were 0.0075 and0.038 mL/s/g (50% and 250% of the original guess). Themaximum number of allowed iterations was set to 10 inorder to limit the computation time while taking advan-tage of the fast convergence of the algorithm. It must benoted that the estimation algorithm could be trapped inlocal minima if the initial guess was far from the true meanperfusion (a difference of more than �0.005 mL/s/g (30mL/min/100 g)) over the function. To avoid this issue, weinitially estimated the mean perfusion over the experimentas a single parameter, and used that single perfusion valueas the initial guess for the estimation algorithm.
We assumed knowledge of the acquisition parameters,T1 of arterial blood and tissue, inversion efficiency, andMart
0 . The initial guess consisted of a flat line of 0.015 mL
Table 1Simulated ASL Acquisition and Physiological Parameters
TR 1.0 s (turbo), 3.7 s (CASL)Tagging time 0.8 s (turbo), 3.5 s (CASL)Tagging distance (xd) 12 cmSpatial sampling of path (�x) 0.5 cmTemporal sampling period (�t) 1/25 sT1art 1.6 sT1tis 1.2 sInversion efficiency, � 0.85Resting mean arterial velocity,
Vart(0) 10 cm/sArterial magnetization Mart
0 6000Resting perfusion, f(0) 0.015 ml/s/g (90 mL/min/100 g) (or dVart/df) 0.2
Quantification of Perfusion fMRI 957
s–1 g–1 (or 90 mL/min/100 g), which was known a priori asthe baseline perfusion, and is near the mean perfusion. Weexplored the roughness penalty by calculating bias-vari-ance curves for values of between 0 and 1000 in both thenoisy and noiseless cases. The noisy case’s curve wasrepeated 20 times, over which the bias and variance wereaveraged.
Estimation: Determining the Optimal AcquisitionParameters
Using the same perfusion and velocity functions, we usedthe model to generate an ASL signal at a range of TRs (0.6,1.0 1.2, 1.4, 1.6, 1.8, 2.0, 2.4, 2.8, 3.2, 3.6, and 4 s). Subse-quently we added a constant level of Gaussian noise to thesignal, and estimated the original perfusion function fromthe generated signal as described. We then computed themean squared error of the estimated perfusion function.This procedure was repeated 25 times and the errors wereaveraged for each TR.
Human Subjects
All human volunteers (N � 4) were scanned in accordancewith the regulations of the University of Michigan IRB.Imaging was carried out at 3 T on a Signa LX system (GE,Milwaukee, WI, USA). ASL was accomplished by a sepa-rate transmitter coil placed on the subject’s neck, as de-scribed in Ref. 17, while imaging was carried out using thestandard GE birdcage coil. The labeling coil was a customfigure-8 coil (6-cm-diameter loops), which was built suchthat the two loops were at a 130° angle relative to eachother. The labeling coil was powered by a separate signalgenerator (PTS 500; Programmed Test Resources Inc.,Littleton, MD, USA) and RF amplifier (custom-built byHenry Radio Supply, Los Angeles, CA, USA), which wasin turn gated by TTL pulses from the MRI scanner. Nosignificant RF bleed-through or coupling between the tag-ging and imaging coils was found.
Resting Transit Time Measurement
Tagged-control image pairs were collected from the motorcortex using a spin-echo spiral trajectory (matrix size �64 64, three slices, FOV � 22 cm, slice thickness �7 mm, NEX � 16 pairs, TE � 17 ms, tagging pulse fre-quency offset � 10 KHz, tagging distance � 17–21 cm, flowcrushers � b�4 s2/mm). Our previous work (1) showedthat the maximum signal in ASL is obtained when a steadystate of tag accumulation is reached, and the second high-est ASL signal is obtained when the tagging time ap-proaches the transit time. Hence, in order to measure theATT, the tag duration was varied between 600 and2300 ms and TR was always 180 or 200 ms longer than thetagging time. These tagging time durations typically en-compass the ATT from the inversion plane in the neck tothe slice of interest in humans (1). The mean ATT from thetagging to the imaging location was determined by fittingthe data to the model presented by Buxton et al. (5) usingthe approach presented in Ref. 1. An additional scan withTR � 4 s was included to improve the fit, and also to serveas a steady-state CASL measurement for reference.
Active Transit Time Measurement
The transit time during activation was measured by repeat-ing the procedure while the subjects performed a self-paced finger opposition task. Because the steady-stateCASL technique is more insensitive to transit time changesand the signal is largely proportional to perfusion, theselong TR scans also served to measure the relative change inperfusion during prolonged activation.
T1 Maps
T1, and M0 maps of the slices were calculated from theresting transit time data curves. By averaging only thecontrol scans at each TR, the flow effects were eliminated,which made these data essentially the same as those ob-tained in a saturation-recovery experiment (i.e., the samescan repeated with a range of TRs). We estimated M0 andT1 by fitting the saturation recovery equation M(TR) � M0
(1 – exp(-TR/T1) ) at each voxel.
ASL Activation Experiments
Perfusion-weighted images were then collected during amotor cortex activation paradigm consisting of an event-related finger-tapping task (2 s tapping followed by 18 srest, repeated 30 times). The ASL data were collectedusing the Turbo-CASL scheme with a TR that was approx-imately equal to the active transit time of each subject.This transit time was approximated as the TR that yieldedmaximum contrast (this is also the most negative ASLsignal after the subtraction, while the longest TR yields themost positive ASL signal) in the above active transit timemeasurement experiment, as demonstrated in Ref. 1. Thetagging time was 200 ms shorter than the TR. Note that thisapproach optimizes the Turbo-CASL sequence for the ac-tive case, and hence exaggerates the perfusion responses.This exaggerated response occurs because the Turbo-CASLsequence is not optimized during the resting state. How-ever, since the transit time is reduced during the activa-tion, the Turbo-CASL sequence becomes optimal becausethe transit time is roughly the same as TR during activationbut not during rest.
Both control and tagged images were sinc-interpolatedin time at every acquisition, effectively upsampling thetime series from two to one TR. The resulting tagged-control pairs were subtracted to yield a perfusion-weighted time series of images. Active voxels were iden-tified from the blocked design (standard CASL) datathrough correlation to a boxcar reference function, andtime courses were extracted from the selected voxels fromthe activation experiments. The time courses were aver-aged over the selected active voxels.
Estimation of the perfusion time series in the event-related paradigm: The perfusion function was estimatedfrom the event-related experiment’s extracted time courseby the numerical procedure described above using a reg-ularization parameter of 300. Inversion efficiency was as-sumed to be 0.85, T1 was averaged over gray matter, andT1art was assumed to be 1.6 s (18). M0
art was approximatedfrom the M0 map using the relationship M0
art � (M0tissue)/��,
where �� is the blood–brain partition coefficient, adjustedfor T2 decay of both blood and tissue, as described by
958 Hernandez-Garcia et al.
Buxton et al. (5). The instantaneous change in velocity wasassumed to be 24% of the change in perfusion duringactivation ( � 0.24). This approximation is based on theestimated slope of the mean velocity and perfusion in-creases (see Results section). The relative perfusion changewas obtained from the steady-state CASL experiment(TR � 4 s) acquired at rest and activation. Under steady-state conditions of labeling and perfusion, the ASL signalis directly proportional to perfusion. The resting meanarterial velocity was computed from the distance to thetagging plane and the ATT.
A perfusion impulse response function was calculatedfrom the estimated perfusion function by deconvolving acomb function from the perfusion function (19,20). Thecomb function was created such that its value was oneduring the activation times, and zero otherwise.
RESULTS
Simulation
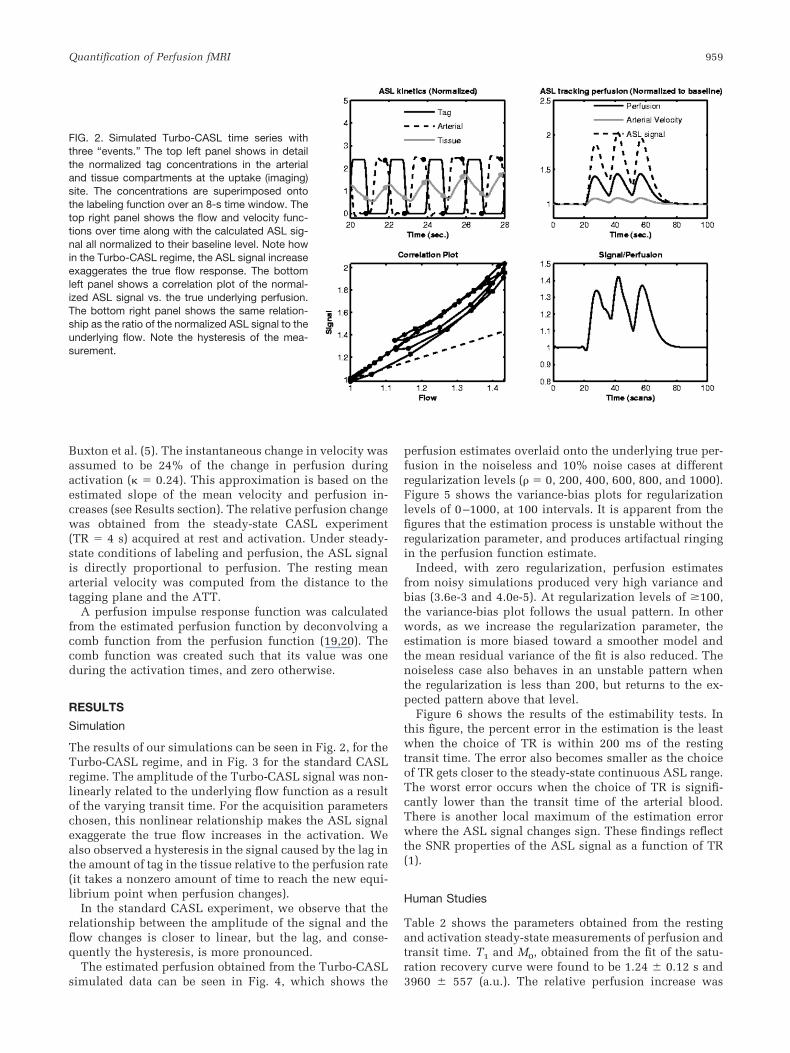
The results of our simulations can be seen in Fig. 2, for theTurbo-CASL regime, and in Fig. 3 for the standard CASLregime. The amplitude of the Turbo-CASL signal was non-linearly related to the underlying flow function as a resultof the varying transit time. For the acquisition parameterschosen, this nonlinear relationship makes the ASL signalexaggerate the true flow increases in the activation. Wealso observed a hysteresis in the signal caused by the lag inthe amount of tag in the tissue relative to the perfusion rate(it takes a nonzero amount of time to reach the new equi-librium point when perfusion changes).
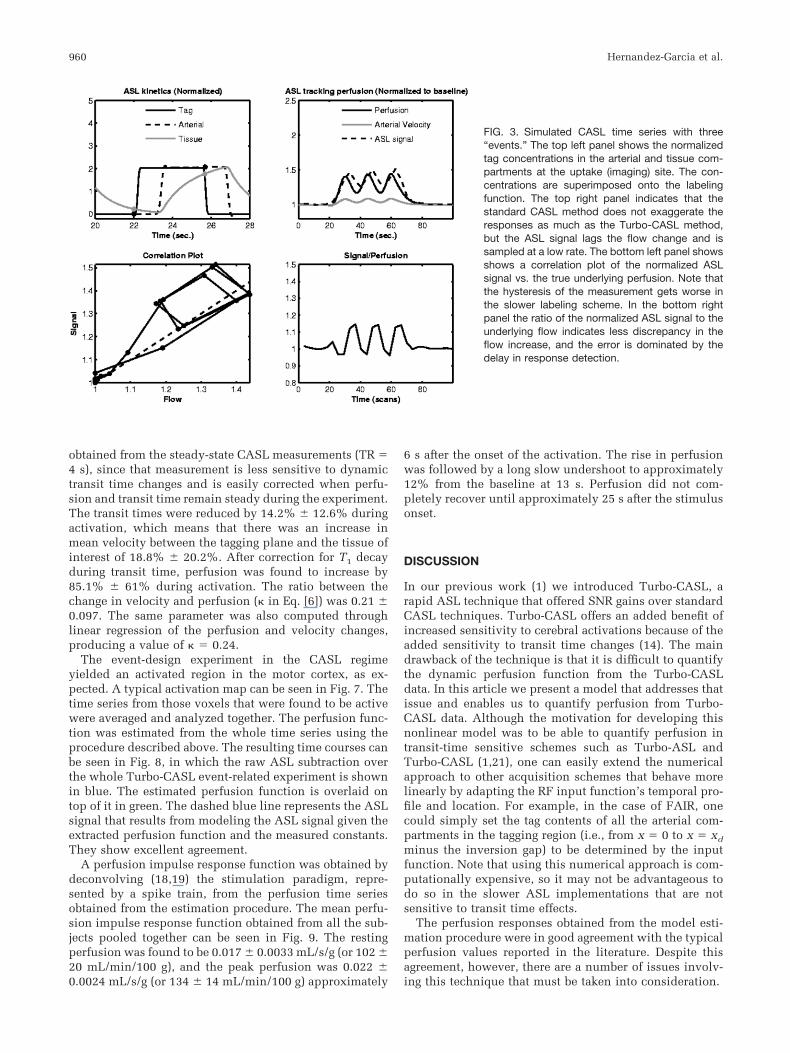
In the standard CASL experiment, we observe that therelationship between the amplitude of the signal and theflow changes is closer to linear, but the lag, and conse-quently the hysteresis, is more pronounced.
The estimated perfusion obtained from the Turbo-CASLsimulated data can be seen in Fig. 4, which shows the
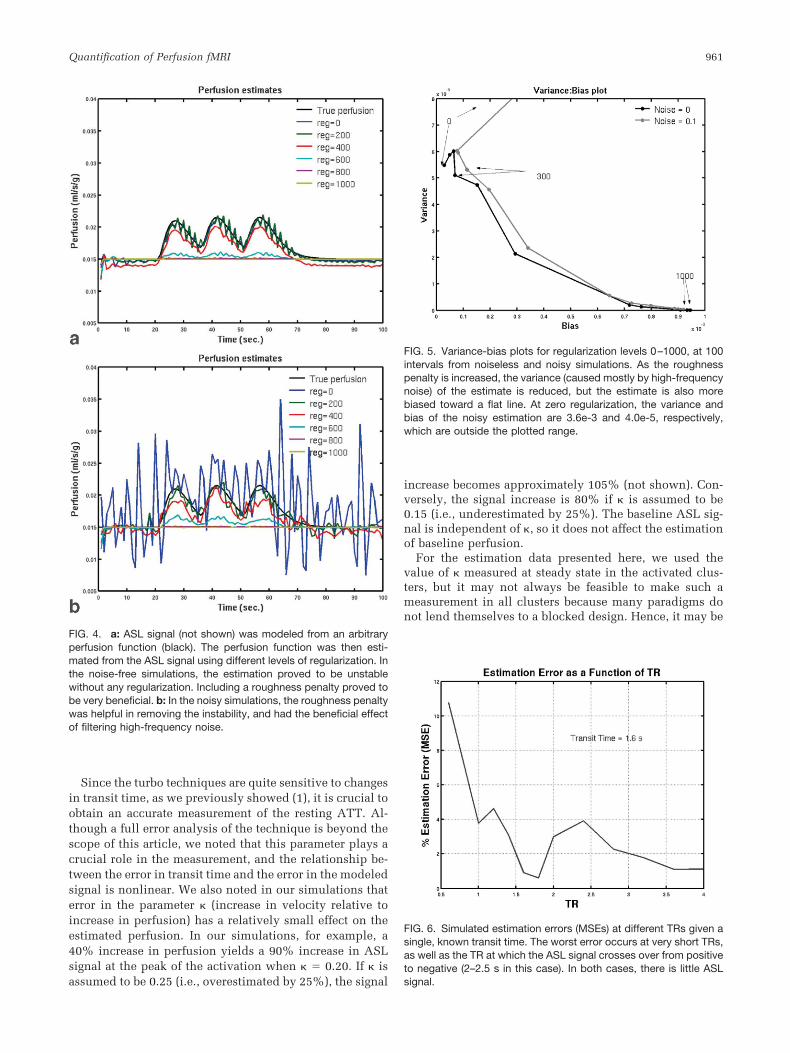
perfusion estimates overlaid onto the underlying true per-fusion in the noiseless and 10% noise cases at differentregularization levels ( � 0, 200, 400, 600, 800, and 1000).Figure 5 shows the variance-bias plots for regularizationlevels of 0–1000, at 100 intervals. It is apparent from thefigures that the estimation process is unstable without theregularization parameter, and produces artifactual ringingin the perfusion function estimate.
Indeed, with zero regularization, perfusion estimatesfrom noisy simulations produced very high variance andbias (3.6e-3 and 4.0e-5). At regularization levels of �100,the variance-bias plot follows the usual pattern. In otherwords, as we increase the regularization parameter, theestimation is more biased toward a smoother model andthe mean residual variance of the fit is also reduced. Thenoiseless case also behaves in an unstable pattern whenthe regularization is less than 200, but returns to the ex-pected pattern above that level.
Figure 6 shows the results of the estimability tests. Inthis figure, the percent error in the estimation is the leastwhen the choice of TR is within 200 ms of the restingtransit time. The error also becomes smaller as the choiceof TR gets closer to the steady-state continuous ASL range.The worst error occurs when the choice of TR is signifi-cantly lower than the transit time of the arterial blood.There is another local maximum of the estimation errorwhere the ASL signal changes sign. These findings reflectthe SNR properties of the ASL signal as a function of TR(1).
Human Studies
Table 2 shows the parameters obtained from the restingand activation steady-state measurements of perfusion andtransit time. T1 and M0, obtained from the fit of the satu-ration recovery curve were found to be 1.24 � 0.12 s and3960 � 557 (a.u.). The relative perfusion increase was
FIG. 2. Simulated Turbo-CASL time series withthree “events.” The top left panel shows in detailthe normalized tag concentrations in the arterialand tissue compartments at the uptake (imaging)site. The concentrations are superimposed ontothe labeling function over an 8-s time window. Thetop right panel shows the flow and velocity func-tions over time along with the calculated ASL sig-nal all normalized to their baseline level. Note howin the Turbo-CASL regime, the ASL signal increaseexaggerates the true flow response. The bottomleft panel shows a correlation plot of the normal-ized ASL signal vs. the true underlying perfusion.The bottom right panel shows the same relation-ship as the ratio of the normalized ASL signal to theunderlying flow. Note the hysteresis of the mea-surement.
Quantification of Perfusion fMRI 959
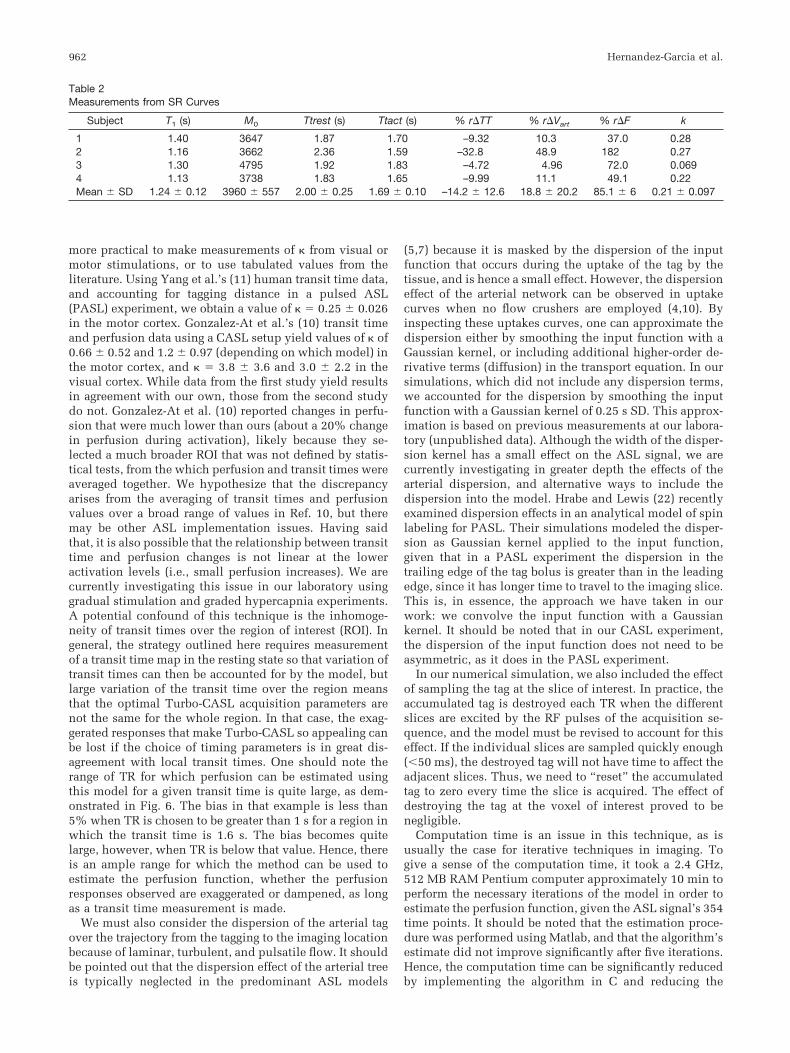
obtained from the steady-state CASL measurements (TR �4 s), since that measurement is less sensitive to dynamictransit time changes and is easily corrected when perfu-sion and transit time remain steady during the experiment.The transit times were reduced by 14.2% � 12.6% duringactivation, which means that there was an increase inmean velocity between the tagging plane and the tissue ofinterest of 18.8% � 20.2%. After correction for T1 decayduring transit time, perfusion was found to increase by85.1% � 61% during activation. The ratio between thechange in velocity and perfusion ( in Eq. [6]) was 0.21 �0.097. The same parameter was also computed throughlinear regression of the perfusion and velocity changes,producing a value of � 0.24.
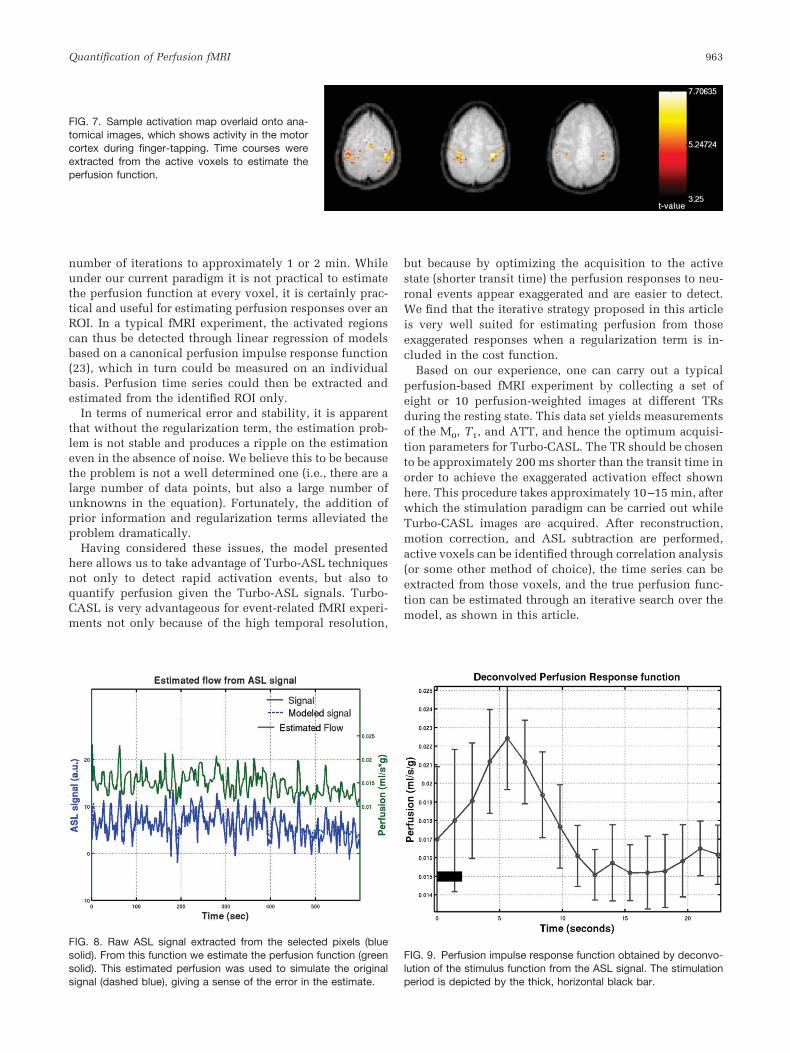
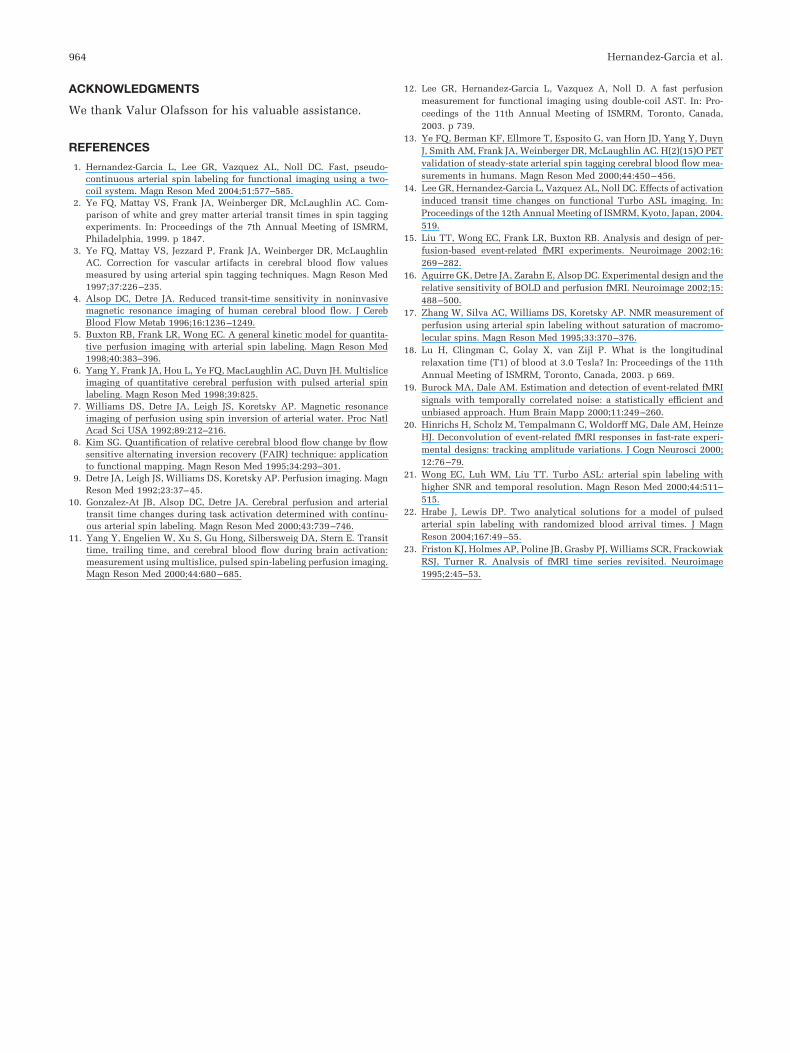
The event-design experiment in the CASL regimeyielded an activated region in the motor cortex, as ex-pected. A typical activation map can be seen in Fig. 7. Thetime series from those voxels that were found to be activewere averaged and analyzed together. The perfusion func-tion was estimated from the whole time series using theprocedure described above. The resulting time courses canbe seen in Fig. 8, in which the raw ASL subtraction overthe whole Turbo-CASL event-related experiment is shownin blue. The estimated perfusion function is overlaid ontop of it in green. The dashed blue line represents the ASLsignal that results from modeling the ASL signal given theextracted perfusion function and the measured constants.They show excellent agreement.
A perfusion impulse response function was obtained bydeconvolving (18,19) the stimulation paradigm, repre-sented by a spike train, from the perfusion time seriesobtained from the estimation procedure. The mean perfu-sion impulse response function obtained from all the sub-jects pooled together can be seen in Fig. 9. The restingperfusion was found to be 0.017 � 0.0033 mL/s/g (or 102 �20 mL/min/100 g), and the peak perfusion was 0.022 �0.0024 mL/s/g (or 134 � 14 mL/min/100 g) approximately
6 s after the onset of the activation. The rise in perfusionwas followed by a long slow undershoot to approximately12% from the baseline at 13 s. Perfusion did not com-pletely recover until approximately 25 s after the stimulusonset.
DISCUSSION
In our previous work (1) we introduced Turbo-CASL, arapid ASL technique that offered SNR gains over standardCASL techniques. Turbo-CASL offers an added benefit ofincreased sensitivity to cerebral activations because of theadded sensitivity to transit time changes (14). The maindrawback of the technique is that it is difficult to quantifythe dynamic perfusion function from the Turbo-CASLdata. In this article we present a model that addresses thatissue and enables us to quantify perfusion from Turbo-CASL data. Although the motivation for developing thisnonlinear model was to be able to quantify perfusion intransit-time sensitive schemes such as Turbo-ASL andTurbo-CASL (1,21), one can easily extend the numericalapproach to other acquisition schemes that behave morelinearly by adapting the RF input function’s temporal pro-file and location. For example, in the case of FAIR, onecould simply set the tag contents of all the arterial com-partments in the tagging region (i.e., from x � 0 to x � xd
minus the inversion gap) to be determined by the inputfunction. Note that using this numerical approach is com-putationally expensive, so it may not be advantageous todo so in the slower ASL implementations that are notsensitive to transit time effects.
The perfusion responses obtained from the model esti-mation procedure were in good agreement with the typicalperfusion values reported in the literature. Despite thisagreement, however, there are a number of issues involv-ing this technique that must be taken into consideration.
FIG. 3. Simulated CASL time series with three“events.” The top left panel shows the normalizedtag concentrations in the arterial and tissue com-partments at the uptake (imaging) site. The con-centrations are superimposed onto the labelingfunction. The top right panel indicates that thestandard CASL method does not exaggerate theresponses as much as the Turbo-CASL method,but the ASL signal lags the flow change and issampled at a low rate. The bottom left panel showsshows a correlation plot of the normalized ASLsignal vs. the true underlying perfusion. Note thatthe hysteresis of the measurement gets worse inthe slower labeling scheme. In the bottom rightpanel the ratio of the normalized ASL signal to theunderlying flow indicates less discrepancy in theflow increase, and the error is dominated by thedelay in response detection.
960 Hernandez-Garcia et al.
Since the turbo techniques are quite sensitive to changesin transit time, as we previously showed (1), it is crucial toobtain an accurate measurement of the resting ATT. Al-though a full error analysis of the technique is beyond thescope of this article, we noted that this parameter plays acrucial role in the measurement, and the relationship be-tween the error in transit time and the error in the modeledsignal is nonlinear. We also noted in our simulations thaterror in the parameter (increase in velocity relative toincrease in perfusion) has a relatively small effect on theestimated perfusion. In our simulations, for example, a40% increase in perfusion yields a 90% increase in ASLsignal at the peak of the activation when � 0.20. If isassumed to be 0.25 (i.e., overestimated by 25%), the signal
increase becomes approximately 105% (not shown). Con-versely, the signal increase is 80% if is assumed to be0.15 (i.e., underestimated by 25%). The baseline ASL sig-nal is independent of , so it does not affect the estimationof baseline perfusion.
For the estimation data presented here, we used thevalue of measured at steady state in the activated clus-ters, but it may not always be feasible to make such ameasurement in all clusters because many paradigms donot lend themselves to a blocked design. Hence, it may be
FIG. 4. a: ASL signal (not shown) was modeled from an arbitraryperfusion function (black). The perfusion function was then esti-mated from the ASL signal using different levels of regularization. Inthe noise-free simulations, the estimation proved to be unstablewithout any regularization. Including a roughness penalty proved tobe very beneficial. b: In the noisy simulations, the roughness penaltywas helpful in removing the instability, and had the beneficial effectof filtering high-frequency noise.
FIG. 5. Variance-bias plots for regularization levels 0–1000, at 100intervals from noiseless and noisy simulations. As the roughnesspenalty is increased, the variance (caused mostly by high-frequencynoise) of the estimate is reduced, but the estimate is also morebiased toward a flat line. At zero regularization, the variance andbias of the noisy estimation are 3.6e-3 and 4.0e-5, respectively,which are outside the plotted range.
FIG. 6. Simulated estimation errors (MSEs) at different TRs given asingle, known transit time. The worst error occurs at very short TRs,as well as the TR at which the ASL signal crosses over from positiveto negative (2–2.5 s in this case). In both cases, there is little ASLsignal.
Quantification of Perfusion fMRI 961
more practical to make measurements of from visual ormotor stimulations, or to use tabulated values from theliterature. Using Yang et al.’s (11) human transit time data,and accounting for tagging distance in a pulsed ASL(PASL) experiment, we obtain a value of � 0.25 � 0.026in the motor cortex. Gonzalez-At et al.’s (10) transit timeand perfusion data using a CASL setup yield values of of0.66 � 0.52 and 1.2 � 0.97 (depending on which model) inthe motor cortex, and � 3.8 � 3.6 and 3.0 � 2.2 in thevisual cortex. While data from the first study yield resultsin agreement with our own, those from the second studydo not. Gonzalez-At et al. (10) reported changes in perfu-sion that were much lower than ours (about a 20% changein perfusion during activation), likely because they se-lected a much broader ROI that was not defined by statis-tical tests, from the which perfusion and transit times wereaveraged together. We hypothesize that the discrepancyarises from the averaging of transit times and perfusionvalues over a broad range of values in Ref. 10, but theremay be other ASL implementation issues. Having saidthat, it is also possible that the relationship between transittime and perfusion changes is not linear at the loweractivation levels (i.e., small perfusion increases). We arecurrently investigating this issue in our laboratory usinggradual stimulation and graded hypercapnia experiments.A potential confound of this technique is the inhomoge-neity of transit times over the region of interest (ROI). Ingeneral, the strategy outlined here requires measurementof a transit time map in the resting state so that variation oftransit times can then be accounted for by the model, butlarge variation of the transit time over the region meansthat the optimal Turbo-CASL acquisition parameters arenot the same for the whole region. In that case, the exag-gerated responses that make Turbo-CASL so appealing canbe lost if the choice of timing parameters is in great dis-agreement with local transit times. One should note therange of TR for which perfusion can be estimated usingthis model for a given transit time is quite large, as dem-onstrated in Fig. 6. The bias in that example is less than5% when TR is chosen to be greater than 1 s for a region inwhich the transit time is 1.6 s. The bias becomes quitelarge, however, when TR is below that value. Hence, thereis an ample range for which the method can be used toestimate the perfusion function, whether the perfusionresponses observed are exaggerated or dampened, as longas a transit time measurement is made.
We must also consider the dispersion of the arterial tagover the trajectory from the tagging to the imaging locationbecause of laminar, turbulent, and pulsatile flow. It shouldbe pointed out that the dispersion effect of the arterial treeis typically neglected in the predominant ASL models
(5,7) because it is masked by the dispersion of the inputfunction that occurs during the uptake of the tag by thetissue, and is hence a small effect. However, the dispersioneffect of the arterial network can be observed in uptakecurves when no flow crushers are employed (4,10). Byinspecting these uptakes curves, one can approximate thedispersion either by smoothing the input function with aGaussian kernel, or including additional higher-order de-rivative terms (diffusion) in the transport equation. In oursimulations, which did not include any dispersion terms,we accounted for the dispersion by smoothing the inputfunction with a Gaussian kernel of 0.25 s SD. This approx-imation is based on previous measurements at our labora-tory (unpublished data). Although the width of the disper-sion kernel has a small effect on the ASL signal, we arecurrently investigating in greater depth the effects of thearterial dispersion, and alternative ways to include thedispersion into the model. Hrabe and Lewis (22) recentlyexamined dispersion effects in an analytical model of spinlabeling for PASL. Their simulations modeled the disper-sion as Gaussian kernel applied to the input function,given that in a PASL experiment the dispersion in thetrailing edge of the tag bolus is greater than in the leadingedge, since it has longer time to travel to the imaging slice.This is, in essence, the approach we have taken in ourwork: we convolve the input function with a Gaussiankernel. It should be noted that in our CASL experiment,the dispersion of the input function does not need to beasymmetric, as it does in the PASL experiment.
In our numerical simulation, we also included the effectof sampling the tag at the slice of interest. In practice, theaccumulated tag is destroyed each TR when the differentslices are excited by the RF pulses of the acquisition se-quence, and the model must be revised to account for thiseffect. If the individual slices are sampled quickly enough(�50 ms), the destroyed tag will not have time to affect theadjacent slices. Thus, we need to “reset” the accumulatedtag to zero every time the slice is acquired. The effect ofdestroying the tag at the voxel of interest proved to benegligible.
Computation time is an issue in this technique, as isusually the case for iterative techniques in imaging. Togive a sense of the computation time, it took a 2.4 GHz,512 MB RAM Pentium computer approximately 10 min toperform the necessary iterations of the model in order toestimate the perfusion function, given the ASL signal’s 354time points. It should be noted that the estimation proce-dure was performed using Matlab, and that the algorithm’sestimate did not improve significantly after five iterations.Hence, the computation time can be significantly reducedby implementing the algorithm in C and reducing the
Table 2Measurements from SR Curves
Subject T1 (s) M0 Ttrest (s) Ttact (s) % r�TT % r�Vart % r�F k
1 1.40 3647 1.87 1.70 –9.32 10.3 37.0 0.282 1.16 3662 2.36 1.59 –32.8 48.9 182 0.273 1.30 4795 1.92 1.83 –4.72 4.96 72.0 0.0694 1.13 3738 1.83 1.65 –9.99 11.1 49.1 0.22Mean � SD 1.24 � 0.12 3960 � 557 2.00 � 0.25 1.69 � 0.10 –14.2 � 12.6 18.8 � 20.2 85.1 � 6 0.21 � 0.097
962 Hernandez-Garcia et al.
number of iterations to approximately 1 or 2 min. Whileunder our current paradigm it is not practical to estimatethe perfusion function at every voxel, it is certainly prac-tical and useful for estimating perfusion responses over anROI. In a typical fMRI experiment, the activated regionscan thus be detected through linear regression of modelsbased on a canonical perfusion impulse response function(23), which in turn could be measured on an individualbasis. Perfusion time series could then be extracted andestimated from the identified ROI only.
In terms of numerical error and stability, it is apparentthat without the regularization term, the estimation prob-lem is not stable and produces a ripple on the estimationeven in the absence of noise. We believe this to be becausethe problem is not a well determined one (i.e., there are alarge number of data points, but also a large number ofunknowns in the equation). Fortunately, the addition ofprior information and regularization terms alleviated theproblem dramatically.
Having considered these issues, the model presentedhere allows us to take advantage of Turbo-ASL techniquesnot only to detect rapid activation events, but also toquantify perfusion given the Turbo-ASL signals. Turbo-CASL is very advantageous for event-related fMRI experi-ments not only because of the high temporal resolution,
but because by optimizing the acquisition to the activestate (shorter transit time) the perfusion responses to neu-ronal events appear exaggerated and are easier to detect.We find that the iterative strategy proposed in this articleis very well suited for estimating perfusion from thoseexaggerated responses when a regularization term is in-cluded in the cost function.
Based on our experience, one can carry out a typicalperfusion-based fMRI experiment by collecting a set ofeight or 10 perfusion-weighted images at different TRsduring the resting state. This data set yields measurementsof the M0, T1, and ATT, and hence the optimum acquisi-tion parameters for Turbo-CASL. The TR should be chosento be approximately 200 ms shorter than the transit time inorder to achieve the exaggerated activation effect shownhere. This procedure takes approximately 10–15 min, afterwhich the stimulation paradigm can be carried out whileTurbo-CASL images are acquired. After reconstruction,motion correction, and ASL subtraction are performed,active voxels can be identified through correlation analysis(or some other method of choice), the time series can beextracted from those voxels, and the true perfusion func-tion can be estimated through an iterative search over themodel, as shown in this article.
FIG. 7. Sample activation map overlaid onto ana-tomical images, which shows activity in the motorcortex during finger-tapping. Time courses wereextracted from the active voxels to estimate theperfusion function.
FIG. 8. Raw ASL signal extracted from the selected pixels (bluesolid). From this function we estimate the perfusion function (greensolid). This estimated perfusion was used to simulate the originalsignal (dashed blue), giving a sense of the error in the estimate.
FIG. 9. Perfusion impulse response function obtained by deconvo-lution of the stimulus function from the ASL signal. The stimulationperiod is depicted by the thick, horizontal black bar.
Quantification of Perfusion fMRI 963
ACKNOWLEDGMENTS
We thank Valur Olafsson for his valuable assistance.
REFERENCES
1. Hernandez-Garcia L, Lee GR, Vazquez AL, Noll DC. Fast, pseudo-continuous arterial spin labeling for functional imaging using a two-coil system. Magn Reson Med 2004;51:577–585.
2. Ye FQ, Mattay VS, Frank JA, Weinberger DR, McLaughlin AC. Com-parison of white and grey matter arterial transit times in spin taggingexperiments. In: Proceedings of the 7th Annual Meeting of ISMRM,Philadelphia, 1999. p 1847.
3. Ye FQ, Mattay VS, Jezzard P, Frank JA, Weinberger DR, McLaughlinAC. Correction for vascular artifacts in cerebral blood flow valuesmeasured by using arterial spin tagging techniques. Magn Reson Med1997;37:226–235.
4. Alsop DC, Detre JA. Reduced transit-time sensitivity in noninvasivemagnetic resonance imaging of human cerebral blood flow. J CerebBlood Flow Metab 1996;16:1236–1249.
5. Buxton RB, Frank LR, Wong EC. A general kinetic model for quantita-tive perfusion imaging with arterial spin labeling. Magn Reson Med1998;40:383–396.
6. Yang Y, Frank JA, Hou L, Ye FQ, MacLaughlin AC, Duyn JH. Multisliceimaging of quantitative cerebral perfusion with pulsed arterial spinlabeling. Magn Reson Med 1998;39:825.
7. Williams DS, Detre JA, Leigh JS, Koretsky AP. Magnetic resonanceimaging of perfusion using spin inversion of arterial water. Proc NatlAcad Sci USA 1992;89:212–216.
8. Kim SG. Quantification of relative cerebral blood flow change by flowsensitive alternating inversion recovery (FAIR) technique: applicationto functional mapping. Magn Reson Med 1995;34:293–301.
9. Detre JA, Leigh JS, Williams DS, Koretsky AP. Perfusion imaging. MagnReson Med 1992;23:37–45.
10. Gonzalez-At JB, Alsop DC, Detre JA. Cerebral perfusion and arterialtransit time changes during task activation determined with continu-ous arterial spin labeling. Magn Reson Med 2000;43:739–746.
11. Yang Y, Engelien W, Xu S, Gu Hong, Silbersweig DA, Stern E. Transittime, trailing time, and cerebral blood flow during brain activation:measurement using multislice, pulsed spin-labeling perfusion imaging.Magn Reson Med 2000;44:680–685.
12. Lee GR, Hernandez-Garcia L, Vazquez A, Noll D. A fast perfusionmeasurement for functional imaging using double-coil AST. In: Pro-ceedings of the 11th Annual Meeting of ISMRM, Toronto, Canada,2003. p 739.
13. Ye FQ, Berman KF, Ellmore T, Esposito G, van Horn JD, Yang Y, DuynJ, Smith AM, Frank JA, Weinberger DR, McLaughlin AC. H(2)(15)O PETvalidation of steady-state arterial spin tagging cerebral blood flow mea-surements in humans. Magn Reson Med 2000;44:450–456.
14. Lee GR, Hernandez-Garcia L, Vazquez AL, Noll DC. Effects of activationinduced transit time changes on functional Turbo ASL imaging. In:Proceedings of the 12th Annual Meeting of ISMRM, Kyoto, Japan, 2004.519.
15. Liu TT, Wong EC, Frank LR, Buxton RB. Analysis and design of per-fusion-based event-related fMRI experiments. Neuroimage 2002;16:269–282.
16. Aguirre GK, Detre JA, Zarahn E, Alsop DC. Experimental design and therelative sensitivity of BOLD and perfusion fMRI. Neuroimage 2002;15:488–500.
17. Zhang W, Silva AC, Williams DS, Koretsky AP. NMR measurement ofperfusion using arterial spin labeling without saturation of macromo-lecular spins. Magn Reson Med 1995;33:370–376.
18. Lu H, Clingman C, Golay X, van Zijl P. What is the longitudinalrelaxation time (T1) of blood at 3.0 Tesla? In: Proceedings of the 11thAnnual Meeting of ISMRM, Toronto, Canada, 2003. p 669.
19. Burock MA, Dale AM. Estimation and detection of event-related fMRIsignals with temporally correlated noise: a statistically efficient andunbiased approach. Hum Brain Mapp 2000;11:249–260.
20. Hinrichs H, Scholz M, Tempalmann C, Woldorff MG, Dale AM, HeinzeHJ. Deconvolution of event-related fMRI responses in fast-rate experi-mental designs: tracking amplitude variations. J Cogn Neurosci 2000;12:76–79.
21. Wong EC, Luh WM, Liu TT. Turbo ASL: arterial spin labeling withhigher SNR and temporal resolution. Magn Reson Med 2000;44:511–515.
22. Hrabe J, Lewis DP. Two analytical solutions for a model of pulsedarterial spin labeling with randomized blood arrival times. J MagnReson 2004;167:49–55.
23. Friston KJ, Holmes AP, Poline JB, Grasby PJ, Williams SCR, FrackowiakRSJ, Turner R. Analysis of fMRI time series revisited. Neuroimage1995;2:45–53.
964 Hernandez-Garcia et al.
Related Documents


![Quantification of liver perfusion with [15O]H2O-PET and its relationship with glucose metabolism and substrate levels](https://static.cupdf.com/doc/110x72/6345d2fd6cfb3d406409dc18/quantification-of-liver-perfusion-with-15oh2o-pet-and-its-relationship-with-glucose.jpg)