Quantification of Mycobacterium avium subsp. paratuberculosis Strains Representing Distinct Genotypes and Isolated from Domestic and Wildlife Animal Species by Use of an Automatic Liquid Culture System Naiara Abendaño, a Iker Sevilla, a José M. Prieto, b Joseba M. Garrido, a Ramon A. Juste, a and Marta Alonso-Hearn a Department of Animal Health, NEIKER-Tecnalia, Basque Institute for Agricultural Research and Development, Berreaga 1, Derio Bizkaia, Spain, a and Serida, Department of Agriculture of the Regional Government of the Principality of Asturias, Grado, Asturias, Spain b Quantification of 11 clinical strains of Mycobacterium avium subsp. paratuberculosis isolated from domestic (cattle, sheep, and goat) and wildlife (fallow deer, deer, wild boar, and bison) animal species in an automatic liquid culture system (Bactec MGIT 960) was accomplished. The strains were previously isolated and typed using IS1311 PCR followed by restriction endonuclease analysis (PCR-REA) into type C, S, or B. A strain-specific quantification curve was generated for each M. avium subsp. paratu- berculosis strain by relating the time to detection in the liquid culture system to the estimated log 10 CFU in each inoculum. Ac- cording to their growth curves, the tested M. avium subsp. paratuberculosis strains were classified into two distinct groups. The first group included the S-type strain isolated from goat and all the sheep strains with C, S, and B genotypes. A second group con- tained the C- and B-type strains isolated from cattle, goat, and wildlife animals with the exception of the fallow deer strain. The strains isolated from cattle or sheep showed similar strain-specific standard curves irrespective of their genotype. In contrast, the strains isolated from goat or from wildlife animal species varied in their rates of growth in liquid culture. Universal-standard curves and algorithms for the quantification of each group of strains were generated. In addition, the liquid culture system was compared with a real-time quantitative PCR system for the quantification of the 11 M. avium subsp. paratuberculosis strains. Correlations between the estimated log 10 CFU and M. avium subsp. paratuberculosis DNA copy numbers were very high for all the tested strains (R > 0.9). M ycobacterium avium subsp. paratuberculosis is the causative agent of paratuberculosis in domestic and wildlife animals, including cattle, sheep, goat, deer, bison, wild boar, and other ruminant and nonruminant animal species. M. avium subsp. paratuberculosis may also have human health significance as a pos- sible cause of Crohn’s disease in humans (6). Molecular typing techniques, such as PCR followed by restriction endonuclease analysis (PCR-REA), pulsed-field gel electrophoresis (PFGE), multilocus short sequence repeat (MLSSR), and variable-number tandem repeats (VNTR), have been used to allow a profound ge- netic discrimination between M. avium subsp. paratuberculosis strains (5, 17, 37, 38). Broadly speaking, M. avium subsp. paratu- berculosis strains can be classified into two host-associated types based on culture characteristics and on genome analysis: sheep strains (also called “S type” or “type I”) and cattle strains (also called “C type” or “type II”) (7, 42). A subtype of type I strains was designated “intermediate” or “type III” (7, 10). The type III strains are highly similar genetically to and difficult to distinguish from type I strains. Single nucleotide polymorphism analysis in the IS1311 insertion sequence distinguishes three types of strains: S, C, and B (45). It is important to point out that single nucleotide polymorphism analysis of the IS1311 sequence cannot distinguish between types I and III. The culture of S-type strains has been historically more difficult, with very low isolation rates on the solid media routinely used for culture of C-type strains (20). In 2005, the complete, annotated genome sequence of the bovine isolate K10 was published (22). Since then, the genomes of multi- ple isolates of M. avium subsp. paratuberculosis of different prov- enance have been subjected to whole-genome sequencing (44). Preliminary results suggest that the human isolates are essentially identical to the bovine isolate K10, while the sheep isolates contain some large sequence deletions, three of which had been previously described (25, 26, 32, 35, 40, 47). Recently, the genomes of three U.S. sheep isolates of M. avium subsp. paratuberculosis have been sequenced, and a novel deletion comprising the open reading frames (ORFs) MAP1432 through MAP1438c (partial) was iden- tified as absent from the ovine isolates (4). Although the classifi- cation of strains into C, S, or B types may reflect a host preference, multiple strains of M. avium subsp. paratuberculosis can cross the species barriers and be isolated from a broad range of animal spe- cies (28, 29, 41). While the diverse M. avium subsp. paratubercu- losis strains use a similar mechanism of infection, invasion and survival efficiency of M. avium subsp. paratuberculosis within the host cells appears to differ with respect to the M. avium subsp. paratuberculosis genotype (14, 18, 21). A deeper understanding of the pathogenesis of M. avium subsp. paratuberculosis requires first the development of precise methods that allow for the quantifica- tion of viable M. avium subsp. paratuberculosis cells inside the host. Received 27 February 2012 Returned for modification 28 March 2012 Accepted 20 May 2012 Published ahead of print 30 May 2012 Address correspondence to Marta Alonso-Hearn, [email protected]. Copyright © 2012, American Society for Microbiology. All Rights Reserved. doi:10.1128/JCM.00441-12 August 2012 Volume 50 Number 8 Journal of Clinical Microbiology p. 2609 –2617 jcm.asm.org 2609

Welcome message from author
This document is posted to help you gain knowledge. Please leave a comment to let me know what you think about it! Share it to your friends and learn new things together.
Transcript
Quantification of Mycobacterium avium subsp. paratuberculosis StrainsRepresenting Distinct Genotypes and Isolated from Domestic andWildlife Animal Species by Use of an Automatic Liquid CultureSystem
Naiara Abendaño,a Iker Sevilla,a José M. Prieto,b Joseba M. Garrido,a Ramon A. Juste,a and Marta Alonso-Hearna
Department of Animal Health, NEIKER-Tecnalia, Basque Institute for Agricultural Research and Development, Berreaga 1, Derio Bizkaia, Spain,a and Serida, Department ofAgriculture of the Regional Government of the Principality of Asturias, Grado, Asturias, Spainb
Quantification of 11 clinical strains of Mycobacterium avium subsp. paratuberculosis isolated from domestic (cattle, sheep, andgoat) and wildlife (fallow deer, deer, wild boar, and bison) animal species in an automatic liquid culture system (Bactec MGIT960) was accomplished. The strains were previously isolated and typed using IS1311 PCR followed by restriction endonucleaseanalysis (PCR-REA) into type C, S, or B. A strain-specific quantification curve was generated for each M. avium subsp. paratu-berculosis strain by relating the time to detection in the liquid culture system to the estimated log10 CFU in each inoculum. Ac-cording to their growth curves, the tested M. avium subsp. paratuberculosis strains were classified into two distinct groups. Thefirst group included the S-type strain isolated from goat and all the sheep strains with C, S, and B genotypes. A second group con-tained the C- and B-type strains isolated from cattle, goat, and wildlife animals with the exception of the fallow deer strain. Thestrains isolated from cattle or sheep showed similar strain-specific standard curves irrespective of their genotype. In contrast, thestrains isolated from goat or from wildlife animal species varied in their rates of growth in liquid culture. Universal-standardcurves and algorithms for the quantification of each group of strains were generated. In addition, the liquid culture system wascompared with a real-time quantitative PCR system for the quantification of the 11 M. avium subsp. paratuberculosis strains.Correlations between the estimated log10 CFU and M. avium subsp. paratuberculosis DNA copy numbers were very high for allthe tested strains (R > 0.9).
Mycobacterium avium subsp. paratuberculosis is the causativeagent of paratuberculosis in domestic and wildlife animals,
including cattle, sheep, goat, deer, bison, wild boar, and otherruminant and nonruminant animal species. M. avium subsp.paratuberculosis may also have human health significance as a pos-sible cause of Crohn’s disease in humans (6). Molecular typingtechniques, such as PCR followed by restriction endonucleaseanalysis (PCR-REA), pulsed-field gel electrophoresis (PFGE),multilocus short sequence repeat (MLSSR), and variable-numbertandem repeats (VNTR), have been used to allow a profound ge-netic discrimination between M. avium subsp. paratuberculosisstrains (5, 17, 37, 38). Broadly speaking, M. avium subsp. paratu-berculosis strains can be classified into two host-associated typesbased on culture characteristics and on genome analysis: sheepstrains (also called “S type” or “type I”) and cattle strains (alsocalled “C type” or “type II”) (7, 42). A subtype of type I strains wasdesignated “intermediate” or “type III” (7, 10). The type III strainsare highly similar genetically to and difficult to distinguish fromtype I strains. Single nucleotide polymorphism analysis in theIS1311 insertion sequence distinguishes three types of strains: S, C,and B (45). It is important to point out that single nucleotidepolymorphism analysis of the IS1311 sequence cannot distinguishbetween types I and III. The culture of S-type strains has beenhistorically more difficult, with very low isolation rates on thesolid media routinely used for culture of C-type strains (20). In2005, the complete, annotated genome sequence of the bovineisolate K10 was published (22). Since then, the genomes of multi-ple isolates of M. avium subsp. paratuberculosis of different prov-enance have been subjected to whole-genome sequencing (44).
Preliminary results suggest that the human isolates are essentiallyidentical to the bovine isolate K10, while the sheep isolates containsome large sequence deletions, three of which had been previouslydescribed (25, 26, 32, 35, 40, 47). Recently, the genomes of threeU.S. sheep isolates of M. avium subsp. paratuberculosis have beensequenced, and a novel deletion comprising the open readingframes (ORFs) MAP1432 through MAP1438c (partial) was iden-tified as absent from the ovine isolates (4). Although the classifi-cation of strains into C, S, or B types may reflect a host preference,multiple strains of M. avium subsp. paratuberculosis can cross thespecies barriers and be isolated from a broad range of animal spe-cies (28, 29, 41). While the diverse M. avium subsp. paratubercu-losis strains use a similar mechanism of infection, invasion andsurvival efficiency of M. avium subsp. paratuberculosis within thehost cells appears to differ with respect to the M. avium subsp.paratuberculosis genotype (14, 18, 21). A deeper understanding ofthe pathogenesis of M. avium subsp. paratuberculosis requires firstthe development of precise methods that allow for the quantifica-tion of viable M. avium subsp. paratuberculosis cells inside thehost.
Received 27 February 2012 Returned for modification 28 March 2012Accepted 20 May 2012
Published ahead of print 30 May 2012
Address correspondence to Marta Alonso-Hearn, [email protected].
Copyright © 2012, American Society for Microbiology. All Rights Reserved.
doi:10.1128/JCM.00441-12
August 2012 Volume 50 Number 8 Journal of Clinical Microbiology p. 2609–2617 jcm.asm.org 2609

Although cultivation of mycobacteria on a solid medium suchas Lowenstein-Jensen or Middlebrook agar is relatively straight-forward, it is insensitive and may take several weeks. Culture tech-niques that use liquid medium, such as the nonradiometric BactecMycobacteria Growth Indicator Tube (MGIT) 960 system, areable to detect mycobacteria within a considerably shorter time(33). In addition, the Bactec MGIT 960 system allows for goodgrowth of most mycobacterial species (43). MGITs have been suc-cessfully used for the detection and culture of M. avium subsp.paratuberculosis from animal tissues (8, 11), milk (15), and breastmilk and gut tissues of Crohn’s disease patients (30, 34). Thequantitative capabilities of the Bactec MGIT 960 system have beenpreviously explored only for C-type M. avium subsp. paratuber-culosis strains isolated from either cattle or humans based on theobservation that generation time is proportional to inoculum size(39). The similarity of strain-specific standard curves for cattlestrains was in agreement with previous evidence that cattle strainsare genetically conserved. Therefore, a relevant measure of phe-notypic diversity within genomically diverse M. avium subsp.paratuberculosis strains can be found in their ability to grow inliquid medium. In the present study, we generated standardcurves for the quantification in a liquid culture system of strains ofM. avium subsp. paratuberculosis with distinct genotypes and iso-lated from a diverse range of hosts, including sheep, goat, andnondomestic animal species such as deer, fallow deer, wild boar,and bison.
MATERIALS AND METHODSM. avium subsp. paratuberculosis strains, bacterial culture, and prepa-ration of bacterial suspensions. Ten low-passage-number M. aviumsubsp. paratuberculosis strains isolated from cattle (Bos taurus), sheep(Ovis aries), goat (Capra aegagrus hircus), red deer (Cervus elaphus), fallowdeer (Dama dama), bison (Bison bison), and wild boar (Sus scrofa) specieswere used in this study and are presented in Table 1. These clinical isolateswere previously recovered from fecal or tissue samples of domestic orwildlife animal species and maintained as glycerol stocks at �80°C (2, 38).Most of the samples were collected in several geographic areas of Spain,but some strains isolated in India, Portugal, and the United States werealso included in the study. M. avium subsp. paratuberculosis strain K10, asequenced and laboratory-adapted isolate recovered from a clinical case ofparatuberculosis, was obtained from the American Type Culture Collec-tion (ATCC, Manassas, VA). The 11 M. avium subsp. paratuberculosisstrains selected in our study were grown in T25 tissue culture flasks at 37 �1°C for up to 3 months in 10 ml of Middlebrook 7H9 media (Difco Lab-oratories, Detroit, MI) supplemented with 10% (vol/vol) oleic acid-albu-min-dextrose-catalase (OADC) (Becton, Dickinson and Company,
Franklin Lakes, NJ), 0.05% (wt/vol) Tween 80 (Sigma-Aldrich, St. Louis,MO), and 2 mg liter�1 of mycobactin J (Allied Monitor Inc., Fayette,MO). Bacterial cells were harvested by centrifugation at 2,000 � g for 20min in a Beckman Coulter Allegra X-12 centrifuge. Bacterial pellets werewashed three times with sterile Hanks balanced salt solution (HBSS) andresuspended in 2 ml of HBSS, and the resultant suspension was passed 30times through a 27-gauge needle in order to declump cells. The turbidityof the bacterial suspension was adjusted to a McFarland standard of 1 witha Densimat (bioMérieux, Marcy l’Etoile, France). Only the top fraction ofthe suspension containing dispersed bacteria was used for the assays.
Confirmation of the presence or absence of four ORFs located inthree deletions previously identified in S strains. The M. avium subsp.paratuberculosis strains included in this study were previously character-ized in C, S, or B types by IS1311 PCR-REA (38). In the present study,genomic DNA extracted for each strain was tested for the presence orabsence of four genes (MAP1485, MAP 1487, MAP1738, and MAP2325)located in three large genomic deletions previously identified in S strains(25, 26). For genomic DNA extraction, a suspension of each strain of M.avium subsp. paratuberculosis was adjusted to a McFarland standard of 1and centrifuged for 20 min at 2,250 � g, and the supernatant was dis-carded. Bacterial pellets were resuspended in 180 �l of lysozyme (20 mgml�1) (Sigma-Aldrich) in 20 mM Tris-HCl buffer (pH 8.0) by repeatedpipetting and incubated overnight at 37°C. The next day, 20 �l of protei-nase K (2 mg ml�1) was added to each vial and the resultant lysates wereincubated at 56°C for 3 h and for a further 15 min at 95°C to inactivateproteinase K. After the addition of 200 �l of ethanol, the entire mixtureswere loaded on DNeasy minicolumns (QIAamp DNA Blood Mini Kit;Qiagen Inc., Valencia, CA) and centrifuged for 1 min at 6,000 � g. DNAbound to the QIAamp membranes was washed and subsequently elutedfrom the columns in 100 �l of sterile Tris-EDTA buffer (TE) (pH 8.0)following the manufacturer’s instructions. The concentration of the DNAwas calculated by using a NanoDrop 1000 spectrophotometer (ThermoScientific, Wilmington, DE). PCRs with specific primers (0.2 �M each)for the amplification of DNA fragments of MAP1485, MAP1487,MAP1738, MAP2325, and MAP16S rRNA genes were performed from250 ng of genomic DNA using the GC-Rich PCR system (Roche, Mann-heim, Germany) according to the manufacturer’s instructions. Specificprimers for the amplification of each ORF, their annealing temperatures,and the concentration of GC-Rich resolution solution used to generateeach PCR product are shown in Table 2. Amplified products were ana-lyzed by electrophoresis in 1% (wt/vol) agarose gels stained with GelRednucleic acid gel stain (Biotium Inc., Hayward, CA).
Generation of strain-specific standard curves. Serial dilutions (10-fold; 100 �l of 108 to 102 CFU) of suspensions of each of the 11 M. aviumsubsp. paratuberculosis strains (McFarland standard of 1) were preparedin HBSS with vortexing between dilution steps. Two supplemented BBLMGIT tubes (Becton, Dickinson and Company, Sparks, MD) were inoc-ulated with 0.1 ml of each dilution. Each MGIT tube contained 7 ml ofmodified Middlebrook 7H9 broth base with casein peptone and an oxy-gen-sensitive fluorescent compound (tris-4,7-diphenyl-1,10-phenathro-line ruthenium chloride pentahydrate) embedded in silicone on the bot-tom of the tube. Each tube was supplemented with 800 �l of anenrichment supplement containing oleic acid, bovine serum albuminwith glucose, dextrose, and catalase (BBL MGIT OADC growth supple-ment), and a reconstituted lyophilized antibiotic mixture of polymyxin B,amphotericin B, nalidixic acid, trimethoprim, and azlocillin (BBL MGITPANTA antibiotic mixture; Becton, Dickinson and Company). The tubeswere also supplemented with 2 �g ml�1 of mycobactin J. A 100-�l inoc-ulum from each of up to seven serial 10-fold dilutions made for each M.avium subsp. paratuberculosis strain was inoculated in duplicate intoMGIT tubes. The vials were incubated at 37 � 2°C for up to 41 days in theBactec MGIT 960 instrument (Becton, Dickinson and Company) andwere monitored automatically every hour for an increase of fluorescence.The earliest instrumental indication of positivity (i.e., time to detection[TTD]) for each tube was recorded. Any tube that was identified as posi-
TABLE 1 M. avium subsp. paratuberculosis strains used in this study
Strain code Region/countrySpecies oforigin
IS1311 PCR-REA type PFGE profile
K10 United States Cattle C 1-16 Cantabria/Spain Cattle C 52-1P38I Aragon/Spain Sheep C 2-12349/06-1 Portugal Sheep S334 India Sheep B 60-1711 Bizkaia/Spain Goat C 2-1311 Menorca/Spain Goat S 16-47855 Toledo/Spain Deer C 68-1622/07 Asturias/Spain Fallow deer C681 Toledo/Spain Wild boar C 2-16.1 United States Bison B 2-1
Abendaño et al.
2610 jcm.asm.org Journal of Clinical Microbiology
tive was removed from the instrument, and a sample was tested by PCR toconfirm the presence of M. avium subsp. paratuberculosis. If a tube did notsignal positive before 42 days (6 weeks) of incubation, it was removedfrom the instrument and determined to be negative. In order to generatestrain-specific standard curves for each tested strain, the TTD for eachtube (in days) was plotted against the estimated log10 number of M. aviumsubsp. paratuberculosis cells present in each inoculum.
M. avium subsp. paratuberculosis quantification by real-timeqPCR. Log10 CFU predictions for the same M. avium subsp. paratubercu-losis cell suspensions were determined by both the Bactec MGIT 960 andreal-time quantitative PCR assay (qPCR) methods. For the real-timeqPCR, genomic DNA was isolated from 100 �l of each of up to seven serial10-fold dilutions made for each M. avium subsp. paratuberculosis strain asdescribed above. Real-time qPCR assays to detect the single-copy F57insertion sequence of M. avium subsp. paratuberculosis were performed induplicate using the ParaTB Kuanti-VK kit following the manufacturer’sinstructions (Vacunek, Bizkaia, Spain). The kit uses a F57 TaqMan probelabeled with the fluorescent reporter dye 5-carboxyfluorescein (FAM) atthe 5= end. Inhibition of the amplification reaction is ruled out by includ-ing an internal hybridization probe labeled with 6-carboxy-4=,5=-di-chloro-2=,7=-dimethoxyfluorescein, succinimidyl ester (JOE) at the 5=end. Real-time qPCR amplifications were performed on an ABI Prism7500 detection system (Applied Biosystems, Carlsbad, CA) under the fol-lowing conditions: 1 cycle of denaturation at 95°C for 10 min, 45 cycles ofdenaturation at 95°C for 15 s, and annealing/extension at 60°C for 60 s.Quantification of the starting amount of target DNA in unknown sampleswas accomplished by using a standard curve generated with a series ofknown quantities of the target sequence according to the manufacturer’sinstructions. The results were analyzed with ABI Prism software v. 1.4.
Statistical analysis. The relationship between the predicted log10 CFUin the inoculum and the MGIT detection times was assessed by nonlinearregression analysis. Equations for predicting log CFU in the inoculumwith 95% confidence intervals were determined using GraphPad Prism 5(GraphPad Software, San Diego, CA). Mean TTD values for all the strainsrecorded from the Bactec MGIT 960 instrument were compared by one-way analysis of variance (ANOVA) with the Duncan posttest of the SASstatistical package (SAS Institute Inc., Cary, NC) or with the Student-Newman-Keuls multiple-comparison posttest of the GraphPad InStatversion 3.10 for Windows 95 (GraphPad Software). Differences in rela-tion to the duration of growth were considered significant when P valueswere �0.05. The relations between the predicted log10 CFU and M. aviumsubsp. paratuberculosis DNA copy numbers were evaluated by linear cor-relation analysis (Microsoft Office Excel) and by an unpaired Student ttest using GraphPad Prism 5 (GraphPad Software).
RESULTS
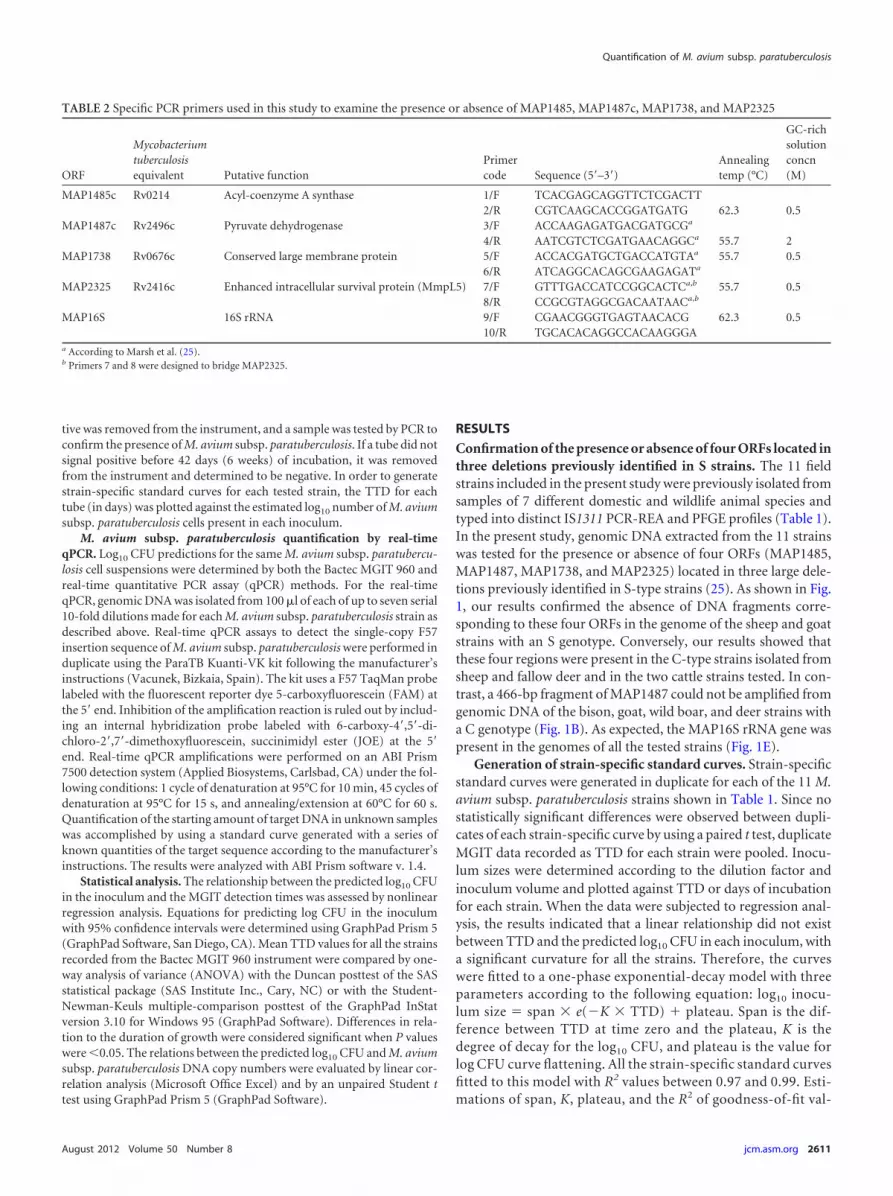
Confirmation of the presence or absence of four ORFs located inthree deletions previously identified in S strains. The 11 fieldstrains included in the present study were previously isolated fromsamples of 7 different domestic and wildlife animal species andtyped into distinct IS1311 PCR-REA and PFGE profiles (Table 1).In the present study, genomic DNA extracted from the 11 strainswas tested for the presence or absence of four ORFs (MAP1485,MAP1487, MAP1738, and MAP2325) located in three large dele-tions previously identified in S-type strains (25). As shown in Fig.1, our results confirmed the absence of DNA fragments corre-sponding to these four ORFs in the genome of the sheep and goatstrains with an S genotype. Conversely, our results showed thatthese four regions were present in the C-type strains isolated fromsheep and fallow deer and in the two cattle strains tested. In con-trast, a 466-bp fragment of MAP1487 could not be amplified fromgenomic DNA of the bison, goat, wild boar, and deer strains witha C genotype (Fig. 1B). As expected, the MAP16S rRNA gene waspresent in the genomes of all the tested strains (Fig. 1E).
Generation of strain-specific standard curves. Strain-specificstandard curves were generated in duplicate for each of the 11 M.avium subsp. paratuberculosis strains shown in Table 1. Since nostatistically significant differences were observed between dupli-cates of each strain-specific curve by using a paired t test, duplicateMGIT data recorded as TTD for each strain were pooled. Inocu-lum sizes were determined according to the dilution factor andinoculum volume and plotted against TTD or days of incubationfor each strain. When the data were subjected to regression anal-ysis, the results indicated that a linear relationship did not existbetween TTD and the predicted log10 CFU in each inoculum, witha significant curvature for all the strains. Therefore, the curveswere fitted to a one-phase exponential-decay model with threeparameters according to the following equation: log10 inocu-lum size � span � e(�K � TTD) � plateau. Span is the dif-ference between TTD at time zero and the plateau, K is thedegree of decay for the log10 CFU, and plateau is the value forlog CFU curve flattening. All the strain-specific standard curvesfitted to this model with R2 values between 0.97 and 0.99. Esti-mations of span, K, plateau, and the R2 of goodness-of-fit val-
TABLE 2 Specific PCR primers used in this study to examine the presence or absence of MAP1485, MAP1487c, MAP1738, and MAP2325
ORF
Mycobacteriumtuberculosisequivalent Putative function
Primercode Sequence (5=–3=)
Annealingtemp (°C)
GC-richsolutionconcn(M)
MAP1485c Rv0214 Acyl-coenzyme A synthase 1/F TCACGAGCAGGTTCTCGACTT2/R CGTCAAGCACCGGATGATG 62.3 0.5
MAP1487c Rv2496c Pyruvate dehydrogenase 3/F ACCAAGAGATGACGATGCGa
4/R AATCGTCTCGATGAACAGGCa 55.7 2MAP1738 Rv0676c Conserved large membrane protein 5/F ACCACGATGCTGACCATGTAa 55.7 0.5
6/R ATCAGGCACAGCGAAGAGATa
MAP2325 Rv2416c Enhanced intracellular survival protein (MmpL5) 7/F GTTTGACCATCCGGCACTCa,b 55.7 0.58/R CCGCGTAGGCGACAATAACa,b
MAP16S 16S rRNA 9/F CGAACGGGTGAGTAACACG 62.3 0.510/R TGCACACAGGCCACAAGGGA
a According to Marsh et al. (25).b Primers 7 and 8 were designed to bridge MAP2325.
Quantification of M. avium subsp. paratuberculosis
August 2012 Volume 50 Number 8 jcm.asm.org 2611
ues between TTD and log10 CFU for each strain-specific curveare shown in Table 3.
Comparison of strain-specific standard curves and genera-tion of universal-standard curves. Multiple comparisons of theTTD means of all the strains recorded by the Bactec MGIT 960instrument were made by one-way ANOVA. Differences amongthe standard deviations (SDs) of the TTD means were not signif-icant (Bartlett’s test, P � 0.6564). Means, sample size, and clusteranalysis of the TTD data using the Duncan post-ANOVA test areshown in Table 4. When the Student-Newman-Keuls multiple-comparison posttest was used, similar cluster results were ob-tained. By comparing the mean TTDs of all the strains with themean TTD of the reference strain K10, two groups of strains weregenerated. A first group containing M. avium subsp. paratubercu-losis strains that took longer to reach a TTD for a given inoculumsize than the K10 strain was identified. All the strains in group Ihad significant differences between their mean TTD and the meanTTD of the K10 strain (P � 0.05). Group I included the S-typestrain isolated from goat and all the sheep strains with C, S, and Bgenotypes. Interestingly, a C-type strain isolated from fallow deer(strain 622/07) took longer to reach a TTD for a given inoculumsize than all the strains included in group II, and therefore it was
clustered within group I. Statistical analysis indicated that group Istrains behaved in a similar manner in terms of a relationshipbetween TTD and estimated inoculum size (ANOVA, P �0.6544). Since clustering analysis revealed that the TTD means ofthe S-type strains were closer, cluster A containing the sheep andgoat strains with an S genotype was created within group I strains.Cluster B included the C- and B-type strains isolated from sheep,and cluster C included only the fallow deer strain (strain 622/07).Figure 2A depicts fitted plots of predicted log10 CFU in the inoc-ulum against TTD for all the M. avium subsp. paratuberculosisstrains included in group I.
Group II contained the C-type strains isolated from cattle,goat, wild boar, and deer and the B-type strain from bison. Nosignificant differences were observed between the TTD of all thestrains included in this group and the TTD of the reference strainK10 isolated from cattle (P � 0.05). Two clusters within group IIwere made up; cluster D included the cattle (strain 14-35), the
FIG 1 PCR assays to test the presence or absence of four ORFs located in threelong deletions previously identified in S strains. Panels A, B, C, D, and E showthe amplified products corresponding to the MAP1485, MAP1487, MAP1738,MAP2325, and MAP 16S rRNA genes, respectively. Genomic DNAs extractedfrom the following strains were used as templates (strain type is in parenthe-ses): lane 1, sheep (S); lane 2, goat (S); lane 3, sheep (C); lane 4, sheep (B); lane5, fallow deer (C); lane 6, cattle (C) (strain K10); lane 7, cattle (C); lane 8, bison(B); lane 9, wild boar (C); lane 10, goat (C); lane 11, deer (C). MW, 1-kb DNAladder (Invitrogen).
TABLE 3 Estimations of span, K, plateau, and the R2 of goodness-of-fitvalues between TTD and estimated log10 CFU for each strain-specificcurvea
Straincode
Host PCR-REA type Span K Plateau R2
K10 Cattle–C 11.48 0.0503 �1.316 0.99096 Cattle–C 16.44 0.0220 �6.080 0.9887P38I Sheep–C 9.972 0.0211 �0.634 0.99712349/06-1 Sheep–S 11.82 0.0724 3.222 0.9808334 Sheep–B 11.86 0.0298 �0.480 0.9713711 Goat–C 17.25 0.0301 �8.208 0.9979311 Goat–S 9.511 0.0612 3.016 0.9958855 Deer–C 10.95 0.1927 1.317 0.9840622/07 Fallow deer–C 15.15 0.0257 �2.965 0.9976622/07 Fallow deer–C 12.34 0.0236 �2.159 0.9770681 Wild boar–C 8.755 0.0486 0.760 0.98766.1 Bison–B 17.34 0.0253 �6.077 0.99596.1 Bison–B 20.84 0.0256 �9.508 0.98986.1 Bison–B 18.33 0.1104 2.516 0.9901a Equation for exponential-decay model: log10 inoculum size � span � e(�K �TTD) � plateau (see the text). Data from two and three standard curves of the fallowdeer (strain 622/07) and bison (strain 6.1) isolates, respectively, are shown.
TABLE 4 Comparison of TTD data recorded in the Bactec MGIT 960system and cluster analysis of M. avium subsp. paratuberculosis strainsa
Straincode
Host–PCR-REA
Samplesize (n)
MeanTTD SD
Clusteringanalysis
Pvalue
2349/06-1 Sheep–S 14 32.264 10.852 A Group I �0.05311 Goat–S 14 31.814 11.455 A Group I �0.05P38I Sheep–C 14 31.164 11.208 B Group I �0.05334 Sheep–B 14 30.993 10.279 B Group I �0.05622/07 Fallow deer–C 28 29.754 10.443 C Group I �0.056 Cattle–C 14 24.800 11.798 D Group II �0.056.1 Bison–B 42 23.412 11.337 D Group II �0.05681 Wild boar–C 14 23.157 13.375 D Group II �0.05K10 Cattle–C 14 18.186 11.384 E Group II711 Goat–C 14 14.800 11.915 E Group II �0.05855 Deer–C 14 9.736 6.194 E Group II �0.05a No significant differences were observed between the TTDs of the strains included ingroup II and the TTD of strain K10. Group I contained strains that took longer to reacha TTD for a given inoculum size than the reference strain. Strains with the highestsimilarity in TTD were clustered within categories labeled A to D. Differences with Pvalues of �0.05 were considered significant.
Abendaño et al.
2612 jcm.asm.org Journal of Clinical Microbiology

bison, and the wild boar strains, and cluster E contained the lab-oratory-adapted strain K10 and the goat and the deer strains. Itshould be noted that the mean TTD for the deer isolate (strain855) was shorter than the TTD of any other strain in the BactecMGIT 960 system and statistically different from the mean TTD ofcluster D strains. Figure 2B depicts fitted curve plots of predictedlog10 CFU in the inoculum against TTD for group II strains.
The relationship between the predicted log10 CFU of the inoc-ulum and the MGIT detection times was assessed for group I andgroup II strains by nonlinear regression analysis. Universal curvesand the corresponding equations for predicting log10 CFU in theinoculum with 95% confidence intervals were determined forgroup I and group II strains and are shown in the upper parts ofFig. 2A and B, respectively.
Comparison between universal-standard curves and strain-specific curves. The validity of applying the universal-standardcurve for each strain was determined by cross-validation. The pre-dicted log10 CFU obtained from the strain-specific curve gener-ated for each strain was compared with the estimated log10 CFUobtained by using group I or group II universal-standard curves.For all the strains tested in the study, high correlations were ob-tained between the predicted log10 CFU for each inoculum esti-mated by both standard curves, universal and strain specific (R �0.9). For the deer isolate (strain 855), the correlation between thestrain-specific and the universal-standard curves had the lowest Rvalue (R � 0.9193). Differences between mean TTD values foreach M. avium subsp. paratuberculosis strain calculated using ei-ther the strain-specific standard curve or the universal-standard
curve were considered to be statistically nonsignificant (unpairedt test, P � 0.05).
Reproducibility of the MGIT counting method. Two M.avium subsp. paratuberculosis strains, the bison and the fallowdeer strains, were selected for reproducibility analysis of standardcurves. Standard curves were repeated for these strains, and thealgorithms for predicting log10 CFU in the inoculum of each rep-licate are shown in Table 3. When the mean TTD values werecompared using a paired t test, no significant variation in recordeddetection times was noted in any of the experiments performed intriplicate with the bison strain (P � 0.6477 and P � 0.6861) and induplicate with the fallow deer isolate (strain 622/07) (P � 0.8792).The consistency of the replicates was measured by the correlationcoefficient (R), which indicates the linearity of the log10 CFU val-ues plotted. When log10 CFU estimations were compared at thesame inoculum sizes, the correlation (R) between the log10 CFUestimations predicted by each experiment was 0.99 for the bisonstrain and 0.97 for the fallow deer strain.
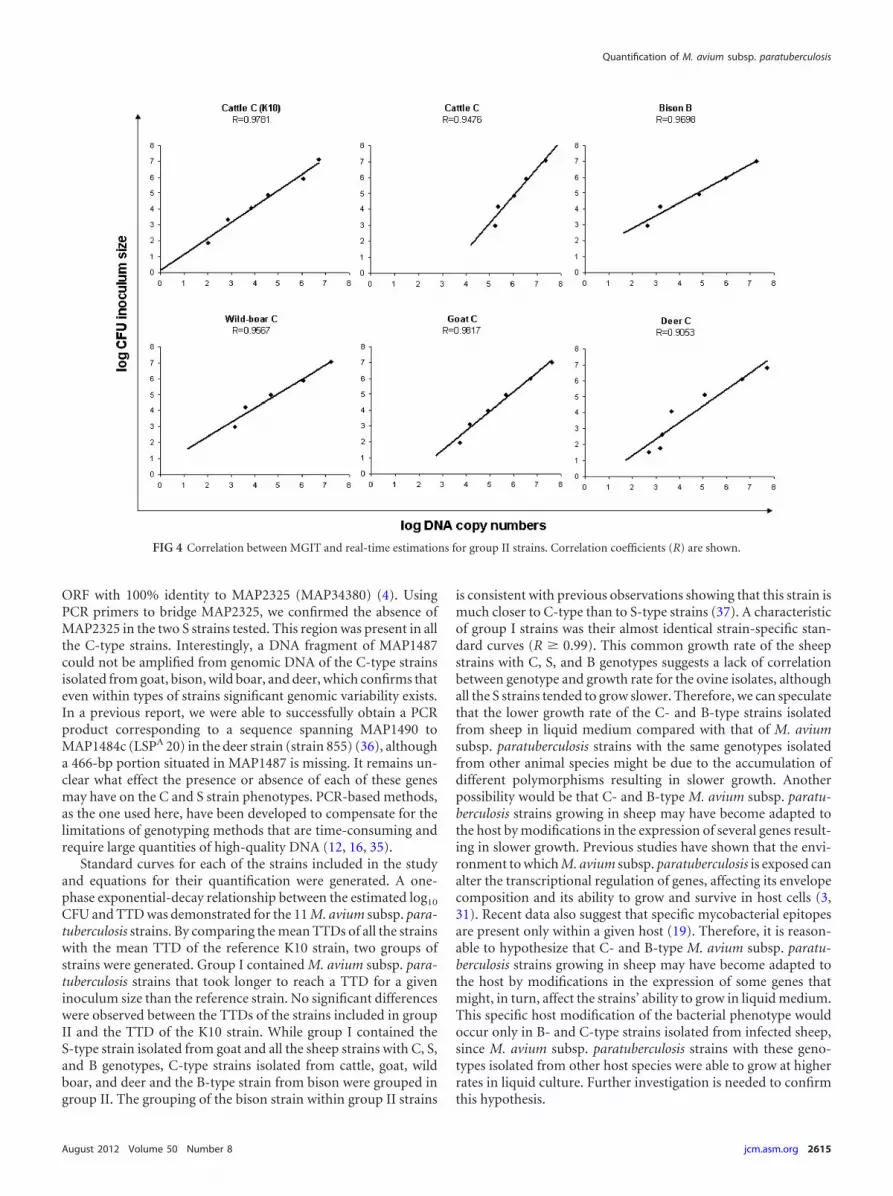
Comparison of the M. avium subsp. paratuberculosis quan-titative capabilities of the Bactec MGIT 960 and qPCR methods.Log10 CFU predictions from the same M. avium subsp. paratuber-culosis cell suspensions calculated using qPCR or the Bactec MGIT960 system were compared. The relationships between the pre-dicted log10 CFU and DNA copy numbers were evaluated usingthe correlation coefficients (R) for group I and group II M. aviumsubsp. paratuberculosis strains and are shown in Fig. 3 and 4, re-spectively. A significant linear correlation with R values between0.90 and 0.99 was obtained for all the tested strains. Predicted log10
FIG 2 Relationship between estimated log10 CFU inoculum size and TTD for group I strains (A) and group II strains (B) by nonlinear regression. Universal-standard curves from the pooled data of each group of strains were generated, and their corresponding equations are shown in the upper part of the panels.
Quantification of M. avium subsp. paratuberculosis
August 2012 Volume 50 Number 8 jcm.asm.org 2613
CFU concentrations for each M. avium subsp. paratuberculosisstrain based on the strain-specific curve did not differ significantlyfrom DNA copy numbers (unpaired t test, P � 0.05).
DISCUSSION
Understanding the interaction of M. avium subsp. paratuberculo-sis with its host is important to have a better knowledge of thepathogenesis of the infection. However, M. avium subsp. paratu-berculosis-host interactions are not well understood, in part be-cause of the lack of reliable methods for quantifying numbers ofviable M. avium subsp. paratuberculosis cells. Because of its veryslow replication rate (average generation time in liquid media, 1.4days) and its tendency to clump, M. avium subsp. paratuberculosishas been difficult to quantify by routine bacteriological methods(13). A microscopic fluorescence-based method to semiquantifyboth the number of host macrophages and the number of M.avium subsp. paratuberculosis bacteria in in vitro assays was previ-ously developed (27). However, this method is very time-consum-ing and, as with all microscopy-based assays, very subjective. Cul-ture in solid media is considered the “gold standard” method todetect and quantify viable M. avium subsp. paratuberculosis cellsin the laboratory in spite of some of its limitations (46). Standardplate counting methods for slowly growing mycobacteria are la-borious, expensive, and time-consuming and frequently fail dueto either contamination or medium dehydration during the longincubation period. Because of this bacterium’s tendency to formclumps, M. avium subsp. paratuberculosis culture in solid mediaunderestimates the number of CFU present in a sample. In com-
parison, systems that use a liquid medium for M. avium subsp.paratuberculosis culture, such as the Bactec MGIT 960 system,have better analytical sensitivity and require less time to growmycobacteria (9). Since the software of this system does not esti-mate the number of CFU present in a sample, an algorithm forconverting TTD in days into the predicted number of inoculatedM. avium subsp. paratuberculosis cells was previously reported forC-type M. avium subsp. paratuberculosis strains isolated from ei-ther cattle or humans (39). However, the quantitative capabilitiesof the Bactec MGIT 960 system had not been previously exploredfor M. avium subsp. paratuberculosis strains isolated from wildlifeanimals or from domestic species other than cattle or sheep.
In the present study, growth rates in a liquid culture system of11 M. avium subsp. paratuberculosis strains isolated from diversehosts were estimated. These strains were previously isolated andtyped into distinct IS1311 PCR-REA and PFGE profiles. GenomicDNA extracted from the 11 strains was tested here for the presenceor absence of four ORFs (MAP1485, MAP1487, MAP1738, andMAP2325) located in three deletions previously identified in Sstrains (25). The S strains isolated from goat and sheep lackedDNA fragments corresponding to MAP1485 and MAP1738, whilefragments of these genes were detected in all the C-type strainstested. This result confirms that MAP1485 and MAP1738 are truemarkers that clearly differentiate the two main M. avium subsp.paratuberculosis genotypes. MAP2325 was initially identified asbeing absent from Australian sheep isolates of M. avium subsp.paratuberculosis via microarray analysis, but sequencing of thesheep isolate M. avium subsp. paratuberculosis S397 identified an
FIG 3 Correlation between real-time qPCR and MGIT estimations for group I strains. Data from two independent standard curves of the fallow deer isolate(strain 622/07) are shown. Correlation coefficients (R) are shown.
Abendaño et al.
2614 jcm.asm.org Journal of Clinical Microbiology
ORF with 100% identity to MAP2325 (MAP34380) (4). UsingPCR primers to bridge MAP2325, we confirmed the absence ofMAP2325 in the two S strains tested. This region was present in allthe C-type strains. Interestingly, a DNA fragment of MAP1487could not be amplified from genomic DNA of the C-type strainsisolated from goat, bison, wild boar, and deer, which confirms thateven within types of strains significant genomic variability exists.In a previous report, we were able to successfully obtain a PCRproduct corresponding to a sequence spanning MAP1490 toMAP1484c (LSPA 20) in the deer strain (strain 855) (36), althougha 466-bp portion situated in MAP1487 is missing. It remains un-clear what effect the presence or absence of each of these genesmay have on the C and S strain phenotypes. PCR-based methods,as the one used here, have been developed to compensate for thelimitations of genotyping methods that are time-consuming andrequire large quantities of high-quality DNA (12, 16, 35).
Standard curves for each of the strains included in the studyand equations for their quantification were generated. A one-phase exponential-decay relationship between the estimated log10
CFU and TTD was demonstrated for the 11 M. avium subsp. para-tuberculosis strains. By comparing the mean TTDs of all the strainswith the mean TTD of the reference K10 strain, two groups ofstrains were generated. Group I contained M. avium subsp. para-tuberculosis strains that took longer to reach a TTD for a giveninoculum size than the reference strain. No significant differenceswere observed between the TTDs of the strains included in groupII and the TTD of the K10 strain. While group I contained theS-type strain isolated from goat and all the sheep strains with C, S,and B genotypes, C-type strains isolated from cattle, goat, wildboar, and deer and the B-type strain from bison were grouped ingroup II. The grouping of the bison strain within group II strains
is consistent with previous observations showing that this strain ismuch closer to C-type than to S-type strains (37). A characteristicof group I strains was their almost identical strain-specific stan-dard curves (R � 0.99). This common growth rate of the sheepstrains with C, S, and B genotypes suggests a lack of correlationbetween genotype and growth rate for the ovine isolates, althoughall the S strains tended to grow slower. Therefore, we can speculatethat the lower growth rate of the C- and B-type strains isolatedfrom sheep in liquid medium compared with that of M. aviumsubsp. paratuberculosis strains with the same genotypes isolatedfrom other animal species might be due to the accumulation ofdifferent polymorphisms resulting in slower growth. Anotherpossibility would be that C- and B-type M. avium subsp. paratu-berculosis strains growing in sheep may have become adapted tothe host by modifications in the expression of several genes result-ing in slower growth. Previous studies have shown that the envi-ronment to which M. avium subsp. paratuberculosis is exposed canalter the transcriptional regulation of genes, affecting its envelopecomposition and its ability to grow and survive in host cells (3,31). Recent data also suggest that specific mycobacterial epitopesare present only within a given host (19). Therefore, it is reason-able to hypothesize that C- and B-type M. avium subsp. paratu-berculosis strains growing in sheep may have become adapted tothe host by modifications in the expression of some genes thatmight, in turn, affect the strains’ ability to grow in liquid medium.This specific host modification of the bacterial phenotype wouldoccur only in B- and C-type strains isolated from infected sheep,since M. avium subsp. paratuberculosis strains with these geno-types isolated from other host species were able to grow at higherrates in liquid culture. Further investigation is needed to confirmthis hypothesis.
FIG 4 Correlation between MGIT and real-time estimations for group II strains. Correlation coefficients (R) are shown.
Quantification of M. avium subsp. paratuberculosis
August 2012 Volume 50 Number 8 jcm.asm.org 2615
Although group II strains grew faster than group I strains,more strain-to-strain difference in growth curves was observed forgroup II strains. Group II strains had previously known diversity(in host origin, RFLP pattern, etc.); therefore, the differencesfound were not really surprising. In fact, the type-C strain isolatedfrom deer (strain 855) had a significantly shorter mean TTD thanthose of the cattle and wildlife strains with a C genotype includedin cluster D. It should be noted that this strain showed a novel anddistinct PFGE profile (68-1), identified only in deer as far as weknow. The fact that the deer strain grew faster than any of the M.avium subsp. paratuberculosis strains tested in liquid medium isassociated with the observed strong infectivity of C-type M. aviumsubsp. paratuberculosis strains in farmed deer. In contrast to thechronicity of paratuberculosis in cattle, an acute form of paratu-berculosis often occurs in farmed red deer under 1 year of age,which has dramatic consequences for the whole breeding group(23, 24). It is debatable whether this increased virulence in farmedred deer under 1 year of age compared to bovine paratuberculosisis due to specific farm management practices, to specific hostmodification of the bacterial phenotype, to intrinsic genotypicmodifications of the strains isolated from deer, or to a combina-tion of these factors. Another C-type strain isolated from a cervid,in particular from fallow deer (strain 622/07), had a very differentphenotype from that of the deer strain (strain 855) in liquid cul-ture medium. In fact, the C-type strain isolated from fallow deertook longer to be detected at a given inoculum size than the C-typestrains included in cluster E; therefore, it was included in group I.
The TTD data reported by the Bactec MGIT 960 system highlycorrelated with DNA copy numbers determined by real-timeqPCR, suggesting that the qPCR of the F57 single-copy gene is afast and accurate method to estimate total M. avium subsp. para-tuberculosis cell numbers in a sample grown to exponential phasein liquid medium. It should be noted that the precision of theliquid system used here is lowest when small numbers of organ-isms are present. The Bactec MGIT 960 system was capable ofdetecting M. avium subsp. paratuberculosis growth in a sterile sa-line suspension that originally contained �103 to 104 CFU/ml forgroup I strains and �102 to 103 CFU/ml for group II strains within41 days. For the deer strain, the system was shown to be capable ofdetecting as few as 10 cells within the same time period. When thereal-time qPCR method was used under optimum conditions, asimilar detection limit (10 copies per reaction) was obtained. Apotential drawback in the use of the Bactec MGIT 960 system is thecontamination of the vials. However, contamination rates in ourcultures were less than 6%. Usually, contamination is easily rec-ognized and is unlikely to confuse enumeration attempts.
Once a regression relationship between inoculum size andTTD was established for each M. avium subsp. paratuberculosisstrain included in our study, the measurement of TTD provided afast and useful way to predict viable numbers of each particularstrain. For instance, we have been able to predict the numbers ofviable M. avium subsp. paratuberculosis organisms in culturedmacrophages at different times postinfection by using our math-ematical model, which relates TTD in days to the estimated log10
number of M. avium subsp. paratuberculosis cells (1). Having es-tablished that the Bactec MGIT 960 system provides a precisemethod for evaluating in vitro intracellular growth dynamics, thismethod is being used in ongoing pathogenesis studies.
In summary, we describe a simple and fast method for quanti-fying M. avium subsp. paratuberculosis strains isolated from di-
verse hosts, including wildlife animal species. For the cattlestrains, the similarity of their strain-specific curves confirmed pre-vious observations that M. avium subsp. paratuberculosis strainsisolated from cattle are very conserved. Although a few strainsisolated from sheep were included in the study, we observed highsimilarity in the standard curves of these strains, irrespective oftheir genotype, which suggested a lack of correlation between ge-notype and growth rate in liquid medium for the ovine strains. Incontrast, the M. avium subsp. paratuberculosis strains isolatedfrom goat and from nondomestic species, in particular fromcervids, showed greater phenotypic diversity.
ACKNOWLEDGMENTS
Financial support for this work was provided by a grant from the InstitutoNacional de Investigación y Tecnología Agraria y Alimentaria (INIA,Spain) and from European Funds for Regional Development (FAU2008-00018-C02-00). Marta Alonso-Hearn’s tenure is partly covered by theINIA tenure track program for the incorporation of PhD graduates intoresearch institutions. Naiara Abendaño has a fellowship from the depart-ment of Agriculture of the Basque Government.
We thank the farmers and veterinarians who helped with the collec-tion of the animal samples used in this study. We thank Kyle Hearn for thecareful editing of the manuscript.
REFERENCES1. Abendaño N, et al. 2012. A large-scale study of differential virulence of
Mycobacterium avium subsp. paratuberculosis strains with distinct geno-types and isolated from diverse hosts in bovine macrophages, abstr OR-037, p 96. Abstr. 11th Int. Colloq. Paratuberc. International Association ofParatuberc, Rehoboth, MA.
2. Aduriz JJ, Juste RA, Cortabarría N. 1995. Lack of mycobactin depen-dence of mycobacteria isolated on Middlebrook 7H11 from clinical casesof ovine paratuberculosis. Vet. Microbiol. 45:211–217.
3. Alonso-Hearn M, Eckstein TM, Sommer S, Bermudez LE. 2010. AMycobacterium avium subsp. paratuberculosis LuxR regulates cell envelopeand virulence. Innate Immun. 16:235–247.
4. Bannantine JP, et al. 2012. Genome sequencing of ovine isolates of My-cobacterium avium subsp. paratuberculosis offers insights into host associ-ation. BMC Genomics 13:89. doi:10.1186/1471-2164-13-89.
5. Castellanos E, Juan LD, Dominguez L, Aranaz A. 2012. Progress inmolecular typing of Mycobacterium avium subspecies paratuberculosis.Res. Vet. Sci. 92:169 –179.
6. Chamberlin W, et al. 2001. Review article: Mycobacterium avium subsp.paratuberculosis as one cause of Crohn’s disease. Aliment. Pharmacol.Ther. 15:337–346.
7. Collins DM, Gabric DM, de Lisle GW. 1990. Identification of two groupsof Mycobacterium paratuberculosis strains by restriction analysis and DNAhybridization. J. Clin. Microbiol. 28:1591–1596.
8. Cousins DV, Evans RJ, Francis BR. 1995. Use of BACTEC radiometricculture method and polymerase chain reaction for the rapid screening offaeces and tissues for Mycobacterium paratuberculosis. Aust. Vet. J. 72:458 – 462.
9. Cruciani M, et al. 2004. Meta-analysis of BACTEC MGIT 960 andBACTEC 460 TB, with or without solid media, for detection of myco-bacteria. J. Clin. Microbiol. 42:2321–2325.
10. de Juan L, Mateos A, Dominguez L, Sharp JM, Stevenson K. 2005.Genetic diversity of Mycobacterium avium subspecies paratuberculosis iso-lates from goats detected by pulsed-field gel electrophoresis. Vet. Micro-biol. 106:249 –257.
11. de Lisle GW, Yates GF, Cavaignac S, Collins DM. 1999. Evalulation ofMGIT system for culturing Mycobacterium avium subspecies paratubercu-losis and characterization of strains by polymerase chain reaction test, p511. In Manning EJB, Collins MT (ed), Proc. 6th Int. Colloq. Paratuberc.International Association of Paratuberculosis, Rehoboth, MA.
12. Douarre PE, Cashman W, Buckley J, Coffey A, O’Mahony J. 2012. Highresolution melting PCR to differentiate Mycobacterium avium subsp.paratuberculosis “cattle type” and “sheep type.” J. Microbiol. Methods88:172–174.
Abendaño et al.
2616 jcm.asm.org Journal of Clinical Microbiology
13. Elguezabal N, et al. 2011. Estimation of Mycobacterium avium subsp.paratuberculosis growth parameters: strain characterization and compar-ison of methods. Appl. Environ. Microbiol. 77:8615– 8624.
14. Gollnick NS, et al. 2007. Survival of Mycobacterium avium subsp. para-tuberculosis in bovine monocyte-derived macrophages is not affected byhost infection status but depends on the infecting bacterial genotype. Vet.Immunol. Immunopathol. 120:93–105.
15. Grant IR, Kirk RB, Hitchings EI, Rowe MT. 2003. Comparative evalu-ation of the MGIT and BACTEC culture systems for the recovery of My-cobacterium avium subsp. paratuberculosis from milk. J. Appl. Microbiol.95:196 –201.
16. Griffiths TA, Rioux K, de Buck J. 2008. Sequence polymorphisms in asurface PPE protein distinguish types I, II and III of Mycobacterium aviumsubsp. paratuberculosis. J. Clin. Microbiol. 46:1207–1212.
17. Harris NB, Payeur JB, Kapur V, Sreevatsan S. 2006. Short-sequence-repeat analysis of Mycobacterium avium subsp. paratuberculosis and My-cobacterium avium subsp. avium isolates collected from animals through-out the United States reveals both stability of loci and extensive diversity.J. Clin. Microbiol. 44:2970 –2973.
18. Janagama HK, Jeong KI, Kapur V, Coussens P, Sreevatsan S. 2006.Cytokine responses of bovine macrophages to diverse clinical Mycobacte-rium avium subspecies paratuberculosis strains. BMC Microbiol. 6:10. doi:10.1186/1471-2180-6-10.
19. Janagama HK, et al. 2010. Primary transcriptomes of Mycobacteriumavium subspecies paratuberculosis reveal proprietary pathways in tissueand macrophages. BMC Genomics 11:561. doi:10.1186/1471-2164-11-561.
20. Juste RA, Marco JC, Saez de Ocariz C, Aduriz JJ. 1991. Comparison ofdifferent media for the isolation of small ruminant strains of Mycobacte-rium paratuberculosis. Vet. Microbiol. 28:385–390.
21. Kabara E, et al. 2010. A large-scale study of differential gene expression inmonocyte-derived macrophages infected with several strains of Mycobac-terium avium subspecies paratuberculosis. Brief. Funct. Genomics 9:220 –237.
22. Li L, et al. 2005. The complete genome sequence of Mycobacterium aviumsubspecies paratuberculosis. Proc. Natl. Acad. Sci. U. S. A. 102:12344 –12349.
23. Mackintosh CG, et al. 2010. Age susceptibility of red deer (Cervuselaphus) to paratuberculosis. Vet. Microbiol. 143:255–261.
24. Mackintosh CG, de Lisle GW, Collins DM, Griffin JF. 2004. Mycobac-terial diseases of deer. N. Z. Vet. J. 52:163–174.
25. Marsh IB, et al. 2006. Genomic comparison of Mycobacterium aviumsubsp. paratuberculosis sheep and cattle strains by microarray hybridiza-tion. J. Bacteriol. 188:2290 –2293.
26. Marsh IB, Whittington RJ. 2005. Deletion of an mmpL gene and multipleassociated genes from the genome of the S strain of Mycobacterium aviumsubsp. paratuberculosis identified by representational difference analysisand in silico analysis. Mol. Cell. Probes 19:371–384.
27. Mitchell RM, Gollnick NS, Sreevatsan S, Russell DG, Schukken YH.2011. Quantification of Mycobacterium avium subsp. paratuberculosis(MAP) survival in monocyte-derived macrophages. Vet. Immunol. Im-munopathol. 139:73–78.
28. Moloney BJ, Whittington RJ. 2008. Cross species transmission of ovineJohne’s disease from sheep to cattle: an estimate of prevalence in exposedsusceptible cattle. Aust. Vet. J. 86:117–123.
29. Muskens J, Bakker D, de Boer J, van Keulen L. 2001. Paratuberculosis insheep: its possible role in the epidemiology of paratuberculosis in cattle.Vet. Microbiol. 78:101–109.
30. Naser SA, Schwartz D, Shafran I. 2000. Isolation of Mycobacteriumavium subsp. paratuberculosis from breast milk of Crohn’s disease pa-tients. Am. J. Gastroenterol. 95:1094 –1095.
31. Patel D, et al. 2006. The ability of Mycobacterium avium subsp. paratu-berculosis to enter bovine epithelial cells is influenced by preexposure to ahyperosmolar environment and intracellular passage in bovine mammaryepithelial cells. Infect. Immun. 74:2849 –2855.
32. Paustian ML, et al. 2008. Comparative genomic analysis of Mycobacte-rium avium subspecies obtained from multiple host species. BMCGenomics 9:135. doi:10.1186/1471-2164-9-135.
33. Pfyffer GE, et al. 1997. Comparison of the Mycobacteria Growth Indica-tor Tube (MGIT) with radiometric and solid culture for recovery of acid-fast bacilli. J. Clin. Microbiol. 35:364 –368.
34. Schwartz D, et al. 2000. Use of short-term culture for identification ofMycobacterium avium subsp. paratuberculosis in tissue from Crohn’s dis-ease patients. Clin. Microbiol. Infect. 6:303–307.
35. Semret M, Turenne CY, de Haas P, Collins DM, Behr MA. 2006.Differentiating host-associated variants of Mycobacterium avium by PCRfor detection of large sequence polymorphisms. J. Clin. Microbiol. 44:881– 887.
36. Sevilla I, et al. Inter and intra-subtype genotypic differences that divideMycobacterium avium subsp. paratuberculosis strains, abstr P-196, p 56.Abstr. 10th Int. Colloq. Paratuberc. International Association of Paratu-berculosis, Rehoboth, MA.
37. Sevilla I, Garrido JM, Geijo M, Juste RA. 2007. Pulsed-field gel electro-phoresis profile homogeneity of Mycobacterium avium subspecies paratu-berculosis isolates from cattle and heterogeneity of those from sheep andgoats. BMC Microbiol. 7:18. doi:10.1186/1471-2180-7-18.
38. Sevilla I, et al. 2005. Molecular typing of Mycobacterium avium subspeciesparatuberculosis strains isolated from different host species and geo-graphic locations. Rev. Sci. Tech. 24:1061–1066.
39. Shin SJ, Han JH, Manning EJ, Collins MT. 2007. Rapid and reliablemethod for quantification of Mycobacterium paratuberculosis by use of theBACTEC MGIT 960 system. J. Clin. Microbiol. 45:1941–1948.
40. Sohal JS, et al. 2009. Genomic analysis of local isolate of Mycobacteriumavium subspecies paratuberculosis. Vet. Microbiol. 134:375–382.
41. Stevenson K, et al. 2009. Occurrence of Mycobacterium avium subspeciesparatuberculosis across host species and European countries with evidencefor transmission between wildlife and domestic ruminants. BMC Micro-biol. 9:212. doi:10.1186/1471-2180-9-212.
42. Stevenson K, et al2002. Molecular characterization of pigmented andnon-pigmented isolates of Mycobacterium avium subspecies paratubercu-losis. J. Clin. Microbiol. 40:1798 –1804.
43. Stitt DT, Sturm KM, Hagemann PA. 1997. Preliminary methods forgrowing Mycobacterium paratuberculosis using the BBL® MGIT Myco-bacteria Growth Indicator Tube, p 290 –295. In Chiodini RJ, Hines ME,Collins MT (ed), Proc. 5th Int. Colloq. Paratuberc. International As-sociation of Paratuberculosis, Rehoboth, MA.
44. Thibault VC, et al. 2012. Genome sequencing to identify phylogeneticdiversity and single nucleotide polymorphisms in Mycobacterium aviumsubsp. paratuberculosis, abstr OR-048, p 111. Abstr. 11th Int. Colloq. Para-tuberc. International Association of Paratuberculosis, Rehoboth, MA.
45. Whittington RJ, Marsh IB, Whitlock RH. 2001. Typing of IS1311 poly-morphisms confirms that bison (Bison bison) with paratuberculosis inMontana are infected with a strain of Mycobacterium avium subsp. para-tuberculosis distinct from that occurring in cattle and other domesticatedlivestock. Mol. Cell. Probes 15:139 –145.
46. Whittington RJ, Sergeant ES. 2001. Progress towards understanding thespread, detection and control of Mycobacterium avium subsp paratuber-culosis in animal populations. Aust. Vet. J. 79:267–278.
47. Wu CW, Glasner J, Collins M, Naser S, Talaat AM. 2006. Whole-genome plasticity among Mycobacterium avium subspecies: insights fromcomparative genomic hybridizations. J. Bacteriol. 188:711–723.
Quantification of M. avium subsp. paratuberculosis
August 2012 Volume 50 Number 8 jcm.asm.org 2617
Related Documents