1060 Anal. Chem. 1993, 65, 1960-1968 Quantification of Lithium, Beryllium, and Boron in Silicates by Secondary Ion Mass Spectrometry Using Conventional Energy Filtering Luisa Ottolini,’J Piero BottazziJ and Riccardo VannuccitJ Consiglio Nazionale delle Ricerche, Centro di Studio per la Cristallochimica e la Cristallografia and Dipartimento Scienze della Terra, Universit& di Pavia, Via A. Bassi n. 4, I-27100 Pavia, Italy A SIMS procedure for Li, Be,and B quantification in silicates has been developed using the empirical approach of working curves via calibration with standards. Medium- to high-energy secondary ions have been used to reduce matrix effects affecting especially Li/Si ionization and to im- prove measurement reproducibility with respect to low-energy ion analysis for Li, Be, and B. In the case of Be, there has been evidence for a possible reduction of matrix effects, whereas in the case of B, matrix effects have been evidenced to be rather low at any ion energy, and in such a case, the application of a voltage offset has been useful only to improve measurement reproduc- ibility. Positive ions of the isotopes ‘Li, 9Be, llB, and 3OSi (assumedas the matrix reference isotope), havingemission kinetic energies ranging from -75 to 125 eV, have been monitored using an ion microprobe Cameca IMS 4F. The calibration curves hold over extended concentration ranges from ppm to percent level by weight for light elements and silica contents ranging from a few percent to more than 80 % by weight. Precision and accuracy of the method are generally esti- mated as better than *20% relative at the ppm level and better than *lo% relative for element abundances of tens of ppm for Be and B. As for Li, the whole uncertainty in the proposed SIMS procedure is evaluated at about f20% (28% for lead crystal glasses). These results have impor- tant implications for more extensive applications of SIMS as a “routine” microanalytical and bulk technique for the quantification of Li, Be, and B in silicate minerals and rocks. The importance of the electron microprobe (EPM) in earth sciences is essentially due to its ability to carry out rapid, accurate, nondestructive analyses of major and minor ele- menta a t high spatial resolution (near 1 pm). This has allowed investigation of inter- and intragrain variations among minerals while maintaining petrographic context. The ion microprobe has greatly increased the capabilities for in-situ investigations of minerals. It is a powerful tool for small- volume analysis (typically, 10-pm beam diameter and few micrometers depth) of light elements (Z < lo), isotopes, and trace elements (ppm-ppb range). The ion microprobe uses a focused primary ion beam to sputter a small volume of material from a target (usually a solid sample). A fraction of the sputtered atoms, characteristic of the surface com- f CNR-CSCC. t Dipartimento Scienze della Terra. position of the sample, are ionized: these secondary ions are the source of information in SIMS (secondary ion mass spectrometry). Precision in SIMS analyses is limited mainly by counting statistics and by the amount of sample that can be eroded during sputtering. Although it is a destructive technique, the analyzed fraction need not exceed microgram quantities and is typically at the nanogram level. Conversion of count rates into absolute concentrations is complicated by the nature of the sputtering and ionization processes, and by instrumental effects. A high degree of accuracy(at the percent level) has been obtained using an empirical approach based on relative elemental sensitivity factors (RSF)l and working curves.2 This approach relies on the availability of well- characterised standards which match as much as possible major element chemistry of the “unknowns”, with well- determined trace element concentrations. In the last years, much effort has been devoted by mineralogists and geochemists toward characterizing the distribution of light elements in geologic materials. Light elements can play a significant role in rock-formingminerals (e.g., mica, vesuvianite, amphibole, and staurolite). In particular, Li, Be, and B can provide reliable information about metasomatic events in both mantle and crustal rocks. For SIMS investigations, reference samples are needed to be homogeneous. In fact, natural minerals are often markedly inhomogeneous, with compositional zoning or heavy con- tamination by micron-scaleinclusions. The use of standards of composition appropriate to all samples to be analyzed is not generally practicable for such complex materials as, for instance, tourmalines and micas. As for artificial standards, no specific criteria have been developed concerning their use in the analysis of trace elements in silicate minerals. There- fore, in spite of the increasing demand for accurate analysis of such elements in silicate matrices, in-situ investigation of Li, Be, and B is still a challenge in routine analytical procedures. In the absence of suitable standards, the only chance for quantificationrelies on the possibility of calibrating by silicate standards of any composition as for major element chemistry, in which the influence of the matrix upon secondary ion yields is reduced to an acceptable level. The low concentration levels (ppm-ppb range) of many elements to be investigated usually directs one toward the employment of an energyfiltering technique rather than high- mass resolution, when working with commercial instrumen- tation (for instance, Cameca IMS 4F). The energy filtering technique was particularly useful in removing complex molecular ions from secondary ion mass spectra, whereas it was not so effectivein removing oxides, hydrides, and multiply charged ions. Depending on the selected trace elements and the chemical composition of the matrix, the presence of (1) McHugh, J. A. NBS Spec. Publ. (U.S.) 1975, No. 427. (2) Ray, G.; Hart, S. R. Int. J. Mass Spectrom. Ion Phys. 1982,44, 231-55. 0003-2700/93/0365-1960$04.00/0 0 1993 American Chemlcal Society

Welcome message from author
This document is posted to help you gain knowledge. Please leave a comment to let me know what you think about it! Share it to your friends and learn new things together.
Transcript
1060 Anal. Chem. 1993, 65, 1960-1968
Quantification of Lithium, Beryllium, and Boron in Silicates by Secondary Ion Mass Spectrometry Using Conventional Energy Filtering Luisa Ottolini,’J Piero BottazziJ and Riccardo VannuccitJ Consiglio Nazionale delle Ricerche, Centro di Studio per la Cristallochimica e la Cristallografia and Dipartimento Scienze della Terra, Universit& di Pavia, Via A. Bassi n. 4, I-27100 Pavia, Italy
A SIMS procedure for Li, Be,and B quantification in silicates has been developed using the empirical approach of working curves via calibration with standards. Medium- to high-energy secondary ions have been used to reduce matrix effects affecting especially Li/Si ionization and to im- prove measurement reproducibility with respect to low-energy ion analysis for Li, Be, and B. In the case of Be, there has been evidence for a possible reduction of matrix effects, whereas in the case of B, matrix effects have been evidenced to be rather low at any ion energy, and in such a case, the application of a voltage offset has been useful only to improve measurement reproduc- ibility. Positive ions of the isotopes ‘Li, 9Be, llB, and 3OSi (assumedas the matrix reference isotope), havingemission kinetic energies ranging from -75 to 125 eV, have been monitored using an ion microprobe Cameca IMS 4F. The calibration curves hold over extended concentration ranges from ppm to percent level by weight for light elements and silica contents ranging from a few percent to more than 80 % by weight. Precision and accuracy of the method are generally esti- mated as better than *20% relative at the ppm level and better than *lo% relative for element abundances of tens of ppm for Be and B. As for Li, the whole uncertainty in the proposed SIMS procedure is evaluated at about f20% (28% for lead crystal glasses). These results have impor- tant implications for more extensive applications of SIMS as a “routine” microanalytical and bulk technique for the quantification of Li, Be, and B in silicate minerals and rocks.
The importance of the electron microprobe (EPM) in earth sciences is essentially due to its ability to carry out rapid, accurate, nondestructive analyses of major and minor ele- menta a t high spatial resolution (near 1 pm). This has allowed investigation of inter- and intragrain variations among minerals while maintaining petrographic context. The ion microprobe has greatly increased the capabilities for in-situ investigations of minerals. It is a powerful tool for small- volume analysis (typically, 10-pm beam diameter and few micrometers depth) of light elements (Z < lo), isotopes, and trace elements (ppm-ppb range). The ion microprobe uses a focused primary ion beam to sputter a small volume of material from a target (usually a solid sample). A fraction of the sputtered atoms, characteristic of the surface com-
f CNR-CSCC. t Dipartimento Scienze della Terra.
position of the sample, are ionized: these secondary ions are the source of information in SIMS (secondary ion mass spectrometry). Precision in SIMS analyses is limited mainly by counting statistics and by the amount of sample that can be eroded during sputtering. Although it is a destructive technique, the analyzed fraction need not exceed microgram quantities and is typically at the nanogram level. Conversion of count rates into absolute concentrations is complicated by the nature of the sputtering and ionization processes, and by instrumental effects. A high degree of accuracy (at the percent level) has been obtained using an empirical approach based on relative elemental sensitivity factors (RSF)l and working curves.2 This approach relies on the availability of well- characterised standards which match as much as possible major element chemistry of the “unknowns”, with well- determined trace element concentrations.
In the last years, much effort has been devoted by mineralogists and geochemists toward characterizing the distribution of light elements in geologic materials. Light elements can play a significant role in rock-forming minerals (e.g., mica, vesuvianite, amphibole, and staurolite). In particular, Li, Be, and B can provide reliable information about metasomatic events in both mantle and crustal rocks. For SIMS investigations, reference samples are needed to be homogeneous. In fact, natural minerals are often markedly inhomogeneous, with compositional zoning or heavy con- tamination by micron-scale inclusions. The use of standards of composition appropriate to all samples to be analyzed is not generally practicable for such complex materials as, for instance, tourmalines and micas. As for artificial standards, no specific criteria have been developed concerning their use in the analysis of trace elements in silicate minerals. There- fore, in spite of the increasing demand for accurate analysis of such elements in silicate matrices, in-situ investigation of Li, Be, and B is still a challenge in routine analytical procedures.
In the absence of suitable standards, the only chance for quantification relies on the possibility of calibrating by silicate standards of any composition as for major element chemistry, in which the influence of the matrix upon secondary ion yields is reduced to an acceptable level.
The low concentration levels (ppm-ppb range) of many elements to be investigated usually directs one toward the employment of an energy filtering technique rather than high- mass resolution, when working with commercial instrumen- tation (for instance, Cameca IMS 4F). The energy filtering technique was particularly useful in removing complex molecular ions from secondary ion mass spectra, whereas it was not so effective in removing oxides, hydrides, and multiply charged ions. Depending on the selected trace elements and the chemical composition of the matrix, the presence of
(1) McHugh, J. A. NBS Spec. Publ. (U.S.) 1975, No. 427. (2) Ray, G.; Hart, S. R. Int. J . Mass Spectrom. Ion Phys. 1982,44,
231-55.
0003-2700/93/0365-1960$04.00/0 0 1993 American Chemlcal Society
ANALYTICAL CHEMISTRY, VOL. 85, NO. 15, AUGUST 1, 1993 1961
characteristics of the instrument can be found in ref 10. Standards. Reference samples used in the construction of
the calibration curves were minerals and both natural and synthetic glasses; they are listed in Table I. They were for the following for Li: natural acidic glass, Macusani rhyolite;llJ2 staurolite ER-70;13 industrial aluminum silicate glass Ceran 1 (Stazione Sperimentale del Vetro SSV, Murano, Italy); artificial glasses NBS 610,612, and. 614 (nominal values of 500,50, and 1 ppm, respectively, from ref 14 and for NBS 614 additional data by ICP-MS, Clinica del Lavoro, University of Pavia). Standards employed for the Be working curve were as follows: a few minerals, such as helvite (MOes(SiO4)3S),l2 tugtupite (NarBeAlSicOlz- C1),12 danalite (FeJ3e,&3i0&3),’2 and phenakite (Be2Si04)l2 in addition to Macusani rhyolitellJ2 and NBS 610, 612, and 614 glasses (nominal values of 500,50, and 1 ppm, respectively, from ref 14). Finally, standards for B were the following: (aluminum silicate fluoride) topaz from Topaz Mountain, Thomas Range, Utah (Si02 value from ref 15 and B value from ref 16); synthetic glass, NaAl.&l.2SisOa;l* industrial borosilicate glass Pyrex from SSV, Murano; Macusani rhyolite;llJ2 NBS 610, 612, and 614 glasses (certified values from ref 14).
A set of interlaboratory samples (see Table 11) were subse- quently used to test the validity of our approach. For Li: lead crystal glass CRM 126A, reference material certified by the International Commission on glass, provided by SSV; glass Pyrex (Li concentration by ICP-MS, Clinica del Lavoro, University of Pavia); aluminum silicate hornblende H8 from the University of Western Ontario (Li value by ICP-MS, Clinica del Lavoro, University of Pavia). For Be: genthelvite (ZnrBe&3i04)S);12 hornblende H8 (Be value by ICP-AES, C.N.R.-CSCC, Pavia). For B: industrial silicate glass Sovirel, industrial lead crystal glass RUB 111, and artificial phosphate glass SPEC 84, all of them from SSV (additional data were provided by ICP-AES, C.N.R.-CSCC, Pavia). Chemical compositions of all employed samples are reported in Table I. ICP-AES and ICP-MS analysis procedures are described in Appendix I.
To test the accuracy of our quantification technique at low Li, Be, and B concentration levels (ppm-hundreds of ppm) in geological materials, we selected a set of international geostan- dards and used them as unknowns. The following sample splits from reference silicate powders were chosen to be investigated:
FK-N, DR-N, UB-N (ANRT); Mica-Fe, Mica-Mg, GA (CRPG). They included mafic intermediate and acidic volcanic rocks (basalt, andesite, rhyolite), intermediate and acidic intrusive rocks (diorite, granites), an ultramafic metamorphic rock (serpentinitel, and a few minerals (feldspar, biotite, phlogopite), thus covering a wide compositional range for geologic applications. Concen- trations for silica and sample descriptions, given in ref 17, were utilized. For Li, Be, and B reference values, we referred to refs 17-19 (see Table 111).
Sample Preparation. Artificial glasses from silicate rocks and minerals were obtained in air by fusing small amounts (10- 20 mg) of powder (<40 pm) on an Ir strip heater, with no introduction of flux.” Minimum temperatures required for rapid and complete fusion ranged from 1600 “C for intermediate silica contents to - 1800 OC for quartz-rich granitic compositions. After
BE-N, AN-G, AC-E (GIT-IWG); DNC-1, RGM-1, W-2 (USGS);
(10) Lepareur, M. Reu. Tech. Thomson-CSF 1980,12, 225-65. (11) Pichavant, M.; Herrera, J. V.; Boulwier, S.; Brique, L.; Joron,
J.-L.; Juteau, M.; Marin, L.; Michard, A.; Sheppard, S. M. F.; Greuil, M.; Vernet, M. In Magmatic Processes: Physicochemical Principles; Mysen, B. O., Ed. Spec. Pub1.-Geochem. Soc. 1987, No. 1.
(12) Hervig, R. L., Arizona State University-Tempe, personal com- munications, 1990,1991, 1993.
(13) Holdaway, M. J.; Dutrow, B. L.; Shore, P. Am. Miner. 1986, 71,
(14) Certificate of Analysis, Standard Reference Material 610; 612; 614; trace elements in a glass matrix; National Bureau of Standards: Washington DC, 1982.
(15) Barton, M. D.; Haselton, H. T., Jr.; Hemingway, B. S.; Kleppa, 0. J.; Robie, R. A. Am. Miner. 1982,67,350-5.
(16) Hervig, R. L.; Kortemeier, W. T.; Burt, D. M. Am. Miner. 1987, 72, 392-6. (17) Govindaraju, K. Geostand. Newsl. 1989,13 (Special Issue), 1-113. (18) Govindaraju,K.;Roelandta,I. Geostand.Newsl. 1989,13(1),5-67. (19) Watkins, P. J.; Thompson, M. Geostand. Newsl. 1983,7 (2), 273-
(20) Nicholls, I. A. Chem. Geol. 1974,14, 151-7.
1142-59.
7.
interferences from major element oxides, or oxides from other trace elements, must be considered and proper procedures for spectrum deconvolution must be taken into account. This is the case, for instance, of light REE oxides interfering with medium REE in LREE-enriched matrices, or BaO interfering with Eu in a high-Ba content sample. Due to their high ionization efficiency as positive ions, Li, Be, and B are particularly amenable to investigation by SIMS. To a large extent, they are free from interferences; where interferences do occur, they are usually easily resolved.
In SIMS analysis, the secondary ions exhibit an energy distribution with a peak at low emission energies (0-10 eV) and a tail of many hundreds of electronvolts. For Li, Be, and B analysis, a few studies have adopted an experimental setup which involves a wide energy width (125 eV) and the detection of secondary ions accelerated by a 4500-V voltage on the sample. This instrumental configuration allows investigation of the most abundant fraction of secondary ions produced, relative to the selected isotopes (generally 7Li and llB for Li and B, respectively). It is, however, scarcely practical when the investigation of light elements is to be associated with that of other trace elements (REE, HFSE) in only one acquisition list a t the same selected areas of minerals on rock thin sections. Several microspot analyses would then be critical in very small mineral phases (few tens of micrometers in diameter) or in strongly zoned crystals. The light elements that could be analyzed at zero voltage offset are sometimes of necessity monitored together with elements whose analysis is generally carried out by an energy filtering technique. Furthermore, for low-energy ions, the influence of matrix on ion yield is very significant, and the resulting intensities are not always directly related to concentration.= Generally speaking, the sum of all factors distorting the direct pro- portionality of secondary ion intensity and element concen- tration may be designated as the “SIMS matrix effect”; it can be divided into compositional and structural components. SIMS matrix effects are still poorly understood in complex matrices such as minerals and constitute one of the major obstacles in applying SIMS to earth sciences. Within silicates the bulk composition of a sample can affect the sensitivity for a given element by a factor of up to -2-3.s The energy filtering, usually used to eliminate molecular interferences,798 was also revealed as useful for reducing the matrix influence on the ionization of several elements?
Here we describe a quantitative procedure for the analysis of Li, Be, and B in silicate matrices using working curves and their derived relative sensitivity factors for medium- to high- energy secondary ions (-75-125 eV). Our work examined three principal points: (1) Can medium- to high-energy ions be used in light-element analysis to reduce possible matrix effects related to chemical composition and/or structure? (2) Can reproducibility be improved by collecting secondary ions in this energy range (relative to low-energy ion analyses)? (3) Can glasses be used for calibration purposes in the SIMS analysis of Li, Be, and B in crystalline silicate minerals?
EXPERIMENTAL SECTION Instrumentation. The study was done using the Cameca
IMS 4F ion microprobe at C.N.R.-CSCC, Pavia. The basic
(3) Steele, I. M.; Hervig,R. L.; Hutcheon, I. D.; Smith, J. V. Am.Miner.
(4) Shimizu, N. Znt. J. Mass Spectrom. Zon Processes 1986,69,325- 1981,66, 526-46.
RR --. (5) Havette, A.; Soldzian, G. J. Microsc. Spectrosc. Electron. 1980,5,
(6) Wilaon, G. C.; Long, J. V. P. Miner. Mag. 1983,47, 191-9. (7) Shimizu, N.; Semet, M. P.; A l l b e , C. J. Geochim. Cosmochim.
(8) Zinner, E.; Crozaz, G. Znt. J . Mass Spectrom. Ion Processes 1986,
(9) Crozaz, G.; Zinner, E. Scanning Electron Microsc. 1986,2,369-76.
231-42.
Acta 1978,42, 1321-34.
69,17-38.
lQ62 ANALYTICAL CHEMISTRY, VOL. 65, NO. 15, AUGUST 1, 1993
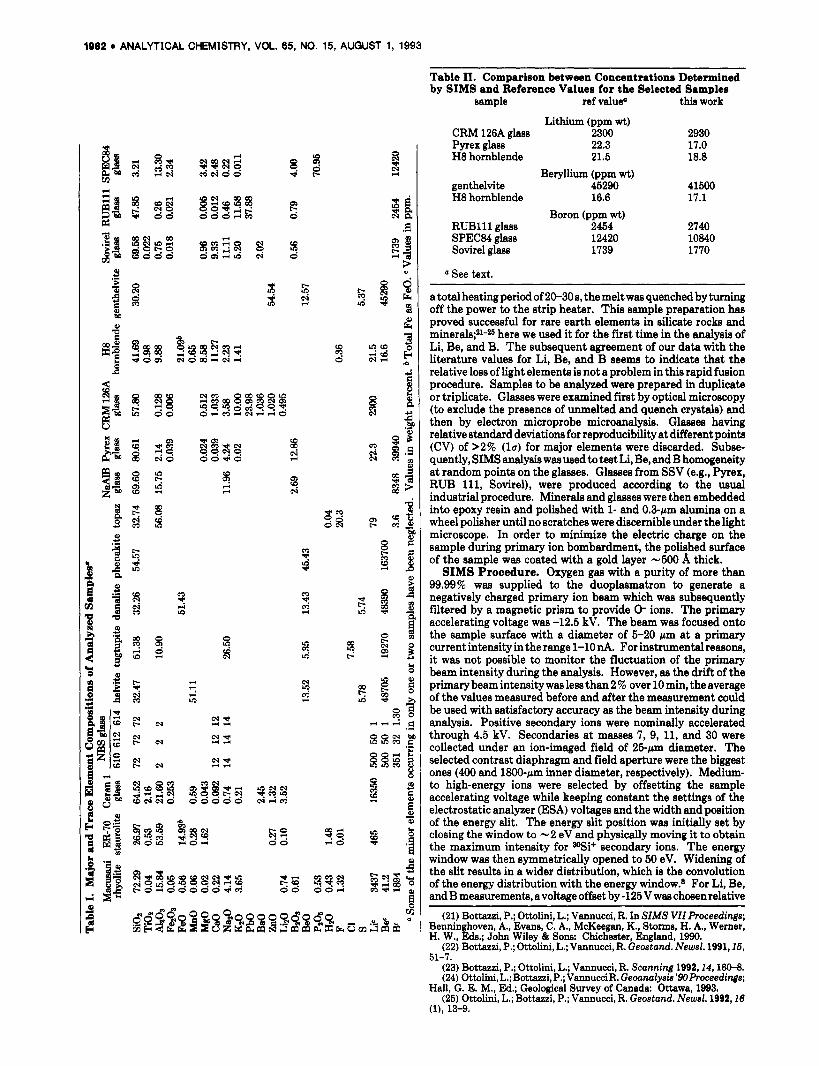
Table 11. Comparison between Concentrations Determined by SIMS and Reference Values for the Selected Samples
sample ref value0 this work Lithium (ppm wt)
CRM 126A glass 2300 2930 Pyrex glass 22.3 17.0 H8 hornblende 21.5 18.8
Beryllium (ppm wt) genthelvite 45290 41500 H8 hornblende 16.6 17.1
Boron (ppm wt) RUB111 glass 2454 2740
Sovirel glass 1739 1770 SPEC84 glass 12420 10840
a See text.
a total heating period of 20-30 8, the melt was quenched by turning off the power to the strip heater. This sample preparation has proved successful for rare earth elements in silicate rocks and minerals;21-= here we used it for the first time in the analysis of Li, Be, and B. The subsequent agreement of our data with the literature values for Li, Be, and B seems to indicate that the relative loss of light elements is not a problem in this rapid fusion procedure. Samples to be analyzed were prepared in duplicate or triplicate. Glasses were examined first by optical microscopy (to exclude the presence of unmelted and quench crystals) and then by electron microprobe microanalysis. Glasses having relative standard deviations for reproducibility at different points (CV) of >2% (la) for major elements were discarded. Subse- quently, SIMS analysis was used to teat Li, Be, andB homogeneity at random points on the glasses. Glasses from SSV (e.g., Pyrex, RUB 111, Sovirel), were produced according to the usual industrial procedure. Minerals and glasses were then embedded into epoxy resin and polished with 1- and 0.3-pm alumina on a wheel polisher until no scratches were discernible under the light microscope. In order to minimize the electric charge on the sample during primary ion bombardment, the polished surface of the sample was coated with a gold layer -500 A thick. SIMS Procedure. Oxygen gas with a purity of more than
99.99% was supplied to the duoplasmatron to generate a negatively charged primary ion beam which was subsequently filtered by a magnetic prism to provide 0- ions. The primary accelerating voltage was -12.5 kV. The beam was focused onto the sample surface with a diameter of 5-20 pm at a primary current intensity in the range 1-lOnA. For instrumental reasons, it was not possible to monitor the fluctuation of the primary beam intensity during the analysis. However, as the drift of the primary beam intensity was less than 2 % over 10 min, the average of the values measured before and after the measurement could be used with satisfactory accuracy as the beam intensity during analysis. Positive secondary ions were nominally accelerated through 4.5 kV. Secondaries at masses 7, 9, 11, and 30 were collected under an ion-imaged field of 25-pm diameter. The selected contrast diaphragm and field aperture were the biggest ones (400 and 1800-pm inner diameter, respectively). Medium- to high-energy ions were selected by offsetting the sample accelerating voltage while keeping constant the settings of the electrostatic analyzer (ESA) voltages and the width and position of the energy slit. The energy slit position was initially set by closing the window to -2 eV and physically moving it to obtain the maximum intensity for %i+ secondary ions. The energy window was then symmetrically opened to 50 eV. Widening of the slit results in a wider distribution, which is the convolution of the energy distribution with the energy window.8 For Li, Be, andB measurements,avoltageoffset by-125Vwaschosenrelative
8 w 3
3
3 T o a ?
8 t! M
8
8 Q,
4
* m d 3
83888 0040
4 3
u3 0
3 hl 2 8
El u! $!
(21) Bottazzi, P.; Ottolini, L.; Vannucci, R. In SIMS VII Proceedings; Benninghoven, A., Evans, C. A., McKeegan, K., Storms, H. A., Werner, H. W., Eds.; John Wiley & Sons: Chichestar, England, 1990.
(22) Bottazzi, P.; Ottolini, L.; Vannucci, R. Geoatand. Newal. 1991,15,
(23) Bottazzi, P.; Ottolini, L.; Vannucci, R. Scanning 1992,14,160-8. (24) Ottolini,L.; Bottazzi, P.; Vannucci R. Geoanalyais 'SOProceedinga;
(25) Ottolini, L.; Bottazzi, P.; Vannucci, R. Geoatand. Newel. 1992,16
51-7.
Hall, G. E. M., Ed.; Geological S w e y of Canada: Ottawa, 1993.
(l), 13-9.
ANALYTICAL CHEMISTRY, VOL. 65, NO. 15, AUGUST 1, 1993 iaea
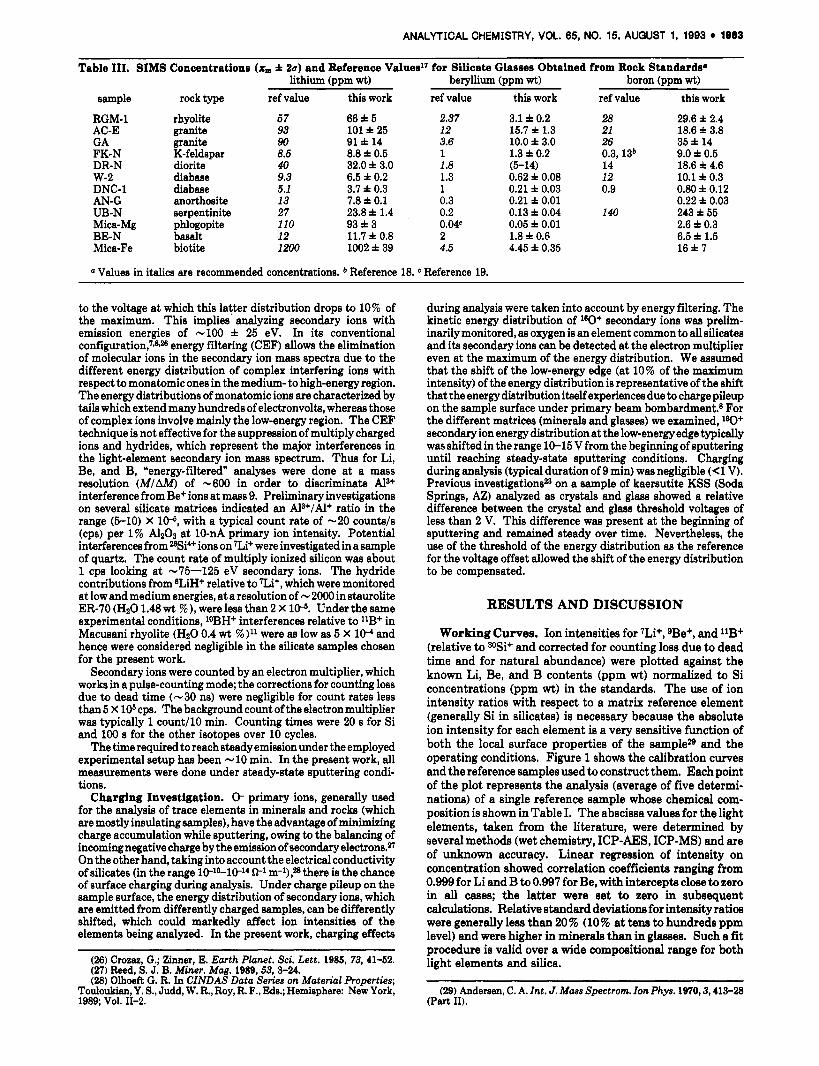
Table 111. SIMS Concentrations (x, f 20) and Reference Values" for Silicate Glasses Obtained from Rock Standards. lithium (ppm wt) beryllium (ppm wt) boron (ppm wt)
sample rock type ref value this work ref value this work ref value this work RGM-1 AC-E
FK-N DR-N w-2 DNC-1 AN-G UB-N
BE-N
GA
Mica-Mg
Mica-Fe
rhyolite granite granite K-feldspar diorite diabase diabase anorthosite serpentinite phlogopite basalt biotite
57 93 90 8.5 40 9.3 5.1 13 27 110 12 1200
66f 5 101 f 25 91 f 14 8.8 f 0.5 32.0 f 3.0 6.5 f 0.2 3.7 f 0.3 7.8 f 0.1 23.8 t 1.4 93 f 3 11.7 t 0.8 1002 f 39
2.37 12 3.6 1 1.8 1.3 1 0.3 0.2 0.04' 2 4.5
3.1 f 0.2 15.7 f 1.3 10.0 f 3.0 1.3 f 0.2 6-14 0.62 f 0.08 0.21 f 0.03 0.21 t 0.01 0.13 f 0.04 0.05 f 0.01 1.8 f 0.6 4.45 f 0.35
28 21 26 0.3, 13b 14 12 0.9
140
29.6 f 2.4 18.6 t 3.8 35 f 14 9.0 f 0.5 18.6 f 4.6 10.1 f 0.3 0.80 f 0.12 0.22 f 0.03 243 f 55 2.6 f 0.3 6.5 f 1.5 16 f 7
a Values in italics are recommended concentrations. Reference 18. Reference 19.
to the voltage at which this latter distribution drops to 10% of the maximum. This implies analyzing secondary ions with emission energies of -100 f 25 eV. In its conventional configuration,7*8*% energy filtering (CEF) allows the elimination of molecular ions in the secondary ion mass spectra due to the different energy distribution of complex interfering ions with respect to monatomic ones in the medium- to high-energy region. The energy distributions of monatomic ions are characterized by tails which extend many hundreds of electronvolta, whereas those of complex ions involve mainly the low-energy region. The CEF technique is not effective for the suppression of multiply charged ions and hydrides, which represent the major interferences in the light-element secondary ion mass spectrum. Thus for Li, Be, and B, "energy-filtered" analyses were done at a mass resolution (MIAM) of -600 in order to discriminate Ala+ interference from Be+ ions at mass 9. Preliminary investigations on several silicate matrices indicated an Ala+/Al+ ratio in the range (5-10) X 106, with a typical count rate of -20 counts/s (cps) per 1% A1203 at 10-nA primary ion intensity. Potential interferences from %Si4+ ions on Xi+ were investigated in a sample of quartz. The count rate of multiply ionized silicon was about 1 cps looking at -75-125 eV secondary ions. The hydride contributions from 6LiH+ relative to Xi+, which were monitored at low and medium energies, at a resolution of -2000 in staurolite ER-70 (H2O 1.48 wt %),were less than 2 X 10⁶. Under the same experimental conditions, loBH+ interferences relative to llB+ in Macusani rhyolite (HgO 0.4 wt %)11 were as low as 5 X lo-' and hence were considered negligible in the silicate samples chosen for the present work.
Secondary ions were counted by an electron multiplier, which works in a pulse-counting mode; the corrections for counting loss due to dead time (-30 ns) were negligible for count rates less than 5 X 1P cps. The background count of the electron multiplier was typically 1 count/lO min. Counting times were 20 s for Si and 100 s for the other isotopes over 10 cycles. Thetimerequiredtoreachsteadyemission undertheemployed
experimental setup has been - 10 min. In the present work, all measurements were done under steady-state sputtering condi- tions.
Charging Investigation. 0- primary ions, generally used for the analysis of trace elements in minerals and rocks (which are mostly insulating samples), have the advantage of minimizing charge accumulation while sputtering, owing to the balancing of incoming negative charge by the emission of secondary electrons.n On the other hand, taking into account the electrical conductivity of silicates (in the range 10-10-10-14 it1 m-l),% there is the chance of surface charging during analysis. Under charge pileup on the sample surface, the energy distribution of secondary ions, which are emitted from differently charged samples, can be differently shifted, which could markedly affect ion intensities of the elements being analyzed. In the present work, charging effects
(26) Crozaz, G.; Zinner, E. Earth Plonet. Sci. Lett. 1985, 73, 41-62. (27) Reed, 5. J. B. Miner. Mag. 1989,63, 3-24. (28) Olhoeft G. R. In CZNDAS Data Series on Material Properties;
Touloukian, Y. S., Judd, W. R., Roy, R. F., Eds.; Hemisphere: New York, 1989; VOl. 11-2.
during analysis were taken into account by energy filtering. The kinetic energy distribution of W+ secondary ions was prelim- inarily monitored, as oxygen is an element common to all silicates and ita secondary ions can be detected at the electron multiplier even at the maximum of the energy distribution. We assumed that the shift of the low-energy edge (at 10% of the maximum intensity) of the energy distribution is representative of the shift that the energy distribution itself experiences due to charge pileup on the sample surface under primary beam bombardment.8 For the different matrices (minerals and glasses) we examined, W+ secondary ion energy distribution at the low-energy edge typically was shifted in the range 10-15 V from the beginning of sputtering until reaching steady-state sputtering conditions. Charging during analysis (typical duration of 9 min) was negligible (<1 V). Previous investigationsm on a sample of kaersutite KSS (Soda Springs, AZ) analyzed as crystals and glass showed a relative difference between the crystal and glass threshold voltages of less than 2 V. This difference was present at the beginning of sputtering and remained steady over time. Nevertheless, the use of the threshold of the energy distribution as the reference for the voltage offset allowed the shift of the energy distribution to be compensated.
RESULTS AND DISCUSSION
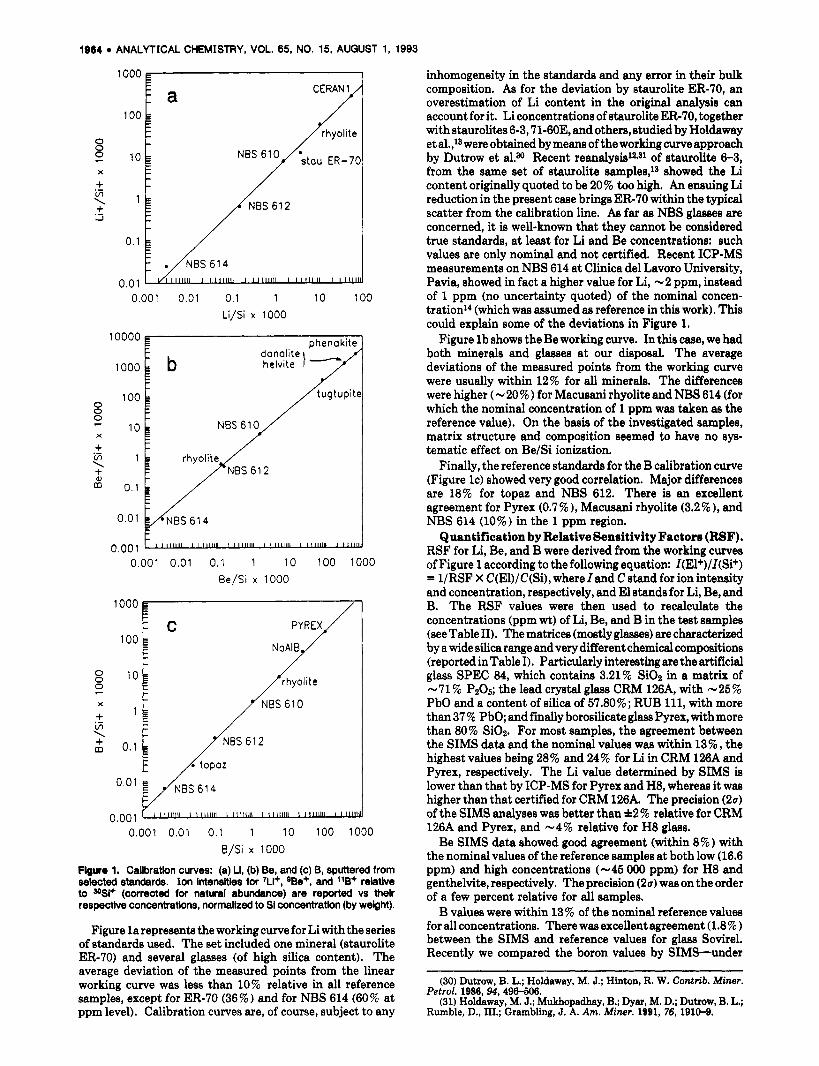
Working Curves. Ion intensities for 'Li+, QBe+, and 1lB+ (relative to 3OSi+ and corrected for counting loss due to dead time and for natural abundance) were plotted against the known Li, Be, and B contents (ppm wt) normalized to Si concentrations (ppm wt) in the standards. The use of ion intensity ratios with respect to a matrix reference element (generally Si in silicates) is necessary because the absolute ion intensity for each element is a very sensitive function of both the local surface properties of the sample29 and the operating conditions. Figure 1 shows the calibration curves and the reference samples used to construct them. Each point of the plot represents the analysis (average of five determi- nations) of a single reference sample whose chemical com- position is shown in Table I. The abscissa values for the light elements, taken from the literature, were determined by several methods (wet chemistry, ICP-AES, ICP-MS) and are of unknown accuracy. Linear regression of intensity on concentration showed correlation coefficienta ranging from 0.999 for Li and B to 0.997 for Be, with intercepts close to zero in all cases; the latter were set to zero in subsequent calculations. Relative standard deviations for intensity ratios were generally less than 20 9% (10 % at tens to hundreds ppm level) and were higher in minerals than in glasses. Such a fit procedure is valid over a wide compositional range for both light elements and silica.
(29) Andereen, C. A. Znt. J . Mme Spectrom. Zon Phys. 1970,3,413-28 (Part 11).
1904 ANALYTICAL CHEMISTRY, VOL. 65, NO. 15, AUGUST 1, 1993
1000 I CERANA
0 0 2 X
+ iT, \ + -I .-
0.001 0.01 0.1 1 10 100 Li/Si x 1000
phenakite 10000
1000
phenakite 10000
1000
0.001 O.O1 ~
0,001 0.01 0.1 1 10 100 1000 Be/Si x 1000
100
rhyolite
//topaz
inhomogeneity in the standards and any error in their bulk composition. As for the deviation by staurolite ER-70, an overestimation of Li content in the original analysis can account for it. Li concentrations of staurolite ER-70, together with staurolites 6-3,71-60E, and others, studied by Holdaway et al.,13 were obtained by means of the working curve approach by Dutrow et a1.N Recent reanalysis12J1 of staurolite 6-3, from the same set of staurolite samples,lg showed the Li content originally quoted to be 20% too high. An ensuing Li reduction in the present case brings ER-70 within the typical scatter from the calibration line. As far as NBS glasses are concerned, it is well-known that they cannot be considered true standards, a t least for Li and Be concentrations: such values are only nominal and not certified. Recent ICP-MS measurements on NBS 614 at Clinica del Lavoro University, Pavia, showed in fact a higher value for Li, -2 ppm, instead of 1 ppm (no uncertainty quoted) of the nominal concen- tration'* (which was assumed as reference in this work). This could explain some of the deviations in Figure 1.
Figure l b shows the Be working curve. In this case, we had both minerals and glasses a t our disposal. The average deviations of the measured pointa from the working curve were usually within 12% for all minerals. The differences were higher (-20%) for Macusani rhyolite and NBS 614 (for which the nominal concentration of 1 ppm waa taken as the reference value). On the basis of the investigated samples, matrix structure and composition seemed to have no sys- tematic effect on Be/Si ionization.
Finally, the reference standards for the B calibration curve (Figure IC) showed very good correlation. Major differences are 18% for topaz and NBS 612. There is an excellent agreement for Pyrex (0.7%), Macusani rhyolite (3.2%), and NBS 614 (10%) in the 1 ppm region.
Quantification by Relative Sensitivity Factors (RSF). RSF for Li, Be, and B were derived from the working curves of Figure 1 according to the following equation: I(El+)/I(Si+) = 1/RSF X C(El)/C(Si), where Iand C stand for ion intensity and concentration, respectively, and El stands for Li, Be, and B. The RSF values were then used to recalculate the concentrations (ppm wt) of Li, Be, and B in the test samples (see Table 11). The matrices (mostly glasses) are characterized by a wide silica range and very different chemical compositions (reported in Table I). Particularly interesting are the artificial glass SPEC 84, which contains 3.21% SiOz in a matrix of -71 % PzO~; the lead crystal glass CRM 126A, with -25% PbO and a content of silica of 57.80%; RUB 111, with more than 37 % PbO; and fiially borosilicate glass Pyrex, with more than 80% SiOz. For most samples, the agreement between the SIMS data and the nominal values was within 13% , the highest values being 28% and 24% for Li in CRM 126A and Pyrex, respectively. The Li value determined by SIMS is lower than that by ICP-MS for Pyrex and H8, whereas it was higher than that certified for CRM 126A. The precision (24 of the SIMS analyses was better than f2% relative for CRM 126A and Pyrex, and -4% relative for H8 glass.
Be SIMS data showed good agreement (within 8 5%) with the nominal values of the reference samples a t both low (16.6 ppm) and high concentrations (-45 OOO ppm) for H8 and genthelvite, respectively. The precision ( 2 4 was on the order of a few percent relative for all samples.
B values were within 13 % of the nominal reference values for all concentrations. There was excellent agreement (1.8% between the SIMS and reference values for glass Sovirel. Recently we compared the boron values by SIMS-under
(30) Dutrow, B. L.; Holdaway, M. J.; Hinton, R. W. Contrib. Miner.
(31) Holdaway, M. J.; Mukhopadhay, B.; Dyar, M. D.; Dutrow, B. L.; Petrol. 1986, 94, 496-506.
Rumble, D., 111.; Grambling, J. A. Am. Miner. 1991, 76, 1910-9.
ANALYTICAL CHEMISTRY, VOL. 65, NO. 15, AUGUST 1, 1993 1005
assess the accuracy of our working curves a t such concen- trations. Therefore we must limit the validity of our methodology from the ppm level upwards.
Under the experimental conditions used, SIMS sensitivities (cps per ppm per nA of primary current intensity) are -8 for Li and Be and 3 for B. With the maximum primary ion intensity used here (10 nA), and with the assumption of a minimum detectable ion signal of 1 cps, the minimum detectable concentrations were estimated a t - 10 ppb for Li and Be and -25 ppb for B; such limits are satisfactory for most geochemical and crystallochemical investigations. The detection limits we calculated for Be and B were very similar at low- as well as high-energy ions if we chose to keep Wi+ ion intensity lower than 5 X 10⁶ cps at the electron multiplier since Be+/Si+ and B+/Si+ ratios do not vary significantly (see Figures 4 and 5). When low-energy ions are analyzed, only Li can increase its current (relative to Si) due to its strongly "peaked" distribution and its detection limits can improve, in the most favorable case, by a factor of - 10 (- 1 ppb). At low concentrations, contamination of the surface (due to sample preparation) could affect the results. This was generally eliminated by the preliminary sputtering needed to reach steady-state conditions. On a few samples with concentrations at the ppm level we tested the use of a preliminary raster (50 X 50 pm) before analysis, to eliminate possible contributions from contaminants from the border of the crater (e.g., from gold coating), but no effects were noted. However, they could affect the results at lower concentrations.
Matrix Effects and Reproducibility. The purpose of this work was to evaluate the usefulness of medium- to high- energy ions in the analysis of Li, Be, and B in silicates in order to reduce matrix effects and to improve reproducibility. The experimental conditions are those we usually use for the quantification of such trace elements as Sr, Y, and Zr in silicates; these elements are affected by complex interferences in the secondary ion mass spectrum. The calibration curves obtained here seem (to a first approximation) independent of the type of major element matrix, and their validity was tested over extended concentration ranges for Li, Be, B, and silica. Indeed, the presence of negligible interferences at mass numbers 7 and 11, and the presence of onlyAP+ interferences at mass 9 (easily resolved at a mass resolution of 600), allowed us not only to obtain linear intensity-concentration corre- lations passing through the origin (from which reliable relative sensitivity factors were obtained), but also to investigate in detail in a few matrices (most of them of geologic interest) "SIMS matrix effects" on Li/Si, Be/Si, and BISi ionization as a function of the energy of secondary ions. For this purpme, relative ion yields-defied as [I(El+)II(Si+)I/ [C(El)/C(Si)I, where concentrations were recalculated in ppm by atom from the values in Table I, and El stands for Li, Be, and B, respectively-were measured as a function of different voltage offsets in selected glasses and minerals. Due to the presence of the energy slit in our microprobe (located after the electrostatic sector), it is possible to determine the range of energies accepted by the mass spectrometer. The measured I(Li+)/I(Si+),I(Be+)/I(Si+), andI(B+)/I(Si+) ratios are, in fact, dependent on both the width (in this case, fixed at 50 eV) and the positioning of the energy window (which can be varied by applying different sample voltage offsets). All ion yield measurements at both low- and high-energy ions were carried out with a 50-eV energy band width. The use of a f25-eV energy bandwidth for low-energy ions was adopted in this work to assess the amount of charging also during low-energy ion collection. Moreover, it allowed us to avoid continuous displacement/replacement of the energy slit.
Li Ion Yields. Several features are worthy of note (see Figure 2). The value of the ion yield at 25-V offset, which
the same experimental conditions-with those obtained by SREF (analysis via Site-scattering REFinement) using single- crystal X-ray data32 in a set of kornerupines. The mean relative deviation between the SIMS and SREF B203 de- terminations was f3 %, with no systematic differences between the two sets of results. This held for B2O3 in the compositional range 0.5-4.0 w t % ,
Finally, Table I11 reports the results (average values and standard deviations) of our Li, Be, and B determinations in the test mineral and rock geostandards and compares them with reference values taken from refs 17-19.
Lithium. Inhomogeneity of glasses of more silicic com- positions (AC-E, GA) is probably responsible for the scatter in the results. Homogeneity was tested by making random analyses throughout the glasses. Li variations were by f25 % and &15% in AC-E and GA, respectively, whereas the expectation value from counting statistics (all errors quoted are 2a) was <f4%. In all other glasses, typical coefficients of variation (percent relative) were less than &9%. An excellent agreement with reference values is shown by BE-N (within 2.5% ), by FK-N (within 3.5%) in the few ppm level, and by GA (within 1% at tens ppm concentration). For the remaining samples, the agreement was typically within 20%, with higher discrepancies for W-2 (30%) and AN-G (40%).
Beryllium. Certified concentrations in the selected geo- standards are a few ppm in AC-E, GA, Mica-Fe, RGM-1, and DR-N; for the remaining samples (W-2, DNC-1, AN-G, UB- N, Mica-Mg), the Be content is typically I1 ppm. Even at such low concentrations the counting statistics are good and our values may help to refine the accepted concentrations. As far as accuracy is concerned, the comparison relies on a few certified values (in italics in Table 111). The agreement was excellent for Mica-Fe (1.1%) and was on the order of 30% for RGM-1 and AC-E. There is significant disagreement for two of the geostandards, and this is cause for concern. For GA and DR-N, the SIMS concentrations are higher than expected 10 f 3 ppm (vs 3.6 ppm) for GA, and a range of concentrations from 5 to 14 ppm (vs 1.8 ppm) for DR-N. These differences remain unexplained, though the occurrence of some laboratory contamination (for instance, contamina- tion of the Ir strip heater used for the fusion) and the presence of high amounts of Be from Be-rich accessory phases (rather common in intermediate to acidic rocks) in the cut we fused as glass beads could potentially account for it.
Boron. Coefficients of variation for B determinations ranged from a few percent to 40% (2a) and were generally higher than uncertainties derived from counting statistics. Only a few values"Jg are available for comparison. Boron has proven to be a difficult element to determine in natural materials, even at concentrations of tens to hundreds ppm. Colorimetry, atomic emission, atomic fluorescence, flameless atomic absorption, ICP-AES, and ICP-MS have all been used to determine boron. All these methods suffer from the problem of boron loss during sample dissolution, high boron blanks in solvents or fusion salts, and the complexity of the atomic emission spectra. dc arc optical emission spectrometry has been widely used for boron determinations, but with mixed success. The volatility of boron during the arcing process may explain the widely varying results reported for most reference materials.% Comparison of our data and the literature values should thus take into account the charac- teristics of the analytical techniques used in previous B determinations.
In the absence of well-certified reference materials for Li and B at the tens-hundreds ppb level it was impossible to
(32) Bottazzi, P.; Ottolini, L.; Cooper, M.; Hawthorne, F. C. GACI MAC Abstract; Geological hociation of CanadaIMineralogical h o - ciation of Canada, Annual Meeting Abstracts, Edmonton, Alberta, 1993.
(33) Gladney, E. S.; Roelandta, I. Geostand. Newsl. 1987,11,167-85.
1966 ANALYTICAL CHEMISTRY, VOL. 65, NO. 15, AUGUST 1, 1993
l o I
s w
0
2
> Z
W
4 W II: .- -I
NBS6 10
CERANl
- . . . -.
s tou ER-70 - 1 - 1 -
MICA- Fe
rhyolite
--- ---
0 ' I 1 I I I
25 50 75 1 0 0 125 1 5 0 175 VOLTAGE OFFSET (V)
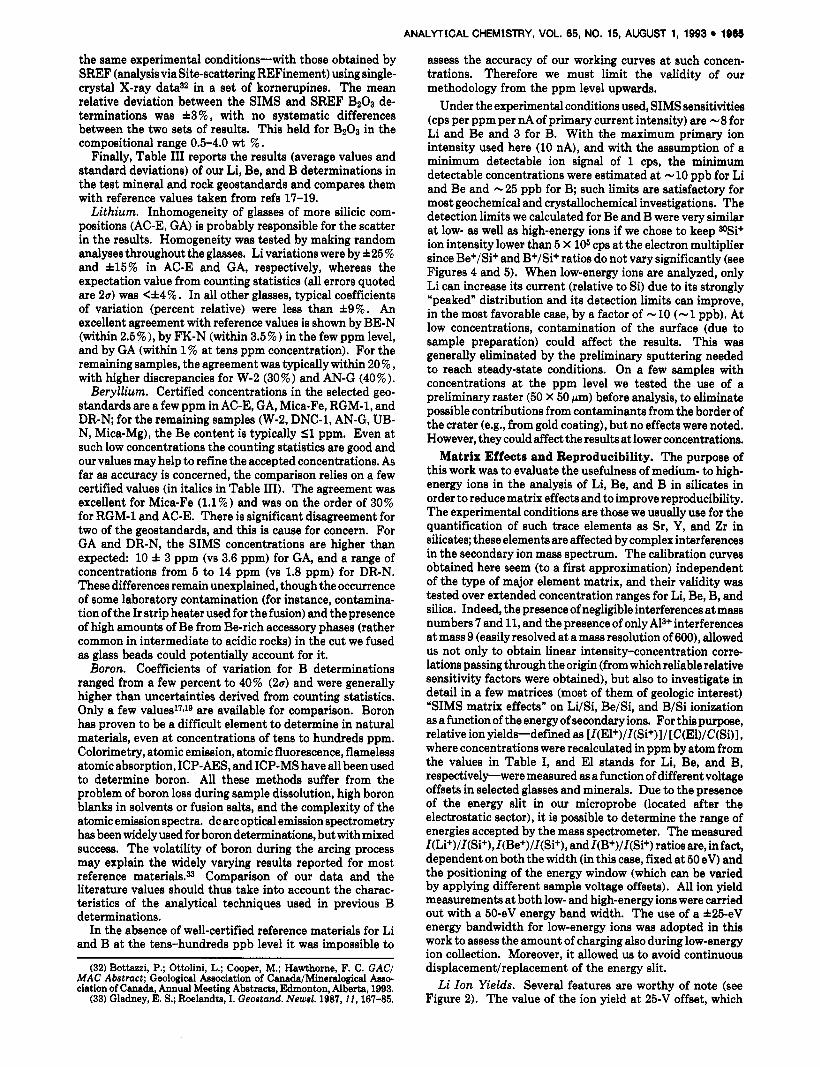
Figure 2. Relative Ll ion yield as a function of sample offset voltage (V) for selected samples. The energy silt was operated at a 50-eV wklth for both low- and high-energy ions.
corresponds essentially to low-energy ions, is highest (9.1) for hornblende H8, followed by Mica-Fe (7.9) and staurolite ER- 70 (7.2). An intermediate value (6.1) is characteristic of glass Ceran 1, whereas the lower values are for NBS 610 (5.7) and Macusani rhyolite (4.7). Thus the relative ion yield is higher in low-silica samples, such as H8, Mica-Fe, and ER-70, and is lower for high-silica samples, such as NBS 610 and Macusani rhyolite. The difference among ion yields does not seem to be directly attributable to matrix structure: with the ex- ception of ER-70, the other samples were fused and analyzed as glasses. The variation of Li ion yield by a factor of 2 at 25-V offset seems to be related to chemical matrix effects, which could in principle affect both Li and Si ionization. As previously shown by Shimizu4 in the binary silicate-glass system CaAlzO&iOz, ionization of Si is suppressed by the presence of A1 (and Ca). This seems to be due to the stability of silicon oxide relative to aluminum oxide (and calcium oxide) during binary collisions while sputtering. In other words, the oxide with the largest energy of formation is the one that makes the greatest reduction in the free energy of the system and would thus be favored over other possible collision reactions. Furthermore, the presence of A1 (and Ca) is responsible for broadening the energy distribution of 30Si+.4 In our case, the full width at half-maximum (fwhm) of 30Si+ secondary ion energy distribution (measured with a bandwidth of -2 eV) in samples with both low and high A1203 content (e.g., NBS 610 [A12031 = 2 w t %; ER-70 [A12031 = 53.6 wt % ) showed this phenomenon, the higher value for 3OSi+ fwhm being 16 eV in ER-70 vs 13.5 eV in NBS 610. The fwhm of 7Li+ energy distribution did not significantly change (6 eV in ER-70 and 5.5 eV in NBS 610). By contrast, the ratios of Li signals at 25-V offset to 125-V offset varied by a factor of 2 (280 for staurolite ER-70 vs 140 in Macusani rhyolite); this suggests that Li energy distribution is more "peaked" in low- silica samples. In our case, these latter have also high iron content (e.g., H8 CFeOIm = 21.09wt % ; Mica-Fe [F~zO~ITOT = 25.65 wt 76 ). To our knowledge, a possible enhancement effect of I(Li+)/I(Si+) due to matrix iron content has never been specifically tested, whereas enhanced ionization of Ca/ Si and Mg/Si due to Fe, is well-known.7 Havette and SlodzianN also noted the effect of iron on the ion yield of aluminum.
9 > m N l- a n w 7
0
1 4 5
J
> z
W
t-
W E
-I .-
3
MICA-Fe +
stau ER-70 CERAN 1 4
NBS 610. rhyolite
+ CRM 126A
0.6 0.8 1.0 1.2 1.4 1.6 1.8 2.0 L i RELATIVE ION YIELD AT 125 V
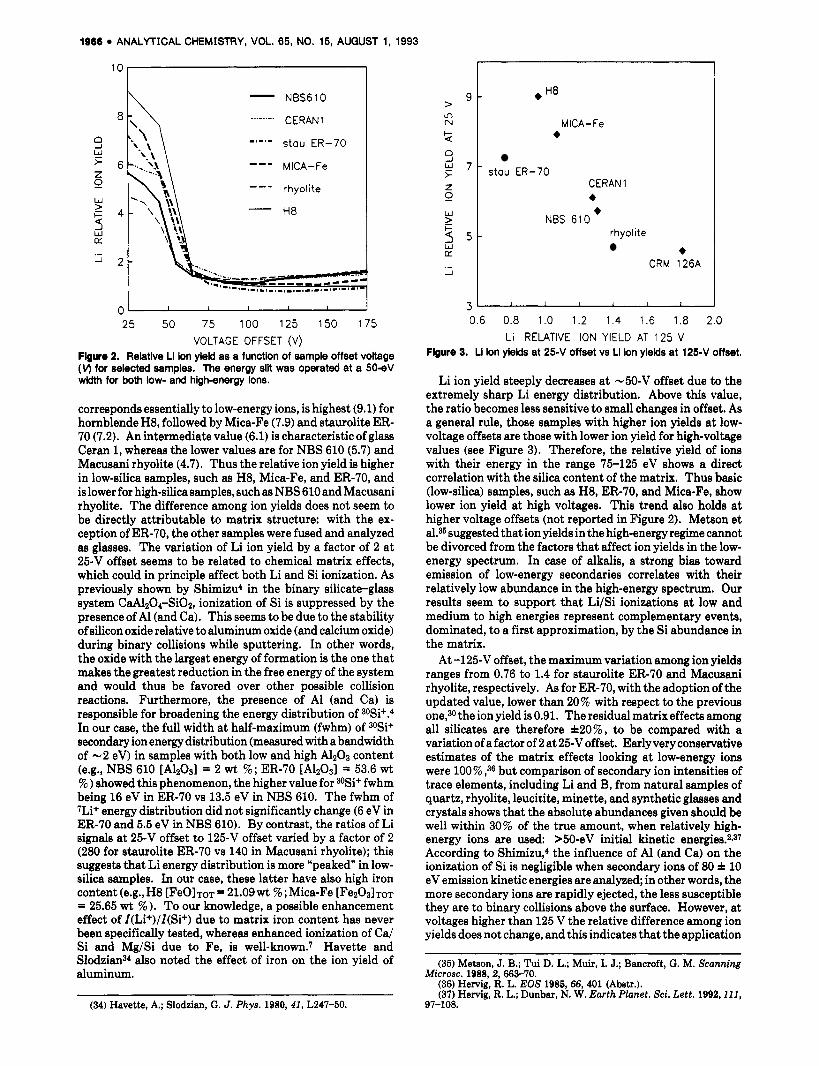
Figure 9. Li ion yields at 2 5 4 offset vs Ll Ion ylelds at 1 2 5 4 offset.
Li ion yield steeply decreases a t -50-V offset due to the extremely sharp Li energy distribution. Above this value, the ratio becomes less sensitive to small changes in offset. As a general rule, those samples with higher ion yields at low- voltage offsets are those with lower ion yield for high-voltage values (see Figure 3). Therefore, the relative yield of ions with their energy in the range 75-125 eV shows a direct correlation with the silica content of the matrix. Thus basic (low-silica) samples, such as H8, ER-70, and Mica-Fe, show lower ion yield at high voltages. This trend also holds at higher voltage offsets (not reported in Figure 2). Metson et al.35 suggested that ion yields in the high-energy regime cannot be divorced from the factors that affect ion yields in the low- energy spectrum. In case of alkalis, a strong bias toward emission of low-energy secondaries correlates with their relatively low abundance in the high-energy spectrum. Our results seem to support that Li/Si ionizations at low and medium to high energies represent complementary events, dominated, to a first approximation, by the Si abundance in the matrix.
A t -125-V offset, the maximum variation among ion yields ranges from 0.76 to 1.4 for staurolite ER-70 and Macusani rhyolite, respectively. As for ER-70, with the adoption of the updated value, lower than 20% with respect to the previous one,3o the ion yield is 0.91. The residual matrix effects among all silicates are therefore *20%, to be compared with a variation of a factor of 2 a t 25-V offset. Early very conservative estimates of the matrix effects looking a t low-energy ions were 100% ,36 but comparison of secondary ion intensities of trace elements, including Li and B, from natural samples of quartz, rhyolite, leucitite, minette, and synthetic glasses and crystals shows that the absolute abundances given should be well within 30% of the true amount, when relatively high- energy ions are used: >50-eV initial kinetic energies.2~37 According to Shimizu,4 the influence of Al (and Ca) on the ionization of Si is negligible when secondary ions of 80 f 10 eV emission kinetic energies are analyzed; in other words, the more secondary ions are rapidly ejected, the less susceptible they are to binary collisions above the surface. However, a t voltages higher than 125 V the relative difference among ion yields does not change, and this indicates that the application
(35) Metaon, J. B.; Tui D. L.; Muir, I. J.; Bancroft, G. M. Scanning
(36) Hervig, R. L. EOS 1985, 66, 401 (Abstr.). (37) Hervig, R. L.; Dunbar, N. W. Earth Planet. Sci. Lett. 1992,111,
M~WOSC. 1988,2, 663-70.
97-108. (34) Havette, A.; Slodzian, G . J. Phys. 1980,41, L247-50.
ANALYTICAL CHEMISTRY, VOL. 65, NO. 15, AUGUST 1, 1993 la67
of much higher voltage offsets does not further reduce matrix effects on the ionization of Li relative to Si.
Sample CRM 126A (with Si02 57.80 wt %; PbO 23.98 w t %), for which the Li SIMS concentration was higher than expected at -125-V offset, was also investigated at 25-V offset. At this offset, the ion yield was the same as those of the high-silica samples (e.g., Macusani rhyolite), as expected from its Si content calculated in atomic percent. For medium- to high-energy secondary ions, the ion yield was much higher than that of all other acidic (silica-rich) samples. Such behavior is different from that of the remaining samples. CRM 126A seemed to have a sui generis behavior (and its diversity appeared very reproducible), which could be related to Li- enhanced ionization due to the presence of a high amount of lead in the matrix. Such a phenomenon was seen by MacRaea for other electropositive elements, such as REE, in silicate matrices diluted in PbzSiOd even employing the specimen isolation technique (therefore, in the secondary ion energy range 450-500 eV). More lead-glass standards would be necessary to check the Li reference concentration in CRM 126A and to investigate matrix effects related to the high percentage of lead and alkali oxides (these latter being >14 wt 5% in CRM 126A). At the moment, the use of a matrix- matched standard with a well-known Li content is still the most accurate method for Li quantification in lead glasses. Among all analyzed silicate matrices, only lead crystal glasses (which have no analogues in natural geological samples and, therefore, are of no direct interest to geochemists) should be treated separately. In such a case, however, no special problems would be associated with the availability of a proper standard.
The above observed correlations between Li ion yields and Si content of the matrix allow one in principle to construct an empirical correction procedure that accounts for matrix effects. At this point, however, more suitable standards would be required to test the general validity of the previous relationship.
Due to the very sharp energy distribution for Li, a quantification procedure based on the low-energy ion pop- ulation could be subject to significant analytical errors due to occasional shifts in the energy of the analyzed ions caused by surface charging during analysis, and problems in repro- ducing the positioning of the maxium intensity of the energy distribution. A better reproducibility at low-energy ions could be achieved with a wide-open energy slit. On the basis of our previous investigations,23 it was found that surface charging during analysis in silicate matrices, such as garnets, pyroxenes, amphiboles, and plagioclases, typically resulted by 1-2 tens of volts. However, when samples of various chemical com- position (for which a priori the charging behavior is not known) are analyzed, it would be difficult to correctly assess the amount of charging with a widely open energy window, due to the large displacement of the sharp threshold of the (convoluted) energy distribution.
Reproducibility of Li ion yields was on the order of *25% at low energy, and better than *lo% at medium to high energy. Such an improvement agrees with recent results obtained by Hervig and Dunbar37 in the quantification of several trace elements (including Li and B) in various silicate matrices. Additionally, the value we obtained from NBS 610 at medium to high energies of Li ion yield gave results comparable to that of HintonFS 1.32 f 0.09 vs 1.31, respec- tively, whereas for low-energy ions, our value was 5.7 f 0.9 vs 6.74.39 This fact supports the belief that the use of high- energy ions not only improves intralaboratory reproducibility
(38) MacRae, N. D. Am. Miner. 1987, 72, 1263-8. (39) Hinton, R. W . Chem. Ceol. 1991,83, 11-25.
1.5
9 F z 1.0 0
2 4
Q) 0.5
W
W
I-
w CK
m
0.0
25 50 75 103 125 I50 175 VOLTAGE OFFSET (V)
25 50 75 100 125 150 175 VOLTAGE OFFSET (V)
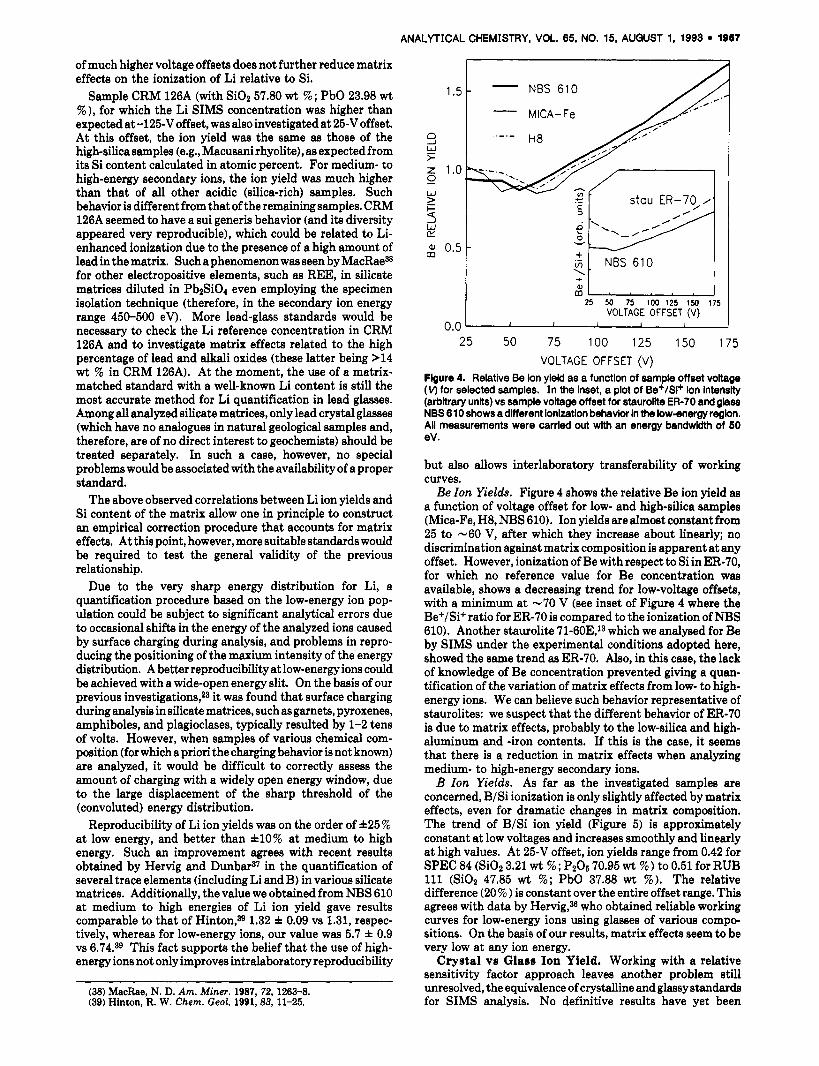
Flgure 4. Relative Be ion yield as a function of sample offset voltage (v) for selected samples. In the inset, a plot of Be+/Si+ ion intensity (arbitrary units) vs sample voltage offset for staurolite ER-70 and glass NBS 61 0 shows a different ionization behavior In the low-energy region. Ail measurements were carried out wlth an energy bandwidth of 50 eV . but also allows interlaboratory transferability of working curves. Be Zon Yields. Figure 4 shows the relative Be ion yield aa
a function of voltage offset for low- and high-silica samples (Mica-Fe, H8, NBS 610). Ion yields are almost constant from 25 to -60 V, after which they increase about linearly; no discrimination against matrix composition is apparent a t any offset. However, ionization of Be with respect to Si in ER-70, for which no reference value for Be concentration was available, shows a decreasing trend for low-voltage offsets, with a minimum a t -70 V (see inset of Figure 4 where the Be+/Si+ ratio for ER-70 is compared to the ionization of NBS 610). Another staurolite 71-60E,13 which we analysed for Be by SIMS under the experimental conditions adopted here, showed the same trend as ER-70. Also, in this case, the lack of knowledge of Be concentration prevented giving a quan- tification of the variation of matrix effects from low- to high- energy ions. We can believe such behavior representative of staurolites: we suspect that the different behavior of ER-70 is due to matrix effects, probably to the low-silica and high- aluminum and -iron contents. If this is the case, it seems that there is a reduction in matrix effects when analyzing medium- to high-energy secondary ions. B Zon Yields. As far as the investigated samples are
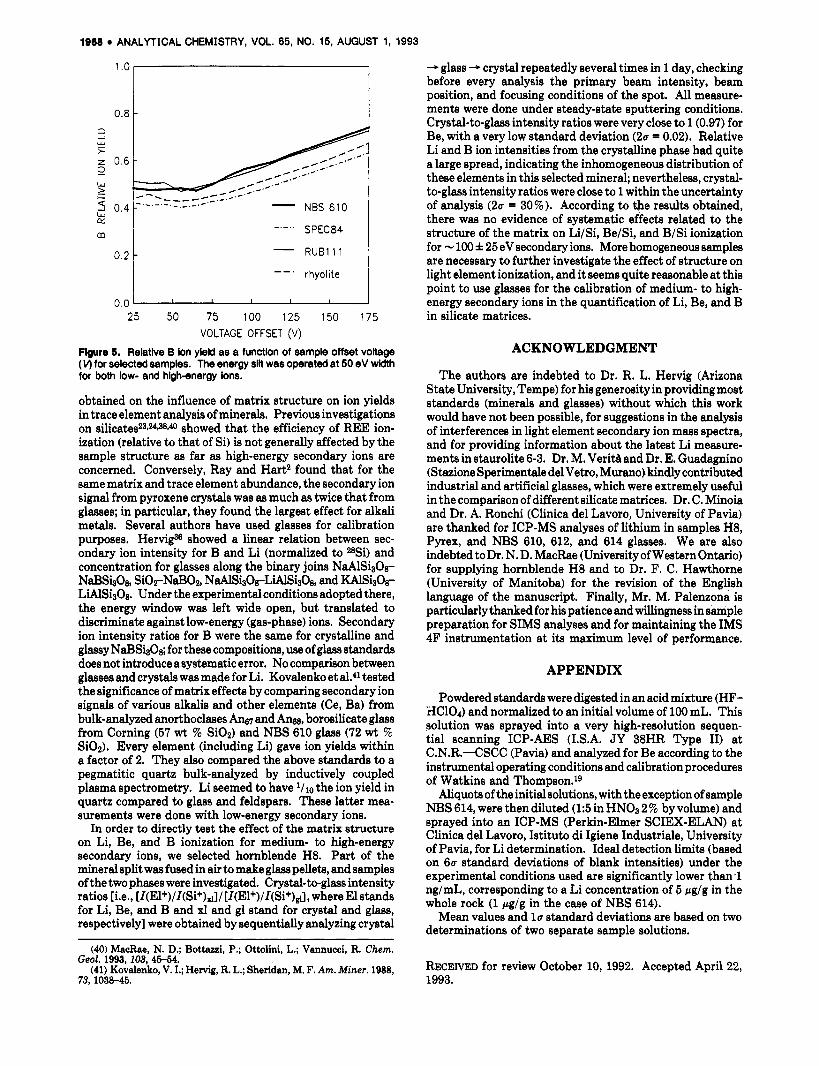
concerned, B/Si ionization is only slightly affected by matrix effects, even for dramatic changes in matrix composition. The trend of B/Si ion yield (Figure 5) is approximately constant at low voltages and increases smoothly and linearly a t high values. At 25-V offset, ion yields range from 0.42 for SPEC 84 (SiOz 3.21 wt %; P206 70.95 wt 5%) to 0.51 for RUB 111 (Si02 47.85 wt %; PbO 37.88 wt %). The relative difference (20 % ) is constant over the entire offset range. This agrees with data by Hewig,% who obtained reliable working curves for low-energy ions using glasses of various compo- sitions. On the basis of our results, matrix effects seem to be very low at any ion energy.
Crystal vs Glass Ion Yield. Working with a relative sensitivity factor approach leaves another problem still unresolved, the equivalence of crystalline and glassy standards for SIMS analysis. No definitive results have yet been
IQ68 ANALYTICAL CHEMISTRY, VOL. 65, NO. 15, AUGUST 1, 1993
RUB1 1 1 - I rhyolite
0.0 I I I I
25 50 75 100 125 150 175 VOLTAGE OFFSET (V)
Flgurs 5. Relative B ion yield as a functlon of sample offset voltage (V) for selected samples. The energy slit was operated at 50 eV width for both low- and high-energy Ions.
obtained on the influence of matrix structure on ion yields in trace element analysis of minerals. Previous investigations on silicates23~~~3~*40 showed that the efficiency of REE ion- ization (relative to that of Si) is not generally affected by the sample structure as far as high-energy secondary ions are concerned. Conversely, Ray and Hart2 found that for the same matrix and trace element abundance, the secondary ion signal from pyroxene crystals was as much as twice that from glasses; in particular, they found the largest effect for alkali metals. Several authors have used glasses for calibration purposes. HervigM showed a linear relation between sec- ondary ion intensity for B and Li (normalized to 28%) and concentration for glasses along the binary joins N d S i 3 0 ~ - NaBShOa, SiOrNaBOz, NaAlS&O~LiA1Si~O& and KAlSi30r LiAlSi3Oa. Under the experimental conditions adopted there, the energy window was left wide open, but translated to discriminate against low-energy (gas-phase) ions. Secondary ion intensity ratios for B were the same for crystalline and glassy NaBSisOa; for these compositions, use of glass standards does not introduce asystematic error. No comparison between glasses and crystals was made for Li. Kovalenko et al.41 tested the significance of matrix effects by comparing secondary ion signals of various alkalis and other elements (Ce, Ba) from bulk-analyzed anorthoclases b, and A%, borosilicate glass from Corning (57 wt % Si021 and NBS 610 glass (72 wt % Si02). Every element (including Li) gave ion yields within a factor of 2. They also compared the above standards to a pegmatitic quartz bulk-analyzed by inductively coupled plasma spectrometry. Li seemed to have 1/10 the ion yield in quartz compared to glass and feldspars. These latter mea- surements were done with low-energy secondary ions.
In order to directly test the effect of the matrix structure on Li, Be, and B ionization for medium- to high-energy secondary ions, we selected hornblende H8. Part of the mineral split was fused in air to make glass pellets, and samples of the two phases were investigated. Crystal-to-glass intensity ratios [i.e., [Z(El+)/Z(Si+)dl/ [Z(El+)/I(Si+)g~l, where El stands for Li, Be, and B and xl and gl stand for crystal and glass, respectively] were obtained by sequentially analyzing crystal
-* glass -, crystal repeatedly several times in 1 day, checking before every analysis the primary beam intensity, beam position, and focusing conditions of the spot. All measure- ments were done under steady-state sputtering conditions. Crystal-to-glass intensity ratios were very close to 1 (0.97) for Be, with a very low standard deviation (20 = 0.02). Relative Li and B ion intensities from the crystalline phase had quite a large spread, indicating the inhomogeneous distribution of these elements in this selected mineral; nevertheless, crystal- to-glass intensity ratios were close to 1 within the uncertainty of analysis (2u = 30%). According to %e results obtained, there was no evidence of systematic effects related to the structure of the matrix on LiISi, Be/Si, and B/Si ionization for - 100 f 25 eV secondary ions. More homogeneous samples are necessary to further investigate the effect of structure on light element ionization, and it seems quite reasonable a t this point to use glasses for the calibration of medium- to high- energy secondary ions in the quantification of Li, Be, and B in silicate matrices.
ACKNOWLEDGMENT
The authors are indebted to Dr. R. L. Hervig (Arizona State University, Tempe) for his generosity in providing most standards (minerals and glasses) without which this work would have not been possible, for suggestions in the analysis of interferences in light element secondary ion mass spectra, and for providing information about the latest Li measure- ments in staurolite 6-3. Dr. M. VeritA and Dr. E. Guadagnino (Stazione Sperimentale del Vetro, Murano) kindly contributed industrial and artificial glasses, which were extremely useful in the comparison of different silicate matrices. Dr. C. Minoia and Dr. A. Ronchi (Clinica del Lavoro, University of Pavia) are thanked for ICP-MS analyses of lithium in samples H8, Pyrex, and NBS 610, 612, and 614 glasses. We are also indebted to Dr. N. D. MacRae (University of Western Ontario) for supplying hornblende H8 and to Dr. F. C. Hawthorne (University of Manitoba) for the revision of the English language of the manuscript. Finally, Mr. M. Palenzona is particularly thanked for his patience and willingness in sample preparation for SIMS analyses and for maintaining the IMS 4F instrumentation at its maximum level of performance.
APPENDIX
Powdered standards were digested in an acid mixture (HF- HClOr) and normalized to an initial volume of 100 mL. This solution was sprayed into a very high-resolution sequen- tial scanning ICP-AES (I.S.A. J Y 38HR Type 11) a t C.N.R.-CSCC (Pavia) and analyzed for Be according to the instrumental operating conditions and calibration procedures of Watkins and Thompson.19
Aliquots of the initial solutions, with the exception of sample NBS 614, were then diluted (15 in HNO3 2 % by volume) and sprayed into an ICP-MS (Perkin-Elmer SCIEX-ELAN) at Clinica del Lavoro, Istituto di Igiene Industriale, University of Pavia, for Li determination. Ideal detection limits (based on 6a standard deviations of blank intensities) under the experimental conditions used are significantly lower than ,1 ng/mL, corresponding to a Li concentration of 5 pg/g in the whole rock (1 pg/g in the case of NBS 614).
Mean values and l a standard deviations are based on two determinations of two separate sample solutions.
(40) MacRne, N. D.; Bottazzi, P.; Ottolini, L.; Vannucci, R. Chem.
(41) Kovalenko, V. I.; Hervig, R. L.; Sheridan, M. F. Am. Miner. 1988, Geol. 1993,103,45-64.
73, 1038-46. RECEIVED for review October 10, 1992. Accepted April 22, 1993.
Related Documents