Quantification of climate change for the last 20,000 years from Wonderkrater, South Africa: implications for the long-term dynamics of the Intertropical Convergence Zone Lo¨ ıc Truc, Manuel Chevalier, Charly Favier, Rachid Cheddadi, Michael E. Meadows, Louis Scott, Andrew S. Carr, Gideon F. Smith, Brian M. Chase PII: S0031-0182(13)00301-5 DOI: doi: 10.1016/j.palaeo.2013.06.024 Reference: PALAEO 6548 To appear in: Palaeogeography, Palaeoclimatology, Palaeoecology Received date: 6 March 2013 Revised date: 14 June 2013 Accepted date: 21 June 2013 Please cite this article as: Truc, Lo¨ ıc, Chevalier, Manuel, Favier, Charly, Cheddadi, Rachid, Meadows, Michael E., Scott, Louis, Carr, Andrew S., Smith, Gideon F., Chase, Brian M., Quantification of climate change for the last 20,000 years from Won- derkrater, South Africa: implications for the long-term dynamics of the Intertropi- cal Convergence Zone, Palaeogeography, Palaeoclimatology, Palaeoecology (2013), doi: 10.1016/j.palaeo.2013.06.024 This is a PDF file of an unedited manuscript that has been accepted for publication. As a service to our customers we are providing this early version of the manuscript. The manuscript will undergo copyediting, typesetting, and review of the resulting proof before it is published in its final form. Please note that during the production process errors may be discovered which could affect the content, and all legal disclaimers that apply to the journal pertain.

Welcome message from author
This document is posted to help you gain knowledge. Please leave a comment to let me know what you think about it! Share it to your friends and learn new things together.
Transcript
�������� ����� ��
Quantification of climate change for the last 20,000 years from Wonderkrater,South Africa: implications for the long-term dynamics of the IntertropicalConvergence Zone
Loıc Truc, Manuel Chevalier, Charly Favier, Rachid Cheddadi, MichaelE. Meadows, Louis Scott, Andrew S. Carr, Gideon F. Smith, Brian M. Chase
PII: S0031-0182(13)00301-5DOI: doi: 10.1016/j.palaeo.2013.06.024Reference: PALAEO 6548
To appear in: Palaeogeography, Palaeoclimatology, Palaeoecology
Received date: 6 March 2013Revised date: 14 June 2013Accepted date: 21 June 2013
Please cite this article as: Truc, Loıc, Chevalier, Manuel, Favier, Charly, Cheddadi,Rachid, Meadows, Michael E., Scott, Louis, Carr, Andrew S., Smith, Gideon F.,Chase, Brian M., Quantification of climate change for the last 20,000 years from Won-derkrater, South Africa: implications for the long-term dynamics of the Intertropi-cal Convergence Zone, Palaeogeography, Palaeoclimatology, Palaeoecology (2013), doi:10.1016/j.palaeo.2013.06.024
This is a PDF file of an unedited manuscript that has been accepted for publication.As a service to our customers we are providing this early version of the manuscript.The manuscript will undergo copyediting, typesetting, and review of the resulting proofbefore it is published in its final form. Please note that during the production processerrors may be discovered which could affect the content, and all legal disclaimers thatapply to the journal pertain.
ACC
EPTE
D M
ANU
SCR
IPT
ACCEPTED MANUSCRIPT
1
Quantification of climate change for the last 20,000 years
from Wonderkrater, South Africa: implications for the long-
term dynamics of the Intertropical Convergence Zone
Loïc Truc*1, Manuel Chevalier
1, Charly Favier
1, Rachid Cheddadi
1, Michael E.
Meadows2, Louis Scott
3, Andrew S. Carr
4, Gideon F. Smith
5,6,7, Brian M. Chase
1, 8
1 Institut des Sciences de l’Evolution de Montpellier, UMR 5554, Centre National de Recherche
Scientifique/Université Montpellier 2, Bat.22, CC061, Place Eugène Bataillon, 34095 Montpellier, cedex5,
France;
2Department of Environmental and Geographical Science, University of Cape Town, Private Bag X3,
Rondebosch 7701, South Africa;
3Department of Plant Sciences, University of the Free State, Bloemfontein 9300, South Africa;
4Department of Geography, University of Leicester, Leicester, LE1 7RH, UK;
5Office of the Chief Director: Biosystematics Research and Biodiversity Collections, South African
National Biodiversity Institute, Private Bag X101, Pretoria 0001 South Africa;
6Schweickerdt Herbarium, Department of Botany, University of Pretoria, Pretoria, 0002 South Africa;
7Centre for Functional Ecology, Departamento de Ciências da Vida, Universidade de Coimbra, 3001-455
Coimbra, Portugal
8Department of Archaeology, History, Culture and Religion, University of Bergen, Postbox 7805, 5020,
Bergen, Norway
*corresponding author: [email protected]
ACC
EPTE
D M
ANU
SCR
IPT
ACCEPTED MANUSCRIPT
2
Highlights
Quantitative estimates of climate at a key South African site over the past 20 kyr.
Reconstructed trends show strong links with regional sea-surface temperatures.
Reconstructions indicate interhemispheric synchrony in the African tropics.
Findings do not support the hypothesis of direct insolation forcing of tropical African climates.
Highlights a promising technique for analyzing palaeobotanical data in the region.
ACC
EPTE
D M
ANU
SCR
IPT
ACCEPTED MANUSCRIPT
3
Abstract
In a region for which few palaeoenvironmental records are available, the fossil pollen record from the
Wonderkrater spring mound has contributed substantially to our understanding of past vegetation
changes in southeast Africa since the Last Glacial Maximum (LGM; 21 ka). Principal component
analyses of the pollen data by Scott and Thackeray (1987) provided environmental reconstructions
suggesting relatively mesic LGM conditions, with warm and dry conditions during the early Holocene
(11-6 cal kBP). This conforms to predicted patterns of precipitation change in the southern African
tropics in response to Northern Hemisphere cooling and orbital forcing. Subsequent data from the
Cold Air Cave speleothems and a sea-surface temperature record from the Mozambique Chanel,
however, indicate that conditions during the early to mid-Holocene may have been wetter than present
in the Wonderkrater region. To explore this question further, we have created a series of botanical-
climatological transfer functions based on a combination of modern climate and plant distribution data
from southern Africa. Applying these to the Wonderkrater fossil pollen sequence, we have derived
quantitative estimates for temperatures during the cold and warm quarters, as well as precipitation
during the wet and dry quarters. In addition, a species-selection method based on Bayesian statistics is
outlined, which provided a parsimonious choice of likely plant species from what are otherwise
taxonomically broad pollen-types.
We do not propose that our findings invalidate the previous principal component analyses, but
they do have the advantage of being based more clearly on the relationship between modern plant
distributions and individual climatic variables. Results indicate that temperatures during both the
warm and cold season were 6±2°C colder during the Last Glacial Maximum and Younger Dryas, and
that rainy season precipitation during the Last Glacial Maximum was ~50% of that during the mid-
Holocene. Our results also imply that changes in precipitation at Wonderkrater generally track
changes in Mozambique Channel sea-surface temperatures, with a steady increase following the
Younger Dryas to a period of maximum water availability at Wonderkrater ~3-7 ka. These findings

ACC
EPTE
D M
ANU
SCR
IPT
ACCEPTED MANUSCRIPT
4
argue against a dominant role of a shifting Intertropical Convergence Zone in determining long-term
environmental trends, and indicate that the northern and southern tropics experienced similar climatic
trends during the last 20 kyr.
Keywords: Quaternary, southern Africa, pollen analysis, transfer function, probability density
function, quantitative climate reconstruction, African Humid Period, Intertropical Convergence Zone
ACC
EPTE
D M
ANU
SCR
IPT
ACCEPTED MANUSCRIPT
5
Introduction
Late Quaternary climate variability in the Southern Hemisphere is a matter of significant debate, with
a range of hypotheses invoking different forcing climatic mechanisms to explain observed patterns of
change. In the southern tropics and subtropics of Africa, the most commonly posited phenomenon is
latitudinal adjustment in the mean annual position of the Intertropical Convergence Zone (ITCZ). This
is potentially driven by high latitude Northern Hemisphere cooling (e.g. Flohn, 1981; Johnson et al.,
2002) and/or direct insolation forcing (e.g. Braconnot et al., 2008; COHMAP, 1988; Kutzbach, 1981;
Liu et al., 2003; Marzin and Braconnot, 2009). Both hypotheses imply an inter-hemispheric anti-phase
relationship, that is, aridification in northern tropics would be expected to coincide with
humidification in the southern tropics (Scott, 1993; Street-Perrott and Perrott, 1993; Partridge et al.
1997; Scott et al. 1997; Schefuß et al., 2011). To date, however, no irrefutable evidence supporting
either hypothesis has been found in southern Africa (cf. Chase et al., 2010).
In this context, southern Africa is a key region in which to investigate vegetation and climate
dynamics, which may support, modify or falsify hypotheses concerning the Quaternary dynamics of
the ITCZ. The region is highly sensitive to perturbations in the Earth’s climate system, both at
regional and global scales (cf. Chase and Meadows, 2007; Dupont et al., 2011) due to its position at
the juncture of temperate, subtropical and tropical climate systems. However, this region is also
characterised by a lack of reliable, well-dated proxy records, and palaeoecological evidence is
particularly sparse and often difficult to interpret.
One record that has played a particularly important role in shaping our understanding of past
vegetation changes in southeast Africa during the late Quaternary is the fossil pollen sequence from
the Wonderkrater spring mound (Scott, 1982; Scott, 1999; Scott and Thackeray, 1987; Thackeray,
1999). Notably, the record has been interpreted as indicating a cool, but moist, Last Glacial Maximum
(LGM)/last glacial-interglacial transition (LGIT) and a dry early Holocene (Scott et al., 1987 ; Scott et
al., 2003). These findings support both the hypothesis of a southward shift of the ITCZ due to

ACC
EPTE
D M
ANU
SCR
IPT
ACCEPTED MANUSCRIPT
6
Northern Hemisphere cooling and that of direct insolation forcing in response to precessional changes
in the Earth's orbit.
As other records have been obtained from the region, however, certain paradoxes have
become evident in the aggregate regional dataset. For example, high resolution stable isotope records
from the Cold Air Cave speleothem spanning the last 25 kyr imply that the early to mid-Holocene was
more humid than the LGM at Wonderkrater (Holmgren et al., 2003; Lee-Thorp et al., 2001). More
recently, a longer, but lower resolution pollen record for the last 340 kyr from off the Limpopo River
mouth suggests that warmer periods are generally more humid in the region (Dupont et al., 2011). The
physical mechanism for this is thought to be the strong positive relationship between sea-surface
temperatures (SSTs) in the Mozambique Channel (Caley et al., 2011; Sonzogni et al., 1998) and
continental humidity in eastern South Africa, both under present conditions (Goddard and Graham,
1999), and over multi-millennial timescales (Chase et al., 2010; Dupont et al., 2011), with warmer
SSTs favouring increased evaporation and moisture transport. A question therefore arises as to
whether the principal components extracted from the Wonderkrater pollen sequence discretely reflect
temperature and humidity, as has been proposed.
The aim of this paper is to develop a new approach for interpreting the pollen data and
investigate this paradox, in order to improve our understanding of the forcing mechanisms driving
regional climate variability since the LGM. To explore this question, we use plant distribution and
climate data to define the specific climatic requirements of the plant taxa comprising the primary
pollen-types in the Wonderkrater sediment core, and to develop botanical-climatological transfer
functions based on probability density functions (pdfs). As well as addressing a critical topic in
southern African palaeoclimatology, this paper also describes the methods by which quantitative,
rather than qualitative, estimates of past climatic parameters can be obtained from southern African
fossil pollen records. This represents a significant step in this region, and it promises to provide the
basis for more robust comparisons of palaeoenvironmental data and general circulation model
simulations.
ACC
EPTE
D M
ANU
SCR
IPT
ACCEPTED MANUSCRIPT
7
Study area and regional settings
This study primarily considers trends in past vegetation and climate in the vicinity of the
Wonderkrater spring mound (24.4390°S, 28.7507°E) in northeastern South Africa. However, the
transfer function techniques applied necessitate a broader analysis of the distribution of plant taxa
across southern Africa, including South Africa, Lesotho, Swaziland, Botswana and Namibia (17° -
34°S and 11° - 32°E ) (Figure 1). The wider study area is characterized by strong heterogeneity in
terms of its topography, geology and climate. The complexity of this landscape, and the oceanic and
atmospheric circulation systems that determine the region's climate have resulted in strong
environmental gradients that have a clear influence on plant distributions.
Considering southern Africa as a whole, precipitation is associated with two major circulation
systems, viz: (1) tropical systems, including easterly flow from the Indian Ocean and northwesterly
flow from the tropical Atlantic Ocean. These develop with seasonal heating of the continent, both of
which are related to annual migrations of the ITCZ; (2) temperate systems, which influence the region
as frontal systems embedded in the westerly storm-track that migrates equatorward in winter months
(cf. Chase and Meadows, 2007) (Figure 2). Mean annual rainfall ranges from c. 800 mm per annum in
south east South Africa, to <50 mm per annum in Namibia. Isohyets are orientated in a broadly east-
west manner in more tropical latitudes, but become increasingly north-south orientated in central and
south-west South Africa, which reflects the increasing significance of the mid-latitude anticyclones
and temperate systems relative to the Intertropical Convergence Zone (ITCZ) in driving atmospheric
(in)stability and rainfall patterns (cf. Tyson and Preston-Whyte, 2000). The alternating seasonal
dominance of these systems therefore results in a strong seasonality gradient in precipitation across
the subcontinent, manifested as a summer rainfall zone in the eastern part of the sub-continent (SRZ,
>66% of mean annual precipitation falling between Oct-Mar), a winter rainfall zone in the southwest
(WRZ, >66% of mean annual precipitation falling between Apr-Sept) and a transitional zone
sometimes referred to as the year-round rainfall zone (YRZ), which receives both winter and summer
precipitation (cf. Chase and Meadows, 2007). Both of these broad climate regions are highly variable
in terms of temperature and precipitation, with mean annual values ranging from 6.5°C - 24.4°C and
ACC
EPTE
D M
ANU
SCR
IPT
ACCEPTED MANUSCRIPT
8
10 - 1380 mm yr-1
in the SRZ, and 10.8°C - 19.9°C and 25 - 970 mm yr-1
in the WRZ (Hijmans et al.,
2005).
At local and region scales both temperature and precipitation are strongly influenced by
topography, and the diversity of vegetation types is also influenced by edaphic conditions. Generally,
vegetation in the SRZ is composed of a variety of subtropical savannas, shrublands, grasslands and
woodland (Rutherford & Westfall, 1994). In contrast, the WRZ is associated with mediterranean
shrublands (known as fynbos and renosterveld).
The Wonderkrater site is located within the SRZ (Figure 2), with mean annual rainfall of
~550 mm. It is characterised by wet summers (DJF; ~285 mm) and very dry winters (JJA; ~15 mm)
(data from Hijmans et al., 2005). Mean seasonal temperatures are 23°C and 13.5 C° during summer
and winter respectively. The vegetation at the site is part of the Central Bushveld known as the
Springbokvlakte Thornveld (Mucina and Rutherford, 2006). This vegetation is an open to dense
savannah dominated by various species of Acacia or shrubby grassland. Important trees and shrubs
include Acacia karroo, A. leuderitzii, A. mellifera, A. nilotica, Ziziphus mucronata, Boscia foetida, B.
albitrunca, Euclea undulata, Searsia (Rhus) engleri, Dichrostachys cinerea, Diospyros lycioides,
Grewia flava and Tarchonanthus camphoratus, while the grasses are primarily comprised of Aristida
bipartita, A. canescens, Dicanthium annulatum, Iscaenum afrum, Setaria incrassata and Brachiaria
eruciformis (Mucina and Rutherford, 2006).
Data and methods
Southern Africa is subject to important constraints in terms of quantitative palaeoclimate
reconstruction methodologies. For example, transfer function techniques such as the mutual climatic
range method (MCR) (Atkinson et al., 1986; Fauquette et al., 1998; Grichuk, 1969, 1984), which
determines the climatic range of fossil floras by combining the mutual climatic envelope of the
pollen-types in assemblages, is unsuited to regions of high biodiversity, such as southern Africa
(Birks & Seppa, 2004). This results from the fact that while the vegetation itself is highly diverse, the
pollen taxonomy is only able to differentiate to familial or generic levels. As such, identifiable pollen-

ACC
EPTE
D M
ANU
SCR
IPT
ACCEPTED MANUSCRIPT
9
types can encompass a wide range of taxa, among which there may be several species with different
or even contrasting climatic requirements. This results in broad – sometimes multimodal – climatic
envelopes, and unrealistic climatic optima (Klotz et al., 2003). Another technique, the modern
analogues technique (MAT) (Guiot, 1990), which is based on the comparison of fossil pollen spectra
with their modern equivalents, cannot yet be applied in southern Africa as a suitable collection of
modern pollen samples has not yet been developed for the region. Traditional regression methods
such as WA (weighted averaging) and WA-PLS (weighted averaging - partial least squares) cannot,
therefore, be employed as there are insufficient data to calibrate regression models (Braak and
Juggins, 1993).
In this context, we have developed a transfer function based on probability density functions
(pdfs), (Kühl et al., 2002), which are calculated from known plant species distributions. This
reconstruction method uses a sub-set of dominant pollen types and from modern distribution data
identifies the most appropriate climate variables influencing their distribution. The most parsimonious
choice of species included in each fossil pollen type is identified as a function of the assemblage as a
whole for a given time step. This method is capable of not only providing quantitative estimates of
palaeoclimatic variables, but it can in many cases also discern more clearly seasonal variability in
rainfall and temperature, which is of paramount importance in southern Africa.
Botanical, climatic and fossil pollen data
Botanical data were extracted from a series of databases held by the South African National
Biodiversity Institute (http://sibis.sanbi.org/faces/DataSources.jsp; Rutherford et al., 2012; Rutherford
et al., 2003; SANBI, 2003). These data, which are derived mainly from herbarium collections, but
also from observations, are in general available as ‘presence’ within a particular quarter degree (0.25°
× 0.25°) grid square, and we have thus adopted this as the resolution for our analyses, upscaling more
precisely located data to this common resolution.
In order to define plant species distributions as a function of climate, we have used climatic
variables from WORLDCLIM1.4 (Hijmans et al., 2005), which, along with monthly precipitation and
temperature data, provides a dataset of 19 bioclimatic variables that are considered important
ACC
EPTE
D M
ANU
SCR
IPT
ACCEPTED MANUSCRIPT
10
elements in studying the eco-physiological tolerance of plants species. Some of these bioclimatic
variables are, however, highly correlated with each other, introducing information redundancy which
can be misleading when analysing the relative contribution of each variable. In order to choose a set
of weakly correlated descriptors that most appropriately explain plant species distributions, we
calculated the correlation between these 19 bioclimatic variables. Ultimately, this led to the retention
of four variables, viz. precipitation during the driest quarter (of the year) (PDryQ), precipitation of the
wettest quarter (PWetQ), mean temperature of the warmest quarter (TWarmQ), and mean temperature
of the coldest quarter (TColdQ) (Figure 3). These four variables represent groups of correlated
variables that are thought to play distinct, significant roles in plant species distribution. These data
were then upscaled to the same resolution as the botanical data (0.25°).
From the fossil record recovered from Wonderkrater, we selected 19 pollen taxa according to
their prevalence in the record and/or their importance as palaeoenvironmental indicators, as identified
by Scott (1982; 1999), Scott and Thackeray (1987) and Scott et al. (2003) (Table 1). The taxonomic
resolution of our analyses is the same as for the fossil pollen analysis. For each of these taxa, all the
species represented by ten or more occurrences have been extracted from the SANBI database.
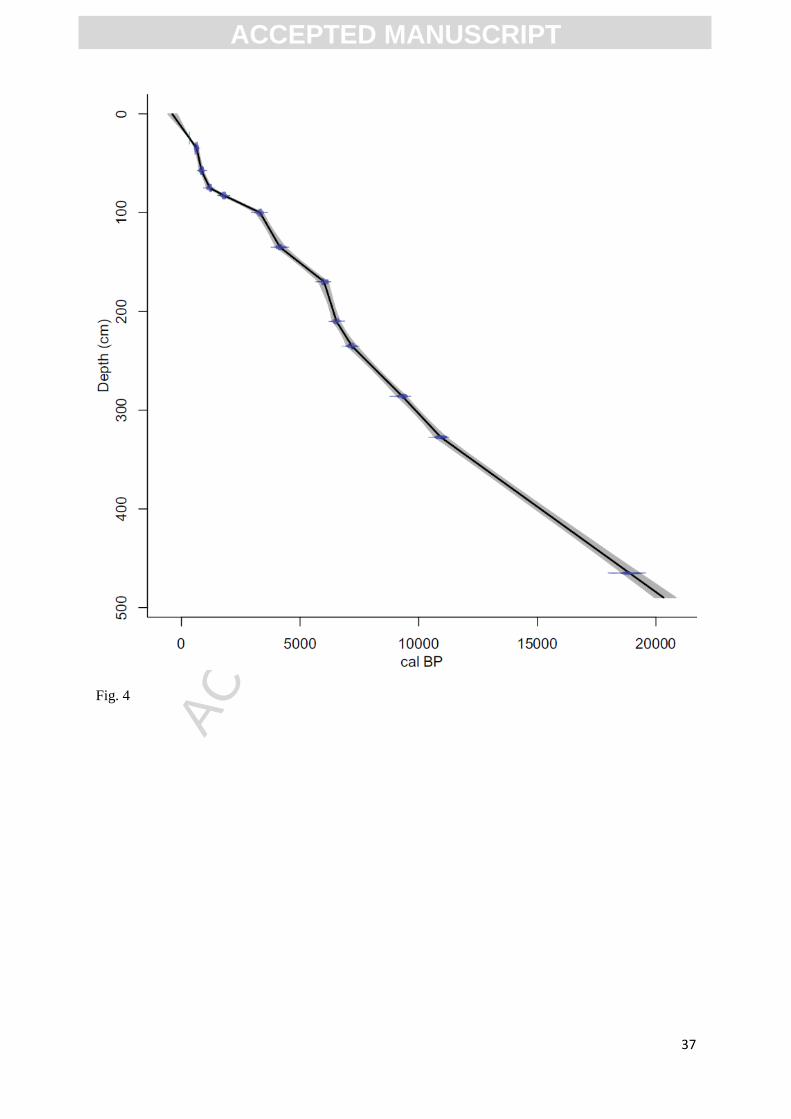
The chronologic control for the Wonderkrater sediment cores has been problematic (primarily
as a result of root contamination (cf. Scott et al., 2003)). While older samples exist from the site, we
have excluded them, restricting our analysis to samples from Borehole 3, the chronology of which is
based on the ages selected by Scott for this sequence (Scott et al., 2003). These have been recalibrated
here using the SHCal04 calibration dataset (McCormac et al., 2004) for Holocene ages and the
IntCal09 calibration dataset (Reimer et al., 2009) for older ages. The age-depth model (Figure 4) and
individual sample ages were calculated based on linear interpolation using the R script "Clam" of
Blaauw et al. (2010). Considering the dating uncertainties associated with the Wonderkrater sequence,
the timing of the events and trends described for this site should still, however, be treated as best
estimates.
ACC
EPTE
D M
ANU
SCR
IPT
ACCEPTED MANUSCRIPT
11
Resolving climatic influence over species distribution
To define the most important modern climatic variables controlling the distribution of the 19 pollen
taxa selected from the Wonderkrater record (Table 1), we used the Maxent species distribution
modelling method (Phillips et al., 2006) using Maxent 3.3.3k. This method is well-suited to presence
data only (Elith, 2006)requiring only species presence data and climatic variable layers. From these it
estimates the probability of a species’ occurrence in a given grid cell as a function of the climatic
variables provided. The model's performance was classically evaluated by partitioning the dataset,
with 70% of the samples being randomly chosen for model fitting and 30% for model testing. The
models' performances were estimated by the AUC (Area Under the Curve) of the ROC curve
(Receiver Operating Characteristic). The ROC curve provides a quantitative representation of the
tradeoffs between no omission (sensitivity) and commission errors (1-specificity). The area under the
ROC curve (AUC) is an important measure of the model performance and yields an index ranging in
value from 0 to 1. A good model ranges from 0.8 to 1 (Swets, 1988).
Finally, we quantified the contribution of each climatic variable in the models using the
jackknife contribution method, which calculates the contribution of each variable in two types of
models, viz. one involving only a given variable, and the other involving all variables except that
given variable (cf. Phillips et al., 2006). AUC calculated on the full model and these two models
provides evidence as to which climatic variables contribute most to the full model.
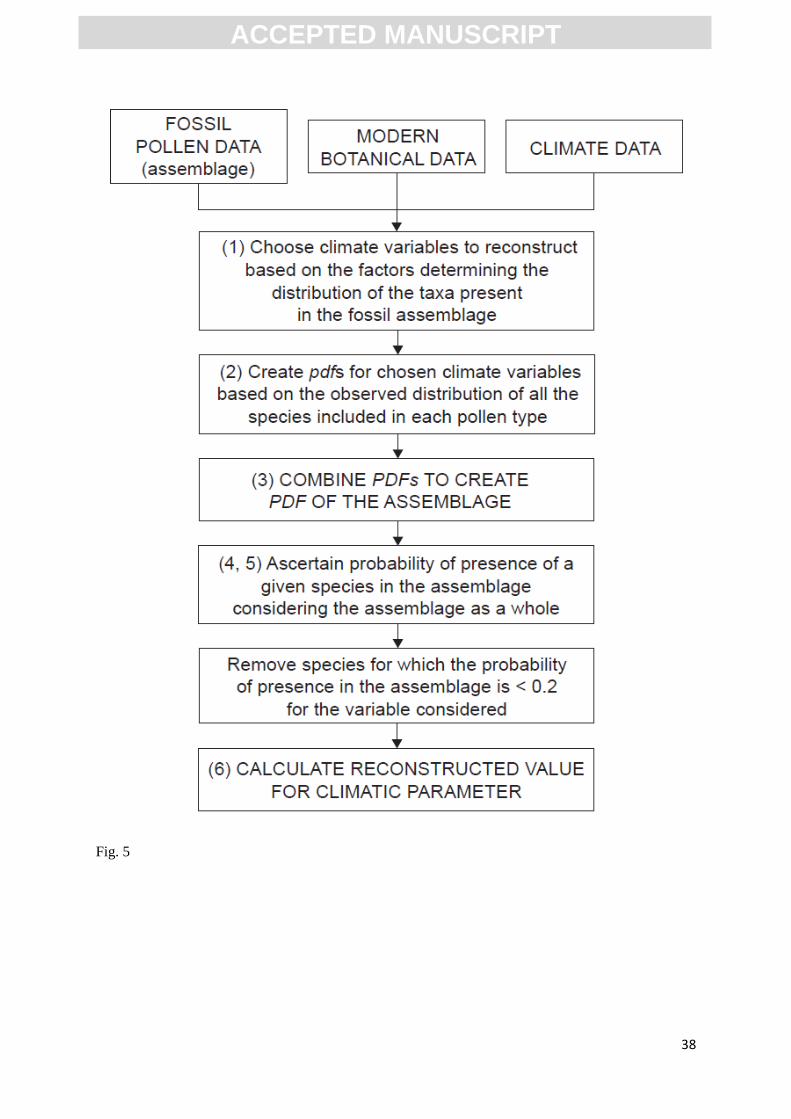
Pollen-climate transfer function
Here we present an alternative methodology using a botanical-climatological transfer function based
on pdfs calculated from the geographical distribution of the species included in each selected pollen
type (Table 1). For this, we assume the existence of a functional relationship between climate and
plant species distribution, and that this relationship has not changed over the time period in question.
The establishment of this transfer function is determined by the following steps (summarized in
Figure 5):
ACC
EPTE
D M
ANU
SCR
IPT
ACCEPTED MANUSCRIPT
12
(1) Results from the Maxent modelling process are used to identify the most important climatic
variables determining a pollen type’s distribution, and to choose the sensitive set of pollen types for
the reconstruction of each climatic variable. For this reconstruction, we retained only pollen types
where the variable contribution is higher than 10% (Table 1).
(2) We calculate the likelihood of a climatic variable (x) given the presence of a pollen type (y).
is the conditional probability of presence pollen type (y) given the value of (x): as
follows:
Where is the pdf of the climatic variable x in the study area, is the pdf of the variable x
where species y is present and is the probability of presence of species y (prevalence).
To ensure that pdfs reflect the plant-climate relationship rather than the climatic space of the
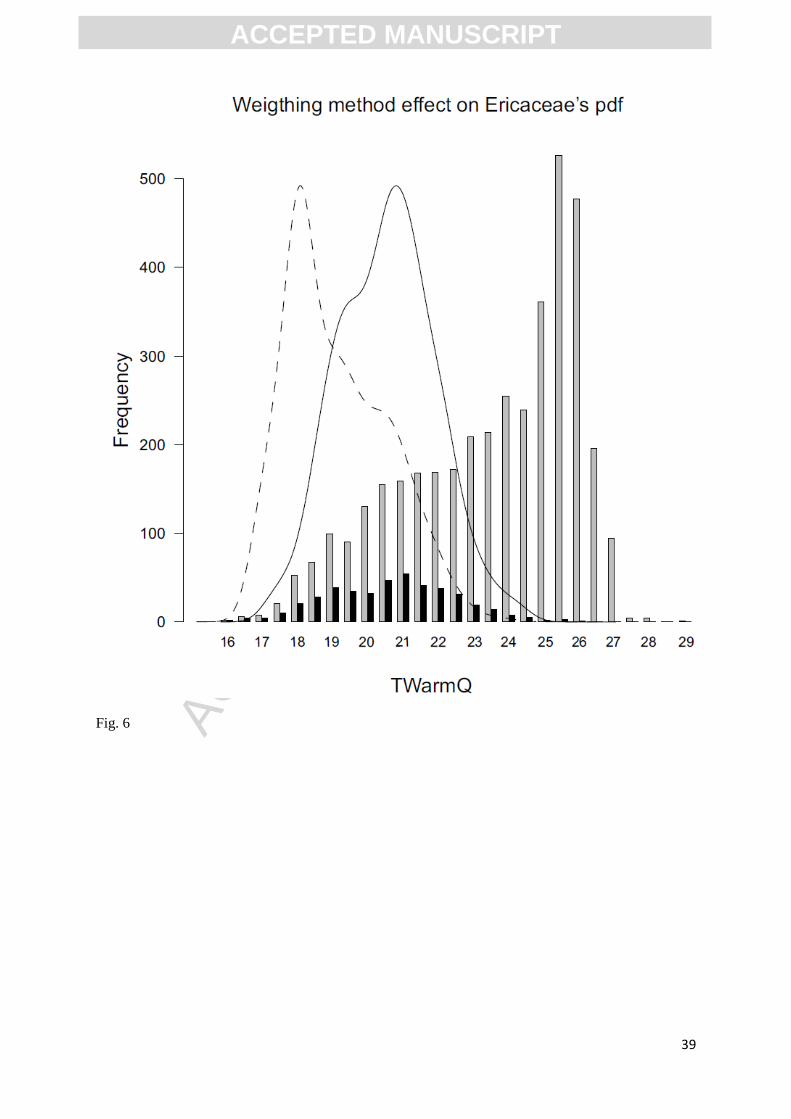
study area, we used the weighting method developed in Kühl et al (2002). This method aims at
rebalancing climate dataset according to the occurrence of a given climate space in the study area. The
use of this method for temperature variables results in a shift of the climatic optimum toward the class
of values that are at the limits of the climatic space, and are thus represented by fewer cells, but for
which the cells are always occupied by the plants (Figure 6).
In contrast to the reconstruction of temperature variables, the distribution of PDryQ and
PWetQ does not demand such weighting. As opposed to an increase in temperature, an increase in
precipitation is less likely to be a limiting factor as the ecophysiological tolerance of plants to high
precipitation is greater than for temperature. Such cells are occupied more frequently even for plants
showing dry optima, and the use of this weighting method leads to over estimates of the climate
values over this threshold, leading to unrealistic pdfs.
(3) An assemblage (k) is defined as the set of present pollen type: . Assuming that the
occurrence of pollen types are independent events, the likelihood of a climatic variable (x) given the
assemblage (k) is:
ACC
EPTE
D M
ANU
SCR
IPT
ACCEPTED MANUSCRIPT
13
(4) We calculate the likelihood of a climatic variable (x) given the presence of each species included
in each pollen type (y). is the conditional probability of presence species (y) given the value of
(x): and is computed by:
Where is the pdf of the climatic variable (x) in the study area, is the pdf of the variable
(x) where species (y )is present and is the probability of presence of species (y).
(5) We calculate the probability that a given species (y) is included in the pdf of the assemblage (k),
given the climatic variable (x) involved as follows:
We have removed all species whose probability of presence in the fossil assemblage, based on
the climatic variables influencing their distribution (Table 1) is lower than 20% for any given time-
step. This threshold was chosen, in consideration of the large climatic envelopes of many species, to
avoid the inclusion of species that might reflect substantially different climatic tolerances. In this
procedure, the pdfs of the assemblage are recalculated in the same way; removing other species and
reducing the range of the climatic envelope for the assemblage as a whole. Generally, after three
repetitions of this process the number of species stabilizes and the process is stopped. Finally, we get
the new pdfs, generated from the distribution of the pollen-types composed of species with probability
of presence in the assemblage is higher than 20%.
(6) The last step is to calculate the reconstructed climatic values independently of each other, based on
the maximum value (optima) of the pdfs of each pollen type including those species that are most
likely to be present in a given assemblage. Thereafter, this value (z) is weighted by the pollen

ACC
EPTE
D M
ANU
SCR
IPT
ACCEPTED MANUSCRIPT
14
percentage (normalized by their maximum percentage values; p) and averaged to calculate the
weighted mean value (w) for an assemblage (k) as follows:
In our approach, we assume that (1) normalized pollen percentage reflects the relative
abundance of a given taxon in the vicinity of the site, and (2) that a relationship exists between the
climatic optima of these taxa and the observed pollen percentage (Birks & Seppä, 2004).
RESULTS
Resolving the influence of climate on species distribution
Results from modelling indicate the role of selected climatic variables on the distribution of the
selected pollen types identified in the Wonderkrater record (Table 1). The results indicate: 1) the
pollen types used to reconstruct each palaeoclimatic variable, 2) the climatic variables that have the
greatest influence on their distributions, and 3) whether the pollen types are favoured by high or low
values of a given climatic variable. For our discussion, the selected pollen types have been divided
into three groups of associated elements, as a function of their climatic requirements.
Response of fynbos elements
Fynbos elements are represented by Proteaceae, Ericaceae, Cliffortia, Passerina and Stoebe-type
pollen. All these taxa are major components of the Fynbos Biome (Figure 2) of the Cape Floristic
Region (CFR) (Cowling et al., 1997), but they also occupy a wide spatial and climatic range. Their
distribution forms an arc encompassing several biomes, from the CFR through the montane grasslands
of the Drakensberg and Highveld to the savannas of northeastern South Africa.
Modelling results for these elements shows that their geographical distribution is influenced
primarily by temperature, with fynbos elements being mainly restricted to areas where TWarmQ is
below 23°C and TColdQ is above 10°C. These variables indicate that the temperature during the
wettest quarter (which is associated with the TWarmQ in the Savannah Biome and TColdQ in Fynbos

ACC
EPTE
D M
ANU
SCR
IPT
ACCEPTED MANUSCRIPT
15
Biome) plays a dominant role on fynbos taxa distribution. For the reconstruction of TWarmQ and
TColdQ, all fynbos elements were used.
In terms of rainfall, precipitation during the growing season corresponds to PColdQ in the
Fynbos Biome (WRZ) and the PWarmQ in the Savannah Biome (SRZ). For the Fynbos pollen types
these two variables are expressed in PWetQ, which shows a bimodal distribution ranging from 50 to
700 mm (except for in the case of Stoebe-type) reflecting the weak influence of this variable on the
distribution of fynbos taxa. The response of these taxa to PWetQ can be explained by their
distribution across the WRZ, YRZ and SRZ, with the bimodal distribution reflecting 1) the climate of
the Fynbos Biome and particularly the WRZ (PWetQ of 170 mm when averaged over the whole of the
biome), and 2) climate in the Savannah Biome, where the rainfall during the wet season is generally
higher. Importantly, this is particularly so at higher altitudes where these taxa are found in the SRZ.
However, even if a few species can be separated geographically in these two modes, the majority are
found along the length of the continuum from the CFR to the savannah. We have not, therefore used
fynbos elements to reconstruct precipitation (with the exception of Stoebe-type taxa, which indicate
generally low PWarmQ in the Wonderkrater region).
Response of savannah elements
Savannah elements include Combretaceae, Burkea, Acacia, Tarchonanthus, Capparaceae and
Spirostachys. The results show that the distributions of these taxa are affected by both precipitation
and temperature. In terms of PWetQ, Combretaceae, Spirostachys and Burkea show strong, unimodal
requirements, with optima at 350±90 mm. Capparaceae and Tarchonanthus, however, display a more
complex response to PWetQ. For this variable, these taxa occupy a wide range (0 to 700 mm), which
indicates high variability in terms of the requirements of the individual species included in these
pollen types.
These particular taxa are however less diverse than others considered here, and it is possible
to consider the individual species included within each pollen type. The genus Tarchonanthus, for
example, is currently represented in the Wonderkrater region (within 500 km) by T. trilobus, T.
parvicapitulatus and T. camphoratus. The first two species show similar PWetQ requirements around
ACC
EPTE
D M
ANU
SCR
IPT
ACCEPTED MANUSCRIPT
16
350±90 mm, while T. camphoratus requires less precipitation, and can occupy areas where PWetQ is
relatively low (170±110 mm). Capparaceae can also be divided into two groups of species,
differentiated by their rainfall regime, except for a few cosmopolitan species, which can be found in
the two groups. Unlike fynbos elements, where the majority of species can be found in the two modes,
the bimodal distribution of Tarchonanthus and Capparaceae can be directly attributed to differences in
individual species requirements. Such inter-specific variability can be anticipated to lead to
complications in the interpretation of the palaeoclimatic significance of their pollen.
In our analysis we have applied a species selection method, focusing on the climatic
requirements of individual species, which allowed us to make a parsimonious choice among the
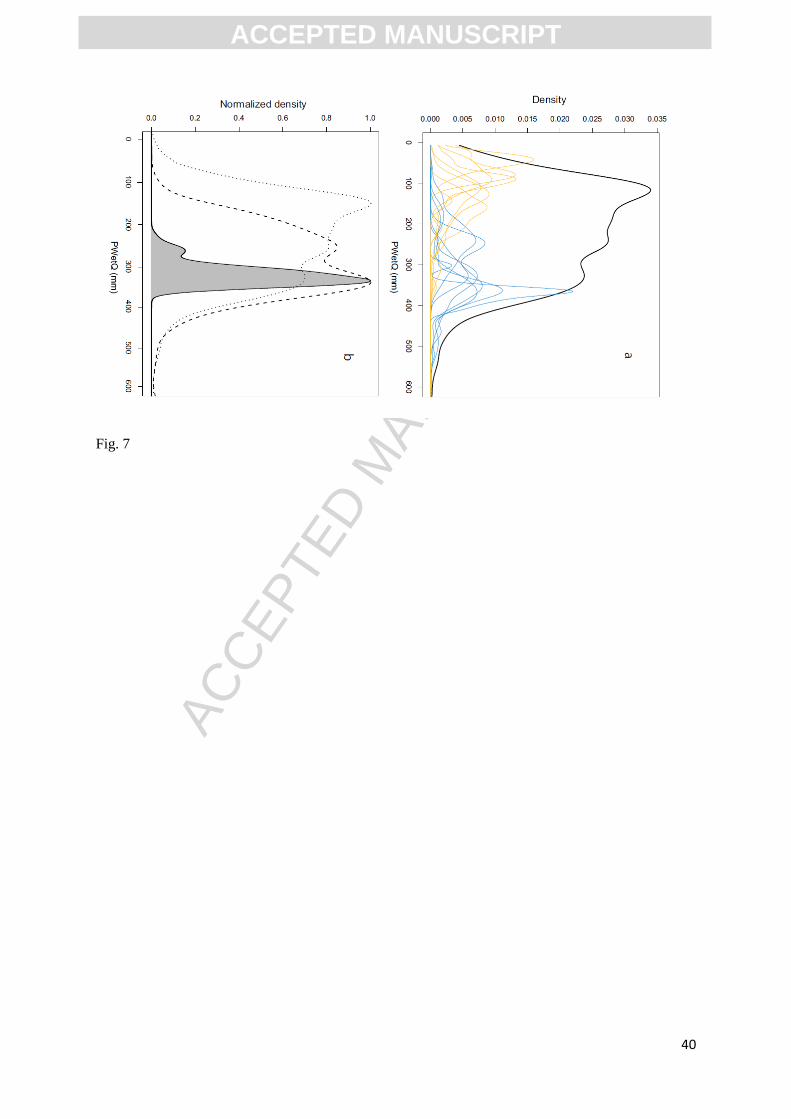
species included in each pollen type as a function of the assemblage as a whole. Of the Capparaceae
species found in the Wonderkrater region today, thirteen have a probability of being found in the
assemblage during the early Holocene less than 0.2 (Figure 7b). When we remove these species from
the Capparaceae pollen type we get a new optimum value that is more realistic and coherent with the
pollen assemblage. Similarly, while one of the species of Tarchonanthus (T. camphoratus) is an
important element in the dry savannah, the three others (T. trilobus, T. parvicapitulatus and T.
litoralis) are found in regions that are currently as wet or wetter than Wonderkrater. The species
selection method indicates that T. camphoratus was less likely to have been present during the early
Holocene (0.31), and the increase of Tarchonanthus pollen during this period was most likely due to
an increase of taxa such as T. trilobus (0.79), T. parvicapitulatus (0.83) and T. litoralis (0.49).
Together, these results allow a refinement of the taxa identification, and the interpretation of the
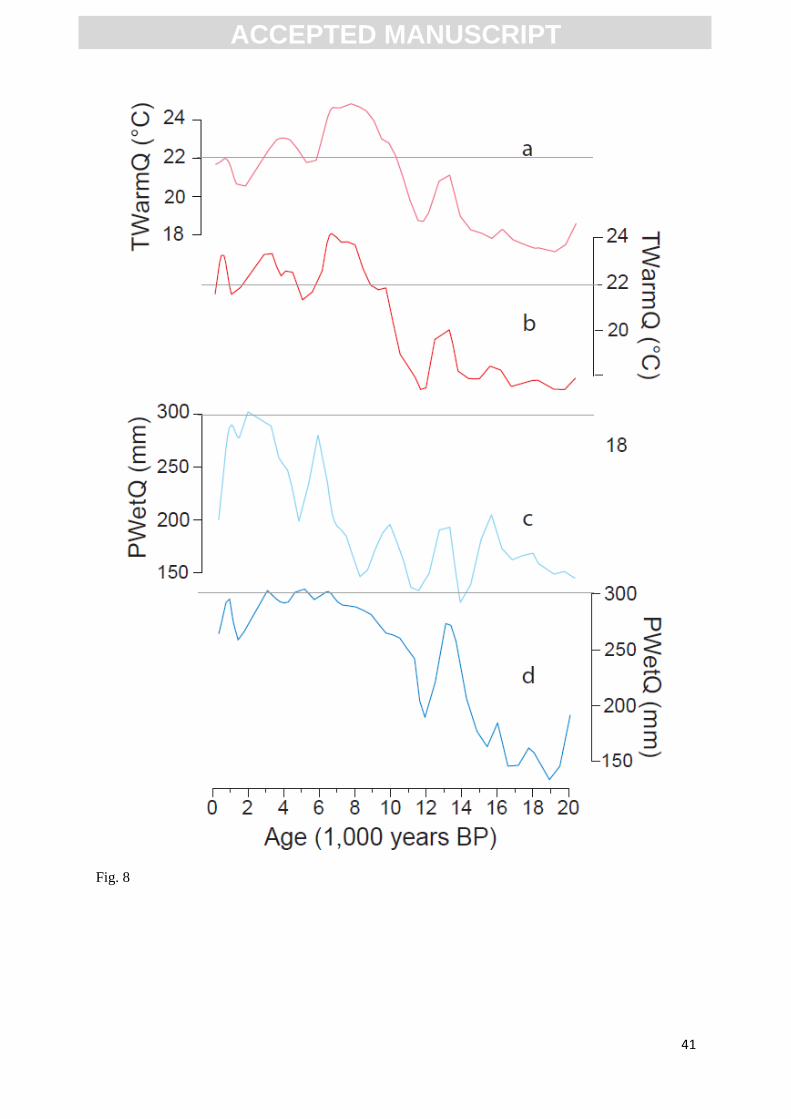
pollen record. While the reconstructed first order variability is similar both before and after species
selection is carried out (Figure 8), the species selection method allows for a more refined
reconstruction, particularly during the early Holocene, which appears to be more consistent with
changes in the dominant regional forcing mechanisms (see Discussion).
Modelling results indicate that the distribution of savannah elements is also sensitive to
warmer temperatures. Combretaceae, Capparaceae and Acacia represent the taxa which require the
highest TWarmQ values (optima = 25±2.3°C). To conclude, savannah elements can be considered as
ACC
EPTE
D M
ANU
SCR
IPT
ACCEPTED MANUSCRIPT
17
strong indicators of warm and wet summer (PWetQ) environments with a marked winter dry season
(PDryQ).
Response of other elements
This diverse group comprises taxa showing relationships between their distribution and climate that
cannot be readily incorporated into either the fynbos or savannah groupings. They do, however, show
significant change in their abundance in the Wonderkrater pollen record and as they are known to be
important indicators of particular climatic conditions they have been included in our reconstructions.
Podocarpus is represented by four species in southern Africa. It is a drought intolerant
afromontane forest element, whose distribution is mainly constrained by PDryQ (≥70±25 mm).
This pollen type is considered to be an indicator of wet conditions, but our results suggest that its
distribution is more specifically controlled by drought stress (sometimes facilitated by cool, but
not cold, habitats (20±2.1°C optimum for TWarmQ)). The coastal and montane distribution of
Podocarpus relates to the availability of sufficient moisture to support growth even during the dry
season.
Anthospermum spp. show similar requirements to fynbos elements, whose distribution is
influenced by TWarmQ. This taxon is however more cosmopolitan than other fynbos elements.
At Wonderkrater, Anthospermum can therefore be considered as an indicator of cool conditions.
Chenopodiaceae is a very widespread family, inhabiting xeric and halophytic environments
(Scott, 1982). Their distribution is mainly influenced by precipitation, occupying areas where
PWetQ is relatively low. Consideration must, however, be given to the influence of agricultural
irrigation and resultant changes in soil salinity on its modern distribution. Halophytes such as
Chenopodiaceae may become important elements of the ecosystem when agricultural activities
and irrigation lead to a salinisation of the soil (Rietz, 2003). This species can thus thrive as the
result of local disturbance, but is also sensitive to regional changes in climate. For this study, we
have not removed data points as a function of land use, but it may be that the strength of
ACC
EPTE
D M
ANU
SCR
IPT
ACCEPTED MANUSCRIPT
18
Chenopodiaceae as an indicator of aridity has been attenuated by its association with relatively
wet agricultural areas.
Aloe and Euclea are widespread genera whose distribution is mainly controlled by precipitation,
generally occupying areas where PWetQ ≥ 400±180 mm. However, some species of Aloe and
Euclea, can occupy extremely dry habitats, such as the Namib Desert and Succulent Karroo
Biome (Smith & Van Wyk, 2008). In terms of temperature, some of these taxa (e.g. Aloe
polyphylla) show strong resistance to low temperatures and can be found in the Drakensberg
Mountains, where TColdQ can drop down to 1.5°C (Scott et al., 1987).
Olea is also strongly influenced by precipitation, with most species occupying areas where
drought stress is limited (PDryQ ≥ 50±21 mm). An exception is O. europaea subsp. africana,
which has been found in arid environments in Namibia, although generally along water courses.
Artemisia, mainly represented by A. afra, requires relatively low summer temperatures, and
occupies chiefly the highveld or montane grasslands.
Quantitative palaeoclimatic reconstruction
Palaeo-temperatures
Using the data and techniques described above, we sought to develop the first quantitative pollen-
based climatic reconstruction from southern Africa. To assess the performance of the transfer
function, we first compared the reconstructed value from the top of the core, representing the modern
- submodern assemblage with modern warm and cold season temperatures at Wonderkrater. The
reconstructed temperatures (TWarmQ = 21.8±2.3°C, TColdQ = 13±2°C) are very close to actual
values (TWarmQ = 22°C, TColdQ = 12.7°C).
Figures 9b and 9c show temperature reconstructions for the past 20 kyr derived from the
Wonderkrater pollen data. These reconstructions show significant temperature variability, particularly
across the LGIT, when TWarmQ rose from 18±1°C to 24±1.3°C and TColdQ rose from 9°±1°C to

ACC
EPTE
D M
ANU
SCR
IPT
ACCEPTED MANUSCRIPT
19
15.5±1.2°C. Results show that the LGM was 6±2°C cooler than the mid-Holocene, and about 4±2°C
cooler than present day. This can be seen in the high percentage of fynbos elements such as Stoebe,
Ericaceae, Proteaceae, Cliffortia and Passerina in the pollen assemblages at this time, whose
distribution, as indicated by the analysis here, will be strongly influenced by cooler climates.
Following Heinrich Stadial 1 (HS1; 18.5-14.6 ka) strong warming is observed in the record,
from 13.6-12.5 cal kBP, approximately contemporaneous with the Bølling-Allerød (B/A). During this
period, results show temperatures rising about 4°C relative to the LGM. In the pollen diagram, this
period is characterised by a marked increase in savannah elements such as Combretaceae,
Tarchonanthus and Capparaceae, accompanied by a steep decline in psycrophilic fynbos elements and
dry indicators such as Chenopodiaceae. This relatively warm period is followed by cooling from 12.3
to 10.5 cal kBP, during which fynbos elements increase in abundance, and temperatures return to
values similar to those of the LGM. The degree to which this cooling can be reliably attributed to the
Younger Dryas (YD; 13-11.5 ka) event, observed elsewhere in southern Africa (Chase et al., 2011), is
however, limited by the accuracy of the chronology of the Wonderkrater sequence (cf. Scott et al.,
2003).
A gradual warming trend marks the beginning of the Holocene, with the model indicating
maximum summer and winter temperatures occurring 8.3 - 6.5 cal kBP. Significant vegetation
changes mark this phase, with the spread of savannah elements, especially Tarchonanthus and
Capparaceae, and the decline of cool-climate taxa such as fynbos elements, which disappear
completely in the pollen sequence during this period. After 6.5 cal kBP, we observed a sharp decrease
of summer temperature from 23.8±1.5°C to 19.8±1.2°C. Following this major decline, temperatures
are variable and show a complex pattern, oscillating between 21°C and 23°C to the present day.
Palaeo-precipitation
The reconstructed PWetQ value from the most recent pollen sample (260±25 mm; Figure 9e) does not
correspond to contemporary rainfall at Wonderkrater (~310 mm; Hijmans et al., 2005). This
discrepancy can perhaps be explained by either: 1) the increase in halophytic Chenopodiaceae (Figure
ACC
EPTE
D M
ANU
SCR
IPT
ACCEPTED MANUSCRIPT
20
9g) as a result of irrigation activities during the phase of post-colonial vegetation disturbance, or 2)
that the age-model based on the assumption of a modern age for the surface of the spring mound is
inaccurate, and in fact the uppermost samples are somewhat older than previously thought, perhaps
falling within a drier period.
These caveats notwithstanding, when the new analysis of the Wonderkrater record is
considered as a whole, a clear and consistent positive relationship between temperature and
precipitation throughout the last 20 kyr, with drier (wetter) conditions generally occurring during
cooler (warmer) periods (Figure 9). The amplitude of summer rainfall variability is ~170 mm, with
minimum values of ~150 mm during HS1 and the LGM and maximum values of ~320 mm from 7-3
cal kBP. Like the temperature record, the transition from LGM to the early Holocene is also
characterized by two important phases. Following HS1, conditions rapidly become much wetter
between 15-13.5 ka, with an increase in summer precipitation from ~150±25 to ~300±25 mm. It is
interesting to note that the shift to wetter conditions seeming pre-dates the temperature increase in the
Wonderkrater reconstruction by approximately 1000 years. In the pollen diagram, increased moisture
availability is apparent from an increase in pollen from mesic savannah and thicket elements such as
Combretaceae and Aloe, and a decrease in cool, relatively arid indicators such as Stoebe-type pollen.
At ~12.3 cal kBP, summer precipitation declines sharply by ~125±25 mm, corresponding to the
cooling in the palaeotemperatures reconstruction. This dry period is characterized by a reduction of
pollen percentages from savannah and thicket elements, especially Tarchonanthus, Capparaceae and
Aloe, and an increase in fynbos elements and Chenopodiaceae. However, while temperatures again
lag, remaining low until ~10.5 cal kBP, warm season precipitation increases as early as ~11.5 cal
kBP. This marks the beginning of a period of extended moisture that extends across the early and
mid-Holocene, until ~2.9 cal kBP. The late Holocene is notably drier than today (30% lower PWetQ),
but is also marked by significant variability, with some periods of wetter than present conditions.
ACC
EPTE
D M
ANU
SCR
IPT
ACCEPTED MANUSCRIPT
21
DISCUSSION
Comparison with previous Wonderkrater reconstruction
The reconstructions presented here show that during the LGM summer temperatures at Wonderkrater
were ~4±2°C lower than present and ~6±2°C lower than during the Holocene Altithermal. The
difference is similar to previous estimates made on the basis of lapse rate between altitudes of
savannah and fynbos belts in the region (Scott, 1982). The reconstructed LGM temperatures are
similar to other temperature reconstructions for the sub-continent (Heaton et al., 1983; Kulongoski
and Hilton, 2004; Stute and Talma, 1998; Talma and Vogel, 1992). For the duration of the record as a
whole these results are very similar (r = 0.91) to the trends identified in the PCA-based
reconstructions (Scott, 1999; Scott et al., 2012; Scott and Thackeray, 1987) (Figure 9). After 6.5 cal
kBP, our reconstruction indicates greater variability than the PCAs; a difference that is probably due
to the relatively low explained variance of axis 1 (14%), which suggests the influence of climatic
variables other than temperature.
While the PCA-based reconstructions (Scott, 1999; Scott et al., 2012; Scott and Thackeray,
1987) and pdf-based temperature reconstructions from Wonderkrater show similar patterns, the
reconstructions of palaeo-precipitation show significant differences (Figure 9). Interpretations of PCA
axis 2 (PC2) suggested that the early Holocene (11 to 5.5 cal kBP) was significantly drier than the late
Holocene (Scott, 1999; Scott and Thackeray, 1987). In contrast, our pdf-based reconstructions show
an increase of moisture during the early Holocene. This important difference in results/interpretation
may be related to the methodologies employed; specifically that the co-occurrence of taxa highlighted
in PCAs may reflect the influence of a combination of environmental variables. While the co-
variation of pollen type percentages is likely to have, at least to some degree, a basis in climatic
variability, the attribution of humidity or temperature to a given axis can be more complicated. This
may also explain why the explained PCA variance is relatively low (at Wonderkrater, axis 1 = 14%;
axis 2 = 10%).
ACC
EPTE
D M
ANU
SCR
IPT
ACCEPTED MANUSCRIPT
22
Considering the fossil pollen record (Figure 9g), it is evident that Capparaceae and
Tarchonanthus pollen type drive the negative PC2 loading in the early Holocene. This finding,
coupled with the dominance of these taxa in the vegetation of the bushveld and thornveld
communities of the Kalahari dry savannah to the southeast of Wonderkrater (from which modern
pollen assemblages from surfaces samples indicate the co-occurrence of Tarchonanthus, Capparaceae
and Aloe, as observed in the fossil record) led Scott (1982; 1999) to interpret the second PCA axis as
being strongly influenced by humidity. As mentioned, the species selection method we have applied
allows us to focus on the climatic requirements of individual species, and make a parsimonious choice
from the species included in each pollen type as a function of the assemblage as a whole. This
analysis indicates that the more xeric taxa of Tarchonanthus and Capparaceae are less likely to have
been present at the site during the early Holocene, further supporting the possibility that it may have
been more humid than the PCAs indicate (Figures7 and 8).
It is interesting to note that strong positive correlations are observed between PC2 and our
reconstructed values of PDryQ (Figure 9d/9e). Changes in PDryQ are negatively correlated with
precipitation during the wet season across the Holocene (Figure 9f). This inverse trend could be
interpreted as an increase in seasonality across this period, where rainfall was mainly restricted to
summer wet season. The increase in precipitation during the wet season and decrease in the dry
season observed in our results are driven by the appearance of savannah elements, including
Combretaceae and Burkea, which require strong rainfall seasonality. The indication is that the relation
between PDryQ and plants may not be directly related to precipitation amount, but rather reflect
drought stress tolerance. The strong correlation between PC2 and PDryQ suggests that PC2 may be
more a reflection of drought stress rather than rainfall amount.
The palaeoclimatic significance of Wonderkrater: a re-interpretation
The new reconstruction confirms previous estimates of the probable temperature depression
associated with the LGM in southern Africa. It also provides some new insights into the magnitude of
the climatic fluctuations associated with the period encompassing the last glacial-interglacial
transition, a period for which there is increasing evidence of marked climatic dynamism in southern
ACC
EPTE
D M
ANU
SCR
IPT
ACCEPTED MANUSCRIPT
23
Africa (e.g. Abel and Plug, 2000; Chase et al., 2011). For instance, these new data, although
constrained by some chronological uncertainty suggest mean annual temperature fluctuations of an
amplitude of c. 4°C during the LGIT, akin to the difference between current conditions and the LGM.
The pdf-based reconstructions of palaeo-precipitation coupled with new insights into the most
likely species represented by the pollen types identified in the record allow us to also reconsider the
meaning of PCA axis 2 in the original Wonderkrater analysis. A major finding of this new
interpretation is that the early Holocene period in particular was associated with enhanced (rather than
reduced) moisture availability, contrary to hypotheses that predict drier conditions concurrent with a
austral summer insolation minimum (e.g. Braconnot et al., 2008; COHMAP, 1988; Kutzbach, 1981;
Liu et al., 2003; Marzin and Braconnot, 2009). These new data closely mirror changes in
Mozambique Channel SSTs (Sonzogni et al., 1998) (Figure 10g). They are consistent with
expectations of increased continental moisture with in associated with elevated Indian Ocean SSTs
(Chase et al., 2010; Dupont et al., 2011; Goddard and Graham, 1999; Stager et al., 2011).
From the wider region, lake high-stands at Lake Chilwa (Thomas et al., 2009) date to 12.8-
13.7 ka and 15.4-16.1 ka, which coincides with the period of pronounced positive anomalies in SSTs
in the Mozambique Channel (Sonzogni et al., 1998), as well as the more humid conditions now
identified as following HS1 at Wonderkrater (Figure 10). Stable carbon isotope and greyscale records
from nearby Cold Air Cave (Holmgren et al., 2003; Lee-Thorp et al., 2001) have been interpreted as
indicating relatively humid conditions during the early to mid-Holocene, with increased tree cover
(Lee-Thorp et al., 2001). To the north, markedly similar trends can be observed in the δ13
C records
from the nearby Braamhoek wetland (Norstöm et al., 2009), marine core GeoB9307-3 (which we
interpret to reflect vegetation cover in the Zambezi Basin, contrary to Schefuß et al., 2011), Lake
Malawi (Castañeda et al., 2007), Lake Tanganiyka (Tierney et al., 2008) and even the distant site of
Lake Challa (Sinninghe Damsté et al., 2011).
While a degree of regional variability is to be expected, and the shortcomings of the
Wonderkrater chronologies must be kept in mind (cf. Scott et al., 2003), there is a strong coherence in
the first order trends observed in these SE African records, with the YD, HS1 and LGM being

ACC
EPTE
D M
ANU
SCR
IPT
ACCEPTED MANUSCRIPT
24
generally drier, and the early to mid-Holocene being relatively humid (Figure 10). These combined
findings support the hypothesis that deglacial increases in SW Indian Ocean SSTs played a
fundamental role in determining continental climates in SE Africa (Stager et al., 2011) and that, while
the mean latitudinal position of the ITCZ may have been displaced southward during periods of
Northern Hemisphere cooling (Johnson et al., 2002; Schefuß et al., 2011), and northward as a
response to direct insolation forcing during the early Holocene (Braconnot et al., 2007; Castañeda et
al., 2007; Johnson et al., 2002; Kutzbach and Street-Perrott, 1985), these changes were secondary to
primary responses to variations in evaporation and advection of moisture from the adjacent ocean.
Conclusions
Our modelling approach allows us to better identify and constrain the influence of a
range of climatic parameters on plant distributions, and thus create more robust,
objective reconstructions.
The species selection method developed in this paper allows the identification of the
most parsimonious choice among species represented by specific pollen types, and is
a useful tool in regions characterized by high biodiversity, particularly in southern
Africa where taxonomic resolution have been a major constrain on palynological
climatic reconstructions.
This work suggests that the early Holocene may have been wetter than previous
interpretations of the Wonderkrater record indicated and these new results exhibit
strong correlations with SW Indian Ocean SSTs, as well as regional palaeoclimatic
archives from several other locales, indicating a strong relationship between SST
variability and continental humidity in SE Africa since the LGM.
The new interpretation of this pollen sequence provides new quantitative information
for the Late Pleistocene and Holocene, and improves our knowledge of the role and
impact of various forcing mechanisms in the region, presenting a powerful tool for
future palaeoclimatic reconstructions.
ACC
EPTE
D M
ANU
SCR
IPT
ACCEPTED MANUSCRIPT
25
References
Abell, P.I., Plug, I., 2000. The Pleistocene/Holocene transition in South Africa: evidence for the
Younger Dryas event. Global and Planetary Change 26, 173-179.
Atkinson, T.C., Briffa, K.R., Coope, G.R., Joachim, M.J., Perry, D.W., 1986. Climatic calibration of
coleopteran data, In: B.E., B. (Ed.), Handbook of Holocene Palaeoecology and Palaeohydrology.
Wiley, New York, pp. 851-859.
Berger, A., Loutre, M.F., 1991. Insolation values for the climate of the last 10 million years.
Quaternary Science Reviews 10, 297-317.
Birks, H.J.B., Seppä, H., 2004. Pollen-based reconstructions of late-Quaternary climate in Europe–
progress, problems, and pitfalls. Acta Palaeobotanica 44, 317-334.
Blaauw, M., 2010. Methods and code for `classical' age-modelling of radiocarbon sequences.
Quaternary Geochronology 5, 512-518.
Braak, C.F., Juggins, S., 1993. Weighted averaging partial least squares regression (WA-PLS): an
improved method for reconstructing environmental variables from species assemblages.
Hydrobiologia 269-270, 485-502.
Braconnot, P., Marzin, C., Gregoire, L., Mosquet, E., Marti, O., 2008. Monsoon response to changes
in Earth's orbital parameters: comparisons between simulations of the Eemian and of the Holocene.
Clim. Past J1 - CP 4, 281-294.
Braconnot, P., Otto-Bliesner, B., Harrison, S., Joussaume, S., Peterchmitt, J.-Y., Abe-Ouchi, A.,
Crucifix, M., Driesschaert, E., Fichefet, T., Hewitt, C.D., Kageyama, M., Kitoh, A., Lâiné, A.,
Loutre, M.-F., Marti, O., Merkel, U., Ramstein, G., Valdes, P., Weber, L., Yu, Y., Zhao, Y., 2007.
Results of PMIP2 coupled simulations of the Mid-Holocene and Last Glacial Maximum - Part 1:
experiments and large-scale features. Climate of the Past 3, 261-277.
Brook, G.A., Scott, L., Railsback, L.B., Goddard, E.A., 2010. A 35 ka pollen and isotope record of
environmental change along the southern margin of the Kalahari from a stalagmite and animal
dung deposits in Wonderwerk Cave, South Africa. Journal of Arid Environments 74, 870-884.
ACC
EPTE
D M
ANU
SCR
IPT
ACCEPTED MANUSCRIPT
26
Caley, T., Kim, J.H., Malaizé, B., Giraudeau, J., Laepple, T., Caillon, N., Charlier, K., Rebaubier, H.,
Rossignol, L., Castañeda, I.S., Schouten, S., Sinninghe Damsté, J.S., 2011. High-latitude obliquity
as a dominant forcing in the Agulhas current system. Climates of the Past 7, 1285-1296.
Castañeda, I.S., Werne, J.P., Johnson, T.C., 2007. Wet and arid phases in the southeast African tropics
since the Last Glacial Maximum. Geology 35, 823-826.
Chase, B.M., Meadows, M.E., 2007. Late Quaternary dynamics of southern Africa's winter rainfall
zone. Earth-Science Reviews 84, 103-138.
Chase, B.M., Meadows, M.E., Carr, A.S., Reimer, P.J., 2010. Evidence for progressive Holocene
aridification in southern Africa recorded in Namibian hyrax middens: implications for African
Monsoon dynamics and the "African Humid Period''. Quaternary Research 74, 36-45.
Chase, B.M., Quick, L.J., Meadows, M.E., Scott, L., Thomas, D.S.G., Reimer, P.J., 2011. Late glacial
interhemispheric climate dynamics revealed in South African hyrax middens. Geology 39, 19-22.
COHMAP, 1988. Climatic changes of the last 18,000 years: observations and model simulations.
Science 241, 1043-1052.
Cowling, R.M., Richardson, D.M., J., M.P., 1997. Fynbos, In: Cowling, R.M., Richardson, D.M.,
Pierce, S.M. (Eds.), Vegetation of Southern Africa. Cambridge University Press, Cambridge, pp.
99-130.
Dupont, L.M., Caley, T., Kim, J.H., Castañeda, I., Malaizé, B., Giraudeau, J., 2011. Glacial-
interglacial vegetation dynamics in South Eastern Africa coupled to sea surface temperature
variations in the Western Indian Ocean. Clim. Past 7, 1209-1224.
Elith, J., H. Graham, C., P. Anderson, R., Dudík, M., Ferrier, S., Guisan, A., J. Hijmans, R.,
Huettmann, F., R. Leathwick, J., Lehmann, A., Li, J., G. Lohmann, L., A. Loiselle, B., Manion, G.,
Moritz, C., Nakamura, M., Nakazawa, Y., McC. M. Overton, J., Townsend Peterson, A., J.
Phillips, S., Richardson, K., Scachetti-Pereira, R., E. Schapire, R., Soberón, J., Williams, S., S.
Wisz, M., E. Zimmermann, N., 2006. Novel methods improve prediction of species’ distributions
from occurrence data. Ecography 29, 129-151.
Fauquette, S., Guiot, J., Suc, J.-P., 1998. A method for climatic reconstruction of the Mediterranean
Pliocene using pollen data. Palaeogeography, Palaeoclimatology, Palaeoecology 144, 183-201.

ACC
EPTE
D M
ANU
SCR
IPT
ACCEPTED MANUSCRIPT
27
Flohn, H., 1981. A hemispheric circulation asymmetry during late Tertiary. Geologische Rundschau
70, 725-736.
Fauquette, S., Guiot, J., Suc, J.-P., 1998. A method for climatic reconstruction of the Mediterranean
Pliocene using pollen data. Palaeogeography, Palaeoclimatology, Palaeoecology 144, 183-201.
Flohn, H., 1981. A hemispheric circulation asymmetry during late Tertiary. Geologische Rundschau
70, 725-736.
Gayo, E.M., Latorre, C., Jordan, T.E., Nester, P.L., Estay, S.A., Ojeda, K.F., Santoro, C.M., Late
Quaternary hydrological and ecological change in the hyperarid core of the northern Atacama
Desert (~ 21°S). Earth-Science Reviews.
Goddard, L., Graham, N.E., 1999. Importance of the Indian Ocean for simulating rainfall anomalies
over eastern and southern Africa. J. Geophys. Res. 104, 19099-19116.
Grichuk, V.P., 1969. An attempt to reconstruct certain elements of the climate of the northern
hemisphere in the Atlantic Period of the Holocene, In: Neishadt, M.I. (Ed.), Golotsen. Izd-vo
Nauka, Moscow, pp. 41-57.
Grichuk, V.P., 1984. Late Pleistocene vegetation history, In: Velichko, A.A. (Ed.), Late Quaternary
Environments of the Soviet Union. Longman, London, pp. 155-178.
Guiot, J., 1990. Methodology of the last climatic cycle reconstruction in France from pollen data.
Palaeogeography, Palaeoclimatology, Palaeoecology 80, 49-69. Heaton, T.H.E., Talma, A.S.,
Vogel, J.C., 1983. Origin and history of nitrate in confined groundwater in the western Kalahari.
Journal of Hydrology 62, 243-262.
Heaton, T.H.E., Talma, A.S., Vogel, J.C., 1983. Origin and history of nitrate in confined groundwater
in the western Kalahari. Journal of Hydrology 62, 243-262.
Heaton, T.H.E., Talma, A.S., Vogel, J.C., 1986. Dissolved gas paleotemperatures and 18O variations
derived from groundwater near Uitenhage, South Africa. Quaternary Research 25, 79-88.
Hijmans, R., Cameron, S.E., Parra, J.L., Jones, P.G., Jarvis, A., 2005. Very high resolution
interpolated climate surfaces for global land areas. International Journal of Climatology 25, 1965-
1978.
ACC
EPTE
D M
ANU
SCR
IPT
ACCEPTED MANUSCRIPT
28
Holmgren, K., Lee-Thorp, J.A., Cooper, G.R.J., Lundblad, K., Partridge, T.C., Scott, L., Sithaldeen,
R., Talma, A.S., Tyson, P.D., 2003. Persistent millennial-scale climatic variability over the past
25,000 years in Southern Africa. Quaternary Science Reviews 22, 2311-2326.
Johnson, T.C., Brown, E.T., McManus, J., Barry, S., Barker, P., Gasse, F., 2002. A high-resolution
paleoclimate record spanning the past 25,000 years in southern East Africa. Science 296, 113-132.
Kulongoski, J.T., Hilton, D.R., 2004. Climate variability in the Botswana Kalahari from the late
Pleistocene to the present day. Geophysical Research Letters 31.
Klotz, S., Guiot, J., Mosbrugger, V., 2003. Continental European Eemian and early Würmian climate
evolution: comparing signals using different quantitative reconstruction approaches based on pollen.
Global and Planetary Change 36, 277-294.
Kühl, N., Gebhardt, C., Litt, T., Hense, A., 2002. Probability density functions as botanical-
climatological transfer functions for climate reconstruction. Quaternary Research 58, 381-392.
Kulongoski, J.T., Hilton, D.R., 2004. Climate variability in the Botswana Kalahari from the late
Pleistocene to the present day. Geophysical Research Letters 31.
Kutzbach, J.E., 1981. Monsoon climate of the early Holocene: climate experiment with the Earth's
orbital parameters for 9000 years ago. Science 214, 59-61.
Kutzbach, J.E., Street-Perrott, F.A., 1985. Milankovitch forcing of fluctuations in the level of tropical
lakes from 18 to 0 kyr BP. Nature 317, 130-134.
Lee-Thorp, J.A., Holmgren, K., Lauritzen, S.-E., Linge, H., Moberg, A., Partridge, T.C., Stevenson,
C., Tyson, P.D., 2001. Rapid climate shifts in the southern African interior throughout the mid- to
late Holocene. Geophysical Research Letters 28, 4507-4510.
Li, J., Zeng, Q., 2002. A unified monsoon index. Geophys. Res. Lett. 29, 1274.
Liu, Z., Kutzbach, J., Otto-Bliesner, B., Shields, C., Li, L., 2003. Coupled climate simulation of the
evolution of global monsoons in the Holocene. Journal of Climate 16, 2472-2490.
Marzin, C., Braconnot, P., 2009. Variations of Indian and African monsoons induced by insolation
changes at 6 and 9.5 kyr BP. Climate Dynamics 33, 215-231.
McCormac, F.G., Hogg, A.G., Blackwell, P.G., Buck, C.E., Higham, T.F.G., Reimer, P.J., 2004.
SHCal04 Southern Hemisphere Calibration, 0-11.0 Cal Kyr BP. Radiocarbon 46, 1087-1092.
ACC
EPTE
D M
ANU
SCR
IPT
ACCEPTED MANUSCRIPT
29
Meadows, M.E., 2001. The role of Quaternary environmental change in the evolution of landscapes:
case studies from southern Africa. CATENA 42, 39-57.
Mucina, L., Rutherford, M.C., 2006. The vegetation of South Africa, Lesotho and Swaziland.
Strelitzia 19. South African National Biodiversity Institute, Pretoria.
Norström, E., Scott, L., Partridge, T.C., Risberg, J., Holmgren, K., 2009. Reconstruction of
environmental and climate changes at Braamhoek wetland, eastern escarpment South Africa,
during the last 16,000 years with emphasis on the Pleistocene-Holocene transition.
Palaeogeography, Palaeoclimatology, Palaeoecology 271, 240-258.
Phillips, S.J., Anderson, R.P., Schapire, R.E., 2006. Maximum entropy modeling of species
geographic distributions. Ecological Modelling 190, 231-259.
Reimer, P.J., Baillie, M.G.L., Bard, E., Bayliss, A., J W Beck, J.W., Blackwell, P.G., Bronk Ramsey,
C., Buck, C.E., Burr, G.S., Edwards, R.L., Friedrich, M., Grootes, P.M., Guilderson, T.P., Hajdas,
I., Heaton, T.J., Hogg, A.G., Hughen, K.A., Kaiser, K.F., Kromer, B., McCormac, F.G., Manning,
S.W., Reimer, R.W., Richards, D.A., Southon, J.R., Talamo, S., Turney, C.S.M., van der Plicht, J.,
Weyhenmeyer, C.E., 2009. IntCal09 AND Marine09 radiocarbon calibration curves, 0-50,000
years cal BP. Radiocarbon 4, 1111-1150.
Rutherford, M.S., Westfall, R.H., 1986. Biomes of southern Africa: an objective categorization.
Memoirs of the Botanical Survey of South Africa 54, 1-98.
Rutherford, M.C., Mucina, L., Powrie, L.W., 2012. The South African National Vegetation Database:
History, development, applications, problems and future. South African Journal of Science 108.
Rutherford, M.C., Powrie, L.W., Midgley, G.F., 2003. ACKDAT: A digital spatial database of
distributions of South African plant species and species assemblages. South African Journal of
Botany 69, 99-104.
SANBI, 2003. PRECIS (National Herbarium Pretoria (PRE) Computerized Information System)
database.
Schefuß, E., Kuhlmann, H., Mollenhauer, G., Prange, M., Patzold, J., 2011. Forcing of wet phases in
southeast Africa over the past 17,000 years. Nature 480, 509-512.
ACC
EPTE
D M
ANU
SCR
IPT
ACCEPTED MANUSCRIPT
30
Scott, L., 1982. A late Quaternary pollen record from the Transvaal bushveld, South Africa.
Quaternary Research 17, 339-370.
Scott, L., 1999. Vegetation history and climate in the Savanna biome South Africa since 190,000 ka: a
comparison of pollen data from the Tswaing Crater (the Pretoria Saltpan) and Wonderkrater.
Quaternary International 57-8, 215-223.
Scott, L., Holmgren, K., Talma, A.S., Woodborne, S., Vogel, J.C., 2003. Age interpretation of the
Wonderkrater spring sediments and vegetation change in the Savanna Biome, Limpopo province,
South Africa. South African Journal of Science 99, 484-488.
Scott, L., Neumann, F.H., Brook, G.A., Bousman, C.B., Norström, E., Metwally, A.A., 2012.
Terrestrial fossil-pollen evidence of climate change during the last 26 thousand years in southern
Africa. Quaternary Science Reviews 32, 100-118.
Scott, L., Thackeray, J.F., 1987. Mulivariate analysis of Late Pleistocene and Holocene pollen spectra
from Wonderkrater, Transvaal, South Africa. South African Journal of Science 83, 93-98.
Sinninghe-Damsté, J.S., Verschuren, D., Ossebaar, J., Blokker, J., van Houten, R., van der Meer,
M.T.J., Plessen, B., Schouten, S., 2011. A 25,000-year record of climate-induced changes in
lowland vegetation of eastern equatorial Africa revealed by the stable carbon-isotopic composition
of fossil plant leaf waxes. Earth and Planetary Science Letters 302, 236-246.
Smith, G.F., Van Wyk, B., 2008. Aloes in southern Africa. Struik Publishers, Cape Town.
Sonzogni, C., Bard, E., Rostek, F., 1998. Tropical sea-surface temperatures during the last glacial
period: a view based on alkenones in Indian Ocean sediments. Quaternary Science Reviews 17,
1185-1201.
Stager, J.C., Ryves, D.B., Chase, B.M., Pausata, F.S.R., 2011. Catastrophic drought in the Afro-Asian
monsoon region during Heinrich event 1. Science 331, 1299-1302.
Stute, M., Talma, A.S., 1998. Glacial temperatures and moisture transport regimes reconstructed from
noble gas and δ18
O, Stampriet aquifer, Namibia, Isotope Techniques in the Study of Past and
Current Environmental Changes in the Hydrosphere and the Atmosphere. IAEA Vienna
Symposium 1997, Vienna, pp. 307-328.
Swets, J., 1988. Measuring the accuracy of diagnostic systems. Science 240, 1285-1293.

ACC
EPTE
D M
ANU
SCR
IPT
ACCEPTED MANUSCRIPT
31
Talma, A.S., Vogel, J.C., 1992. Late Quaternary paleotemperatures derived from a speleothem from
Cango Caves, Cape Province, South Africa. Quaternary Research 37, 203-213.
Thackeray, J.F., 1999. Calibration of temperature indices from a late Quaternary terrestrial sequence
at Wonderkrater, South Africa. Quaternary International 57-8, 225-227.
Thomas, D.S.G., Bailey, R., Shaw, P.A., Durcan, J.A., Singarayer, J.S., 2009. Late Quaternary
highstands at Lake Chilwa, Malawi: frequency, timing and possible forcing mechanisms in the last
44 ka. Quaternary Science Reviews 28, 526-539.
Tierney, J.E., Russell, J.M., Huang, Y., Damste, J.S.S., Hopmans, E.C., Cohen, A.S., 2008. Northern
Hemisphere controls on tropical southeast African climate during the past 60,000 years. Science
322, 252-255.
Tyson, P.D., Preston-Whyte, R.A., 2000. The Weather and Climate of Southern Africa. Oxford
University Press, Cape Town.
ACC
EPTE
D M
ANU
SCR
IPT
ACCEPTED MANUSCRIPT
32
Table 1. Summary of the modelling results. A triangle indicates that the pollen-type was used in the
reconstruction of the climatic variable, a black triangle means that pollen-type require high values of
the considered variable and a white triangle indicates low values.
Fig.1. Map of the major atmospheric and oceanic circulation systems and convergences zones (the
Intertropical Convergence Zone (ITCZ), the Congo Air Boundary (CAB) and the Angola-Benguela
Front (ABF)), rainfall seasonality (shading) and the primary sites considered: (1) Wonderkrater (Scott
et al, 2003), (2) Cold Air Cave (Holmgren et al., 2003; Lee-Thorp et al., 2001), (3) MD96-2048
marine core (Sonzogni et al., 1998, Bard et al., 1997), (4) MD79257 marine core, Limpopo River
(Dupont et al., 2011), (5) GeoB9307-3 marine core (Schefuss et al., 2011), (6) Lake Malawi
(Castañeda et al., 2007), (7) Lake Tanganyika (Tierney et al., 2008), (8) Lake Challa (Sinninghe-
Damsté et al., 2011).
Fig.2. Biomes of southern Africa with the sites of (1) Wonderkrater (Scott et al., 2003), (2) Cold Air
Cave (Holmgren et al., 2003), (3) MD96-2048 marine core (Sonzogni et al., 1998, Bard et al., 1997)
shown.
Fig.3. Maps of climatic variables (temperatures during the warmest quarter (TWarmQ), temperatures
during the coldest quarter (TCQ), precipitations durig the driest quarter (PDryQ) and precipitations
during the wettest quarter (PWetQ)) reconstructed for this study.
Fig.4. Age-depth model calculated from radiocarbon ages selected by Scott et al. (2003)
Fig.5. Outline of the species selection method applied in this paper.
Fig.6. Effect of the weighting method applied on the distribution of Ericaceae as function of
TWarmQ. Frequency reflect the number of pixels, grey bars show the distribution of TWarmQ over
the study area, black bars show the occurrences of Ericaceae, solid line represent the unweighted pdf
of Ericaceae and the dashed line represent the pdf after the weighting method.
Fig.7. (a) PWetQ requirements variability of Capparaceae. Thick black solid line: pdfs of the
whole dataset of Capparaceae (vertical exaggeration x10), blue lines: pdfs of species
requiring wet environment, yelow lines: pdfs of species requiring dry environment. (b)
Species selection method for Capparaceae. Dotted line: pdf of the whole dataset of
Capparaceae, shaded area: resulting pdf of the assemblage during the early Holocene,
dashed line: pdf of Capparaceae after species selection method (species with the probability
to be found in the assemblage is lower than 0.2 are removed).
Fig.8. Comparison between the reconstructed TwarmQ (a), PWetQ (c), without the species selection
method and the reconstructed TWarmQ (b), PWetQ (d), with the species selection method. The values
for modern TWarmQ and PWetQ are indicated with a dashed line. Grey shaded area indicates 1-
sigma uncertainties.
Fig.9. Comparison between the reconstructed temperatures during the coldest quarter (b),
temperatures during the warmest quarter (c), precipitation during the driest quarter (e) and the
precipitation during the wettest quarter (f) from Wonderkrater in this paper with the PCA-derived
temperature (a) and humidity (d) indices from Scott et al., (2003). Selected taxa from the original
pollen diagram (g) from Scott et al., 2003 is also shown along with and the calculated modern climate
ACC
EPTE
D M
ANU
SCR
IPT
ACCEPTED MANUSCRIPT
33
values ,dashed line (Hijmans et al., 2005) in b, c, e and f. Grey shaded area indicates 1-sigma
uncertainties.
Fig.10. Comparison of Wonderkrater reconstructions (smoothed) for temperatures during the warmest
quarter (h), temperatures during the coldest quarter (i), precipitation during the wettest quarter (j) with
records from the GRIP ice core from Greenland (a; Shackleton et al., 2004), Lake Challa (b;
Sinninghe-Damsté et al., 2011), Lake Malawi (c; Castañeda et al., 2007), the Zambezi Basin (d;
Schefuß et al., 2011), Lake Tanganyika (e; Tierney et al., 2008), Cold Air Cave (f; Lee-Thorp et al.,
2001), Mozambique Channel (g; Sonzogni et al., 1998, Bard et al., 1997), the humidity index
reconstruction at Wonderkrater (k; Scott et al., 2003) and the insolation curves (l,m; Berger & Loutre,
1991).

ACC
EPTE
D M
ANU
SCR
IPT
ACCEPTED MANUSCRIPT
34
Fig. 1

ACC
EPTE
D M
ANU
SCR
IPT
ACCEPTED MANUSCRIPT
35
Fig. 2

ACC
EPTE
D M
ANU
SCR
IPT
ACCEPTED MANUSCRIPT
36
Fig. 3
ACC
EPTE
D M
ANU
SCR
IPT
ACCEPTED MANUSCRIPT
37
Fig. 4
ACC
EPTE
D M
ANU
SCR
IPT
ACCEPTED MANUSCRIPT
38
Fig. 5
ACC
EPTE
D M
ANU
SCR
IPT
ACCEPTED MANUSCRIPT
39
Fig. 6
ACC
EPTE
D M
ANU
SCR
IPT
ACCEPTED MANUSCRIPT
40
Fig. 7
ACC
EPTE
D M
ANU
SCR
IPT
ACCEPTED MANUSCRIPT
41
Fig. 8

ACC
EPTE
D M
ANU
SCR
IPT
ACCEPTED MANUSCRIPT
42
Fig. 9
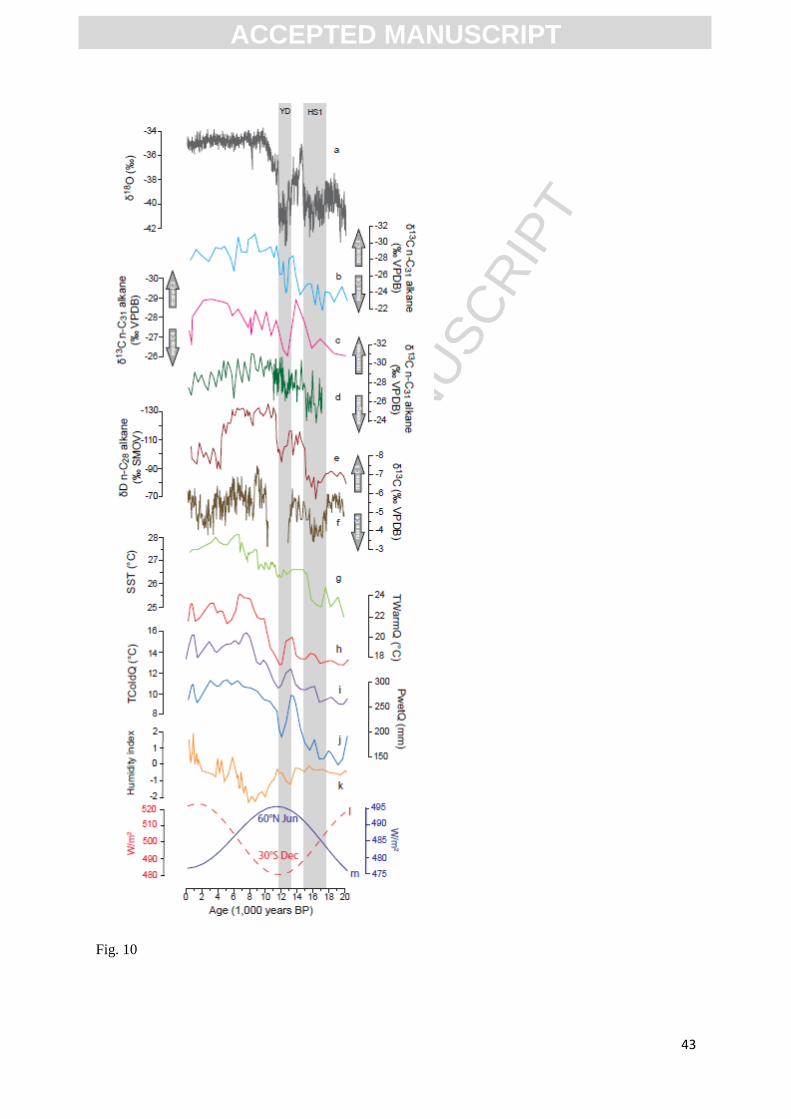
ACC
EPTE
D M
ANU
SCR
IPT
ACCEPTED MANUSCRIPT
43
Fig. 10
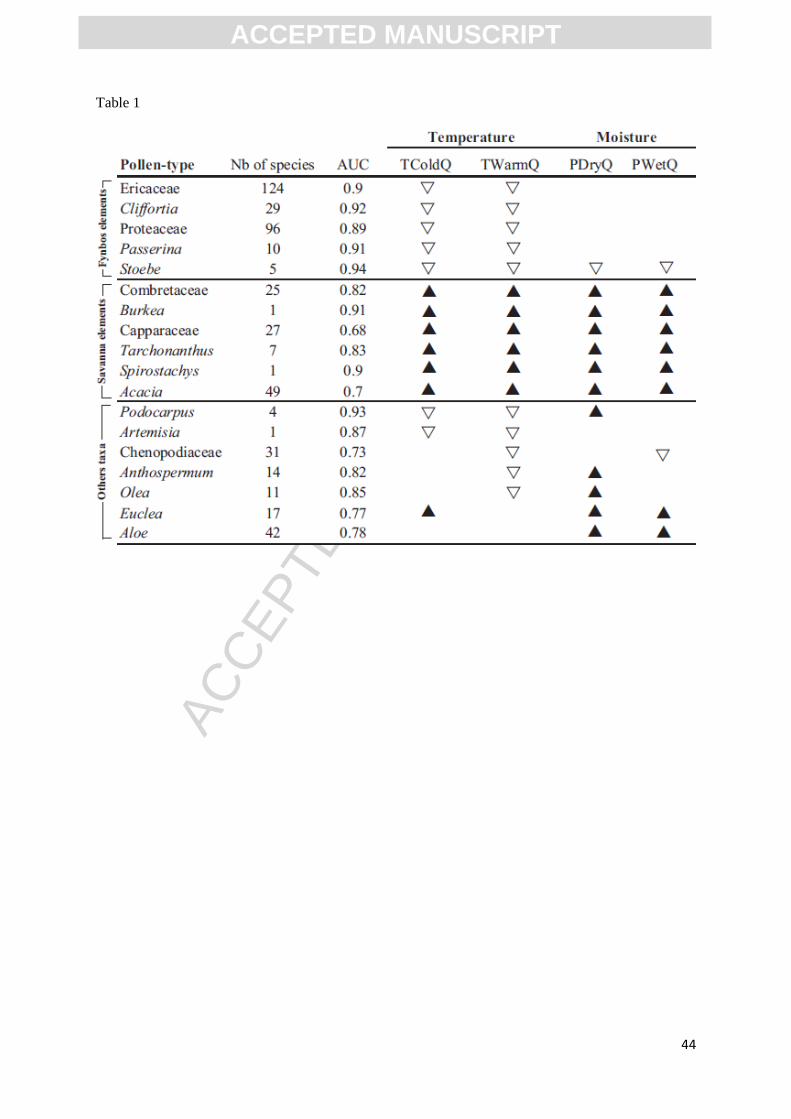
ACC
EPTE
D M
ANU
SCR
IPT
ACCEPTED MANUSCRIPT
44
Table 1
ACC
EPTE
D M
ANU
SCR
IPT
ACCEPTED MANUSCRIPT
45
Highlights
Quantitative estimates of climate at a key South Africa site over the past 20 kyr
Reconstructed trends show strong link with regional sea-surface temperatures
Reconstructions indicate interhemispheric synchrony in the African tropics
Results do not support hypothesis of precessional forcing of tropical African climate
Highlights a promising technique for analyzing palaeobotanical data in the region
Related Documents