Archaeometry 51, 3 (2009) 366– 382 doi: 10.1111/j.1475-4754.2008.00404.x *Received 12 December 2007; accepted 7 February 2008. © University of Oxford, 2008 Blackwell Publishing Ltd Oxford, UK ARCH Archaeometry 0003-813X 1475-4754 © University of Oxford, 2008 XXX ORIGINAL ARTICLES Lithic use-wear: surface profile measurements and fractal analysis W. J. Stemp et al. *Received 12 December 2007; accepted 7 February 2008. QUANTIFICATION AND DISCRIMINATION OF LITHIC USE-WEAR: SURFACE PROFILE MEASUREMENTS AND LENGTH-SCALE FRACTAL ANALYSIS* W. J. STEMP, 1 B. E. CHILDS, 2 S. VIONNET 3 and C. A. BROWN 2 1 Surface Metrology and Archaeological Research Technologies Project, Department of Sociology and Anthropology, Keene State College, 229 Main Street, Keene, NH 03435-3400, USA 2 Surface Metrology Laboratory, Mechanical Engineering Department, Worcester Polytechnic Institute, 100 Institute Road, Worcester, MA 01609-2280, USA 3 Ecole Polytechnique Fédérale de Lausanne (EPFL), Laboratory for Metallurgical Chemistry (LMCH), CH-1015 Lausanne, Switzerland This experimental programme employs length-scale analysis of measured profiles to quantitatively discriminate the surface textures of stone flakes manufactured from East Anglian chalk flint used on four contact materials (shell, wood, dry hide and soaked antler). It presents a method for evaluating texture characterization parameters based on their ability to discriminate wear types, and to determine a level of confidence to the discrimination, using the F-test. The results of this experimental work demonstrate that relative lengths, over certain scale ranges, can discriminate the stone tool surface wear profiles produced by the different contact materials. KEYWORDS: STONE TOOLS, LITHIC, USE-WEAR, LASER PROFILOMETRY, FRACTALS, RELATIVE LENGTH, LENGTH-SCALE, FLINT, F-TEST © University of Oxford, 2008 INTRODUCTION In 1982, J. V. Dumont published one of the first attempts to quantitatively document use-wear on stone tool surfaces based on a technique for surface measurement called interferometry. Although the research never progressed to the point of actually quantifying interference images of stone tool polishes, the article in question initiated numerous other attempts to quantify lithic use-wear. Since Dumont’s first foray into the quantification of lithic use-wear, many others have attempted to develop a method to successfully document the damage related to use on stone tools. Use-wear analysts have experimented with methods to record and dis- tinguish wear patterns on stone tool surfaces based on contact with different raw materials, such as antler, bone, hide, meat, stone and wood, among others. The methods must be capable of objectively producing quantitative characterizations of the wear patterns on the stone tool surfaces in a reproducible fashion. Presently, a variety of methods has been tested and they continue to be refined, including approaches based on profilometry (Akoshima 1981; Knutsson in Grace 1989), image analysis and interferometry (Dumont 1982), optical interferometry (vertical-scanning interferometer) (Anderson et al. 2006), image analysis and fractal geometry (Rees et al. 1991; see Russ 1993, 1994), various other image analysis methods (Grace et al. 1985; Beyries et al. 1988; Knutsson 1988; Knutsson et al. 1988; Grace 1989, 1993; Vila and Gallart 1993; Bietti 1996; Barceló et al. 2001; Piojan et al. 2002; Toselli et al. 2002; Adán et al. 2003; Gonzalez-Urquillo and Ibañez-Estevez 2003; Lerner 2007), atomic force microscopy

Welcome message from author
This document is posted to help you gain knowledge. Please leave a comment to let me know what you think about it! Share it to your friends and learn new things together.
Transcript
Archaeometry
51
, 3 (2009) 366–382 doi: 10.1111/j.1475-4754.2008.00404.x
*Received 12 December 2007; accepted 7 February 2008.© University of Oxford, 2008
Blackwell Publishing LtdOxford, UKARCHArchaeometry0003-813X1475-4754© University of Oxford, 2008XXX
ORIGINAL ARTICLES
Lithic use-wear: surface profile measurements and fractal analysisW. J. Stemp
et al.
*Received 12 December 2007; accepted 7 February 2008.
QUANTIFICATION AND DISCRIMINATION OF LITHIC USE-WEAR: SURFACE PROFILE MEASUREMENTS AND
LENGTH-SCALE FRACTAL ANALYSIS*
W. J. STEMP,
1
B. E. CHILDS,
2
S. VIONNET
3
and C. A. BROWN
2
1
Surface Metrology and Archaeological Research Technologies Project, Department of Sociology and Anthropology, Keene State College, 229 Main Street, Keene, NH 03435-3400, USA
2
Surface Metrology Laboratory, Mechanical Engineering Department, Worcester Polytechnic Institute, 100 Institute Road, Worcester, MA 01609-2280, USA
3
Ecole Polytechnique Fédérale de Lausanne (EPFL), Laboratory for Metallurgical Chemistry (LMCH), CH-1015 Lausanne, Switzerland
This experimental programme employs length-scale analysis of measured profiles toquantitatively discriminate the surface textures of stone flakes manufactured from EastAnglian chalk flint used on four contact materials (shell, wood, dry hide and soaked antler).It presents a method for evaluating texture characterization parameters based on theirability to discriminate wear types, and to determine a level of confidence to thediscrimination, using the
F
-test. The results of this experimental work demonstrate thatrelative lengths, over certain scale ranges, can discriminate the stone tool surface wearprofiles produced by the different contact materials.
KEYWORDS
: STONE TOOLS, LITHIC, USE-WEAR, LASER PROFILOMETRY, FRACTALS, RELATIVE LENGTH, LENGTH-SCALE, FLINT,
F
-TEST
© University of Oxford, 2008
INTRODUCTION
In 1982, J. V. Dumont published one of the first attempts to quantitatively document use-wearon stone tool surfaces based on a technique for surface measurement called interferometry.Although the research never progressed to the point of actually quantifying interferenceimages of stone tool polishes, the article in question initiated numerous other attempts toquantify lithic use-wear. Since Dumont’s first foray into the quantification of lithic use-wear,many others have attempted to develop a method to successfully document the damage relatedto use on stone tools. Use-wear analysts have experimented with methods to record and dis-tinguish wear patterns on stone tool surfaces based on contact with different raw materials,such as antler, bone, hide, meat, stone and wood, among others. The methods must be capableof objectively producing quantitative characterizations of the wear patterns on the stone toolsurfaces in a reproducible fashion. Presently, a variety of methods has been tested and theycontinue to be refined, including approaches based on profilometry (Akoshima 1981; Knutssonin Grace 1989), image analysis and interferometry (Dumont 1982), optical interferometry(vertical-scanning interferometer) (Anderson
et al.
2006), image analysis and fractal geometry(Rees
et al.
1991; see Russ 1993, 1994), various other image analysis methods (Grace
et al.
1985; Beyries
et al.
1988; Knutsson 1988; Knutsson
et al.
1988; Grace 1989, 1993; Vila andGallart 1993; Bietti 1996; Barceló
et al.
2001; Piojan
et al.
2002; Toselli
et al.
2002; Adán
et al.
2003; Gonzalez-Urquillo and Ibañez-Estevez 2003; Lerner 2007), atomic force microscopy
Lithic use-wear: surface profile measurements and fractal analysis
367
© University of Oxford, 2008,
Archaeometry
51
, 3 (2009) 366–382
(Kimball
et al.
1995) and laser profilometry and fractal geometry (Stemp and Stemp 2001,2003; Stemp
et al.
2006). Worthy of mention are some techniques for the characterization ofchemical elements from contact materials embedded in used stone tool surfaces; however, theydo not document wear
per se
(Andersen and Whitlow 1983; Christensen
et al.
1992; Christensen
1998;
T
mit
et al.
1998, 1999; Evans and Donahue 2005).
RESEARCH OBJECTIVE
The objective of this research is to demonstrate a method to discriminate the uses of wornstone tools according to contact material type, based on the analysis and mathematicalcharacterization of measured profiles. The experiment involved knapping experimental stoneflakes, using them on different contact materials, and then measuring the surface roughness, ortexture, of the stone tools using a laser profilometer. Scale-sensitive fractal analysis by length-scale (ASME 2002) of the measured surface profiles was tested for its ability to discriminatethe worn tools based on the contact materials upon which they were used.
METHODS
Experimental stone tools and contact materials
For this experiment, four unretouched flake tools knapped from a fine-grained East Anglianchalk flint core were each used intensively for 20 minutes on one of four different contactmaterials (queen conch shell, sugar maple wood, soaked white-tailed deer antler and dry cowhide). With the exception of the flint flake used to scrape dry hide, all other contact materialswere sawn using the tools. It is acknowledged that motion type plays a role in the creation andvisual identification of use-wear polishes on stone tools (see Keeley 1980; Moss 1983;Vaughan 1985). Although incorporating a tool used for scraping introduced another variablein this experiment, the assumption was that this experimental method for the descriptivequantification of stone tool surface textures should be able to distinguish the hide-scrapingtool from the others. If it could not, then this would raise further questions concerning theeffects of motion and contact material on the production of wear.
Cleaning procedures
Following use, all of the flint tools were sprayed and washed in hot water with a mild, grit-free,liquid detergent to remove the contact debris adhering to their surfaces. The tools were thenplaced in dishes of warm 15% HCl solution for 15 min, and subsequently warm water againto remove the acid and any debris still remaining on the tools. The flakes were inspectedmicroscopically. No flakes required further cleaning of the used and unused surfaces.
Microscopic identification of use-wear on experimental stone tool surfaces
Micrographs of the used tool surfaces were taken using a metallographic microscope (UnitronMS-2BD) equipped with a digital microscope camera (Steindorff 1.3 MPX DCM-130) at 200
×
magnification to observe each tool surface’s wear pattern. This was used to create a visualrecord of the individual tool surfaces for comparison with the line scan measurement data. Themicrographs shown in Figures 1–4 indicate that there are real, visible differences between the
368
W. J. Stemp
et al.
© University of Oxford, 2008,
Archaeometry
51
, 3 (2009) 366–382
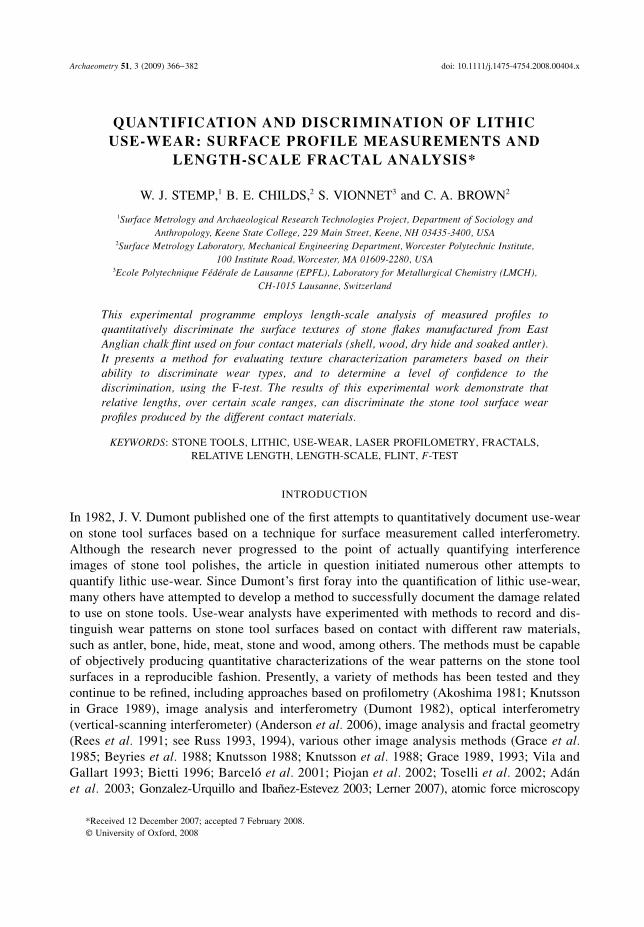
Figure 1 Sawing queen conch shell (200× magnification). Note that the photograph was taken with a polarizing filter due to the coloration of the raw material.
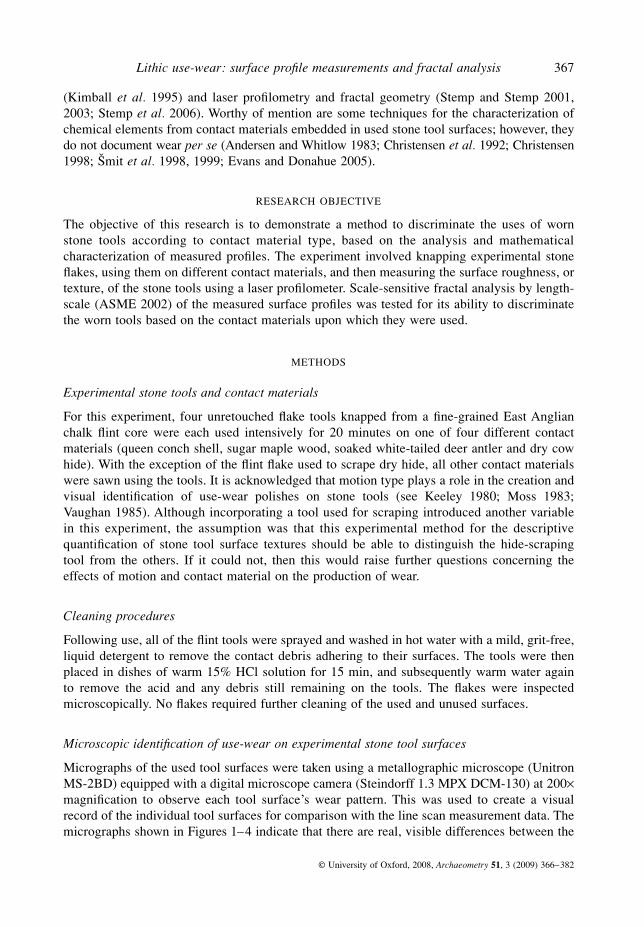
Figure 2 Sawing wood (200× magnification). Note that the photograph was taken with a polarizing filter due to the coloration of the raw material.
Lithic use-wear: surface profile measurements and fractal analysis
369
© University of Oxford, 2008,
Archaeometry
51
, 3 (2009) 366–382
wear patterns on the tools caused by the contact materials. These wear patterns can bedescribed using terminology familiar to traditional high-power microscopy lithic use-wearanalysts (i.e., Keeley 1980; Moss 1983; Vaughan 1985); however, such descriptions aredependent upon the observer. The use-wear on the lithic flake used to saw queen conch shell
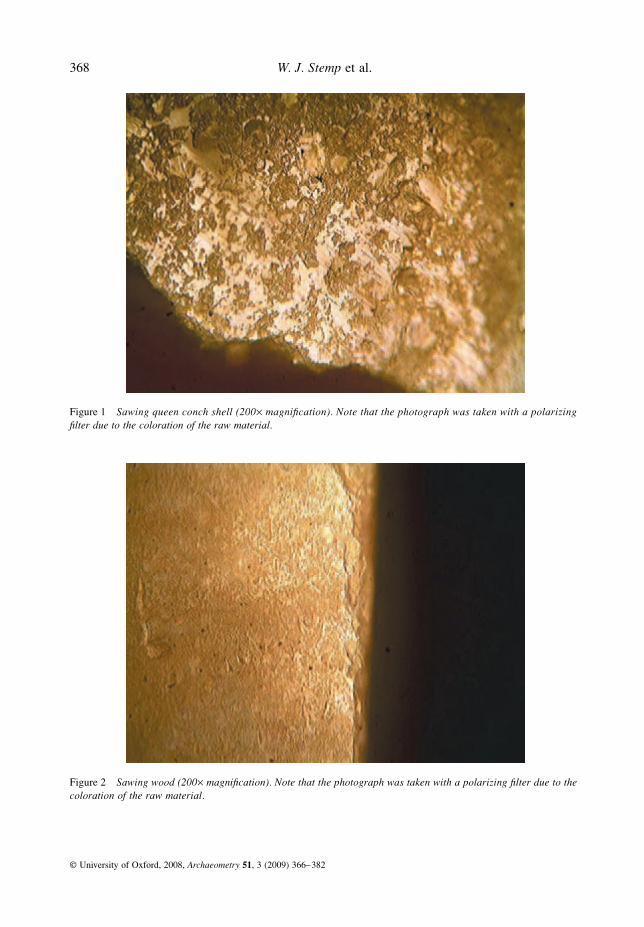
Figure 3 Sawing soaked antler (200× magnification).
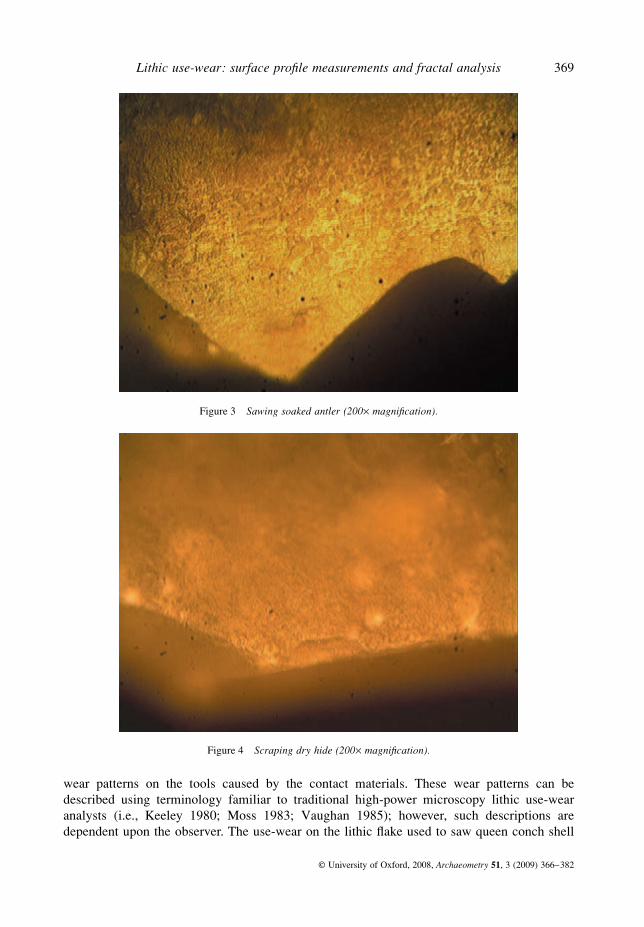
Figure 4 Scraping dry hide (200× magnification).
370
W. J. Stemp
et al.
© University of Oxford, 2008,
Archaeometry
51
, 3 (2009) 366–382
is a striated polish that is bright and quite flat. It is primarily restricted to the areas of highermicrotopography (i.e., asperities) on the flake surface, as harder contact materials tend to shearoff the tops of higher microtopography (Fig. 1). Figure 2 is a micrograph of the flake used tosaw wood. The wood polish on the edge of this flake is bright and ‘liquid’-looking. In termsof distribution, it is reticular with the tops of the microtopography, possessing a ‘domed’polish that gradually descends down to the lower microtopography. There are no obviousstriations in this polish, likely, in part, due to the moisture content of the wood. The flake usedto saw soaked white-tailed deer antler produced a moderately bright polish that is well developedon the higher microtopography, creating a slightly pitted or roughened appearance. The polishis reticular in distribution in more developed regions. Almost no striations occur in the polishzone (Fig. 3). The scraping of dry hide produced a rather diffuse polish that is matte inappearance, with a micropitted or ‘rugose’ texture and a mildly rounded contact edge.Although no well-defined striations are observable, some shallow linear features indicate thedirection of use (Fig. 4).
Although these micrographs only show the first few hundreds of micrometres, they alsosuggest that there are real differences in the regions described as near and far from the edge ofthe tool, which has a boundary 1 mm from the edge (see below).
Laser profilometry and surface profile measurements
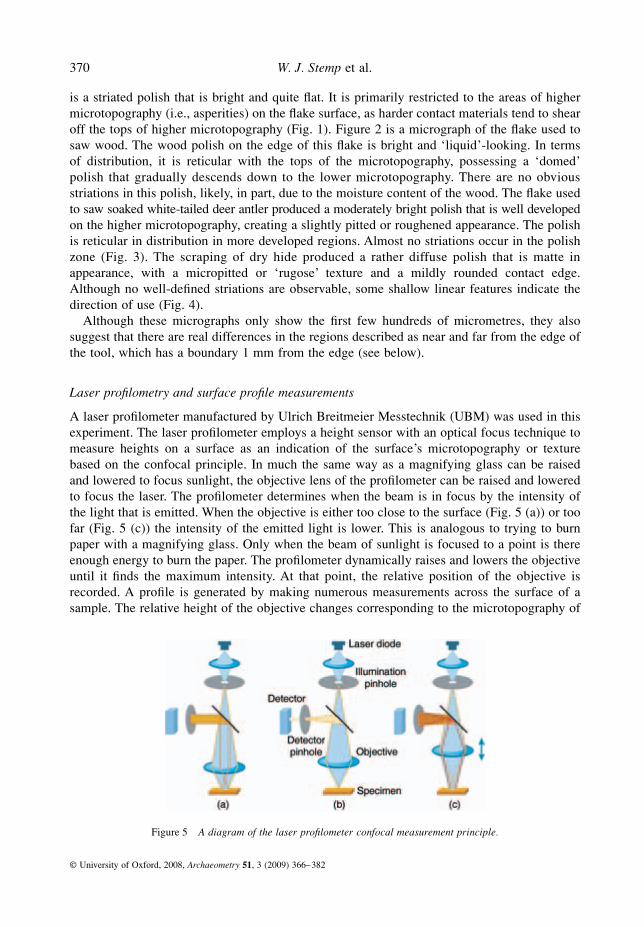
A laser profilometer manufactured by Ulrich Breitmeier Messtechnik (UBM) was used in thisexperiment. The laser profilometer employs a height sensor with an optical focus technique tomeasure heights on a surface as an indication of the surface’s microtopography or texturebased on the confocal principle. In much the same way as a magnifying glass can be raisedand lowered to focus sunlight, the objective lens of the profilometer can be raised and loweredto focus the laser. The profilometer determines when the beam is in focus by the intensity ofthe light that is emitted. When the objective is either too close to the surface (Fig. 5 (a)) or toofar (Fig. 5 (c)) the intensity of the emitted light is lower. This is analogous to trying to burnpaper with a magnifying glass. Only when the beam of sunlight is focused to a point is thereenough energy to burn the paper. The profilometer dynamically raises and lowers the objectiveuntil it finds the maximum intensity. At that point, the relative position of the objective isrecorded. A profile is generated by making numerous measurements across the surface of asample. The relative height of the objective changes corresponding to the microtopography of
Figure 5 A diagram of the laser profilometer confocal measurement principle.
Lithic use-wear: surface profile measurements and fractal analysis
371
© University of Oxford, 2008,
Archaeometry
51
, 3 (2009) 366–382
the sample’s surface. The profile will provide an accurate two-dimensional measurement ofthe changing surface elevation of the sample over a specified horizontal distance.
In this experiment, two different locations along the used edges of each of the four toolsused on the contact materials were measured using the profilometer. Measurements were madeat an acquisition rate of 100 points per second, or 1000 points per millimetre, corresponding toa sampling interval of 1
μ
m. A more detailed description of this measurement system and its
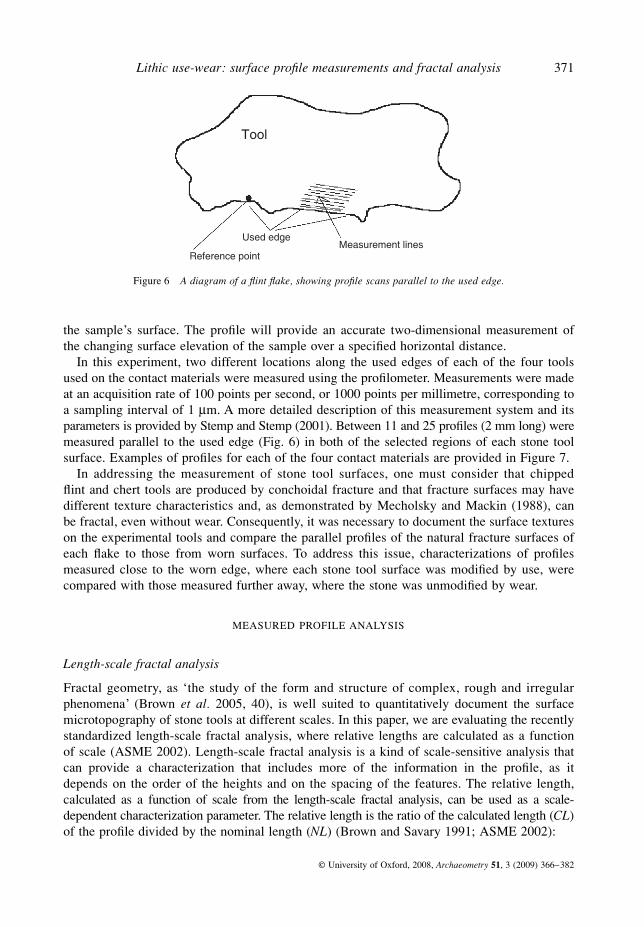
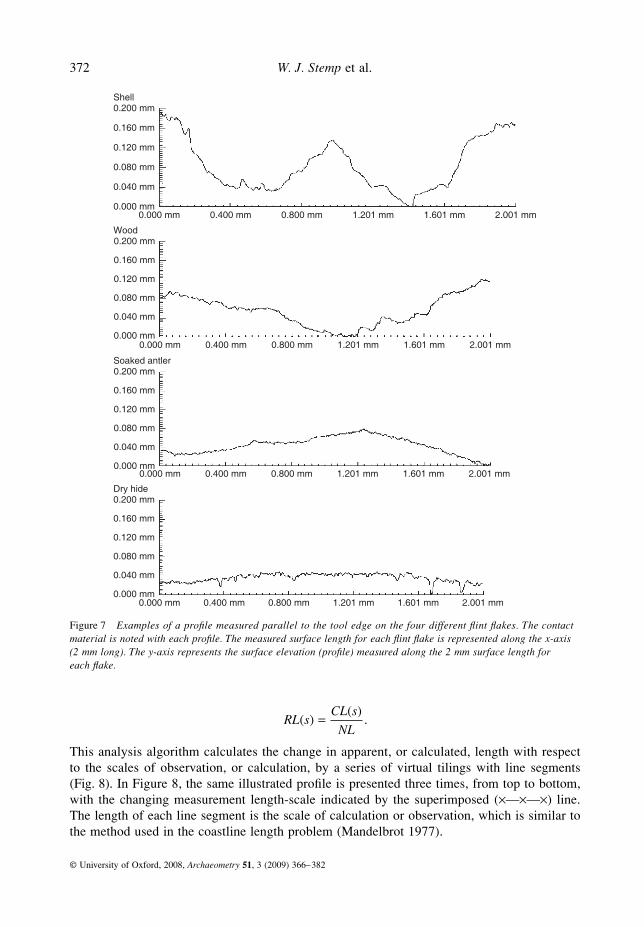
parameters is provided by Stemp and Stemp (2001). Between 11 and 25 profiles (2 mm long) weremeasured parallel to the used edge (Fig. 6) in both of the selected regions of each stone toolsurface. Examples of profiles for each of the four contact materials are provided in Figure 7.
In addressing the measurement of stone tool surfaces, one must consider that chippedflint and chert tools are produced by conchoidal fracture and that fracture surfaces may havedifferent texture characteristics and, as demonstrated by Mecholsky and Mackin (1988), canbe fractal, even without wear. Consequently, it was necessary to document the surface textureson the experimental tools and compare the parallel profiles of the natural fracture surfaces ofeach flake to those from worn surfaces. To address this issue, characterizations of profilesmeasured close to the worn edge, where each stone tool surface was modified by use, werecompared with those measured further away, where the stone was unmodified by wear.
MEASURED PROFILE ANALYSIS
Length-scale fractal analysis
Fractal geometry, as ‘the study of the form and structure of complex, rough and irregularphenomena’ (Brown
et al.
2005, 40), is well suited to quantitatively document the surfacemicrotopography of stone tools at different scales. In this paper, we are evaluating the recentlystandardized length-scale fractal analysis, where relative lengths are calculated as a functionof scale (ASME 2002). Length-scale fractal analysis is a kind of scale-sensitive analysis thatcan provide a characterization that includes more of the information in the profile, as itdepends on the order of the heights and on the spacing of the features. The relative length,calculated as a function of scale from the length-scale fractal analysis, can be used as a scale-dependent characterization parameter. The relative length is the ratio of the calculated length (
CL
)of the profile divided by the nominal length (
NL
) (Brown and Savary 1991; ASME 2002):
Figure 6 A diagram of a flint flake, showing profile scans parallel to the used edge.
372
W. J. Stemp
et al.
© University of Oxford, 2008,
Archaeometry
51
, 3 (2009) 366–382
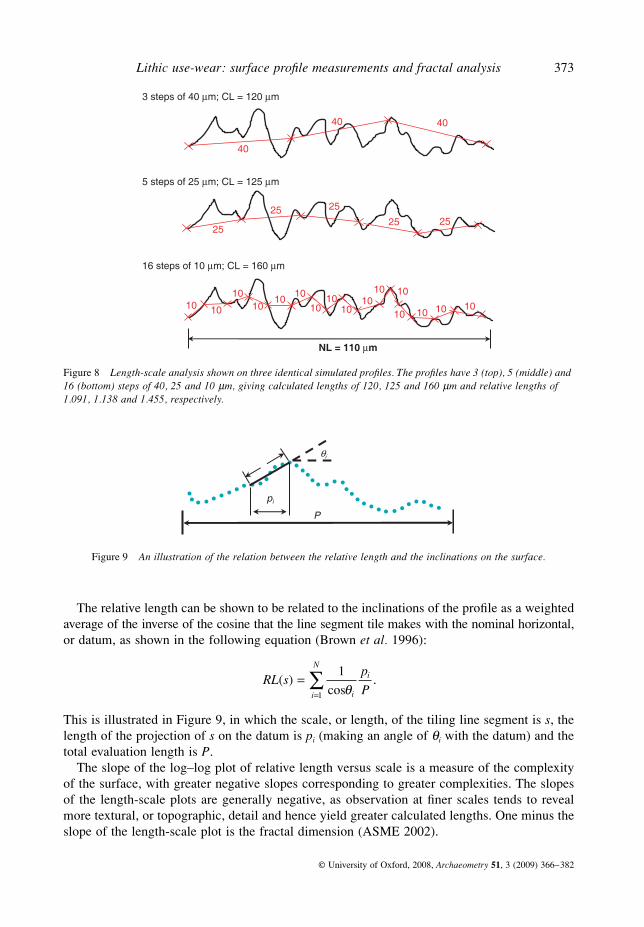
This analysis algorithm calculates the change in apparent, or calculated, length with respectto the scales of observation, or calculation, by a series of virtual tilings with line segments(Fig. 8). In Figure 8, the same illustrated profile is presented three times, from top to bottom,with the changing measurement length-scale indicated by the superimposed (
×
—
×
—
×
) line.The length of each line segment is the scale of calculation or observation, which is similar tothe method used in the coastline length problem (Mandelbrot 1977).
RL sCL s
NL( )
( ).=
Figure 7 Examples of a profile measured parallel to the tool edge on the four different flint flakes. The contact material is noted with each profile. The measured surface length for each flint flake is represented along the x-axis (2 mm long). The y-axis represents the surface elevation (profile) measured along the 2 mm surface length for each flake.
Lithic use-wear: surface profile measurements and fractal analysis
373
© University of Oxford, 2008,
Archaeometry
51
, 3 (2009) 366–382
The relative length can be shown to be related to the inclinations of the profile as a weightedaverage of the inverse of the cosine that the line segment tile makes with the nominal horizontal,or datum, as shown in the following equation (Brown
et al.
1996):
This is illustrated in Figure 9, in which the scale, or length, of the tiling line segment is
s
, the
length of the projection of
s
on the datum is
p
i
(making an angle of
θ
i
with the datum) and thetotal evaluation length is
P
.The slope of the log–log plot of relative length versus scale is a measure of the complexity
of the surface, with greater negative slopes corresponding to greater complexities. The slopesof the length-scale plots are generally negative, as observation at finer scales tends to revealmore textural, or topographic, detail and hence yield greater calculated lengths. One minus theslope of the length-scale plot is the fractal dimension (ASME 2002).
Figure 8 Length-scale analysis shown on three identical simulated profiles. The profiles have 3 (top), 5 (middle) and 16 (bottom) steps of 40, 25 and 10 μm, giving calculated lengths of 120, 125 and 160 μm and relative lengths of 1.091, 1.138 and 1.455, respectively.
RL sp
Pi
i
i
N
( ) cos
.==∑ 1
1 θ
Figure 9 An illustration of the relation between the relative length and the inclinations on the surface.
374
W. J. Stemp
et al.
© University of Oxford, 2008,
Archaeometry
51
, 3 (2009) 366–382
The
F
-test
The relative lengths (
RL
(
s
)), as a function of scale calculated from the profiles, can be useddirectly as characterization parameters and are subsequently compared statistically at each scaleusing the
F-test (Lipson and Seth 1973) to establish a level of confidence for the discrimination ateach scale represented in the measured profiles. Essentially, the F-test is used to determine whetherthe standard deviations from two populations can be discriminated as statistically different. It allowsfor measures of variance in multi-factor experiments to be compared based on the laws of probability,particularly when several different, independent sources of variation may be involved at once. Insuch situations, the variance demonstrated by the set of observations will be the sum of the variancesof each of the independent sources. The F-test compares the variation within each sample to thevariations between the samples. It is then possible to test the significance of each of the variations.By focusing on the mean squares of measured data, the ratio between them will be used to determinewhether the observed variation is statistically significant and to what level of confidence. Thescales where there is a high level of confidence, as indicated by the mean square ratio (MSR), arethe scales at which the tools are statistically different. The knowledge concerning scaleranges over which the surfaces are statistically different can be used to develop hypothesesof how these differences were created (e.g., by certain kinds of wear or fracture mechanisms).
The supposition that fractals (Mandelbrot 1977, 1982), and in particular scale-sensitivefractal analyses, are less dependent on the assessed profile length (length-scale) or region(area-scale) is demonstrated below. Scale-sensitive fractal analyses have been shown to becapable of discriminating, or differentiating, types of worn (Scott et al. 2005), ground (Brownand Savary 1991; Zang et al. 2002; Jordan and Brown 2006), machined (Brown et al. 1996)and fractured (Ulcickas et al. 2001) surfaces.
Variation with evaluation length and discrimination using profile characterization parameters
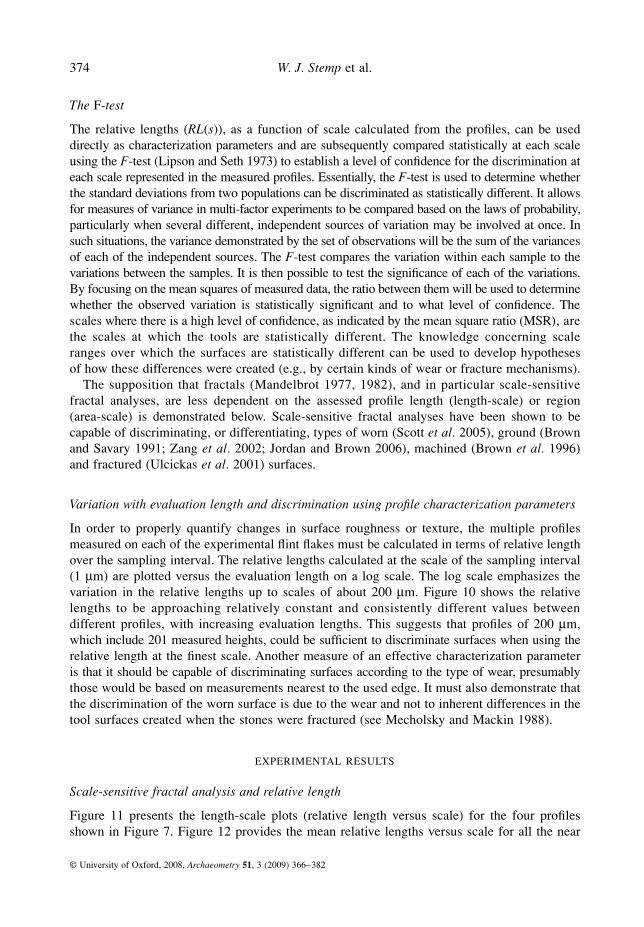
In order to properly quantify changes in surface roughness or texture, the multiple profilesmeasured on each of the experimental flint flakes must be calculated in terms of relative lengthover the sampling interval. The relative lengths calculated at the scale of the sampling interval(1 μm) are plotted versus the evaluation length on a log scale. The log scale emphasizes thevariation in the relative lengths up to scales of about 200 μm. Figure 10 shows the relativelengths to be approaching relatively constant and consistently different values betweendifferent profiles, with increasing evaluation lengths. This suggests that profiles of 200 μm,which include 201 measured heights, could be sufficient to discriminate surfaces when using therelative length at the finest scale. Another measure of an effective characterization parameteris that it should be capable of discriminating surfaces according to the type of wear, presumablythose would be based on measurements nearest to the used edge. It must also demonstrate thatthe discrimination of the worn surface is due to the wear and not to inherent differences in thetool surfaces created when the stones were fractured (see Mecholsky and Mackin 1988).
EXPERIMENTAL RESULTS
Scale-sensitive fractal analysis and relative length
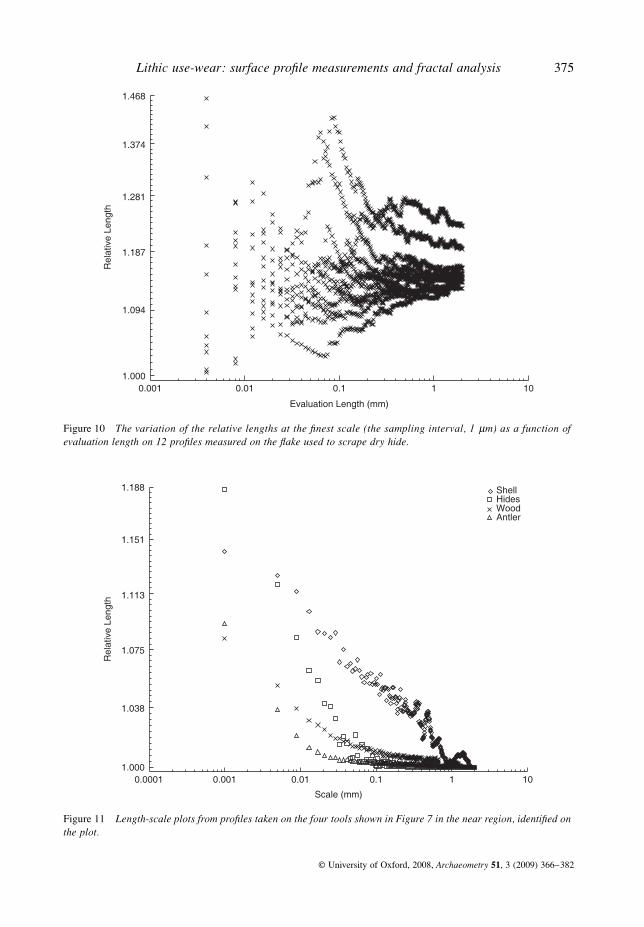
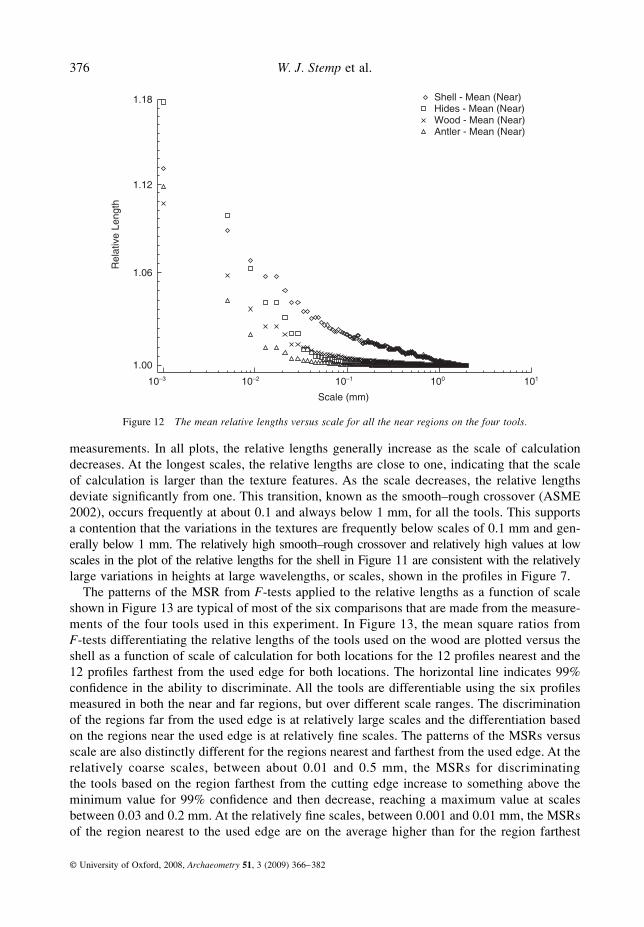
Figure 11 presents the length-scale plots (relative length versus scale) for the four profilesshown in Figure 7. Figure 12 provides the mean relative lengths versus scale for all the near
Lithic use-wear: surface profile measurements and fractal analysis 375
© University of Oxford, 2008, Archaeometry 51, 3 (2009) 366–382
Figure 10 The variation of the relative lengths at the finest scale (the sampling interval, 1 μm) as a function of evaluation length on 12 profiles measured on the flake used to scrape dry hide.
Figure 11 Length-scale plots from profiles taken on the four tools shown in Figure 7 in the near region, identified on the plot.
376 W. J. Stemp et al.
© University of Oxford, 2008, Archaeometry 51, 3 (2009) 366–382
measurements. In all plots, the relative lengths generally increase as the scale of calculationdecreases. At the longest scales, the relative lengths are close to one, indicating that the scaleof calculation is larger than the texture features. As the scale decreases, the relative lengthsdeviate significantly from one. This transition, known as the smooth–rough crossover (ASME2002), occurs frequently at about 0.1 and always below 1 mm, for all the tools. This supportsa contention that the variations in the textures are frequently below scales of 0.1 mm and gen-erally below 1 mm. The relatively high smooth–rough crossover and relatively high values at lowscales in the plot of the relative lengths for the shell in Figure 11 are consistent with the relativelylarge variations in heights at large wavelengths, or scales, shown in the profiles in Figure 7.
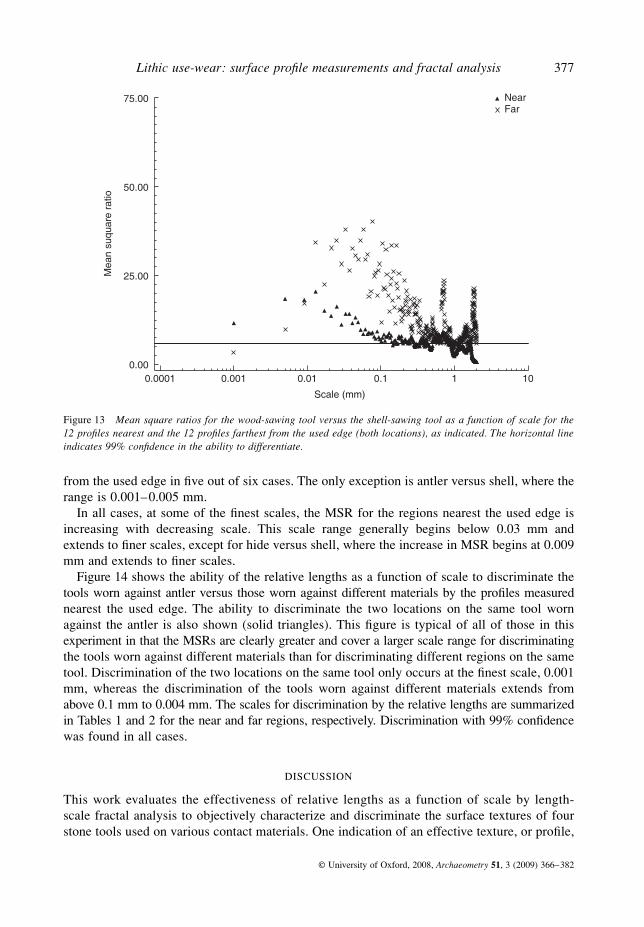
The patterns of the MSR from F-tests applied to the relative lengths as a function of scaleshown in Figure 13 are typical of most of the six comparisons that are made from the measure-ments of the four tools used in this experiment. In Figure 13, the mean square ratios fromF-tests differentiating the relative lengths of the tools used on the wood are plotted versus theshell as a function of scale of calculation for both locations for the 12 profiles nearest and the12 profiles farthest from the used edge for both locations. The horizontal line indicates 99%confidence in the ability to discriminate. All the tools are differentiable using the six profilesmeasured in both the near and far regions, but over different scale ranges. The discriminationof the regions far from the used edge is at relatively large scales and the differentiation basedon the regions near the used edge is at relatively fine scales. The patterns of the MSRs versusscale are also distinctly different for the regions nearest and farthest from the used edge. At therelatively coarse scales, between about 0.01 and 0.5 mm, the MSRs for discriminatingthe tools based on the region farthest from the cutting edge increase to something above theminimum value for 99% confidence and then decrease, reaching a maximum value at scalesbetween 0.03 and 0.2 mm. At the relatively fine scales, between 0.001 and 0.01 mm, the MSRsof the region nearest to the used edge are on the average higher than for the region farthest
Figure 12 The mean relative lengths versus scale for all the near regions on the four tools.
Lithic use-wear: surface profile measurements and fractal analysis 377
© University of Oxford, 2008, Archaeometry 51, 3 (2009) 366–382
from the used edge in five out of six cases. The only exception is antler versus shell, where therange is 0.001–0.005 mm.
In all cases, at some of the finest scales, the MSR for the regions nearest the used edge isincreasing with decreasing scale. This scale range generally begins below 0.03 mm andextends to finer scales, except for hide versus shell, where the increase in MSR begins at 0.009mm and extends to finer scales.
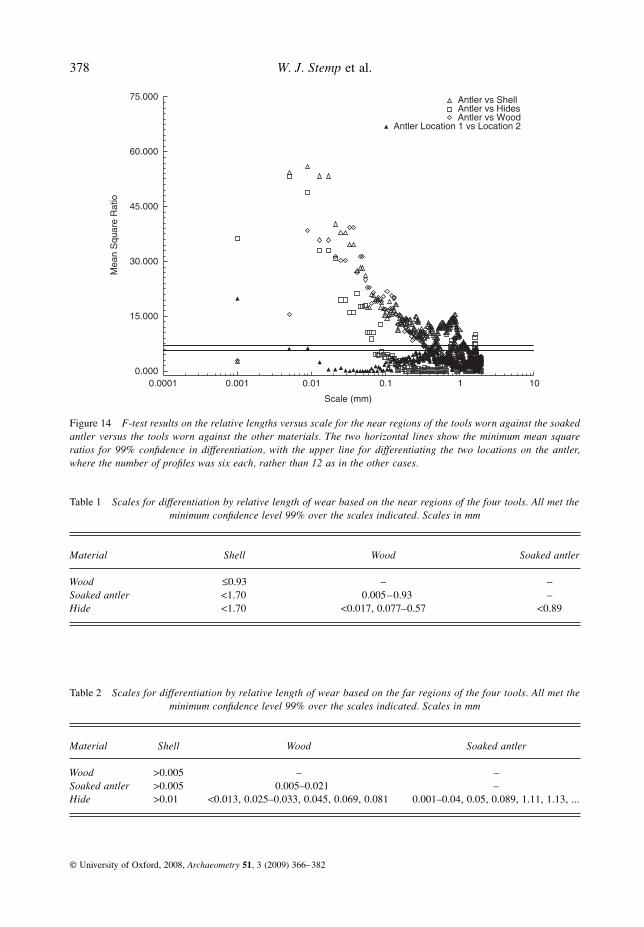
Figure 14 shows the ability of the relative lengths as a function of scale to discriminate thetools worn against antler versus those worn against different materials by the profiles measurednearest the used edge. The ability to discriminate the two locations on the same tool wornagainst the antler is also shown (solid triangles). This figure is typical of all of those in thisexperiment in that the MSRs are clearly greater and cover a larger scale range for discriminatingthe tools worn against different materials than for discriminating different regions on the sametool. Discrimination of the two locations on the same tool only occurs at the finest scale, 0.001mm, whereas the discrimination of the tools worn against different materials extends fromabove 0.1 mm to 0.004 mm. The scales for discrimination by the relative lengths are summarizedin Tables 1 and 2 for the near and far regions, respectively. Discrimination with 99% confidencewas found in all cases.
DISCUSSION
This work evaluates the effectiveness of relative lengths as a function of scale by length-scale fractal analysis to objectively characterize and discriminate the surface textures of fourstone tools used on various contact materials. One indication of an effective texture, or profile,
Figure 13 Mean square ratios for the wood-sawing tool versus the shell-sawing tool as a function of scale for the12 profiles nearest and the 12 profiles farthest from the used edge (both locations), as indicated. The horizontal lineindicates 99% confidence in the ability to differentiate.
378 W. J. Stemp et al.
© University of Oxford, 2008, Archaeometry 51, 3 (2009) 366–382
Figure 14 F-test results on the relative lengths versus scale for the near regions of the tools worn against the soakedantler versus the tools worn against the other materials. The two horizontal lines show the minimum mean squareratios for 99% confidence in differentiation, with the upper line for differentiating the two locations on the antler,where the number of profiles was six each, rather than 12 as in the other cases.
Table 1 Scales for differentiation by relative length of wear based on the near regions of the four tools. All met theminimum confidence level 99% over the scales indicated. Scales in mm
Material Shell Wood Soaked antler
Wood ≤0.93 – –Soaked antler <1.70 0.005–0.93 –Hide <1.70 <0.017, 0.077–0.57 <0.89
Table 2 Scales for differentiation by relative length of wear based on the far regions of the four tools. All met theminimum confidence level 99% over the scales indicated. Scales in mm
Material Shell Wood Soaked antler
Wood >0.005 – –Soaked antler >0.005 0.005–0.021 –Hide >0.01 <0.013, 0.025–0.033, 0.045, 0.069, 0.081 0.001–0.04, 0.05, 0.089, 1.11, 1.13, ...
Lithic use-wear: surface profile measurements and fractal analysis 379
© University of Oxford, 2008, Archaeometry 51, 3 (2009) 366–382
characterization parameter is that its values should be well behaved with respect to evaluationlengths. As with any statistical characterization of a population, some variation is expectedwith sample size, which is, in the case of a profile, the evaluation length. As the sample size,or evaluation length of a profile, is increased, the values of a well-behaved texture character-ization parameter should tend to converge to a reasonably stable value, which should differwhen the kinds of profiles (i.e., populations) are different. As shown in Figure 10, the relativelengths, calculated by length-scale fractal analysis, tend towards constant, but different, valuesfor each profile, with increasing profile length.
The relative lengths at specified scales were able to consistently discriminate the tools bythe wear contact materials. The relative lengths have information regarding scale that is importantfor discriminating the tools according to use and in relation to the near versus far regions.Tables 1 and 2 show that relative length consistently meets these criteria, discriminating thenear and far regions by the scales over which the regions are statistically different; nearregions are different at the fine scales and far regions are different at coarser scales.
The discussion of the findings relative to the ability to discriminate tools, and attributingthese statistical differences in the profile characterizations to the differences caused by wearagainst different materials, is based on the proposition that the wear influenced the texture, orroughness, of the tools differently in the regions near the worn edge than it did regions fartherfrom the edge. It is assumed that profiles measured farthest from the edge are more typical ofthe surface texture resulting from the manufacture of the tools, which is supported by themicrographs shown in Figures 1–4.
Discriminating near versus far is important to the supposition that the far regions have moreof the characteristics of the unworn surface and the near regions exhibit the results of wear.Figure 11 shows that the relative lengths have the ability to consistently discriminate the nearversus far regions. In all cases, the near regions are statistically different at finer scales and thefar regions are statistically different at the larger scales.
The wear during use appears to influence both the coarser and finer scales. However, itinfluences the finer scales, below about 0.1 mm, in a way that is characteristic of the contactmaterial, as the MSRs at the fine scales for the near regions are relatively large. At the coarserscales, the use-wear tends to influence tools so that the textures are similar, as the MSRs forthe fine scales are relatively small, especially compared to the regions farther from the usededge. This proposition assumes that the textures of the tools were similar near and far from thetool edge before use, and that the differences in the texture observed in the near versus farregions are due to the use-wear. If this is true then the wear mechanisms are such that largefeatures on the stone, as it is originally manufactured, are modified tending towards similartextures regardless of the contact material, while the fine scales are modified in a manner thatis more characteristic of the contact material. This proposition is supported by the micrographsin Figures 1–4, which show smoothing at the larger scales in all cases.
CONCLUSIONS
Based on this use-wear experiment, a number of conclusions have been drawn concerning thepotential to quantify the wear patterns on stone tool surfaces. First, relative lengths calculatedfrom length-scale fractal analysis of measured profiles are effective in discriminating the stonetools in this study according to use and according to the measurement distance from theworn edge. Second, the relative advantage in the effectiveness of length-scale analysis indiscriminating surface wear is due, in part, to the ability to examine geometric characteristics
380 W. J. Stemp et al.
© University of Oxford, 2008, Archaeometry 51, 3 (2009) 366–382
of the profiles as a function of scale over a range of scales. Third, the relative lengths, ascalculated by length-scale fractal analysis, are well behaved with respect to the evaluationlength. Fourth, the relative lengths, as calculated by length-scale fractal analysis, over certainfiner scale ranges, are capable of discriminating the tools, presumably according to use, and atother coarser scales according to differences in the unworn fracture surfaces. Fifth, the stone toolsurfaces used on different contact materials demonstrated the greatest statistical differencebased on relative lengths at smaller length scales, with the most quantitatively significantdata consistently occurring between 0.001 and 0.01 mm when considering MSR based on theF-test results applied to the relative lengths calculated by length-scale fractal analysis.
The results of this experimental programme have demonstrated the value and reliability oflength-scale fractal analysis to quantitatively document and discriminate use-wear on stonetool surfaces. Based on these positive results, additional testing of more experimental chippedstone tools is planned in order to replicate the method as it currently exists and to generatemore data to further investigate surface texture variation and relative length-scale. Ultimately,the goal of this research, which is shared by other lithicists who are developing methods toquantitatively record lithic use-wear, is the successful transition from documenting use-wearon experimentally produced stone tools in controlled laboratory conditions to the reliableacquisition of use-wear data from lithic artefacts recovered from archaeological contexts tocomment on the behaviour of past peoples, specifically in relation to activities undertaken withtheir stone tools.
ACKNOWLEDGEMENTS
The authors would like to thank Simona Radice, Swiss Federal Laboratories for MaterialsTesting and Research (EMPA), Thun, Switzerland; Michael Stemp, Sustainable Energy DesignGroup, Inc., Toronto, Ontario, Canada; Stefano Mischler, Ecole Polytechnique Fédéralede Lausanne (EPFL), Laboratory for Metallurgical Chemistry (LMCH) CH-1015 Lausanne,Switzerland; and Surfract (http://www.surfract.com) for use of Sfrax analysis software forlength-scale analysis and F-tests.
REFERENCES
Adán, M., Barceló, J. A., Pijoan-López, J., Piqué, R., and Toselli, A., 2003, Spatial statistics in archaeological textureanalysis, in The digital heritage of archaeology. Computer applications and quantitative methods in archaeology,proceedings of the 29th CAA conference, Heraklion, Crete, Greece, April 2002 (eds. M. Doerr and A. Sarris),Hellenic Ministry, Archive of Monuments and Publications, Athens.
Akoshima, K., 1981, An experimental study of microflaking—report of Tohoku University microflaking researchteam, Kokogaku Zasshi, 66, 1–27.
Andersen, H. H., and Whitlow, H. J., 1983, Wear traces and patination on Danish flint artefacts, Nuclear Instrumentsand Methods in Physics Research B, 218, 468–74.
Anderson, P. C., Georges, J.-M., Vargiolu, R., and Zahouani, H., 2006, Insights from a tribological analysis of thetribulum, Journal of Archaeological Science, 33, 1559–68.
ASME B46.1, 2002, Surface texture (surface roughness, waviness, and lay): an American National Standard,American Society of Mechanical Engineers, New York.
Barceló, J. A., Pijoan, J., and Vincente, O., 2001, Image quantification as archaeological description, in Computingarchaeology for understanding the past (eds. Z. Stancic and T. Veljanovski), 69–78, British ArchaeologicalReports, International Series S931, Oxford.
Beyries, S., Delamare, F., and Quantin, J.-C., 1988, Tracéologie et rugosimétrie tridimensionelle, in Industrieslithiques: tracéologie et technologie, vol. 2 (ed. S. Beyries), 115–32, British Archaeological Reports, InternationalSeries S411, Oxford.
Lithic use-wear: surface profile measurements and fractal analysis 381
© University of Oxford, 2008, Archaeometry 51, 3 (2009) 366–382
Bietti, A., 1996, Image processing in microwear studies of flint artifacts, Archeologi e Calcolatori, 7, 387–96.Brown, C. A., and Savary, G., 1991, Describing ground surface texture using contact profilometry and fractal analysis,
Wear, 141, 211–26.Brown, C. A., Johnsen, W. A., and Butland, R. M., 1996, Scale-sensitive fractal analysis of turned surfaces, Annual
CIRP, 45, 515–18.Brown, C. T., Witschey, W. R. T., and Liebovitch, L. S., 2005, The broken past: fractals in archaeology, Journal of
Archaeological Method and Theory, 12, 37–78.Christensen, M., 1998, Processus de formation et caractérisation physico-chimique des polis d’utilisation des outils
en silex. Applications à la technologie préhistorique de l’ivoire, Bulletin de la Société Préhistorique Française, 95,336–75.
Christensen, M., Walter, P., and Menu, M., 1992, Usewear characterisation of prehistoric flints with IBA, NuclearInstruments and Methods in Physics Research B, 64, 488–93.
Dumont, J. V., 1982, The quantification of microwear traces: a new use for interferometry, World Archaeology, 14,206–17.
Evans, A. A., and Donahue, R. E., 2005, The elemental chemistry of lithic microwear: an experiment, Journal ofArchaeological Science, 32, 1733–40.
Gonzalez-Urquillo, J. E., and Ibañez-Estevez, J. J., 2003, The quantification of use-wear polish using image analysisfirst results, Journal of Archaeological Science, 30, 481–9.
Grace, R., 1989, Interpreting the function of stone tools: the quantification and computerization of microwear analysis,British Archaeological Reports, International Series S474, Oxford.
Grace, R., 1993, The use of expert systems in lithic analysis, in Traces et fonction: les gestes retrouvés (eds. P. C.Anderson, S. Beyries, M. Otte and H. Plisson), 389–400, ERAUL 50, Liège.
Grace, R., Graham, I. D. G., and Newcomer, M. H., 1985, The quantification of microwear polishes, WorldArchaeology, 17, 112–20.
Jordan, S. E., and Brown, C. A., 2006, Comparing texture characterization parameters on their ability to differentiateground polyethylene ski bases, Wear, 261, 398–409.
Keeley, L. H., 1980, Experimental determination of stone tool uses: a microwear analysis, University of ChicagoPress, Chicago.
Kimball, L. R., Kimball, J. F., and Allen, P. E., 1995, Microwear polishes as viewed through the atomic forcemicroscope, Lithic Technology, 20, 6–28.
Knutsson, K., 1988, Making and using stone tools. The analysis of the lithic assemblages from Middle Neolithic siteswith flint in Västerbotten, Northern Sweden, AUN II, Uppsala.
Knutsson, K., Dahlquist, B., and Knutsson, H., 1988, Patterns of tool use; the microwear analysis of the quartz andflint assemblage from the Bjurselet site, Vasterbotten, Northern Sweden, in Industries lithiques: tracéologie ettechnologie, vol. 1 (ed. S. Beyries), 253–94, British Archaeological Reports, International Series S411,Oxford.
Lerner, H., 2007, Digital image analysis and use-wear accrual as a function of raw material: an example fromnorthwestern New Mexico, Lithic Technology, 32, 51–67.
Lipson, C., and Seth, N. J., 1973, Statistical design and analysis of engineering experiments, McGraw-Hill, NewYork.
Mandelbrot, B. B., 1977, Fractals, forms, chance and dimension, W. H. Freeman, San Francisco.Mandelbrot, B. B., 1982, The fractal geometry of nature, W. H. Freeman, San Francisco.Mecholsky, J. J., and Mackin, T. J., 1988, Fractal analysis of fracture in Ocala chert, Journal of Materials Science
Letters, 7, 1145–7.Moss, E. H., 1983, The functional analysis of flint implements, Pincevent and Pont d’Ambon: two case studies from
the French Final Palaeolithic, British Archaeological Reports, International Series 177, Oxford.Pijoan, J., Barceló, J. A., Clemente, I., and Vila, A., 2002, Variabilidad estadistica en imágenes digitalizadas de
rastos de uso: resultados preliminares, in Análisis funcional: su aportación al estudio de Sociedades Pre-históricas 1er Congreso de Análisis Funcional de España y Portugal (eds. I. Clemente, R. Risch and J. F. Gibaja),55–64, British Archaeological Reports, International Series S1073, Oxford.
Rees, D., Wilkinson, G. G., Grace, R., and Orton, C. R., 1991, An investigation of the fractal properties of flint microwearimages, Journal of Archaeological Science, 18, 629–40.
Russ, J. C., 1993, Light scattering from fractal surfaces, Journal of Computer-Assisted Microscopy, 5, 171–89.Russ, J. C., 1994, Fractal surfaces, Plenum Press, New York.Scott, R. S., Ungar, P. S., Bergstrom, T. S., Brown, C. A., Grine, F. E., Teaford, M. F., and Walker, A., 2005, Dental
microwear texture analysis shows within-species diet variability in fossil hominins, Nature, 436, 693–5.
382 W. J. Stemp et al.
© University of Oxford, 2008, Archaeometry 51, 3 (2009) 366–382
Tmit, Z., Grime, G., Petru, S., and Rajta, I., 1999, Microdistribution and composition of usewear polish on prehistoricstone tools, Nuclear Instruments and Methods in Physics Research B, 150, 565–70.
Tmit, Z., Petru, S., Grime, G., Vidmar, T., Budnar, M., Zorko, B., and Ravnikar, M., 1998, Usewear-induced depositionon prehistoric flint tools, Nuclear Instruments and Methods in Physics Research B, 140, 209–16.
Stemp, W. J., and Stemp, M., 2001, UBM laser profilometry and lithic use-wear analysis: a variable length scaleinvestigation of surface topography, Journal of Archaeological Science, 28, 81–8.
Stemp, W. J., and Stemp, M., 2003, Documenting stages of polish development on experimental stone tools: surfacecharacterization by fractal geometry using UBM laser profilometry, Journal of Archaeological Science, 30, 287–96.
Stemp, W. J., Childs, B. E., Brown, C. A., and Vionnet, S., 2006, Variable length scale documentation of stone toolmicrotopography to determine use, SAS Bulletin: Newsletter of the Society for Archaeological Sciences, 29, 17–21.
Toselli, A., Pijoan, J., and Barceló, J. A., 2002, La descripción de las trazas de uso en materias primas volcánicas:resultados preliminares de un análisis estadístico descriptivo, in Análisis funcional: su aportación al estudio deSociedades Prehistóricas 1er Congreso de Análisis Funcional de España y Portugal (eds. I. Clemente, R. Rischand J. F. Gibaja), 65–79, British Archaeological Reports, International Series S1073, Oxford.
Ulcickas, V., Bar-On, I., and Brown, C. A., 2001, Using area-scale relations to investigate Y-TZP fractures, inFractography of glasses and ceramics IV, proceedings of the Fourth Alfred Conference on the Fractography ofGlasses and Ceramics (eds. J. R. Varner and G. D. Quinn), 211–24, Ceramic Transactions vol. 122, The AmericanCeramics Society, Westerville, OH.
Vaughan, P., 1985, Use-wear analysis of flaked stone tools, University of Arizona Press, Tucson.Vila, A., and Gallart, F., 1993, Caracterización de los micropulidos de uso: ejemplo de aplicación del análisis de
imagines digitalizadas, in Traces et fonction: les gestes retrouvés (eds. P. C. Anderson, S. Beyries, M. Otte andH. Plisson), 459–66, ERAUL 50, Liège.
Zang, B., Liu, X., Brown, C. A., and Bergstrom, T. S., 2002, Microgrinding of nanostructured material coatings,Annual CIRP, 51, 251–4.
Related Documents