Quality of Australian canola 2014–15 www.dpi.nsw.gov.au jn 13250 03–2015 NSW DPI MANAGEMENT GUIDE

Welcome message from author
This document is posted to help you gain knowledge. Please leave a comment to let me know what you think about it! Share it to your friends and learn new things together.
Transcript
Quality of Australian canola 2014–15
www.dpi.nsw.gov.au
jn 13
250 0
3–20
15
N S W D P I M A N A G E M E N T G U I D E
1
Quality of Australian
Canola 2014
D . E . S e b e r r y , D . M c C a f f e r y & T . M . K i n g h a m V o l u m e N o 2 1
I S S N 1 3 2 2 - 9 3 9 7

2
Index
Figures .................................................................................................................................................. 3 Tables ................................................................................................................................................... 3 Acknowledgments ................................................................................................................................ 3 Introduction .......................................................................................................................................... 4
Sample Analysis ............................................................................................................................... 4 Weather Production Review ................................................................................................................ 5
The Season ....................................................................................................................................... 5 Yield ................................................................................................................................................. 9
Australian Quality Parameter Summary ............................................................................................ 10 Oil Content ..................................................................................................................................... 11 Protein Content .............................................................................................................................. 12 Glucosinolate Concentration .......................................................................................................... 13 Fatty Acid Composition ................................................................................................................. 14
Oleic Acid .................................................................................................................................. 14 Linoleic Acid.............................................................................................................................. 15 Linolenic Acid............................................................................................................................ 16 Saturated Fatty Acid................................................................................................................... 17 Iodine Value ............................................................................................................................... 18
Quality Data by State ......................................................................................................................... 19 Fatty Acid Composition by State ....................................................................................................... 23 Definitions .......................................................................................................................................... 26 Methods .............................................................................................................................................. 26
Moisture Content............................................................................................................................ 26 Oil Content ..................................................................................................................................... 26 Protein Content .............................................................................................................................. 26 Glucosinolate Content .................................................................................................................... 27 Fatty Acid Composition ................................................................................................................. 27 Iodine Values ................................................................................................................................. 27 Volumetric Grain Weights ............................................................................................................. 27
References .......................................................................................................................................... 27
3
Figures Figure 1: Australian rainfall deciles 1 April to 30 November 2014. ................................................... 5 Figure 2: Minimum temperature map 3rd August 2014 ...................................................................... 6 Figure 3: Areas of canola production in Australia ............................................................................... 8 Figure 4: Canola Production in Australia 2005 – 2014 ....................................................................... 9 Figure 5: Average Australian oil content 2005 - 2014 ....................................................................... 11 Figure 6: Average oil content by state 2014 ...................................................................................... 11 Figure 7: Average Australian protein content 2005 - 2014 ............................................................... 12 Figure 8: Average protein content by state 2014 ............................................................................... 12 Figure 9: Average Australian glucosinolate content 2005 – 2014 ..................................................... 13 Figure 10: Average glucosinolate content by state 2014 ................................................................... 13 Figure 11: Average Australian oleic acid concentration in canola oil 2005 – 2014 .......................... 14 Figure 12: Average oleic acid concentration by state 2014 ............................................................... 14 Figure 13: Average Australian linoleic acid concentration in canola oil 2005 – 2014 ...................... 15 Figure 14: Average linoleic acid concentration by state 2014 ........................................................... 15 Figure 15: Average Australian linolenic concentration in canola oil 2005 – 2014 ........................... 16 Figure 16: Average linolenic acid concentration by state 2014 ......................................................... 16 Figure 17: Average Australian saturated fatty acid concentration in canola oil 2005 – 2014 ........... 17 Figure 18: Average saturated fatty acid concentration by state 2014 ................................................ 17 Figure 19: Average Australian iodine value in canola oil 2005 – 2014 ............................................ 18 Figure 20: Average iodine value by state 2014 .................................................................................. 18
Tables Table 1: Canola production in Australia by state 2014 ........................................................................ 9 Table 2: Average quality of Australian canola 2014 ......................................................................... 10 Table 3: Quality Data – New South Wales ........................................................................................ 19 Table 4: Quality Data – South Australia ............................................................................................ 20 Table 5: Quality Data – Victoria ........................................................................................................ 21 Table 6: Quality Data – Western Australia ........................................................................................ 22 Table 7: Fatty Acid Composition – New South Wales ...................................................................... 23 Table 8: Fatty Acid Composition – South Australia .......................................................................... 24 Table 9: Fatty Acid Composition – Victoria ...................................................................................... 25
Acknowledgments The Australian Oilseeds Federation would like to thank Graincorp Operations Limited and Viterra Ltd for providing the canola samples from the 2014 harvest. The Australian Oilseeds Federation would also like to thank CBH Group for providing the Western Australian quality data. NSW DPI would also like to thank Andrew Ware (SARDI, Port Lincoln SA), Trent Potter (Yeruga Crop Research, Naracoorte SA), Dale Grey (DETJT&R, Bendigo VIC) and GIWA Crop Report (Perth WA) for help in compiling the Weather Production Report. NSW DPI would also like to thank all the staff of the Australian Oils Research Laboratory for their assistance in the analysis of these samples and compilation of the book, their hard work is greatly appreciated.

4
Introduction
Sample Analysis Canola samples representing the 2014 harvest were received from the bulk handlers in New South Wales, South Australia and Victoria. These samples are representative of the seed collected at each of their receival points and have been taken to cumulatively represent the Australian harvest. The NSW DPI Australian Oils Research Laboratory has no control over the collection of the samples and all data given is based on the analysis of the samples provided. Samples were not available from Western Australia, so CBH Group provided average oil and protein contents for each grade at each Port. Each sample was analysed for oil, protein and glucosinolate concentrations; fatty acid profiles and volumetric grain weights according to the standard AOF methods outlined in the methods section at the back of this book. The NSW DPI Australian Oils Research Laboratory in Wagga Wagga performed all analyses on the samples. Oil and glucosinolate concentrations are reported at 6% moisture in whole seed and protein is reported in oil-free meal at 10% moisture.

5
Weather Production Review
The Season The season was characterised by the following notable events; early sowing across most of Australia following early season rainfall; generally above average temperatures through most of the winter growing period, hottest August on record in parts of Western Australia, severe frosts in the eastern states in the first half of August, and below average rainfall from the end of July through to harvest across most of southern Australia. Figure 1 shows growing season rainfall was generally average to below average and well below average in northern NSW, the Wimmera and the Lower South East of SA. In addition, South Australia, Victoria and NSW experienced an outbreak of the Beet western yellows virus (BWYV), a result of the unusual seasonal conditions that provided a set of circumstances for a population explosion of the green peach aphid, the primary vector for the virus.
Source: Bureau of Meteorology Figure 1: Australian rainfall deciles 1 April to 30 November 2014. New South Wales An early break across central and southern NSW allowed the majority of the canola crop to be sown before the end of April. Sowing into good soil moisture resulted in excellent establishment in most areas. The north and northwest of the state missed out on these early rains so little area was planted in the north, with the exception of the Liverpool Plains. No canola was planted west of the Newell highway in the north for the second consecutive season. Rainfall was below average in May but average to above average for June. Above average temperatures through May and early-mid June advanced crop development earlier than normal. Beet western yellow virus was identified in late June, within a week of detection in SA and the Mallee of Victoria. Earliest reports of crop damage were from the Riverina in southern NSW but later crop sampling showed the virus to be widespread, but at lower rates of infection. Many early developing crops commenced flowering in late June and were in full flower by the end of July. Rainfall was highly variable in July and generally below average for the remainder of the season.

6
Severe frosts were experienced in the first half of August across much of southern NSW, the North East and eastern Mallee of Victoria and across the Mid North of SA. The area affected by the most severe frost is shown in Figure 2. Yield losses were greatest in western areas of the South West Slopes, northern Riverina and south western areas of the Central West Slopes and Plains, where early developing crops did not have time to compensate and were growing on declining soil moisture in early spring.
Source: Bureau of Meteorology Figure 2: Minimum temperature map 3rd August 2014 Crop development was even earlier in 2014 than it was in 2013, which resulted in earlier Sclerotinia infection and hence the need for control in disease prone areas such as the south east Riverina. From August onwards conditions were dry with below average rainfall, reducing further Sclerotinia infection. Harvest was much earlier than normal as a result of the early sowing, above average temperatures through winter, followed by the dry spring. Oil contents were surprisingly good considering the seasonal conditions the crop experienced. Final estimated production for NSW was 835,000 t from an estimated 575,000 ha, for an average yield of 1.45 t/ha. Victoria The South West, Wimmera and south-west Mallee started the season with a dry soil profile, which discouraged some planting in the Wimmera. The northern and eastern Mallee, North Central and North East areas had a wet profile at planting due to February storms and excellent mid-April rains which encouraged some extra planting in the Mallee. The seasonal break was excellent across the whole state with all crops being planted on time in the last week of April and first week of May. Parts of the North East experienced minor to severe waterlogging. Excellent growth occurred during May-July but after a dry July in the northern areas and a dry August across the whole state, crops started to show signs of moisture stress on heavier soil types in the southern Mallee and northern Wimmera. September was the critical month where the North Central, North East and eastern Mallee crops received sufficient rain, but the southwest Mallee and northern Wimmera crops suffered greatly due to a lack of rain. In the South West region

7
full soil profiles in winter enabled crops to survive through the tight spring except the Lake Bolac to Ararat region, where the rainfall was lower and crops struggled to reach potential. Unlike 2013 the conditions at petal fall were not conducive to Sclerotinia and very little was observed in the North East in 2014. The whole season was warmer than average from planting to harvest with much warmer temperatures experienced through August-October. Warmer temperatures in May, particularly in the north-west, led to rapid growth and early ground cover. October was 3-5oC warmer over most of the canola growing regions. The summer storms caused a green bridge and the early warmth resulted in large flights and rapid generations of Green Peach Aphid. In late July-August the symptoms of Beet western yellows virus started to appear in Mallee and Wimmera crops. There was a high rate of spraying of aphids, most with little effect. A few crops suffered major yield loss but the majority recovered better than expected. Harvest commenced early and finished ahead of usual due to a dry windrowing and harvest period without stoppages. The majority of crop was harvested by the end of November. Yields and oils were excellent in the North East and North Central districts and generally below expectations in other areas, however were consistent with the rainfall received. Crop failure occurred in some parts of the south west Mallee and northern Wimmera. Final estimated production for Victoria was 647,000 t from an estimated area of 483,000 ha, for an average yield of 1.34 t/ha. South Australia A similar area of canola was sown in South Australia in 2014 as had been grown in 2013. Well above average rainfall fell over most of South Australia between January and April, with the exception of the Lower South East district. This enabled planting across most of the state to occur from the middle of April and concluded in the Lower South East in mid-May. High levels of green peach aphids, thought to have multiplied on host plants over summer, infested emerging canola crops and then transmitted Beet western yellows virus. The Lower North had the most significant damage to canola crops, with large areas in the Mid North and central Eyre Peninsula also affected. The lack of summer rain across the South East helped keep levels of the virus to low levels. Warm and dry conditions in spring led to a rapid increase of Diamondback moth resulting in many growers needing to control this pest for the first time. Blackleg severity in South Australia was higher than the national average in 2014, but not thought to have caused yield loss in most regions. No other diseases were noted to be present at yield damaging levels in 2014. Rainfall was generally average to well above average throughout May, June and July but well below average through August, September and October. Frost damage occurred in most canola growing districts. Overall yields were below expectations. Final estimated production for South Australia was 314,000 t from an estimated area of 302,000 ha, for an average yield of 1.04 t/ha.

8
Western Australia Growers in Western Australia sowed a record area of 1.247 million hectares in 2014, surpassing the 2013 record of 1.177 million hectares. The autumn break arrived in the second half of April in the north and early May in the south-east around Esperance. Dry sowing had already commenced in early-mid April in some districts allowing the majority of the crop to be sown on time. Above average temperatures and good rainfall through May in most districts promoted growth of the crop ahead of normal development times. June rainfall was below average to well below average, especially away from the coast. July rainfall was below average in the northern Geraldton port zone. Crops lost yield potential in many inland areas through August when record high temperatures coincided with dry conditions, causing flower abortion and a gap in pods on the main stem. Rainfall was average to below average through September and October. Windrowing and harvest commenced much earlier than usual due to warm winter temperatures that advanced crop growth. Yields were below average to well below average in the northern and eastern Geraldton port zone and less than anticipated in the central and eastern Kwinana port zone and inland Esperance port zone. Despite this, oil contents were still very good overall, averaging 45-48% where crops were not drought affected, and 40-44% and lower in much drier inland regions. Sclerotinia was again widespread and favoured by an early sowing and rapid plant development which placed flowering at a time when conditions were favourable. Many crops were sprayed to control the disease in central and coastal crops. Final estimated production for Western Australia was 1.635 million tonnes from an estimated 1.247 million ha for an average yield of 1.31 t/ha.
Figure 3: Areas of canola production in Australia Published with approval of Bureau of Rural Sciences

9
Yield Australia produced in excess of 3 million tonnes for the third consecutive year in 2014, following a harvest of 3.9 million tonnes in 2013 and 4.3 million tonnes in 2012. Area sown and production in each state is shown in Table 1. Final production of 3.431 million tonnes is the third highest on record, however yield per hectare was the lowest of the past three years, due primarily to the below average rainfall in the second half of the season. The Australian average yield was 1.32 t/ha, this was a 0.32 t/ha decrease from the 2013 harvest. Yield ranged from 1.04 t/ha in South Australia to 1.45 t/ha in New South Wales. Table 1: Canola production in Australia by state 2014
State Production (kilotonnes)
Area Harvested
(kilohectares)
Average Yield (tonnes/hectare)
New South Wales 835 575 1.45
Victoria 647 483 1.34
South Australia 314 302 1.04
Western Australia 1635 1247 1.31
Australia 3431 2607 1.32 Source: AOF
Figure 4: Canola Production in Australia 2005 – 2014
0
250
500
750
1000
1250
1500
1750
2000
2250
2500
2750
3000
3250
3500
3750
4000
4250
2005 2006 2007 2008 2009 2010 2011 2012 2013 2014
Prod
uctio
n (k
t)
Year
NSW SA VIC WA

10
Australian Quality Parameter Summary The mean regional and state values for all analyses for New South Wales, South Australia and Victoria were calculated on the basis of the tonnage each Site and Grade represents. Samples were not available from Western Australia so the Port Zone averages are reported as supplied by CBH. The Australian mean values were calculated using the sum of the tonnages for each Site and Grade in New South Wales, South Australia and Victoria and the total tonnage for Western Australia. However, due to tonnages being confidential information, no individual site tonnages can be reported. Table 2: Average quality of Australian canola 2014
Quality Parameter Australian
Mean
Oil content, % in whole seed @ 6% moisture 44.1
Protein content, % in oil-free meal @ 10% moisture 38.8 Glucosinolates, µmoles/g in whole seed @ 6% moisture 6
Volumetric grain weights, lbs/b 54.2
kg/hL 67.5
Oleic acid concentration (C18:1), % in oil 63.7
Linoleic acid concentration (C18:2), % in oil 17.9
Linolenic acid concentration (C18:3), % in oil 9.3
Erucic acid concentration (C22:1), % in oil < 0.1
Saturated fatty acid concentration, % in oil 7.5
Iodine Value 111.3
11
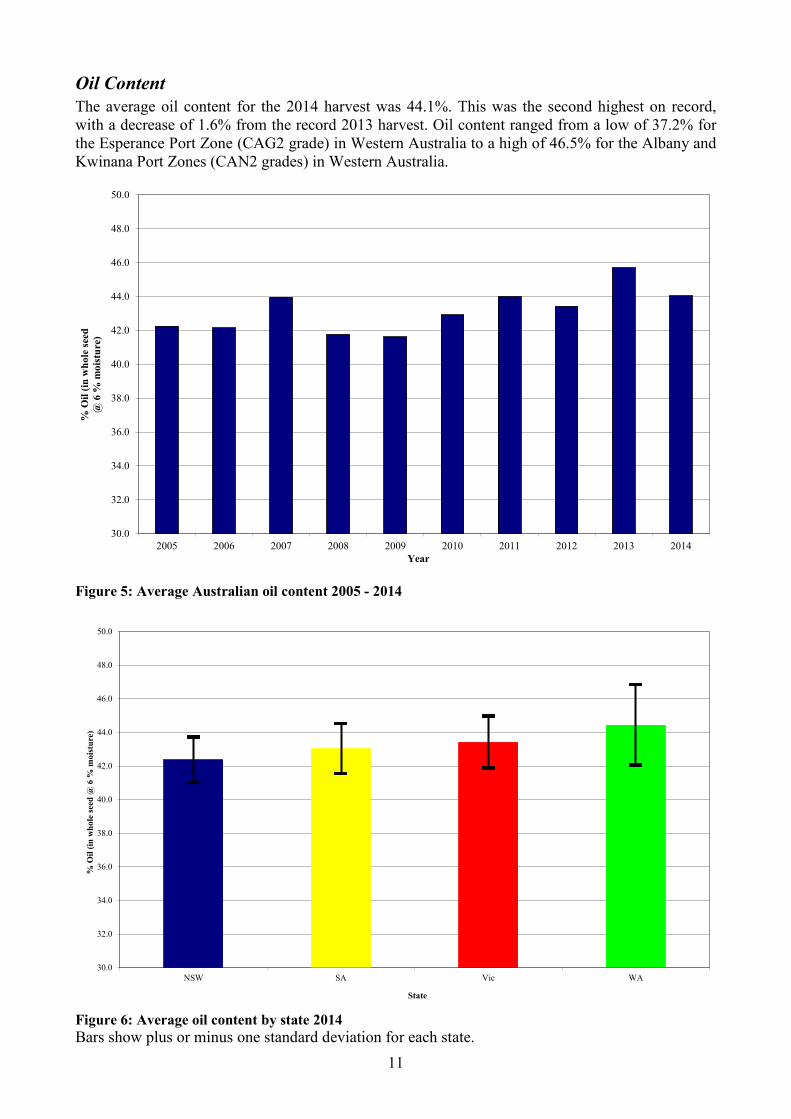
Oil Content The average oil content for the 2014 harvest was 44.1%. This was the second highest on record, with a decrease of 1.6% from the record 2013 harvest. Oil content ranged from a low of 37.2% for the Esperance Port Zone (CAG2 grade) in Western Australia to a high of 46.5% for the Albany and Kwinana Port Zones (CAN2 grades) in Western Australia.
Figure 5: Average Australian oil content 2005 - 2014
Figure 6: Average oil content by state 2014 Bars show plus or minus one standard deviation for each state.
30.0
32.0
34.0
36.0
38.0
40.0
42.0
44.0
46.0
48.0
50.0
2005 2006 2007 2008 2009 2010 2011 2012 2013 2014
% O
il (in
who
le se
ed
@ 6
% m
oist
ure)
Year
30.0
32.0
34.0
36.0
38.0
40.0
42.0
44.0
46.0
48.0
50.0
NSW SA Vic WA
% O
il (in
who
le se
ed @
6 %
moi
stur
e)
State
12
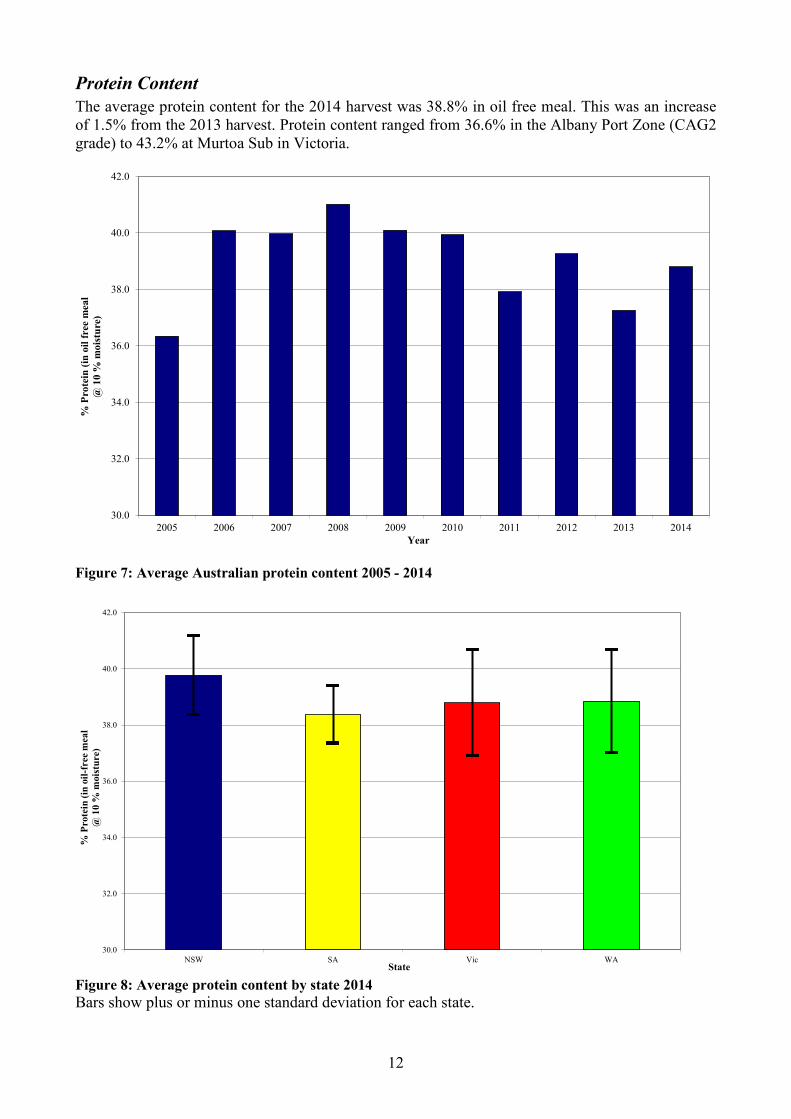
Protein Content The average protein content for the 2014 harvest was 38.8% in oil free meal. This was an increase of 1.5% from the 2013 harvest. Protein content ranged from 36.6% in the Albany Port Zone (CAG2 grade) to 43.2% at Murtoa Sub in Victoria.
Figure 7: Average Australian protein content 2005 - 2014
Figure 8: Average protein content by state 2014 Bars show plus or minus one standard deviation for each state.
30.0
32.0
34.0
36.0
38.0
40.0
42.0
2005 2006 2007 2008 2009 2010 2011 2012 2013 2014
% P
rote
in (i
n oi
l fre
e m
eal
@ 1
0 %
moi
stur
e)
Year
30.0
32.0
34.0
36.0
38.0
40.0
42.0
NSW SA Vic WA
% P
rote
in (i
n oi
l-fre
e m
eal
@ 1
0 %
moi
stur
e)
State

13
Glucosinolate Concentration The average glucosinolate content for the 2014 harvest was 6 µmoles/g which is the same as the 2013 harvest. Glucosinolate content ranged from 3 µmoles/g at Parkes (NSW), Wirrinya (NSW) and Westmere (Victoria) to 12 µmoles/g at Narwonah in New South Wales.
Figure 9: Average Australian glucosinolate content 2005 – 2014
0
2
4
6
8
10
12
14
16
18
20
NSW SA Vic
µmol
es/g
Glu
cosi
nola
tes (
in w
hole
seed
.@
6 %
moi
stur
e)
State Figure 10: Average glucosinolate content by state 2014 Bars show plus or minus one standard deviation for each state.
0
2
4
6
8
10
12
14
16
18
20
2005 2006 2007 2008 2009 2010 2011 2012 2013 2014
µmol
es/g
Glu
cosin
olat
es (i
n w
hole
seed
. @
6 %
moi
stur
e)
Year
14
Fatty Acid Composition
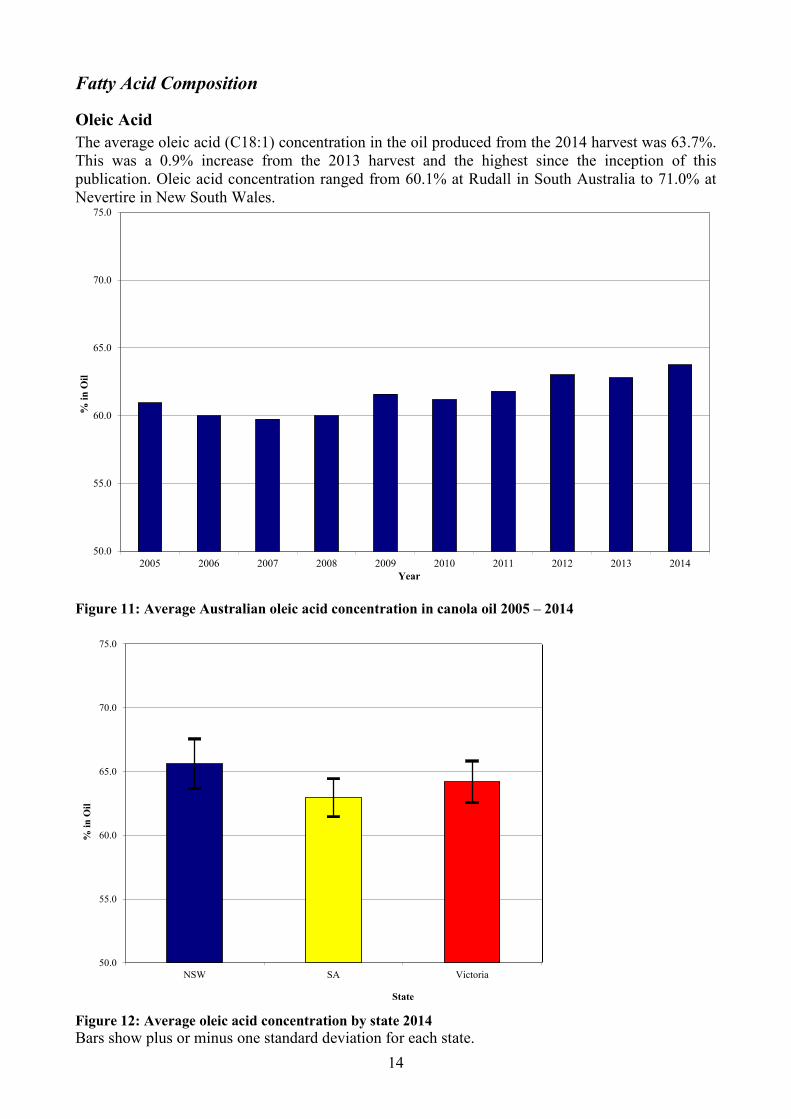
Oleic Acid The average oleic acid (C18:1) concentration in the oil produced from the 2014 harvest was 63.7%. This was a 0.9% increase from the 2013 harvest and the highest since the inception of this publication. Oleic acid concentration ranged from 60.1% at Rudall in South Australia to 71.0% at Nevertire in New South Wales.
Figure 11: Average Australian oleic acid concentration in canola oil 2005 – 2014
50.0
55.0
60.0
65.0
70.0
75.0
NSW SA Victoria
% in
Oil
State
Figure 12: Average oleic acid concentration by state 2014 Bars show plus or minus one standard deviation for each state.
50.0
55.0
60.0
65.0
70.0
75.0
2005 2006 2007 2008 2009 2010 2011 2012 2013 2014
% in
Oil
Year

15
Linoleic Acid The average linoleic acid (C18:2) concentration in oil produced from the 2014 harvest was 17.9%. This is 0.3% lower than the 2013 harvest and the lowest in the twenty year history of this publication. The concentration ranged from 13.8% at Milvale in New South Wales to 21.4% at Rudall in South Australia.
Figure 13: Average Australian linoleic acid concentration in canola oil 2005 – 2014
10.0
12.0
14.0
16.0
18.0
20.0
22.0
NSW SA Victoria
% in
Oil
State
Figure 14: Average linoleic acid concentration by state 2014 Bars show plus or minus one standard deviation for each state.
10.0
12.0
14.0
16.0
18.0
20.0
22.0
2005 2006 2007 2008 2009 2010 2011 2012 2013 2014
% in
Oil
Year

16
Linolenic Acid The linolenic acid (C18:3) concentration for 2014 was 9.3% this was 0.9% lower than the 2013 harvest and the lowest since 2003. Linolenic acid concentrations ranged from 2.9% at Mungeribar in New South Wales to 10.5% at Naracoorte in South Australia (considered a part of GrainCorp’s Victorian operation).
Figure 15: Average Australian linolenic concentration in canola oil 2005 – 2014
6.0
7.0
8.0
9.0
10.0
11.0
12.0
NSW SA Victoria
% in
Oil
State
Figure 16: Average linolenic acid concentration by state 2014 Bars show plus or minus one standard deviation for each state.
6.0
7.0
8.0
9.0
10.0
11.0
12.0
2005 2006 2007 2008 2009 2010 2011 2012 2013 2014
% in
Oil
Year

17
Saturated Fatty Acid The average saturated fatty acid concentration for the 2014 harvest was 7.5%. This was 0.2% higher than the 2013 harvest and the highest since 2009. Saturated fatty acid concentration ranged from 7.2% at thirteen sites across New South Wales and Victoria to 8.0% at three sites across South Australia and Victoria.
5.0
5.5
6.0
6.5
7.0
7.5
8.0
8.5
2005 2006 2007 2008 2009 2010 2011 2012 2013 2014
% in
Oil
Year
Figure 17: Average Australian saturated fatty acid concentration in canola oil 2005 – 2014
5.0
5.5
6.0
6.5
7.0
7.5
8.0
8.5
NSW SA Victoria
% in
Oil
State
Figure 18: Average saturated fatty acid concentration by state 2014 Bars show plus or minus one standard deviation for each state.

18
Iodine Value The average iodine value for the 2014 harvest was 111.3. This is 1.8 lower than the 2013 harvest and the lowest iodine value recorded during the life of this publication. Iodine value ranged from 98.9 at Nevertire in New South Wales to 114.6 at Ouyen in Victoria.
Figure 19: Average Australian iodine value in canola oil 2005 – 2014
90.0
95.0
100.0
105.0
110.0
115.0
120.0
NSW SA Victoria
% in
Oil
State
Figure 20: Average iodine value by state 2014 Bars show plus or minus one standard deviation for each state.
90.0
95.0
100.0
105.0
110.0
115.0
120.0
2005 2006 2007 2008 2009 2010 2011 2012 2013 2014
% in
Oil
Year
19
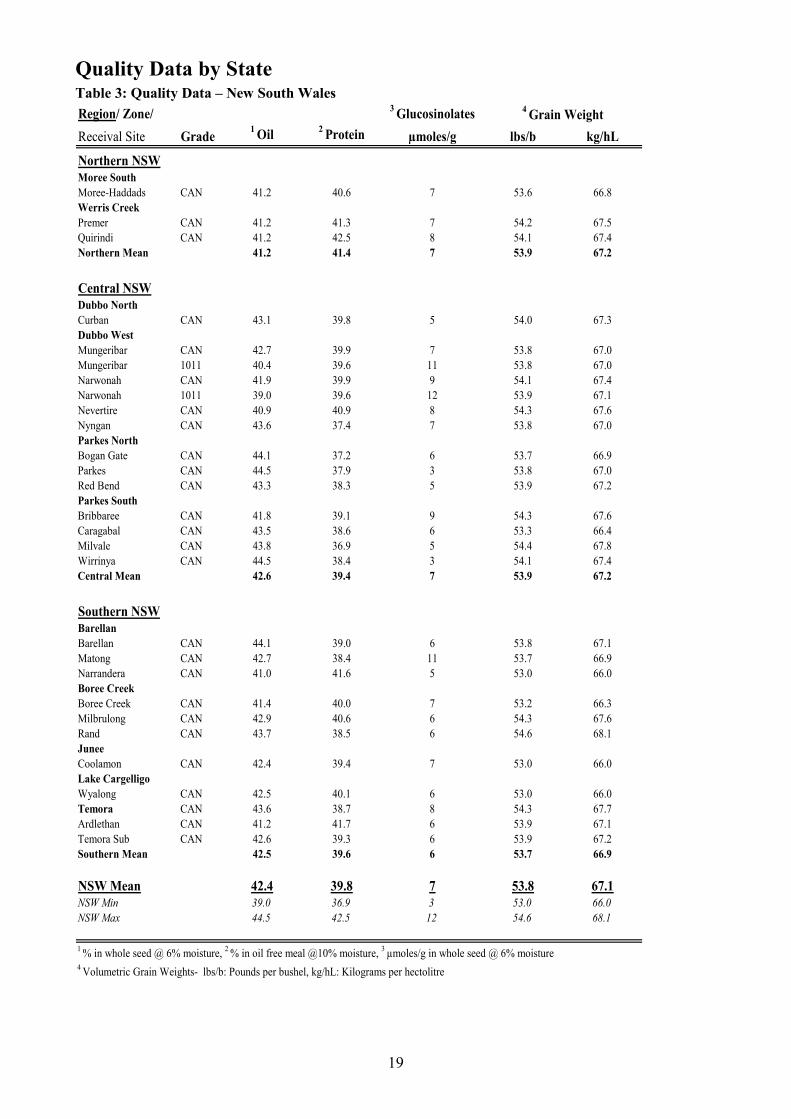
Quality Data by State Table 3: Quality Data – New South Wales Region/ Zone/ 3 GlucosinolatesReceival Site Grade 1 Oil 2 Protein µmoles/g lbs/b kg/hL
Northern NSWMoree SouthMoree-Haddads CAN 41.2 40.6 7 53.6 66.8Werris CreekPremer CAN 41.2 41.3 7 54.2 67.5Quirindi CAN 41.2 42.5 8 54.1 67.4Northern Mean 41.2 41.4 7 53.9 67.2
Central NSWDubbo NorthCurban CAN 43.1 39.8 5 54.0 67.3Dubbo WestMungeribar CAN 42.7 39.9 7 53.8 67.0Mungeribar 1011 40.4 39.6 11 53.8 67.0Narwonah CAN 41.9 39.9 9 54.1 67.4Narwonah 1011 39.0 39.6 12 53.9 67.1Nevertire CAN 40.9 40.9 8 54.3 67.6Nyngan CAN 43.6 37.4 7 53.8 67.0Parkes NorthBogan Gate CAN 44.1 37.2 6 53.7 66.9Parkes CAN 44.5 37.9 3 53.8 67.0Red Bend CAN 43.3 38.3 5 53.9 67.2Parkes SouthBribbaree CAN 41.8 39.1 9 54.3 67.6Caragabal CAN 43.5 38.6 6 53.3 66.4Milvale CAN 43.8 36.9 5 54.4 67.8Wirrinya CAN 44.5 38.4 3 54.1 67.4Central Mean 42.6 39.4 7 53.9 67.2
Southern NSWBarellanBarellan CAN 44.1 39.0 6 53.8 67.1Matong CAN 42.7 38.4 11 53.7 66.9Narrandera CAN 41.0 41.6 5 53.0 66.0Boree CreekBoree Creek CAN 41.4 40.0 7 53.2 66.3Milbrulong CAN 42.9 40.6 6 54.3 67.6Rand CAN 43.7 38.5 6 54.6 68.1JuneeCoolamon CAN 42.4 39.4 7 53.0 66.0Lake CargelligoWyalong CAN 42.5 40.1 6 53.0 66.0Temora CAN 43.6 38.7 8 54.3 67.7Ardlethan CAN 41.2 41.7 6 53.9 67.1Temora Sub CAN 42.6 39.3 6 53.9 67.2Southern Mean 42.5 39.6 6 53.7 66.9
NSW Mean 42.4 39.8 7 53.8 67.1NSW Min 39.0 36.9 3 53.0 66.0NSW Max 44.5 42.5 12 54.6 68.1
4 Grain Weight
1 % in whole seed @ 6% moisture, 2 % in oil free meal @10% moisture, 3 µmoles/g in whole seed @ 6% moisture4 Volumetric Grain Weights- lbs/b: Pounds per bushel, kg/hL: Kilograms per hectolitre

20
Table 4: Quality Data – South Australia Port/ Zone/ 3 GlucosinolatesReceival Site Grade 1 Oil 2 Protein µmoles/g lbs/b kg/hL
Port AdelaideAdelaide RegionPort Adelaide (Inner) CANO 41.5 38.4 9 54.4 67.8Central RegionBowmans CANO 42.0 37.5 7 53.8 67.0Gladstone CANO 42.2 37.8 7 53.5 66.7Roseworthy CANO 42.8 39.7 6 54.0 67.3Eastern RegionDooen CANO 41.1 39.7 7 55.1 68.7Francis CANO 43.0 40.2 5 54.2 67.5Keith CANO 39.8 39.4 7 54.8 68.3Tailem Bend CANO 42.3 39.2 9 54.4 67.8Wolseley CANO 40.0 40.9 8 54.4 67.8Port Adelaide Mean 42.0 38.8 7 54.1 67.4
Port GilesCentral RegionArdrossan CANO 41.3 37.7 6 54.6 68.0Port Giles CANO 42.7 38.2 7 53.8 67.1Port Giles Mean 41.9 37.9 7 54.2 67.6
Port LincolnWestern RegionCummins CANO 44.9 37.7 5 54.0 67.3Port Lincoln CANO 44.0 38.5 5 54.0 67.3Rudall CANO 42.7 39.0 7 55.0 68.5Tumby Bay CANO 45.1 37.5 5 54.4 67.8Port Lincoln Mean 44.6 38.0 5 54.1 67.5
SA Mean 43.0 38.4 6 54.1 67.4SA Min 39.8 37.5 5 53.5 66.7SA Max 45.1 40.9 9 55.1 68.7
4 Grain Weight
1 % in whole seed @ 6% moisture, 2 % in oil free meal @10% moisture, 3 µmoles/g in whole seed @ 6% moisture4 Volumetric Grain Weights- lbs/b: Pounds per bushel, kg/hL: Kilograms per hectolitre
21
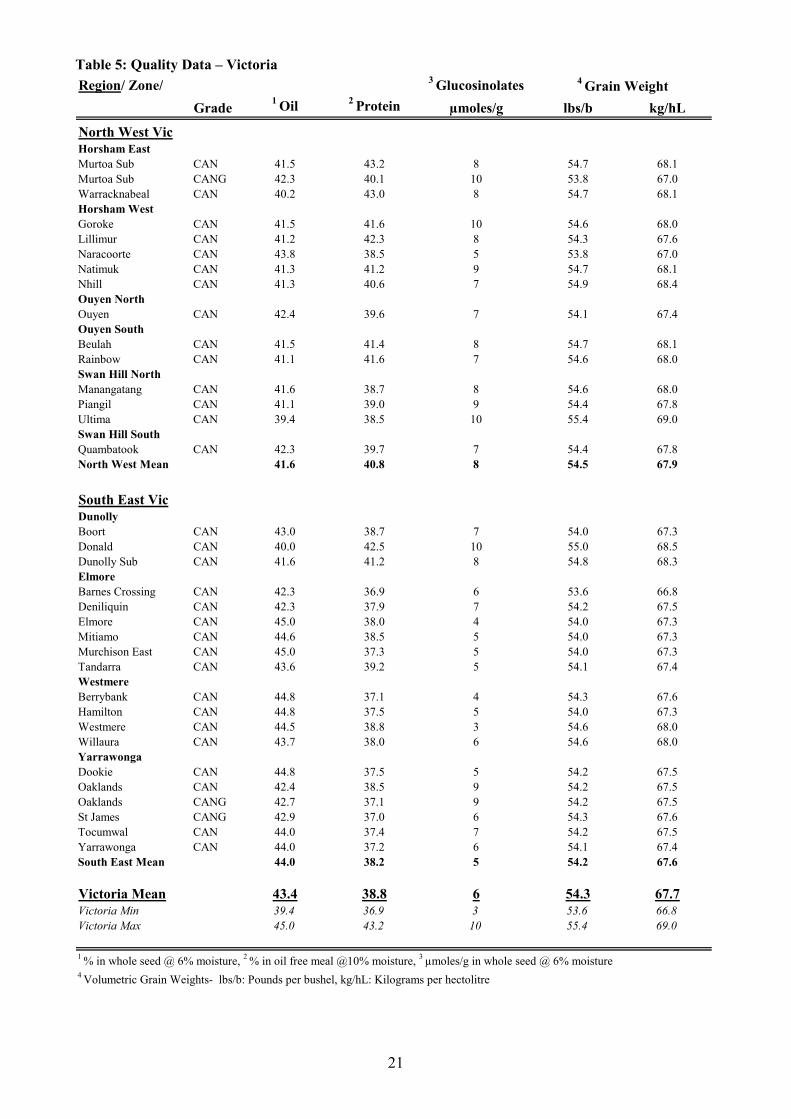
Table 5: Quality Data – Victoria Region/ Zone/ 3 Glucosinolates
Grade 1 Oil 2 Protein µmoles/g lbs/b kg/hL
North West VicHorsham EastMurtoa Sub CAN 41.5 43.2 8 54.7 68.1Murtoa Sub CANG 42.3 40.1 10 53.8 67.0Warracknabeal CAN 40.2 43.0 8 54.7 68.1Horsham WestGoroke CAN 41.5 41.6 10 54.6 68.0Lillimur CAN 41.2 42.3 8 54.3 67.6Naracoorte CAN 43.8 38.5 5 53.8 67.0Natimuk CAN 41.3 41.2 9 54.7 68.1Nhill CAN 41.3 40.6 7 54.9 68.4Ouyen NorthOuyen CAN 42.4 39.6 7 54.1 67.4Ouyen SouthBeulah CAN 41.5 41.4 8 54.7 68.1Rainbow CAN 41.1 41.6 7 54.6 68.0Swan Hill NorthManangatang CAN 41.6 38.7 8 54.6 68.0Piangil CAN 41.1 39.0 9 54.4 67.8Ultima CAN 39.4 38.5 10 55.4 69.0Swan Hill SouthQuambatook CAN 42.3 39.7 7 54.4 67.8North West Mean 41.6 40.8 8 54.5 67.9
South East VicDunollyBoort CAN 43.0 38.7 7 54.0 67.3Donald CAN 40.0 42.5 10 55.0 68.5Dunolly Sub CAN 41.6 41.2 8 54.8 68.3ElmoreBarnes Crossing CAN 42.3 36.9 6 53.6 66.8Deniliquin CAN 42.3 37.9 7 54.2 67.5Elmore CAN 45.0 38.0 4 54.0 67.3Mitiamo CAN 44.6 38.5 5 54.0 67.3Murchison East CAN 45.0 37.3 5 54.0 67.3Tandarra CAN 43.6 39.2 5 54.1 67.4WestmereBerrybank CAN 44.8 37.1 4 54.3 67.6Hamilton CAN 44.8 37.5 5 54.0 67.3Westmere CAN 44.5 38.8 3 54.6 68.0Willaura CAN 43.7 38.0 6 54.6 68.0YarrawongaDookie CAN 44.8 37.5 5 54.2 67.5Oaklands CAN 42.4 38.5 9 54.2 67.5Oaklands CANG 42.7 37.1 9 54.2 67.5St James CANG 42.9 37.0 6 54.3 67.6Tocumwal CAN 44.0 37.4 7 54.2 67.5Yarrawonga CAN 44.0 37.2 6 54.1 67.4South East Mean 44.0 38.2 5 54.2 67.6
Victoria Mean 43.4 38.8 6 54.3 67.7Victoria Min 39.4 36.9 3 53.6 66.8Victoria Max 45.0 43.2 10 55.4 69.0
4 Grain Weight
1 % in whole seed @ 6% moisture, 2 % in oil free meal @10% moisture, 3 µmoles/g in whole seed @ 6% moisture4 Volumetric Grain Weights- lbs/b: Pounds per bushel, kg/hL: Kilograms per hectolitre

22
Table 6: Quality Data – Western Australia Port Zone/ 3 GlucosinolatesReceival Site Grade 1 Oil 2 Protein µmoles/g lbs/b kg/hLAlbanyAlbany CAG1 45.7 36.9Albany CAG2 46.0 36.6Albany CAN1 46.4 37.0Albany CAN2 46.5 36.7EsperanceEsperance CAG1 46.7 36.8Esperance CAN1 46.3 36.9Esperance CAN1HE 46.2 36.2Esperance CAN1 45.7 35.6GeraldtonGeraldton CAG1 44.4 40.5Geraldton CAG2 42.5 42.6Geraldton CAN1 44.4 41.3Geraldton CAN2 43.2 41.6KwinanaKwinana CAG1 45.9 37.7Kwinana CAG2 45.9 37.5Kwinana CAN1 46.1 38.1Kwinana CAN2 46.5 37.6
WA Mean 44.4 38.8WA Min 37.2 36.6WA Max 46.5 42.6
4 Grain Weight
1 % in whole seed @ 6% moisture, 2 % in oil free meal @10% moisture, 3 µmoles/g in whole seed @ 6% moisture4 Volumetric Grain Weights- lbs/b: Pounds per bushel, kg/hL: Kilograms per hectolitre
23
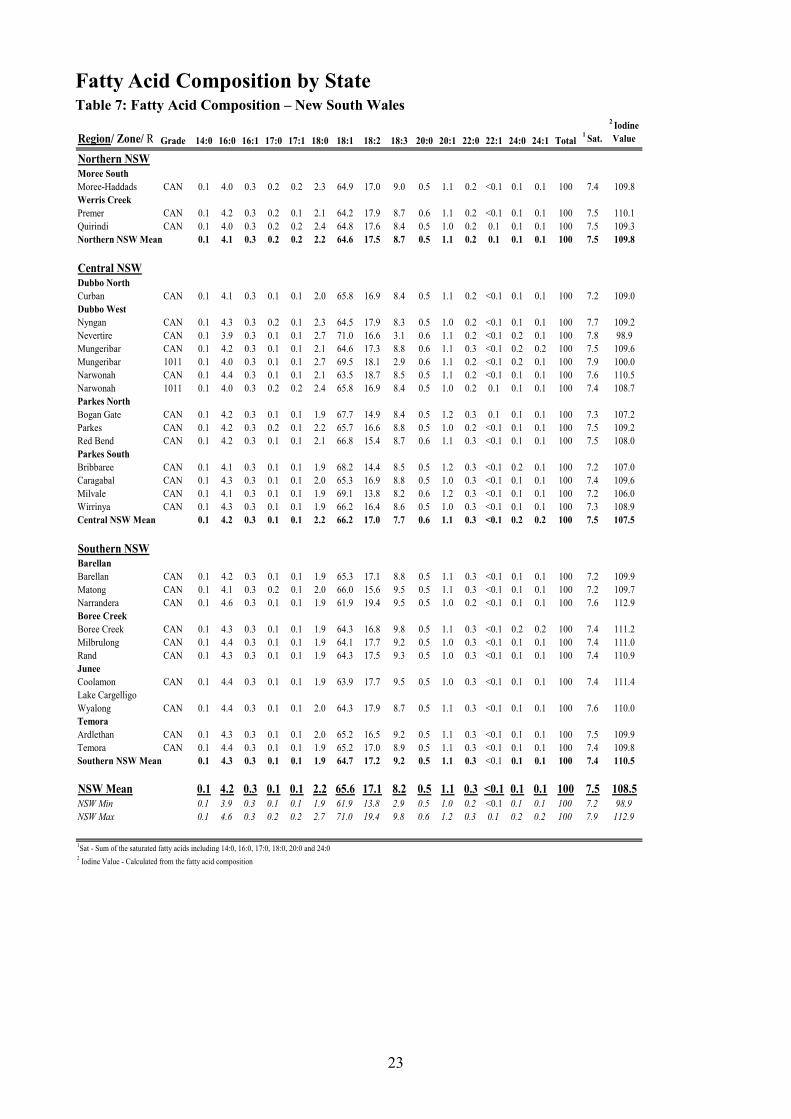
Fatty Acid Composition by State Table 7: Fatty Acid Composition – New South Wales
Region/ Zone/ R Grade 14:0 16:0 16:1 17:0 17:1 18:0 18:1 18:2 18:3 20:0 20:1 22:0 22:1 24:0 24:1 Total1 Sat.
2 Iodine Value
Northern NSWMoree SouthMoree-Haddads CAN 0.1 4.0 0.3 0.2 0.2 2.3 64.9 17.0 9.0 0.5 1.1 0.2 <0.1 0.1 0.1 100 7.4 109.8Werris CreekPremer CAN 0.1 4.2 0.3 0.2 0.1 2.1 64.2 17.9 8.7 0.6 1.1 0.2 <0.1 0.1 0.1 100 7.5 110.1Quirindi CAN 0.1 4.0 0.3 0.2 0.2 2.4 64.8 17.6 8.4 0.5 1.0 0.2 0.1 0.1 0.1 100 7.5 109.3Northern NSW Mean 0.1 4.1 0.3 0.2 0.2 2.2 64.6 17.5 8.7 0.5 1.1 0.2 0.1 0.1 0.1 100 7.5 109.8
Central NSWDubbo NorthCurban CAN 0.1 4.1 0.3 0.1 0.1 2.0 65.8 16.9 8.4 0.5 1.1 0.2 <0.1 0.1 0.1 100 7.2 109.0Dubbo WestNyngan CAN 0.1 4.3 0.3 0.2 0.1 2.3 64.5 17.9 8.3 0.5 1.0 0.2 <0.1 0.1 0.1 100 7.7 109.2Nevertire CAN 0.1 3.9 0.3 0.1 0.1 2.7 71.0 16.6 3.1 0.6 1.1 0.2 <0.1 0.2 0.1 100 7.8 98.9Mungeribar CAN 0.1 4.2 0.3 0.1 0.1 2.1 64.6 17.3 8.8 0.6 1.1 0.3 <0.1 0.2 0.2 100 7.5 109.6Mungeribar 1011 0.1 4.0 0.3 0.1 0.1 2.7 69.5 18.1 2.9 0.6 1.1 0.2 <0.1 0.2 0.1 100 7.9 100.0Narwonah CAN 0.1 4.4 0.3 0.1 0.1 2.1 63.5 18.7 8.5 0.5 1.1 0.2 <0.1 0.1 0.1 100 7.6 110.5Narwonah 1011 0.1 4.0 0.3 0.2 0.2 2.4 65.8 16.9 8.4 0.5 1.0 0.2 0.1 0.1 0.1 100 7.4 108.7Parkes NorthBogan Gate CAN 0.1 4.2 0.3 0.1 0.1 1.9 67.7 14.9 8.4 0.5 1.2 0.3 0.1 0.1 0.1 100 7.3 107.2Parkes CAN 0.1 4.2 0.3 0.2 0.1 2.2 65.7 16.6 8.8 0.5 1.0 0.2 <0.1 0.1 0.1 100 7.5 109.2Red Bend CAN 0.1 4.2 0.3 0.1 0.1 2.1 66.8 15.4 8.7 0.6 1.1 0.3 <0.1 0.1 0.1 100 7.5 108.0Parkes SouthBribbaree CAN 0.1 4.1 0.3 0.1 0.1 1.9 68.2 14.4 8.5 0.5 1.2 0.3 <0.1 0.2 0.1 100 7.2 107.0Caragabal CAN 0.1 4.3 0.3 0.1 0.1 2.0 65.3 16.9 8.8 0.5 1.0 0.3 <0.1 0.1 0.1 100 7.4 109.6Milvale CAN 0.1 4.1 0.3 0.1 0.1 1.9 69.1 13.8 8.2 0.6 1.2 0.3 <0.1 0.1 0.1 100 7.2 106.0Wirrinya CAN 0.1 4.3 0.3 0.1 0.1 1.9 66.2 16.4 8.6 0.5 1.0 0.3 <0.1 0.1 0.1 100 7.3 108.9Central NSW Mean 0.1 4.2 0.3 0.1 0.1 2.2 66.2 17.0 7.7 0.6 1.1 0.3 <0.1 0.2 0.2 100 7.5 107.5
Southern NSWBarellanBarellan CAN 0.1 4.2 0.3 0.1 0.1 1.9 65.3 17.1 8.8 0.5 1.1 0.3 <0.1 0.1 0.1 100 7.2 109.9Matong CAN 0.1 4.1 0.3 0.2 0.1 2.0 66.0 15.6 9.5 0.5 1.1 0.3 <0.1 0.1 0.1 100 7.2 109.7Narrandera CAN 0.1 4.6 0.3 0.1 0.1 1.9 61.9 19.4 9.5 0.5 1.0 0.2 <0.1 0.1 0.1 100 7.6 112.9Boree CreekBoree Creek CAN 0.1 4.3 0.3 0.1 0.1 1.9 64.3 16.8 9.8 0.5 1.1 0.3 <0.1 0.2 0.2 100 7.4 111.2Milbrulong CAN 0.1 4.4 0.3 0.1 0.1 1.9 64.1 17.7 9.2 0.5 1.0 0.3 <0.1 0.1 0.1 100 7.4 111.0Rand CAN 0.1 4.3 0.3 0.1 0.1 1.9 64.3 17.5 9.3 0.5 1.0 0.3 <0.1 0.1 0.1 100 7.4 110.9JuneeCoolamon CAN 0.1 4.4 0.3 0.1 0.1 1.9 63.9 17.7 9.5 0.5 1.0 0.3 <0.1 0.1 0.1 100 7.4 111.4Lake CargelligoWyalong CAN 0.1 4.4 0.3 0.1 0.1 2.0 64.3 17.9 8.7 0.5 1.1 0.3 <0.1 0.1 0.1 100 7.6 110.0TemoraArdlethan CAN 0.1 4.3 0.3 0.1 0.1 2.0 65.2 16.5 9.2 0.5 1.1 0.3 <0.1 0.1 0.1 100 7.5 109.9Temora CAN 0.1 4.4 0.3 0.1 0.1 1.9 65.2 17.0 8.9 0.5 1.1 0.3 <0.1 0.1 0.1 100 7.4 109.8Southern NSW Mean 0.1 4.3 0.3 0.1 0.1 1.9 64.7 17.2 9.2 0.5 1.1 0.3 <0.1 0.1 0.1 100 7.4 110.5
NSW Mean 0.1 4.2 0.3 0.1 0.1 2.2 65.6 17.1 8.2 0.5 1.1 0.3 <0.1 0.1 0.1 100 7.5 108.5NSW Min 0.1 3.9 0.3 0.1 0.1 1.9 61.9 13.8 2.9 0.5 1.0 0.2 <0.1 0.1 0.1 100 7.2 98.9NSW Max 0.1 4.6 0.3 0.2 0.2 2.7 71.0 19.4 9.8 0.6 1.2 0.3 0.1 0.2 0.2 100 7.9 112.9
1Sat - Sum of the saturated fatty acids including 14:0, 16:0, 17:0, 18:0, 20:0 and 24:02 Iodine Value - Calculated from the fatty acid composition
24
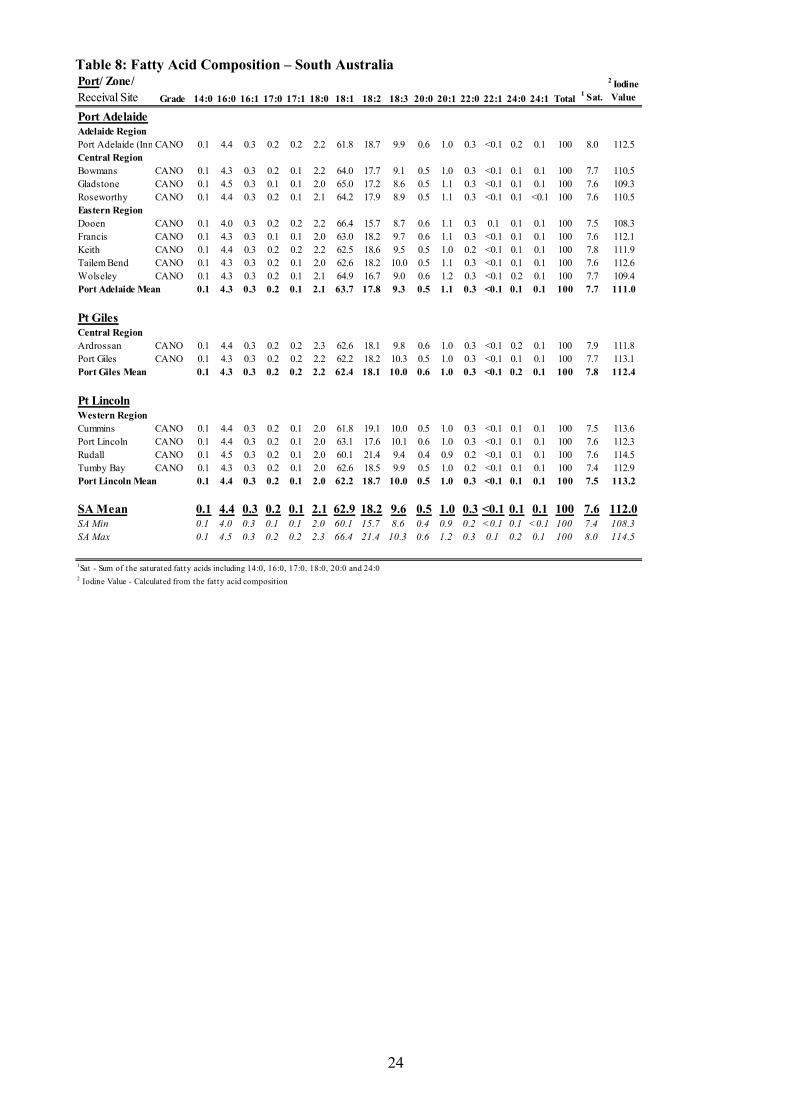
Table 8: Fatty Acid Composition – South Australia Port/ Zone/ Receival Site Grade 14:0 16:0 16:1 17:0 17:1 18:0 18:1 18:2 18:3 20:0 20:1 22:0 22:1 24:0 24:1 Total 1 Sat.
2 Iodine Value
Port AdelaideAdelaide RegionPort Adelaide (Inn CANO 0.1 4.4 0.3 0.2 0.2 2.2 61.8 18.7 9.9 0.6 1.0 0.3 <0.1 0.2 0.1 100 8.0 112.5Central RegionBowmans CANO 0.1 4.3 0.3 0.2 0.1 2.2 64.0 17.7 9.1 0.5 1.0 0.3 <0.1 0.1 0.1 100 7.7 110.5Gladstone CANO 0.1 4.5 0.3 0.1 0.1 2.0 65.0 17.2 8.6 0.5 1.1 0.3 <0.1 0.1 0.1 100 7.6 109.3Roseworthy CANO 0.1 4.4 0.3 0.2 0.1 2.1 64.2 17.9 8.9 0.5 1.1 0.3 <0.1 0.1 <0.1 100 7.6 110.5Eastern RegionDooen CANO 0.1 4.0 0.3 0.2 0.2 2.2 66.4 15.7 8.7 0.6 1.1 0.3 0.1 0.1 0.1 100 7.5 108.3Francis CANO 0.1 4.3 0.3 0.1 0.1 2.0 63.0 18.2 9.7 0.6 1.1 0.3 <0.1 0.1 0.1 100 7.6 112.1Keith CANO 0.1 4.4 0.3 0.2 0.2 2.2 62.5 18.6 9.5 0.5 1.0 0.2 <0.1 0.1 0.1 100 7.8 111.9Tailem Bend CANO 0.1 4.3 0.3 0.2 0.1 2.0 62.6 18.2 10.0 0.5 1.1 0.3 <0.1 0.1 0.1 100 7.6 112.6Wolseley CANO 0.1 4.3 0.3 0.2 0.1 2.1 64.9 16.7 9.0 0.6 1.2 0.3 <0.1 0.2 0.1 100 7.7 109.4Port Adelaide Mean 0.1 4.3 0.3 0.2 0.1 2.1 63.7 17.8 9.3 0.5 1.1 0.3 <0.1 0.1 0.1 100 7.7 111.0
Pt GilesCentral RegionArdrossan CANO 0.1 4.4 0.3 0.2 0.2 2.3 62.6 18.1 9.8 0.6 1.0 0.3 <0.1 0.2 0.1 100 7.9 111.8Port Giles CANO 0.1 4.3 0.3 0.2 0.2 2.2 62.2 18.2 10.3 0.5 1.0 0.3 <0.1 0.1 0.1 100 7.7 113.1Port Giles Mean 0.1 4.3 0.3 0.2 0.2 2.2 62.4 18.1 10.0 0.6 1.0 0.3 <0.1 0.2 0.1 100 7.8 112.4
Pt LincolnWestern RegionCummins CANO 0.1 4.4 0.3 0.2 0.1 2.0 61.8 19.1 10.0 0.5 1.0 0.3 <0.1 0.1 0.1 100 7.5 113.6Port Lincoln CANO 0.1 4.4 0.3 0.2 0.1 2.0 63.1 17.6 10.1 0.6 1.0 0.3 <0.1 0.1 0.1 100 7.6 112.3Rudall CANO 0.1 4.5 0.3 0.2 0.1 2.0 60.1 21.4 9.4 0.4 0.9 0.2 <0.1 0.1 0.1 100 7.6 114.5Tumby Bay CANO 0.1 4.3 0.3 0.2 0.1 2.0 62.6 18.5 9.9 0.5 1.0 0.2 <0.1 0.1 0.1 100 7.4 112.9Port Lincoln Mean 0.1 4.4 0.3 0.2 0.1 2.0 62.2 18.7 10.0 0.5 1.0 0.3 <0.1 0.1 0.1 100 7.5 113.2
SA Mean 0.1 4.4 0.3 0.2 0.1 2.1 62.9 18.2 9.6 0.5 1.0 0.3 <0.1 0.1 0.1 100 7.6 112.0SA Min 0.1 4.0 0.3 0.1 0.1 2.0 60.1 15.7 8.6 0.4 0.9 0.2 <0.1 0.1 <0.1 100 7.4 108.3SA Max 0.1 4.5 0.3 0.2 0.2 2.3 66.4 21.4 10.3 0.6 1.2 0.3 0.1 0.2 0.1 100 8.0 114.5
1Sat - Sum of the saturated fatty acids including 14:0, 16:0, 17:0, 18:0, 20:0 and 24:02 Iodine Value - Calculated from the fatty acid composition

25
Table 9: Fatty Acid Composition – Victoria
Region/ Zone Grade 14:0 16:0 16:1 17:0 17:1 18:0 18:1 18:2 18:3 20:0 20:1 22:0 22:1 24:0 24:1 Total1 Sat.
2 Iodine Value
North West VicHosham EastMurtoa Sub CAN 0.1 4.2 0.3 0.2 0.1 2.0 63.4 18.0 9.5 0.5 1.1 0.3 <0.1 0.2 0.2 100 7.5 111.6Murtoa Sub CANG 0.1 4.4 0.3 0.1 0.1 2.2 63.2 17.6 10.0 0.5 1.0 0.2 <0.1 0.1 0.1 100 7.7 112.0Warracknabeal CAN 0.1 4.3 0.3 0.2 0.1 2.0 61.9 19.3 9.8 0.5 1.0 0.3 <0.1 0.1 0.1 100 7.5 113.3Hosham WestGoroke CAN 0.1 4.1 0.3 0.1 0.1 1.9 65.8 16.0 9.3 0.6 1.2 0.3 <0.1 0.2 0.2 100 7.2 109.7Lillimur CAN 0.1 4.4 0.3 0.2 0.2 2.1 64.6 17.0 8.9 0.6 1.1 0.3 <0.1 0.2 0.1 100 7.8 109.4Naracoorte CAN 0.1 4.2 0.3 0.2 0.1 2.0 63.1 17.1 10.5 0.6 1.1 0.3 <0.1 0.2 0.2 100 7.5 112.5Natimuk CAN 0.1 4.2 0.3 0.1 0.1 1.9 65.5 16.4 9.2 0.5 1.1 0.3 <0.1 0.2 0.1 100 7.2 110.0Nhill CAN 0.1 4.3 0.3 0.2 0.2 2.1 63.3 18.5 9.0 0.5 1.0 0.3 <0.1 0.2 0.2 100 7.6 111.0Ouyen NorthOuyen CAN 0.1 4.5 0.3 0.2 0.1 2.1 60.7 19.9 10.3 0.4 0.9 0.2 0.1 0.1 0.1 100 7.6 114.6Ouyen SouthBeulah CAN 0.1 4.3 0.3 0.2 0.1 2.1 61.1 19.8 10.2 0.5 0.9 0.2 <0.1 0.1 0.1 100 7.4 114.4Rainbow CAN 0.1 4.5 0.3 0.2 0.1 2.0 60.9 20.4 9.7 0.5 0.9 0.2 <0.1 0.1 0.1 100 7.6 114.1Swan Hill NorthManangatang CAN 0.1 4.2 0.3 0.2 0.2 2.2 62.3 18.7 10.1 0.5 0.9 0.2 <0.1 0.1 0.1 100 7.5 113.2Piangil CAN 0.1 4.2 0.3 0.2 0.1 2.3 64.2 17.3 9.3 0.5 1.0 0.2 <0.1 0.1 0.1 100 7.6 110.7Ultima CAN 0.1 4.1 0.3 0.2 0.2 2.4 63.3 17.9 9.4 0.5 1.0 0.3 <0.1 0.1 0.1 100 7.8 111.2Swan Hill SouthQuambatook CAN 0.1 4.3 0.3 0.2 0.1 2.1 62.8 18.6 9.7 0.5 1.0 0.2 <0.1 0.1 0.1 100 7.4 112.5North West Mean 0.1 4.3 0.3 0.2 0.1 2.0 63.6 17.8 9.5 0.5 1.0 0.3 <0.1 0.1 0.1 100 7.5 111.6
South East VicDunollyBoort CAN 0.1 4.2 0.3 0.2 0.1 2.1 65.6 16.6 8.7 0.6 1.1 0.3 0.1 0.1 0.1 100 7.5 109.0Donald CAN 0.1 4.1 0.3 0.2 0.1 2.1 62.5 18.7 9.8 0.5 1.0 0.2 <0.1 0.1 0.1 100 7.4 112.9Dunolly Sub CAN 0.1 4.2 0.3 0.1 0.1 1.8 63.9 18.3 9.2 0.5 1.1 0.3 <0.1 0.1 0.1 100 7.2 111.6ElmoreBarnes Crossing CAN 0.1 4.4 0.3 0.1 0.1 2.0 64.9 17.1 8.9 0.5 1.0 0.3 <0.1 0.1 0.1 100 7.5 109.9Deniliquin CAN 0.1 4.3 0.3 0.1 0.1 1.9 64.8 17.3 9.0 0.5 1.0 0.3 <0.1 0.1 0.1 100 7.4 110.3Elmore CAN 0.1 4.4 0.3 0.1 0.1 1.9 62.4 19.9 9.0 0.5 1.0 0.2 <0.1 0.1 0.1 100 7.3 112.6Mitiamo CAN 0.1 4.3 0.3 0.1 0.1 1.9 64.2 18.1 9.0 0.5 1.0 0.2 <0.1 0.1 0.1 100 7.3 111.1Murchison East CAN 0.1 4.1 0.3 0.1 0.1 1.9 66.0 16.5 8.8 0.5 1.0 0.3 <0.1 0.1 0.1 100 7.2 109.5Tandarra CAN 0.1 4.3 0.3 0.1 0.1 1.9 64.6 17.8 8.8 0.5 1.0 0.3 <0.1 0.1 0.1 100 7.2 110.5WestmereBerrybank CAN 0.1 4.3 0.3 0.1 0.1 1.9 63.1 18.2 10.0 0.5 1.0 0.2 <0.1 0.1 0.1 100 7.2 113.0Hamilton CAN 0.1 4.3 0.3 0.2 0.1 1.9 63.3 17.7 10.1 0.5 1.0 0.3 <0.1 0.1 0.1 100 7.3 112.6Westmere CAN 0.1 4.3 0.3 0.1 0.1 1.8 62.4 18.8 10.1 0.5 1.0 0.3 <0.1 0.1 0.2 100 7.3 113.6Willaura CAN 0.1 4.3 0.3 0.1 0.1 1.8 63.7 17.6 10.0 0.5 1.1 0.3 <0.1 0.1 0.2 100 7.2 112.5YarrawongaDookie CAN 0.1 4.1 0.2 0.1 0.1 2.0 67.1 16.2 8.0 0.6 1.0 0.3 <0.1 0.1 0.1 100 7.3 107.6Oaklands CAN 0.1 4.3 0.3 0.1 0.1 1.9 66.4 15.8 8.9 0.5 1.1 0.3 0.1 0.2 0.2 100 7.3 108.8Oaklands CANG 0.1 4.4 0.3 0.1 0.1 2.3 63.7 17.9 8.9 0.6 1.0 0.3 <0.1 0.2 0.1 100 8.0 110.1St James CANG 0.1 4.3 0.3 0.1 0.1 2.4 64.5 17.4 8.6 0.6 1.0 0.3 <0.1 0.2 0.2 100 8.0 109.1Tocumwal CAN 0.1 4.1 0.3 0.1 0.1 1.8 66.1 16.2 8.7 0.5 1.1 0.3 <0.1 0.2 0.3 100 7.2 108.9Yarrawonga CAN 0.1 4.2 0.3 0.1 0.1 2.0 66.7 16.2 8.3 0.5 1.0 0.3 <0.1 0.1 0.2 100 7.3 108.1South East Mean 0.1 4.3 0.3 0.1 0.1 1.9 64.4 17.6 9.1 0.5 1.0 0.3 <0.1 0.1 0.1 100 7.3 110.9
Victoria Mean 0.1 4.3 0.3 0.1 0.1 2.0 64.2 17.7 9.2 0.5 1.0 0.3 <0.1 0.1 0.1 100 7.3 111.0Victoria Min 0.1 4.1 0.2 0.1 0.1 1.8 60.7 15.8 8.0 0.4 0.9 0.2 <0.1 0.1 0.1 100 7.2 107.6Victoria Max 0.1 4.5 0.3 0.2 0.2 2.4 67.1 20.4 10.5 0.6 1.2 0.3 0.1 0.2 0.3 100 8.0 114.6
1Sat - Sum of the saturated fatty acids including 14:0, 16:0, 17:0, 18:0, 20:0 and 24:02 Iodine Value - Calculated from the fatty acid composition
26
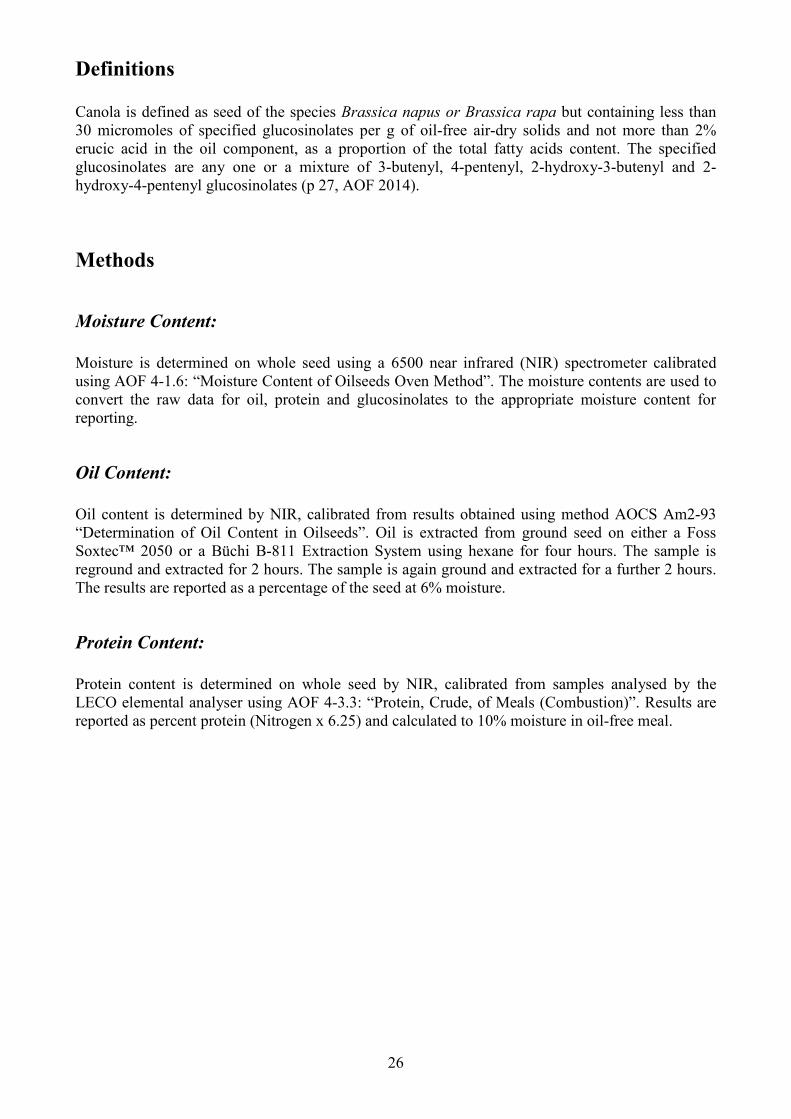
Definitions Canola is defined as seed of the species Brassica napus or Brassica rapa but containing less than 30 micromoles of specified glucosinolates per g of oil-free air-dry solids and not more than 2% erucic acid in the oil component, as a proportion of the total fatty acids content. The specified glucosinolates are any one or a mixture of 3-butenyl, 4-pentenyl, 2-hydroxy-3-butenyl and 2-hydroxy-4-pentenyl glucosinolates (p 27, AOF 2014).
Methods
Moisture Content: Moisture is determined on whole seed using a 6500 near infrared (NIR) spectrometer calibrated using AOF 4-1.6: “Moisture Content of Oilseeds Oven Method”. The moisture contents are used to convert the raw data for oil, protein and glucosinolates to the appropriate moisture content for reporting.
Oil Content: Oil content is determined by NIR, calibrated from results obtained using method AOCS Am2-93 “Determination of Oil Content in Oilseeds”. Oil is extracted from ground seed on either a Foss Soxtec™ 2050 or a Büchi B-811 Extraction System using hexane for four hours. The sample is reground and extracted for 2 hours. The sample is again ground and extracted for a further 2 hours. The results are reported as a percentage of the seed at 6% moisture.
Protein Content: Protein content is determined on whole seed by NIR, calibrated from samples analysed by the LECO elemental analyser using AOF 4-3.3: “Protein, Crude, of Meals (Combustion)”. Results are reported as percent protein (Nitrogen x 6.25) and calculated to 10% moisture in oil-free meal.

27
Glucosinolate Content: Total glucosinolate concentration is determined by NIR, calibrated by method AOF 4-1.22: “Glucosinolate Content, Glucose Method, Canola and Rapeseed”. The method involves an enzymatic hydrolysis to release glucose followed by a colorimetric reaction and determination by a UV-Vis spectrophotometer. The method has compared favourably with the HPLC methodology of the AOCS with the added advantage of speed and economy. Results are reported as µmoles glucosinolates/gram whole seed at 6% moisture.
Fatty Acid Composition: Fatty acid composition involves methylation of fatty acids with a methanolic solution of potassium hydroxide. The method is based on IOC COI/T.20/Doc. No. 24 2001: “Preparation of the Fatty Acid Methyl Esters from Olive Oil and Olive-Pomace Oil”. The methyl esters are then separated on a gas chromatograph using a BPX70 capillary column. Fatty acids are reported as a percentage of the total fatty acids.
Iodine Values: Iodine values are calculated from the fatty acid profile using AOF 4-2.14: “Iodine Value by Fatty Acid Composition”.
Volumetric Grain Weights: Volumetric grain weights are measured using a Franklin chrondrometer and reported as both pounds/bushel and kilograms/hectolitre.
References Australian Oilseeds Federation Section 1: Quality Standards, Technical Information & Typical Analysis (2014) Issue 13 p 27

Qu
ality of A
ustralian
cano
la 20
14
–15
Related Documents