RESEARCH ARTICLE Open Access Quality improvement strategies at primary care level to reduce inequalities in diabetes care: an equity-oriented systematic review Natalie Terens 1 , Simona Vecchi 2* , Anna Maria Bargagli 2 , Nera Agabiti 2 , Zuzana Mitrova 2 , Laura Amato 2 and Marina Davoli 2 Abstract Background: There is evidence that disparities exist in diabetes prevalence, access to diabetes care, diabetes- related complications, and the quality of diabetes care. A wide range of interventions has been implemented and evaluated to improve diabetes care. We aimed to review trials of quality improvement (QI) interventions aimed to reduce health inequities among people with diabetes in primary care and to explore the extent to which experimental studies addressed and reported equity issues. Methods: Pubmed, EMBASE, CINAHL, and the Cochrane Library were searched to identify randomized controlled studies published between January 2005 and May 2016. We adopted the PROGRESS Plus framework, as a tool to explore differential effects of QI interventions across sociodemographic and economic factors. Results: From 1903 references fifty-eight randomized trials met the inclusion criteria (with 17.786 participants), mostly carried out in USA. The methodological quality was good for all studies. Almost all studies reported the age, gender/sex and race distribution of study participants. The majority of trials additionally used at least one further PROGRESS-Plus factor at baseline, with education being the most commonly used, followed by income (55%). Large variation was observed between these studies for type of interventions, target populations, and outcomes evaluated. Few studies examined differential intervention effects by PROGRESS-plus factors. Existing evidence suggests that some QI intervention delivered in primary care can improve diabetes-related health outcomes in social disadvantaged population subgroups such as ethnic minorities. However, we found very few studies comparing health outcomes between population subgroups and reporting differential effect estimates of QI interventions. Conclusions: This review provides evidence that QI interventions for people with diabetes is feasible to implement and highly acceptable. However, more research is needed to understand their effective components as well as the adoption of an equity-oriented approach in conducting primary studies. Moreover, a wider variety of socio-economic characteristics such as social capital, place of residence, occupation, education, and religion should be addressed. Keywords: Type 2 diabetes, Quality improvement strategies, Equity, Systematic review * Correspondence: [email protected] 2 Department of Epidemiology, Lazio Region- ASL Rome1, Rome, Italy Full list of author information is available at the end of the article © The Author(s). 2018 Open Access This article is distributed under the terms of the Creative Commons Attribution 4.0 International License (http://creativecommons.org/licenses/by/4.0/), which permits unrestricted use, distribution, and reproduction in any medium, provided you give appropriate credit to the original author(s) and the source, provide a link to the Creative Commons license, and indicate if changes were made. The Creative Commons Public Domain Dedication waiver (http://creativecommons.org/publicdomain/zero/1.0/) applies to the data made available in this article, unless otherwise stated. Terens et al. BMC Endocrine Disorders (2018) 18:31 https://doi.org/10.1186/s12902-018-0260-4

Welcome message from author
This document is posted to help you gain knowledge. Please leave a comment to let me know what you think about it! Share it to your friends and learn new things together.
Transcript
RESEARCH ARTICLE Open Access
Quality improvement strategies at primarycare level to reduce inequalities in diabetescare: an equity-oriented systematic reviewNatalie Terens1, Simona Vecchi2* , Anna Maria Bargagli2, Nera Agabiti2, Zuzana Mitrova2, Laura Amato2
and Marina Davoli2
Abstract
Background: There is evidence that disparities exist in diabetes prevalence, access to diabetes care, diabetes-related complications, and the quality of diabetes care. A wide range of interventions has been implemented andevaluated to improve diabetes care. We aimed to review trials of quality improvement (QI) interventions aimed toreduce health inequities among people with diabetes in primary care and to explore the extent to which experimentalstudies addressed and reported equity issues.
Methods: Pubmed, EMBASE, CINAHL, and the Cochrane Library were searched to identify randomized controlledstudies published between January 2005 and May 2016. We adopted the PROGRESS Plus framework, as a toolto explore differential effects of QI interventions across sociodemographic and economic factors.
Results: From 1903 references fifty-eight randomized trials met the inclusion criteria (with 17.786 participants),mostly carried out in USA. The methodological quality was good for all studies. Almost all studies reported theage, gender/sex and race distribution of study participants. The majority of trials additionally used at least one furtherPROGRESS-Plus factor at baseline, with education being the most commonly used, followed by income (55%). Largevariation was observed between these studies for type of interventions, target populations, and outcomes evaluated.Few studies examined differential intervention effects by PROGRESS-plus factors. Existing evidence suggests that someQI intervention delivered in primary care can improve diabetes-related health outcomes in social disadvantagedpopulation subgroups such as ethnic minorities. However, we found very few studies comparing health outcomesbetween population subgroups and reporting differential effect estimates of QI interventions.
Conclusions: This review provides evidence that QI interventions for people with diabetes is feasible to implementand highly acceptable. However, more research is needed to understand their effective components as well as theadoption of an equity-oriented approach in conducting primary studies. Moreover, a wider variety of socio-economiccharacteristics such as social capital, place of residence, occupation, education, and religion should be addressed.
Keywords: Type 2 diabetes, Quality improvement strategies, Equity, Systematic review
* Correspondence: [email protected] of Epidemiology, Lazio Region- ASL Rome1, Rome, ItalyFull list of author information is available at the end of the article
© The Author(s). 2018 Open Access This article is distributed under the terms of the Creative Commons Attribution 4.0International License (http://creativecommons.org/licenses/by/4.0/), which permits unrestricted use, distribution, andreproduction in any medium, provided you give appropriate credit to the original author(s) and the source, provide a link tothe Creative Commons license, and indicate if changes were made. The Creative Commons Public Domain Dedication waiver(http://creativecommons.org/publicdomain/zero/1.0/) applies to the data made available in this article, unless otherwise stated.
Terens et al. BMC Endocrine Disorders (2018) 18:31 https://doi.org/10.1186/s12902-018-0260-4
BackgroundDiabetes is a complex, chronic disease recognized as animportant cause of premature death and disability [1]and disproportionately affects socially and economicallydisadvantaged populations [2–4]. According the Na-tional Institute for Health and Care Excellence guide-lines [5], patients with type 2 diabetes should receive aclear gamut of care to be provided by primary care pro-viders. Annual routine monitoring of health indicatorssuch as urinary albumin, BMI, cholesterol, blood creatin-ine, HbA1c and BP measured, eyes and feet examinedand a smoking review, forms a major part of patient dia-betes care. In addition patients should expect to receivean evidenced-based education and access to specialisthealthcare professionals including ophthalmologists, po-diatrists and dieticians.Quality of care among diabetic patient can be influenced
by a range of factors that has been already described. Pre-vious systematic reviews showed that low individualsocio-economic status and residential area deprivation areoften associated with both worse process indicators andworse intermediate outcomes among patients with type 2diabetes [6]. These differences are present even in coun-tries with a significant level of economic development thathave a universal health care system. Moreover, disparitiesin diabetes care exist among racial or ethnic minoritygroups, independent of economic status [7].To improve diabetes care, it might be important to focus
on quality management (QM), especially because the com-plexity of healthcare system and patients complexities hasdramatically increased. QM comprises procedures to moni-tor, assess, and enhance the quality of care. In the last yearsmany countries have developed quality improvement inter-ventions (QI) to improve both patient outcomes and thequality of diabetes care [8, 9]. A meta-analysis of studies in-vestigating QI strategies [10] found that interventions target-ing the entire system of disease management (team changes,case management, promotion of self-management) alongwith patient-mediated QI activities were important compo-nents of strategies to improve diabetes care. However, thestudies included in this review were targeted to the generalpopulation, irrespective of socio-demographic characteristicsor socio-economic status.Acknowledging the existence of such disparities, our
aims are to: a) describe the extent to which effects on so-cial inequalities are considered in randomized controlledtrials (RCTs) evaluating the effects of QI interventions toimprove quality of diabetes care and b) synthesize evi-dence on the effectiveness of QI strategies to reducehealth inequities in diabetes care in the primary care set-ting. We conducted an equity-oriented systematic reviewincluding RCTs only, using an international taxonomy ofQI interventions, and assessing the quality of includedstudies with a methodological rating tool.
MethodsFor the purpose of the review, a “socially disadvantagedgroup” is defined by differences that place the group at dis-tinct levels in a social hierarchy. To explicitly considerhealth equity and to capture characteristics possibly indicat-ing disadvantaged status, we adopted the PROGRESS-Plusframework recommended by the Campbell and CochraneEquity Methods Group and the Cochrane Public HealthGroup to identify studies with a focus on reducing healthinequalities [11]. PROGRESS-Plus stands for place of resi-dence, race/ethnicity/culture/language, occupation, gender/sex, religion, socioeconomic status and social capital. Thissystematic review was conducted in accordance withPRISMA-E 2012 (Preferred Reporting Items for SystematicReviews and Meta-Analyses, Equity 2012 Extension), a vali-dated tool to improve both the reporting and conducting ofequity focused systematic reviews, were upheld in this re-view [12].
Data sources and searchesWe searched all relevant biomedical databases such asPubmed, EMBASE, CINAHL, and the Cochrane Li-brary for relevant published RCTs and cluster-RCTspublished in English. We limited the search from 1January 2005 to 31 May 2016. A combination of MeSHterms and keywords were chosen to reflect selection cri-teria tailored to each database. Details of the full searchstrategy for PubMed are included in supplemental mater-ial (Additional file 1). In addition, we scanned the refer-ence lists of relevant reviews to track relevant RCTs.
Study selectionTwo authors (NT, AMB) independently screened all titleand abstracts of all studies obtained from electronicsearches. For studies meeting the inclusion criteria, weretrieved full texts and the same authors independentlyevaluated them for inclusion. Any disagreements wereresolved through consensus or in discussion with the ex-tended authorial group.We used the “population, intervention, comparison,
outcome, setting” (PICOS) logic to guide the systematicreview (Additional file 2). We included randomized con-trolled trials (RCTs) and cluster-randomized trials,evaluating all QI interventions designed to improvehealth outcomes in social disadvantaged people withtype 2 diabetes and designed to reduce inequalities indiabetes care. We considered studies that reported quan-titative estimates of total effect of treatment and differ-ential effects for the PROGRESS-Plus factors.We used the Agency for Healthcare Research and
Quality [13] taxonomy to identify QI strategies(Additional file 3). QI strategies can be delivered tospecific levels of influence:
Terens et al. BMC Endocrine Disorders (2018) 18:31 Page 2 of 18
� Patient level (e.g. patient education, patientreminders, or promotion of self-management);
� Health care provider level (e.g. electronic medicalrecord reminders, audit & feedback, culturalcompetency training);
� Health care system level (e.g. change in the healthsystem structure or delivery, adjusting roles of careteam members, nurse care management model).
Data extraction and quality assessmentTwo authors independently extracted data (NT, SV), anddisagreements were resolved by discussion. Data frommultiple publications of the same study was consideredas a single study. A data extraction form was designed todocument the following study details: trials characteris-tics; participants (total number at baseline, age range,gender, clinical features); type of intervention and com-parator; clinical and no clinical outcomes; timing; risk ofbias; study results. For continuous outcomes, we ex-tracted the mean change from baseline (with the stand-ard deviation) and the mean difference, if available, withthe corresponding 95% confidence interval (CIs). Relativerisk (RR), and absolute risk differences, with the corre-sponding 95% CI, was extracted for binary primary out-comes. If studies reported data for more than one timepoint, we extracted data for the longest-term outcomes.Baseline population characteristics relevant for ad-
dressing potential issues in health equity were extractedusing the PROGRESS-Plus framework. We extracteddata on outcome assessed, according to whetherPROGRESS-Plus factors were considered as control vari-ables (e.g., by adjusting in regression analyses) and themethods utilized to investigate differential effects (strati-fied analysis or modification/interaction analysis). Wealso extracted details on the duration of intervention,duration of follow up, health professional group in-volved, details of the strategy being implemented (i.e.modality, delivery format).Two authors independently assessed risk of bias of in-
cluded studies using the Cochrane ‘Risk of bias’ tool forRCTs [14]. We considering the following domains: se-quence generation, allocation concealment, blinding ofparticipants and personnel, blinding of outcome assess-ment, incomplete data, selective reporting, and otherbiases. For each domain, risk of bias was classified as“high,” “low,” or “unclear”. Since we includedcluster-randomized controlled trials, additional itemswere considered: (1) recruitment bias: did recruitment ofdiabetes patients take place before or afterrandomization of the clusters?, (2) did the interventionand control group differ in baseline characteristics?, (3)did any of the clusters drop out during follow-up, (4)was clustering accounted for in the statistical analyses?We investigated detection bias separately for objective
and subjective outcome measures. We defined clinicaland laboratory measures, process indicators, diabetescomplications, hospital admissions, emergency admis-sions and all-cause mortality as objective outcome mea-sures. We defined measures of self-management/adherence to recommendations as subjective outcomemeasures. With respect to missing data, we judged indi-vidual trials at high risk of bias if data from more than10% of participants were not available. We used thequality criteria for descriptive purposes only to highlightdifferences between studies. We used RevMan 2014 soft-ware [15] to generate figures related to risk of bias.
Data synthesisWe synthesized findings from the included studies byintervention level (patients, health care provider, andhealth care system). The wide variety of interventions(in terms of mode of delivery, frequency and duration offollow up assessment) and population groups consideredin the included studies did not allow for a meaningfulmeta-analysis to be conducted. We summarized resultsusing narrative methods. We described in more detailstudies reporting differences in QI interventions effectsacross subgroups.
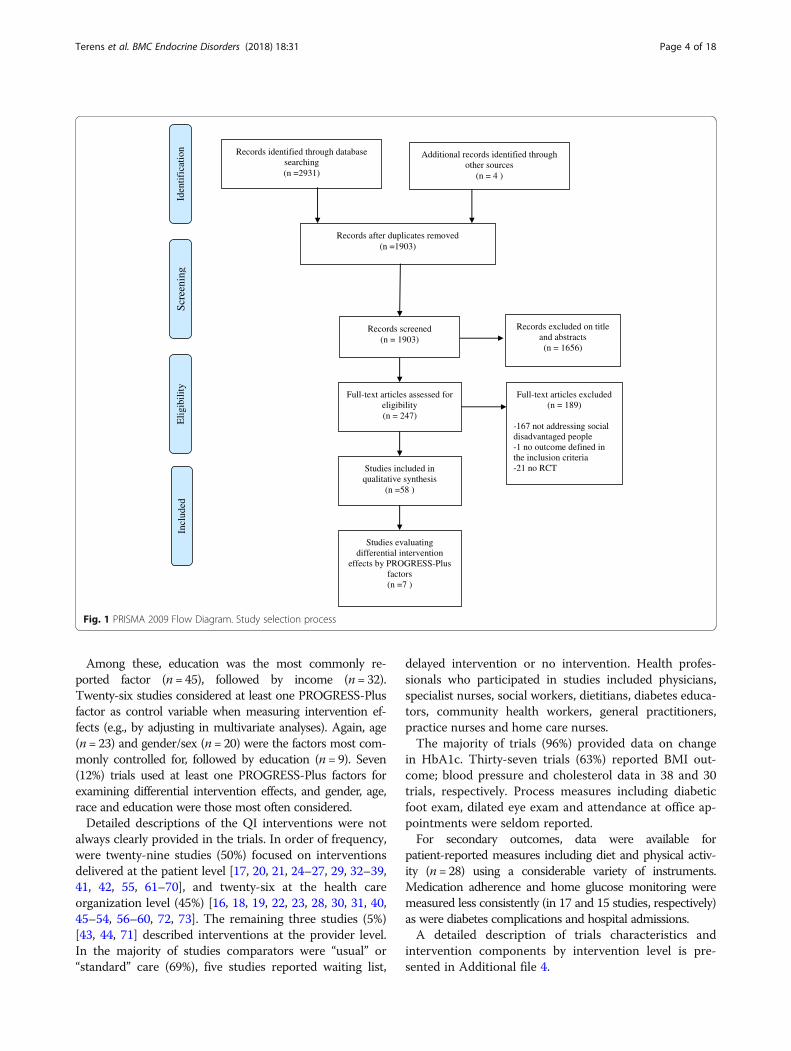
ResultsThe search strategy generated 1903 citations after remov-ing duplicates. Upon reviewing titles and abstracts, we re-trieved full text articles for 247 studies that were screenedby two authors independently (NT, AMB). We excluded189 trials. Most common reasons for exclusion were notaddressing a socially disadvantaged group, an evaluationof primary prevention intervention, and being conductedin a setting other than primary care. Fifty-eight RCTs meteligibility criteria. PRISMA Flow Diagram Fig. 1 shows thedetails of study selection process.
Overview of the included studiesA substantial synthesis of the characteristics of all 58studies included in this review is reported in Table 1.Overall the majority of studies (n = 54) used a parallelRCT design while four trials were cluster RCTs [16–19].Follow-up periods varied in duration from less than 1month to 5 years, with the majority lasting 6 to12 months. Most of trials were conducted in the USA(n = 47); the remaining studies were carried out inCanada [20], Asia [21], the United Kingdom [16], NewZealand [22], Australia [19], Trinidad and AmericanSamoa [18, 23].Almost all studies reported the age, gender/sex and
race distribution of study participants. The majority ofstudies additionally used at least one furtherPROGRESS-Plus factor for the description of partici-pants’ baseline characteristics.
Terens et al. BMC Endocrine Disorders (2018) 18:31 Page 3 of 18
Among these, education was the most commonly re-ported factor (n = 45), followed by income (n= 32).Twenty-six studies considered at least one PROGRESS-Plusfactor as control variable when measuring intervention ef-fects (e.g., by adjusting in multivariate analyses). Again, age(n= 23) and gender/sex (n= 20) were the factors most com-monly controlled for, followed by education (n = 9). Seven(12%) trials used at least one PROGRESS-Plus factors forexamining differential intervention effects, and gender, age,race and education were those most often considered.Detailed descriptions of the QI interventions were not
always clearly provided in the trials. In order of frequency,were twenty-nine studies (50%) focused on interventionsdelivered at the patient level [17, 20, 21, 24–27, 29, 32–39,41, 42, 55, 61–70], and twenty-six at the health careorganization level (45%) [16, 18, 19, 22, 23, 28, 30, 31, 40,45–54, 56–60, 72, 73]. The remaining three studies (5%)[43, 44, 71] described interventions at the provider level.In the majority of studies comparators were “usual” or“standard” care (69%), five studies reported waiting list,
delayed intervention or no intervention. Health profes-sionals who participated in studies included physicians,specialist nurses, social workers, dietitians, diabetes educa-tors, community health workers, general practitioners,practice nurses and home care nurses.The majority of trials (96%) provided data on change
in HbA1c. Thirty-seven trials (63%) reported BMI out-come; blood pressure and cholesterol data in 38 and 30trials, respectively. Process measures including diabeticfoot exam, dilated eye exam and attendance at office ap-pointments were seldom reported.For secondary outcomes, data were available for
patient-reported measures including diet and physical activ-ity (n= 28) using a considerable variety of instruments.Medication adherence and home glucose monitoring weremeasured less consistently (in 17 and 15 studies, respectively)as were diabetes complications and hospital admissions.A detailed description of trials characteristics and
intervention components by intervention level is pre-sented in Additional file 4.
Records identified through database searching(n =2931)
Scre
enin
gIn
clud
edE
ligi
bilit
ynoi taci fi tned I
Additional records identified through other sources
(n = 4 )
Records after duplicates removed(n =1903)
Records screened(n = 1903)
Records excluded on title and abstracts(n = 1656)
Full-text articles assessed for eligibility(n = 247)
Full-text articles excluded(n = 189)
-167 not addressing social disadvantaged people-1 no outcome defined in the inclusion criteria-21 no RCTStudies included in
qualitative synthesis(n =58 )
Studies evaluating differential intervention
effects by PROGRESS-Plus factors(n =7 )
Fig. 1 PRISMA 2009 Flow Diagram. Study selection process
Terens et al. BMC Endocrine Disorders (2018) 18:31 Page 4 of 18
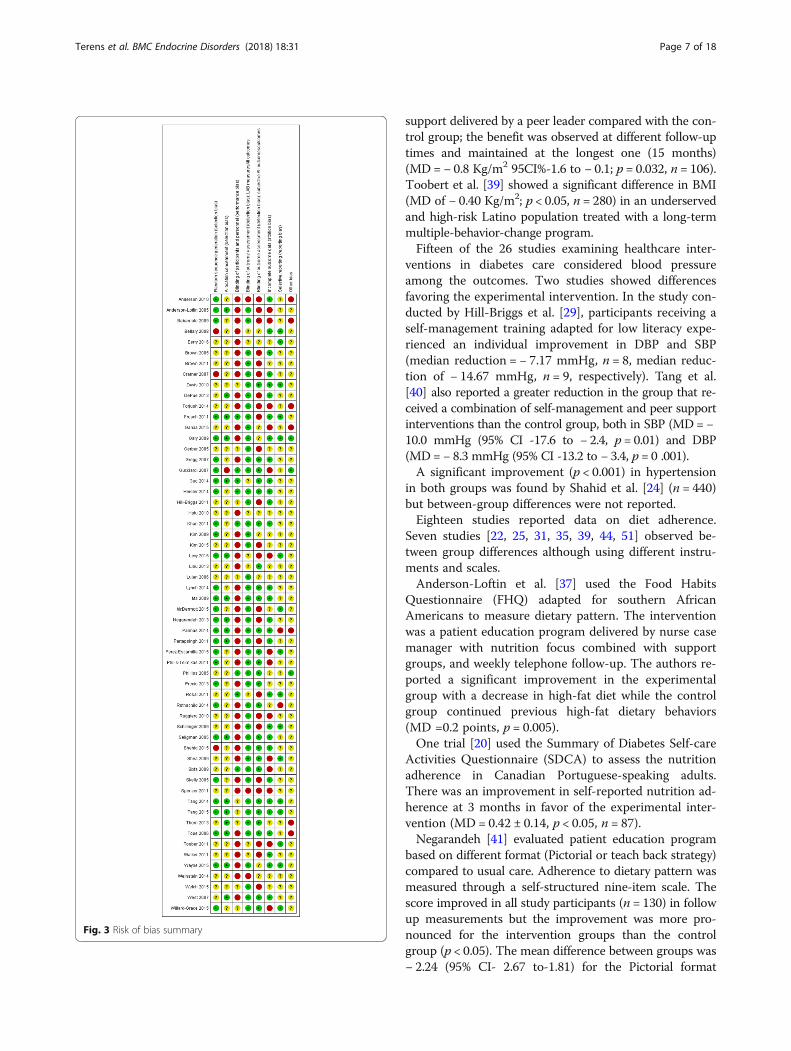
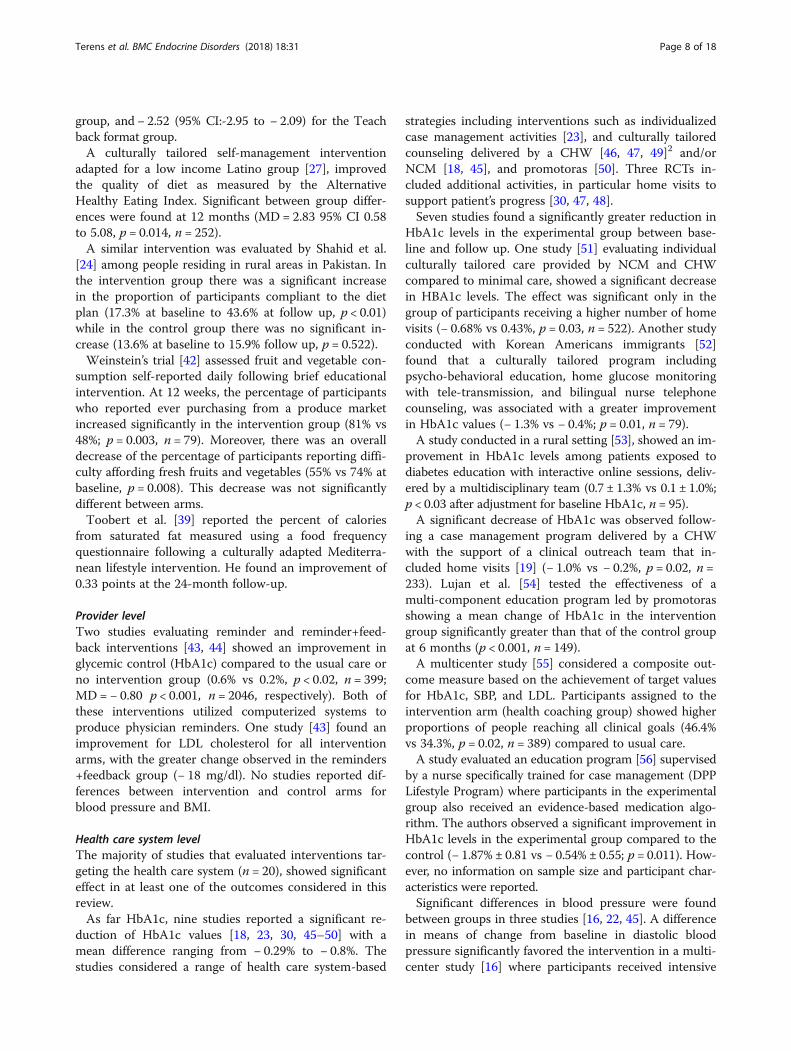
Risk of bias in included studiesA summary of ‘risk of bias’ for each study and compara-tive data across the studies is reported in Figs. 2 and 3 .All studies were described as individual RCT (n = 54) orcluster-RCTs (n = 4). None of the randomized studieshad uniformly low risk of bias. The allocation sequencewas adequately reported in 48% of the studies (28/58),with random number tables or a computer-generatedrandomized list as the most commonly used methods.One study was categorized as high risk due to the use ofa gender-based randomization procedure [24]. MostRCTs (40/58) did not describe or described in sufficientdetail the allocation concealment to allow a judgmentand were evaluated to be at unclear risk of bias.In the majority of the trials, all participants were aware
of the treatment they were receiving, and only eight
studies blinded providers [20, 21, 25–30]. For studiesreporting objective outcomes with standardized collec-tion methods (e.g. automated blood test), we assigned alow risk of detection bias (79%), as knowledge of treat-ment assignment was considered unlikely to affect theoutcome. Twenty-eight studies reporting subjective out-comes, those that used self-reported measures (i.e. ques-tionnaire on dietary habits or physical activities) were athigh risk of bias due to the lack of blinding of outcomeassessment (24 studies). In the remaining 30 studies, in-dependent research personnel who were not involved inthe intervention performed outcome assessments, whichwe evaluated as low risk of detection bias.Thirty studies were at low risk of incomplete outcome
data due to a low attrition rate (< 10%) or anintention-to-treat (ITT) analysis for primary outcomes.
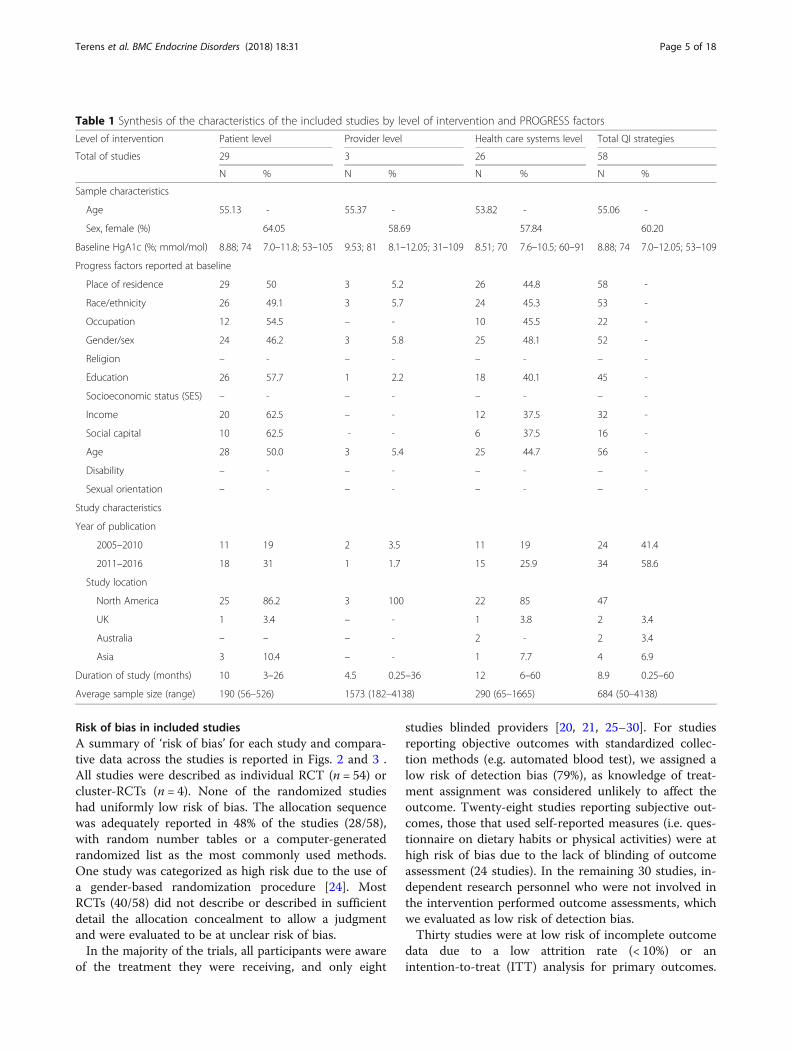
Table 1 Synthesis of the characteristics of the included studies by level of intervention and PROGRESS factors
Level of intervention Patient level Provider level Health care systems level Total QI strategies
Total of studies 29 3 26 58
N % N % N % N %
Sample characteristics
Age 55.13 - 55.37 - 53.82 - 55.06 -
Sex, female (%) 64.05 58.69 57.84 60.20
Baseline HgA1c (%; mmol/mol) 8.88; 74 7.0–11.8; 53–105 9.53; 81 8.1–12.05; 31–109 8.51; 70 7.6–10.5; 60–91 8.88; 74 7.0–12.05; 53–109
Progress factors reported at baseline
Place of residence 29 50 3 5.2 26 44.8 58 -
Race/ethnicity 26 49.1 3 5.7 24 45.3 53 -
Occupation 12 54.5 – - 10 45.5 22 -
Gender/sex 24 46.2 3 5.8 25 48.1 52 -
Religion – - – - – - – -
Education 26 57.7 1 2.2 18 40.1 45 -
Socioeconomic status (SES) – - – - – - – -
Income 20 62.5 – - 12 37.5 32 -
Social capital 10 62.5 - - 6 37.5 16 -
Age 28 50.0 3 5.4 25 44.7 56 -
Disability – - – - – - – -
Sexual orientation – - – - – - – -
Study characteristics
Year of publication
2005–2010 11 19 2 3.5 11 19 24 41.4
2011–2016 18 31 1 1.7 15 25.9 34 58.6
Study location
North America 25 86.2 3 100 22 85 47
UK 1 3.4 – - 1 3.8 2 3.4
Australia – – – - 2 - 2 3.4
Asia 3 10.4 – - 1 7.7 4 6.9
Duration of study (months) 10 3–26 4.5 0.25–36 12 6–60 8.9 0.25–60
Average sample size (range) 190 (56–526) 1573 (182–4138) 290 (65–1665) 684 (50–4138)
Terens et al. BMC Endocrine Disorders (2018) 18:31 Page 5 of 18
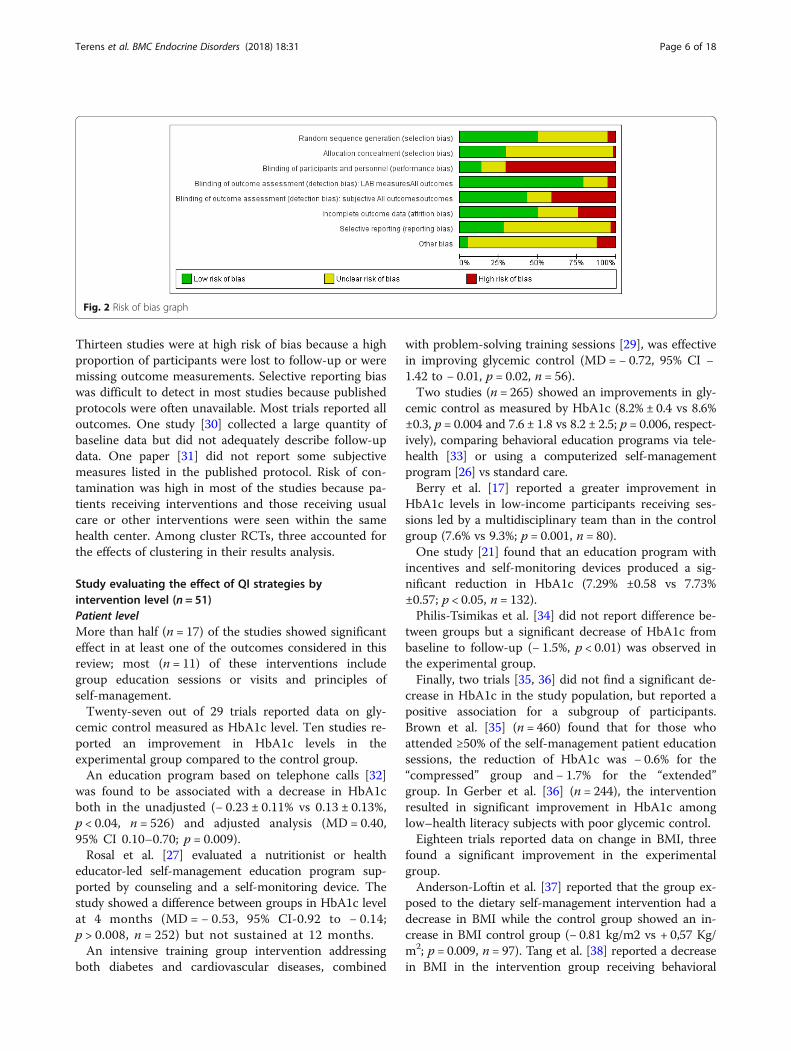
Thirteen studies were at high risk of bias because a highproportion of participants were lost to follow-up or weremissing outcome measurements. Selective reporting biaswas difficult to detect in most studies because publishedprotocols were often unavailable. Most trials reported alloutcomes. One study [30] collected a large quantity ofbaseline data but did not adequately describe follow-updata. One paper [31] did not report some subjectivemeasures listed in the published protocol. Risk of con-tamination was high in most of the studies because pa-tients receiving interventions and those receiving usualcare or other interventions were seen within the samehealth center. Among cluster RCTs, three accounted forthe effects of clustering in their results analysis.
Study evaluating the effect of QI strategies byintervention level (n = 51)Patient levelMore than half (n = 17) of the studies showed significanteffect in at least one of the outcomes considered in thisreview; most (n = 11) of these interventions includegroup education sessions or visits and principles ofself-management.Twenty-seven out of 29 trials reported data on gly-
cemic control measured as HbA1c level. Ten studies re-ported an improvement in HbA1c levels in theexperimental group compared to the control group.An education program based on telephone calls [32]
was found to be associated with a decrease in HbA1cboth in the unadjusted (− 0.23 ± 0.11% vs 0.13 ± 0.13%,p < 0.04, n = 526) and adjusted analysis (MD = 0.40,95% CI 0.10–0.70; p = 0.009).Rosal et al. [27] evaluated a nutritionist or health
educator-led self-management education program sup-ported by counseling and a self-monitoring device. Thestudy showed a difference between groups in HbA1c levelat 4 months (MD = − 0.53, 95% CI-0.92 to − 0.14;p > 0.008, n = 252) but not sustained at 12 months.An intensive training group intervention addressing
both diabetes and cardiovascular diseases, combined
with problem-solving training sessions [29], was effectivein improving glycemic control (MD = − 0.72, 95% CI −1.42 to − 0.01, p = 0.02, n = 56).Two studies (n = 265) showed an improvements in gly-
cemic control as measured by HbA1c (8.2% ± 0.4 vs 8.6%±0.3, p = 0.004 and 7.6 ± 1.8 vs 8.2 ± 2.5; p = 0.006, respect-ively), comparing behavioral education programs via tele-health [33] or using a computerized self-managementprogram [26] vs standard care.Berry et al. [17] reported a greater improvement in
HbA1c levels in low-income participants receiving ses-sions led by a multidisciplinary team than in the controlgroup (7.6% vs 9.3%; p = 0.001, n = 80).One study [21] found that an education program with
incentives and self-monitoring devices produced a sig-nificant reduction in HbA1c (7.29% ±0.58 vs 7.73%±0.57; p < 0.05, n = 132).Philis-Tsimikas et al. [34] did not report difference be-
tween groups but a significant decrease of HbA1c frombaseline to follow-up (− 1.5%, p < 0.01) was observed inthe experimental group.Finally, two trials [35, 36] did not find a significant de-
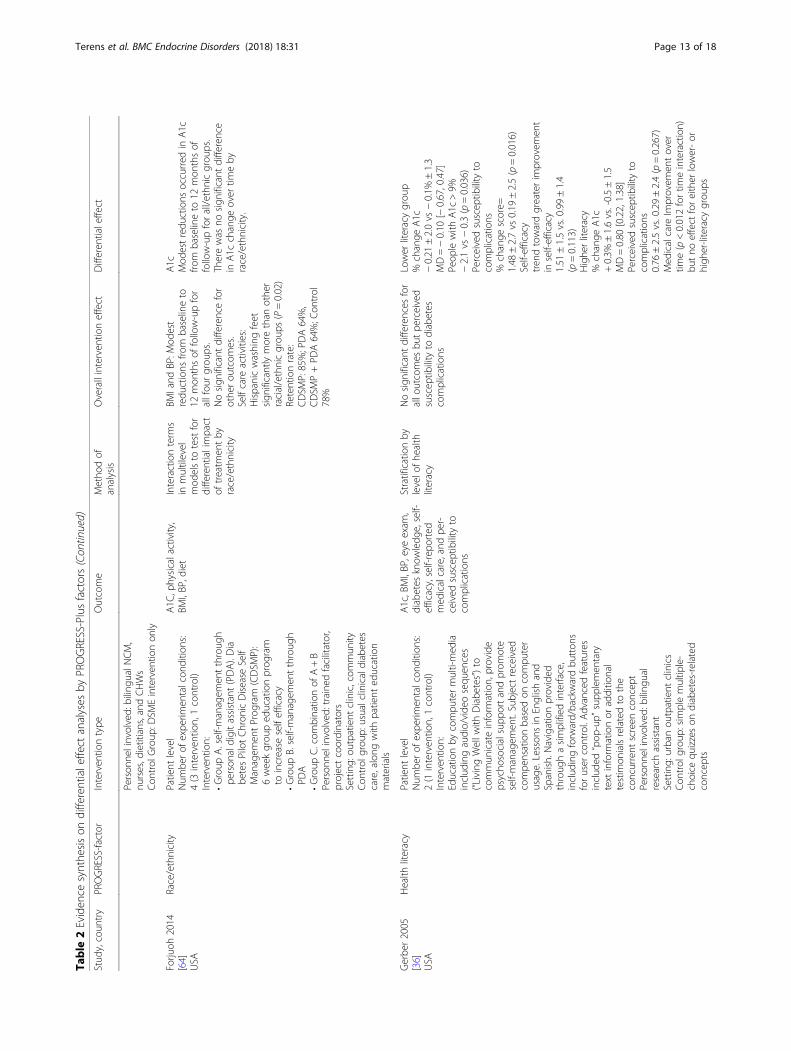
crease in HbA1c in the study population, but reported apositive association for a subgroup of participants.Brown et al. [35] (n = 460) found that for those whoattended ≥50% of the self-management patient educationsessions, the reduction of HbA1c was − 0.6% for the“compressed” group and − 1.7% for the “extended”group. In Gerber et al. [36] (n = 244), the interventionresulted in significant improvement in HbA1c amonglow–health literacy subjects with poor glycemic control.Eighteen trials reported data on change in BMI, three
found a significant improvement in the experimentalgroup.Anderson-Loftin et al. [37] reported that the group ex-
posed to the dietary self-management intervention had adecrease in BMI while the control group showed an in-crease in BMI control group (− 0.81 kg/m2 vs + 0,57 Kg/m2; p = 0.009, n = 97). Tang et al. [38] reported a decreasein BMI in the intervention group receiving behavioral
Fig. 2 Risk of bias graph
Terens et al. BMC Endocrine Disorders (2018) 18:31 Page 6 of 18
support delivered by a peer leader compared with the con-trol group; the benefit was observed at different follow-uptimes and maintained at the longest one (15 months)(MD = − 0.8 Kg/m2 95CI%-1.6 to − 0.1; p = 0.032, n = 106).Toobert et al. [39] showed a significant difference in BMI(MD of − 0.40 Kg/m2; p < 0.05, n = 280) in an underservedand high-risk Latino population treated with a long-termmultiple-behavior-change program.Fifteen of the 26 studies examining healthcare inter-
ventions in diabetes care considered blood pressureamong the outcomes. Two studies showed differencesfavoring the experimental intervention. In the study con-ducted by Hill-Briggs et al. [29], participants receiving aself-management training adapted for low literacy expe-rienced an individual improvement in DBP and SBP(median reduction = − 7.17 mmHg, n = 8, median reduc-tion of − 14.67 mmHg, n = 9, respectively). Tang et al.[40] also reported a greater reduction in the group that re-ceived a combination of self-management and peer supportinterventions than the control group, both in SBP (MD= −10.0 mmHg (95% CI -17.6 to − 2.4, p = 0.01) and DBP(MD= − 8.3 mmHg (95% CI -13.2 to − 3.4, p = 0 .001).A significant improvement (p < 0.001) in hypertension
in both groups was found by Shahid et al. [24] (n = 440)but between-group differences were not reported.Eighteen studies reported data on diet adherence.
Seven studies [22, 25, 31, 35, 39, 44, 51] observed be-tween group differences although using different instru-ments and scales.Anderson-Loftin et al. [37] used the Food Habits
Questionnaire (FHQ) adapted for southern AfricanAmericans to measure dietary pattern. The interventionwas a patient education program delivered by nurse casemanager with nutrition focus combined with supportgroups, and weekly telephone follow-up. The authors re-ported a significant improvement in the experimentalgroup with a decrease in high-fat diet while the controlgroup continued previous high-fat dietary behaviors(MD =0.2 points, p = 0.005).One trial [20] used the Summary of Diabetes Self-care
Activities Questionnaire (SDCA) to assess the nutritionadherence in Canadian Portuguese-speaking adults.There was an improvement in self-reported nutrition ad-herence at 3 months in favor of the experimental inter-vention (MD = 0.42 ± 0.14, p < 0.05, n = 87).Negarandeh [41] evaluated patient education program
based on different format (Pictorial or teach back strategy)compared to usual care. Adherence to dietary pattern wasmeasured through a self-structured nine-item scale. Thescore improved in all study participants (n = 130) in followup measurements but the improvement was more pro-nounced for the intervention groups than the controlgroup (p < 0.05). The mean difference between groups was− 2.24 (95% CI- 2.67 to-1.81) for the Pictorial format
Fig. 3 Risk of bias summary
Terens et al. BMC Endocrine Disorders (2018) 18:31 Page 7 of 18
group, and − 2.52 (95% CI:-2.95 to − 2.09) for the Teachback format group.A culturally tailored self-management intervention
adapted for a low income Latino group [27], improvedthe quality of diet as measured by the AlternativeHealthy Eating Index. Significant between group differ-ences were found at 12 months (MD = 2.83 95% CI 0.58to 5.08, p = 0.014, n = 252).A similar intervention was evaluated by Shahid et al.
[24] among people residing in rural areas in Pakistan. Inthe intervention group there was a significant increasein the proportion of participants compliant to the dietplan (17.3% at baseline to 43.6% at follow up, p < 0.01)while in the control group there was no significant in-crease (13.6% at baseline to 15.9% follow up, p = 0.522).Weinstein’s trial [42] assessed fruit and vegetable con-
sumption self-reported daily following brief educationalintervention. At 12 weeks, the percentage of participantswho reported ever purchasing from a produce marketincreased significantly in the intervention group (81% vs48%; p = 0.003, n = 79). Moreover, there was an overalldecrease of the percentage of participants reporting diffi-culty affording fresh fruits and vegetables (55% vs 74% atbaseline, p = 0.008). This decrease was not significantlydifferent between arms.Toobert et al. [39] reported the percent of calories
from saturated fat measured using a food frequencyquestionnaire following a culturally adapted Mediterra-nean lifestyle intervention. He found an improvement of0.33 points at the 24-month follow-up.
Provider levelTwo studies evaluating reminder and reminder+feed-back interventions [43, 44] showed an improvement inglycemic control (HbA1c) compared to the usual care orno intervention group (0.6% vs 0.2%, p < 0.02, n = 399;MD = − 0.80 p < 0.001, n = 2046, respectively). Both ofthese interventions utilized computerized systems toproduce physician reminders. One study [43] found animprovement for LDL cholesterol for all interventionarms, with the greater change observed in the reminders+feedback group (− 18 mg/dl). No studies reported dif-ferences between intervention and control arms forblood pressure and BMI.
Health care system levelThe majority of studies that evaluated interventions tar-geting the health care system (n = 20), showed significanteffect in at least one of the outcomes considered in thisreview.As far HbA1c, nine studies reported a significant re-
duction of HbA1c values [18, 23, 30, 45–50] with amean difference ranging from − 0.29% to − 0.8%. Thestudies considered a range of health care system-based
strategies including interventions such as individualizedcase management activities [23], and culturally tailoredcounseling delivered by a CHW [46, 47, 49]2 and/orNCM [18, 45], and promotoras [50]. Three RCTs in-cluded additional activities, in particular home visits tosupport patient’s progress [30, 47, 48].Seven studies found a significantly greater reduction in
HbA1c levels in the experimental group between base-line and follow up. One study [51] evaluating individualculturally tailored care provided by NCM and CHWcompared to minimal care, showed a significant decreasein HBA1c levels. The effect was significant only in thegroup of participants receiving a higher number of homevisits (− 0.68% vs 0.43%, p = 0.03, n = 522). Another studyconducted with Korean Americans immigrants [52]found that a culturally tailored program includingpsycho-behavioral education, home glucose monitoringwith tele-transmission, and bilingual nurse telephonecounseling, was associated with a greater improvementin HbA1c values (− 1.3% vs − 0.4%; p = 0.01, n = 79).A study conducted in a rural setting [53], showed an im-
provement in HbA1c levels among patients exposed todiabetes education with interactive online sessions, deliv-ered by a multidisciplinary team (0.7 ± 1.3% vs 0.1 ± 1.0%;p < 0.03 after adjustment for baseline HbA1c, n = 95).A significant decrease of HbA1c was observed follow-
ing a case management program delivered by a CHWwith the support of a clinical outreach team that in-cluded home visits [19] (− 1.0% vs − 0.2%, p = 0.02, n =233). Lujan et al. [54] tested the effectiveness of amulti-component education program led by promotorasshowing a mean change of HbA1c in the interventiongroup significantly greater than that of the control groupat 6 months (p < 0.001, n = 149).A multicenter study [55] considered a composite out-
come measure based on the achievement of target valuesfor HbA1c, SBP, and LDL. Participants assigned to theintervention arm (health coaching group) showed higherproportions of people reaching all clinical goals (46.4%vs 34.3%, p = 0.02, n = 389) compared to usual care.A study evaluated an education program [56] supervised
by a nurse specifically trained for case management (DPPLifestyle Program) where participants in the experimentalgroup also received an evidence-based medication algo-rithm. The authors observed a significant improvement inHbA1c levels in the experimental group compared to thecontrol (− 1.87% ± 0.81 vs − 0.54% ± 0.55; p = 0.011). How-ever, no information on sample size and participant char-acteristics were reported.Significant differences in blood pressure were found
between groups in three studies [16, 22, 45]. A differencein means of change from baseline in diastolic bloodpressure significantly favored the intervention in a multi-center study [16] where participants received intensive
Terens et al. BMC Endocrine Disorders (2018) 18:31 Page 8 of 18
disease management led by practice nurse supported bylink workers and a diabetes specialist (adjusted MD = −1.91 mmHg; p < 0.001, n = 1486). In the study of Hotu etal. [22], Maori and Pacific patients with diabetes andchronic kidney diseases who received twelve months ofhome visits by a nurse, achieved a significant lower sys-tolic blood pressure compared to usual care group(149 mmHg vs 140 mmHg; p < 0.05, n = 55). In along-term follow-up study [45] (60 months, n = 1665), asignificant reduction in SBP (MD = − 4.32 mmHg, 95%CI -6.72 to − 1.92] and DPB (MD = − 2.63 mmHg, 95%CI -3.74 to − 1.52] was detected among ethnically di-verse, medically underserved patients receiving aself-management intervention with the support of hometelemedicine and a nurse case manager.Of the 14 trials reporting BMI outcome, only one [45]
showed an adjusted MD of 0.40 kg/m2 (95% CI 0.20 to0.60) when enhanced care through a diabetes-specialistnurse and link worker were compared to usual care.One [56] of the two studies reporting data on weight
change from baseline found a significant decrease at theend of the nine-month intervention of − 2.47 kg (±1.87)in the experimental group and + 0.88 kg (±1.84) in thecontrol group (p = 0.01).Seventeen trials assessed the impact of QI interven-
tions on total cholesterol and/or HDL cholesterol, LDLcholesterol, and triglycerides. In three studies there weresignificant differences in change from baseline betweengroups.At six months follow-up, Garcia et al. [57] reported
statistically significant differences between the controland intervention group for total cholesterol (p = 0.003)and LDL cholesterol (p = 0.014), although not for triglyc-erides (p = 0.179).A significant effect on total cholesterol and triglycer-
ides was found in Kim et al. [52]. The interventiongroup showed significantly lower levels of total choles-terol (− 24.7 mg/dl vs 7.2 mg/dl; p = 0.03) and triglycer-ide (− 84.6 mg/dL vs − 4.2 mg/dL; p < 0.05) whencompared with the control group. The interventiongroup also showed a trend toward a lower HDL, but thisdifference was not statistically significant (p = 0.059).In Shea et al. [45], the intervention group experienced
net improvement in LDL cholesterol level relative to usualcare; a significant between groups difference was reportedat 5 years (MD = − 3.84; 95% CI -7.77 to − 0.08).Glucose monitoring was considered in four studies
[19, 36, 46, 48]. The study conducted by McDermott etal. [19] showed that participants in the control group(waiting-list group) were more likely to self-monitortheir glucose level than the experimental group.Nine trials reported adherence to diet but measures
and scores used varied between trials. Three studiesfound a difference between groups.
Babamoto et al. [58] found that the proportion of patientsconsuming two or more servings of fruits and vegetablesdaily increased significantly in the CHW and case manage-ment groups but not in the standard provider care group.Patients’ self-reported intake of fatty foods decreased sig-nificantly from 29 to 16% (p < 0.05) in the CHW group butremained unchanged in the other groups.Cramer et al. [56] used the Dietary Questionnaire to
measure eating habits and observed a significant im-provement in the experimental group compared withthe usual care group (p < 0.001). Lynch et al. [59] alsoobserved a significant increase in the number of daysfollowing a general and specific diet among participantsreceiving a culturally-oriented self-management program(MD = 1.9, 95% CI 0.6 to 3.1; MD = 1.2, 95% CI 0.2 to2.2, respectively, n = 61), measured by the Block Foodfrequency Questionnaire.Eight trials studied physical activity using different
measures, and two reported an effect following the ex-perimental intervention. One study [59] reported resultsfrom the CHAMPS (Community Healthy Activitiesmodel for Seniors) physical activity questionnaire modi-fied for use among African Americans. At study end-point there was a statistically significant differencebetween groups (MD = 2.517 Kcal/week; p < 0.01).Comparing usual care with two educational programs
provided by a different case manager (CHW or NCM),Babamoto et al. [58] found a significant improvement inphysical activity with an increase from 28 to 63% (p < 0.05)in the CHW group, and from 17 to 35% (p < 0.05) in thestandard provider care group, without any change in thecase management group.Six studies reported data on diabetes knowledge mea-
sured by validated instruments such as the Diabetes Know-ledge Questionnaire [28, 54, 58], the Spoken Knowledge inLow Literacy in Diabetes Scale [57], and the DiabetesKnowledge Test [46, 52]. A significant improvement in pa-tient’s skills was observed in three studies [46, 54, 58].In one out of three studies considering emergency and/
or hospital admissions [51, 58, 60], there was a reductionin emergency visits from baseline to 24 months among pa-tients receiving a culturally tailored care provided by aNCM and a CHW (RR = 0.77, 95% CI, 0.59–1.00) [60].One study [45] investigated the effect of telemedicine
compared with usual care on all cause mortality but nodifferences between groups were reported (HR 1.01, 95%CI 0.82, 1.24).
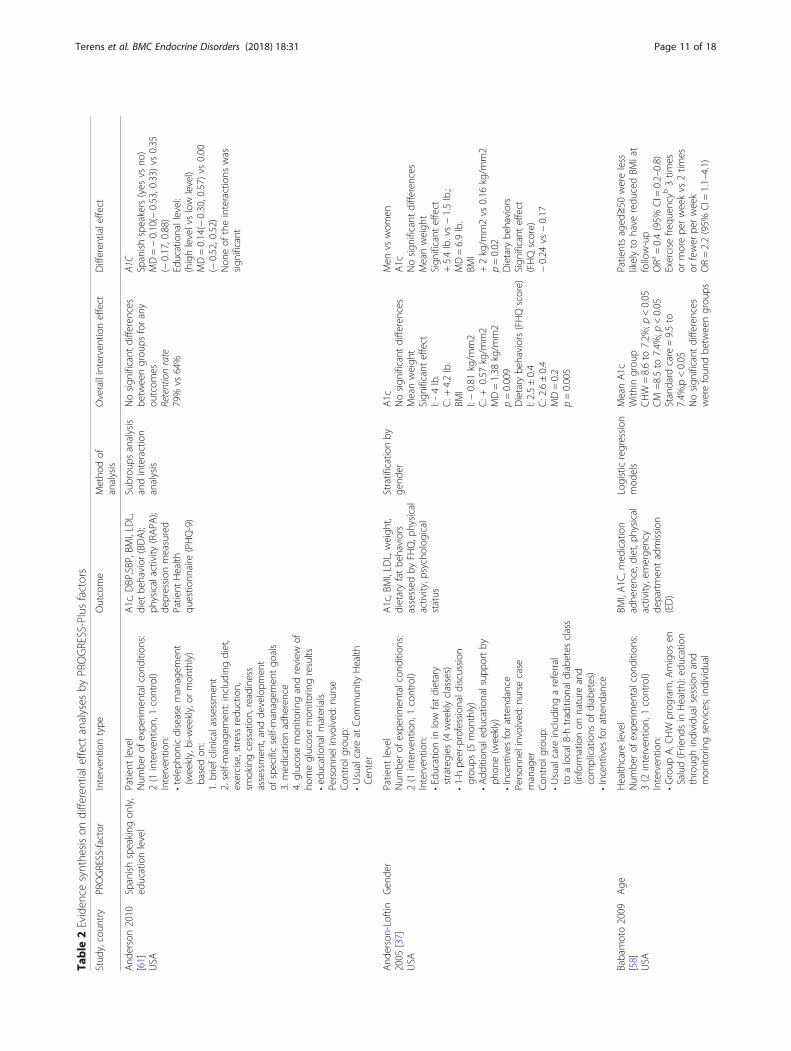
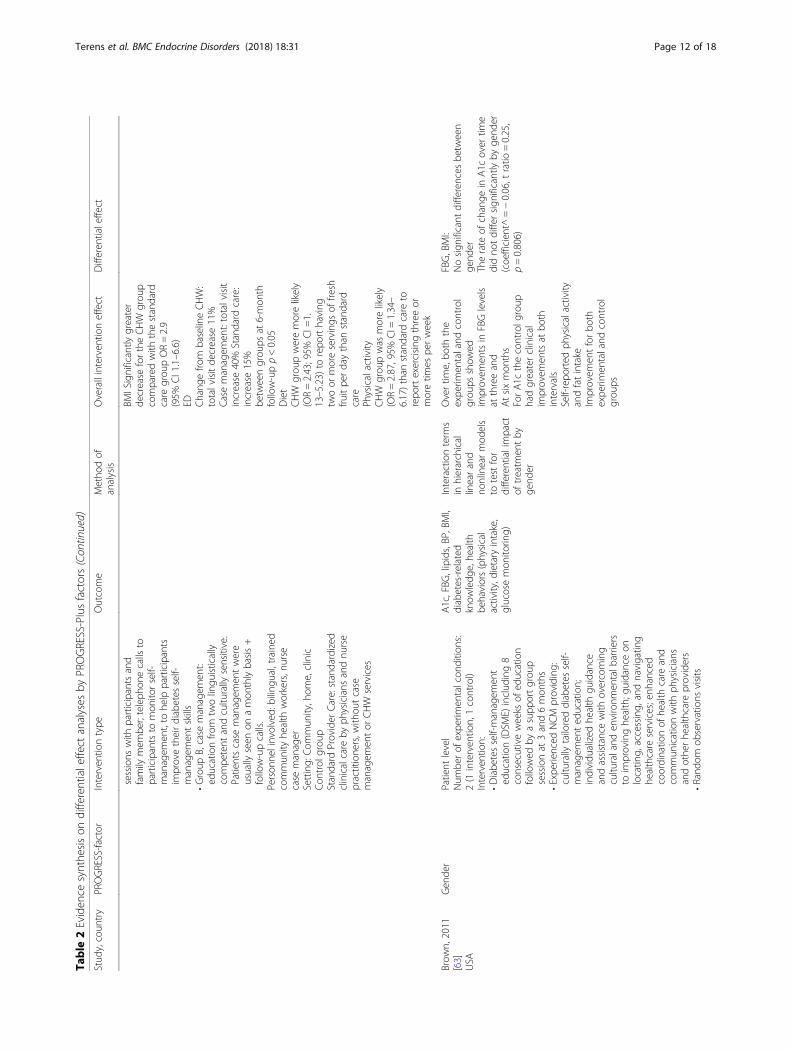
Studies evaluating differential intervention effects byPROGRESS factors (n = 7)Seven studies conducted sub-analyses to explore a differ-ential intervention effects across PROGRESS-Plus factors(n = 7) and all were conducted in developed countries.
Terens et al. BMC Endocrine Disorders (2018) 18:31 Page 9 of 18
They used a parallel study design with a follow up of12–24 months.Table 2 gives the details of studies and results. Females,
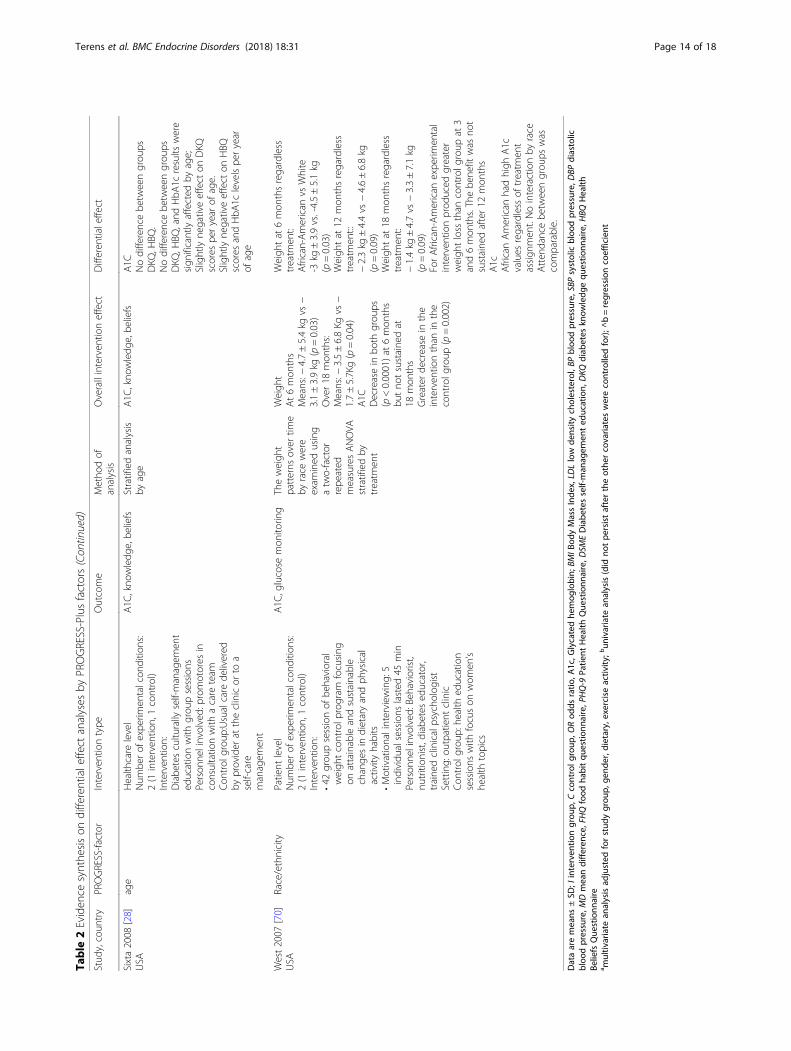
age ≥ 50, African-Americans and those with low educationshowed a better improvement in glycemic control. Patienteducation based on low-fat dietary strategies delivered bydiscussion groups and supported by phone contacts, pro-duced a greater decrease in BMI, weight, and dietary behav-iors among women than men [37]. At healthcareorganization level, diabetes self-management supported byCHW was associated with a greater BMI reduction and anincrease in exercise frequency among participants aged≥50. One study analyzed intervention differential effect bylevels of health literacy [36]. The experimental programaimed to supply information and promote diabetesself-management skills by computer multi-media includingaudio/video sequences. Among low literacy subjects withpoor glycemic control, the authors found a greater decreasein HbA1C in the group exposed to computer multi-mediaeducation program than in the control group (− 2.1 vs.-0.3%, p = 0.036). No significant difference was foundamong high-literacy subjects. Moreover, the multimediausers with low health literacy demonstrated gains in know-ledge, self-efficacy, and perceived susceptibility to complica-tions compared with those having higher health literacy.
DiscussionApplying an equity-oriented approach, this review iden-tified 58 RCTs (17.786 participants) evaluating QI strat-egies to improve the quality of diabetes care in aprimary care setting.Forty-seven studies were from USA and evaluated in-
terventions specifically designed to reach populationsubgroups mainly defined on the basis of race or ethni-city. A narrow subset of these studies (n = 7) consideredother dimensions of disadvantage as defined by thePROGRESS framework, such as socio-economic statusand place of residence.The RCTs included in this systematic review covered a
wide assortment of QI strategies, varying frompatient-mediated interventions with sessions ofself-management supported by healthcare professionals,to provider education and other more complex pro-grams based on changes in healthcare organization.Twenty-nine studies considered QI interventions con-ducted at the patient level, three at the provider level,and twenty-six at the health care organization level.Pooling of results and quantitative synthesis was pre-
cluded by marked heterogeneity (mainly clinical), be-cause study population, types of interventions, outcomemeasures, outcome assessment tools, duration offollow-up and risk of bias varied widely between studies.QI strategies based on patient education and self-man-
agement strategies improved HbA1c levels among racial
and ethnic minority participants but heterogeneity andcomplexity of interventions made difficult to identify the ef-fective components of these interventions. The evidence onthe effect of patient level interventions on improving otherclinical and laboratory parameters, such as blood pressure,cholesterol levels and BMI, as well as self-management be-haviours is scant. Few studies explored the effectiveness ofother patient level strategies, including incentives and re-minders. The only study included in this review [34] testinga rewards-based incentive intervention, showed effectiveresults.With regard to interventions at provider level, only
one study reported a significant between groups differ-ence in HbA1c reduction while no significant impact onblood pressure or BMI was observed.Many of the studies included in this systematic review
were designed to evaluate the effectiveness of changing,expanding, or integrating the roles of healthcare profes-sionals combined with patient education to improve dia-betes care and outcomes. QI interventions based onmultidisciplinary teams including trained nurses or localcommunity health workers providing culturally compe-tent care, were associated with a significant reduction ofHbA1c values. Changes in the role of health care profes-sionals have been shown to produce an improvement inglucose control in ethnic minority communities on eth-nic minority communities showed.As far other primary outcomes considered in this re-
view, a significant improvement in cholesterol levels wasreported while n differences were found for secondaryoutcome measures, except for an increase in physical ac-tivity and diabetes knowledge.Seven studies reported data on the differential effect
by at least one PROGRESS factor. We did not find evi-dence of a differential effect by gender and race of anyintervention on HbA1c levels reduction. One study re-ported an improvement in glucose control among a lowliteracy population subgroup, exposed to a culturallycompetent education program delivered throughmulti-media tools. We found some evidence of effective-ness of QI interventions in weight loss and BMI amongfemales and weight loss among African-Americans.In general, the heterogeneity of baseline HbA1c values
and mean age of participants can affect intervention out-comes due to the biomedical challenge of loweringHbA1c from a higher baseline value. Moreover, somestudies defined a minimum A1C value as inclusion cri-terion possibly considering patients which may not berepresentative of diabetic population receiving care in areal world clinical setting. Rather than implementingminimum A1C values for participant inclusion, as manyof the studies reviewed incorporated, it is important (itmay be worthwhile) to maintain the integrity of studyingquality improvement interventions in real-life clinical
Terens et al. BMC Endocrine Disorders (2018) 18:31 Page 10 of 18
Table
2Eviden
cesynthe
sison
differentialeffect
analyses
byPROGRESS-Plusfactors
Stud
y,coun
try
PROGRESS-factor
Interven
tiontype
Outcome
Metho
dof
analysis
Overallinterven
tioneffect
Differen
tialeffect
And
erson2010
[61]
USA
Spanishspeaking
only,
educationlevel
Patient
level
Num
berof
expe
rimen
talcon
ditio
ns:
2(1
interven
tion,1control)
Interven
tion:
•teleph
onicdiseasemanagem
ent
(weekly,bi-w
eekly,or
mon
thly)
basedon
:1.briefclinicalassessmen
t2.self-managem
ent:includ
ingdiet,
exercise,stressredu
ction,
smokingcessation,readiness
assessmen
t,andde
velopm
ent
ofspecificself-managem
entgo
als
3.med
icationadhe
rence
4.glucosemon
itorin
gandreview
ofho
meglucosemon
itorin
gresults
•ed
ucationalm
aterials
Person
nelinvolved:
nurse
Con
trol
grou
p:•Usualcare
atCom
mun
ityHealth
Cen
ter
A1c,D
BP,SBP,BMI,LD
L,diet
behavior
(BDA);
physicalactivity
(RAPA
);de
pression
measured
Patient
Health
questio
nnaire
(PHQ-9)
Subrou
psanalysis
andinteraction
analysis
Nosign
ificant
differences
betw
eengrou
psforany
outcom
esRetentionrate
79%
vs64%
A1C
Spanishspeakers(yes
vsno
)MD=−0.10(−
0.53,0.33)
vs0.35
(−0.17,0.88)
Educationallevel:
(highlevelvslow
level)
MD=0.14(−
0.30,0.57)
vs0.00
(−0.52,0.52)
Non
eof
theinteractions
was
sign
ificant
And
erson-Loftin
2005
[37]
USA
Gen
der
Patient
level
Num
berof
expe
rimen
talcon
ditio
ns:
2(1
interven
tion,1control)
Interven
tion:
•Educationin
low
fatdietary
strategies
(4weeklyclasses)
•1-hpe
er-professionald
iscussion
grou
ps(5
mon
thly)
•Add
ition
aled
ucationalsup
portby
phon
e(weekly)
•Incentives
forattend
ance
Person
nelinvolved:
nursecase
manager
Con
trol
grou
p:•Usualcare
includ
ingareferral
toalocal8-h
tradition
aldiabetes
class
(inform
ationon
nature
and
complications
ofdiabetes)
•Incentives
forattend
ance
A1c,BMI,LD
L,weigh
t,dietaryfatbe
haviors
assessed
byFH
Q,p
hysical
activity,p
sycholog
ical
status
Stratificationby
gend
erA1c
Nosign
ificant
differences
Meanweigh
tSign
ificant
effect
I:-4lb.
C:+
4.2lb.
BMI
I:−0.81
kg/m
m2
C:+
0.57
kg/m
m2
MD=1.38
kg/m
m2
p=0.009
Dietary
behaviors(FHQscore)
I:2.5±0.4
C:2.6±0.4
MD=0.2
p=0.005
Men
vswom
enA1c
Nosign
ificant
differences
Meanweigh
tSign
ificant
effect
+5.4lb.vs−1.5lb.;
MD=6.9lb.
BMI
+2kg/m
m2vs
0.16
kg/m
m2
p=0.02
Dietary
behaviors
Sign
ificant
effect
(FHQscore)
−0.24
vs−0.17
Babamoto2009
[58]
USA
Age
Health
care
level
Num
berof
expe
rimen
talcon
ditio
ns:
3(2
interven
tion,1control)
Interven
tion:
•Group
A,C
HW
prog
ram,A
migos
enSalud(Friend
sin
Health
):ed
ucation
throug
hindividu
alsessionand
mon
itorin
gservices;ind
ividual
BMI,A1C
,med
ication
adhe
rence,diet,p
hysical
activity,emerge
ncy
departmen
tadmission
(ED)
Logisticregression
mod
els
MeanA1c
With
ingrou
pCHW
=8.6to
7.2%
;p<0.05
CM
=8.5to
7.4%
;p<0.05
Standard
care=9.5to
7.4%
;p<0.05
Nosign
ificant
differences
werefoun
dbe
tweengrou
ps
Patientsaged
≥50
wereless
likelyto
have
redu
cedBM
Iat
follow-up
ORa
=0.4(95%
CI=
0.2–0.8)
Exercise
frequ
ency
b3tim
esor
morepe
rweekvs
2tim
esor
fewer
perweek
OR=2.2(95%
CI=
1.1–4.1)
Terens et al. BMC Endocrine Disorders (2018) 18:31 Page 11 of 18
Table
2Eviden
cesynthe
sison
differentialeffect
analyses
byPROGRESS-Plusfactors(Con
tinued)
Stud
y,coun
try
PROGRESS-factor
Interven
tiontype
Outcome
Metho
dof
analysis
Overallinterven
tioneffect
Differen
tialeffect
sessions
with
participantsand
family
mem
ber;teleph
onecalls
toparticipantsto
mon
itorself-
managem
ent,to
help
participants
improvetheirdiabetes
self-
managem
entskills
•Group
B,case
managem
ent:
educationfro
mtw
olingu
istically
compe
tent
andcultu
rally
sensitive.
Patientscase
managem
entwere
usually
seen
onamon
thlybasis+
follow-upcalls.
Person
nelinvolved:
bilingu
al,trained
commun
ityhe
alth
workers,nurse
case
manager
Setting:
Com
mun
ity,hom
e,clinic
Con
trol
grou
pStandard
Provider
Care:standardized
clinicalcare
byph
ysicians
andnu
rse
practitione
rs,w
ithou
tcase
managem
entor
CHW
services
BMISignificantly
greater
decrease
fortheCHW
grou
pcomparedwith
thestandard
care
grou
pOR=2.9
(95%
CI1.1–6.6)
ED Chang
efro
mbaselineCHW:
totalvisitde
crease
11%
Casemanagem
ent:totalvisit
increase
40%
Standard
care:
increase
15%
betw
eengrou
psat
6-mon
thfollow-upp<0.05
Diet
CHW
grou
pweremorelikely
(OR=2.43;95%
CI=
1.13–5.23)
torepo
rthaving
twoor
moreservings
offre
shfru
itpe
rdaythan
standard
care
Physicalactivity
CHW
grou
pwas
morelikely
(OR=2.87,95%
CI=
1.34–
6.17)than
standard
care
torepo
rtexercising
threeor
moretim
espe
rweek
Brow
n,2011
[63]
USA
Gen
der
Patient
level
Num
berof
expe
rimen
talcon
ditio
ns:
2(1
interven
tion,1control)
Interven
tion:
•Diabe
tesself-managem
ent
education(DSM
E)includ
ing8
consecutiveweeks
ofed
ucation
followed
byasupp
ortgrou
psessionat
3and6mon
ths
•Expe
rienced
NCM
providing:
cultu
rally
tailoreddiabetes
self-
managem
ented
ucation;
individu
alized
health
guidance
andassistance
with
overcoming
cultu
raland
environm
entalb
arriers
toim
provinghe
alth;g
uidanceon
locatin
g,accessing,
andnavigatin
ghe
althcare
services;enh
anced
coordinatio
nof
health
care
and
commun
icationwith
physicians
andothe
rhe
althcare
providers
•Rand
omob
servations
visits
A1c,FBG
,lipids,BP,BMI,
diabetes-related
know
ledg
e,he
alth
behaviors(physical
activity,d
ietary
intake,
glucosemon
itorin
g)
Interactionterm
sin
hierarchical
linearand
nonlinearmod
els
totestfor
differentialimpact
oftreatm
entby
gend
er
Overtim
e,bo
ththe
expe
rimen
taland
control
grou
psshow
edim
provem
entsin
FBGlevels
atthreeand
Atsixmon
ths
ForA1c
thecontrolg
roup
hadgreaterclinical
improvem
entsat
both
intervals
Self-repo
rted
physicalactivity
andfatintake
Improvem
entforbo
thexpe
rimen
taland
control
grou
ps
FBG,BMI:
Nosign
ificant
differences
betw
een
gend
erTherate
ofchange
inA1c
over
time
didno
tdiffersign
ificantlyby
gend
er(coe
fficien
t^=−0.06,t
ratio
=0.25,
p=0.806)
Terens et al. BMC Endocrine Disorders (2018) 18:31 Page 12 of 18
Table
2Eviden
cesynthe
sison
differentialeffect
analyses
byPROGRESS-Plusfactors(Con
tinued)
Stud
y,coun
try
PROGRESS-factor
Interven
tiontype
Outcome
Metho
dof
analysis
Overallinterven
tioneffect
Differen
tialeffect
Person
nelinvolved:
bilingu
alNCM,
nurses,d
ietitians,and
CHWs
Con
trol
Group
:DSM
Einterven
tionon
ly
Forju
oh2014
[64]
USA
Race/ethnicity
Patient
level
Num
berof
expe
rimen
talcon
ditio
ns:
4(3
interven
tion,1control)
Interven
tion:
•Group
A.self-m
anagem
entthroug
hpe
rson
aldigitassistant(PDA).Dia
betesPilotChron
icDisease
Self
Managem
entProg
ram
(CDSM
P):
6weekgrou
ped
ucationprog
ram
toincrease
selfefficacy
•Group
B.self-managem
entthroug
hPD
A•Group
C.com
binatio
nof
A+B
Person
nelinvolved:
traine
dfacilitator,
projectcoordinators
Setting:
outpatient
clinic,com
mun
ityCon
trol
grou
p:usualclinicaldiabetes
care,along
with
patient
education
materials
A1C
,physicalactivity,
BMI,BP,d
iet
Interactionterm
sin
multilevel
mod
elsto
testfor
differentialimpact
oftreatm
entby
race/ethnicity
BMIand
BP:M
odest
redu
ctions
from
baselineto
12mon
thsof
follow-upfor
allfou
rgrou
ps.
Nosign
ificant
differencefor
othe
rou
tcom
es.
Selfcare
activities:
Hispanicwashing
feet
sign
ificantlymorethan
othe
rracial/ethnicgrou
ps(P=0.02)
Retentionrate:
CDSM
P:85%;PDA64%,
CDSM
P+PD
A64%;C
ontrol
78%
A1c
Mod
estredu
ctions
occurred
inA1c
from
baselineto
12mon
thsof
follow-upforall/e
thnicgrou
ps.
Therewas
nosign
ificant
difference
inA1c
change
over
timeby
race/ethnicity.
Gerbe
r2005
[36]
USA
Health
literacy
Patient
level
Num
berof
expe
rimen
talcon
ditio
ns:
2(1
interven
tion,1control)
Interven
tion:
Educationby
compu
termulti-med
iainclud
ingaudio/vide
osequ
ences
(“LivingWellw
ithDiabe
tes”)to
commun
icateinform
ation,provide
psycho
socialsupp
ortandprom
ote
self-managem
ent.Subjectreceived
compe
nsationbasedon
compu
ter
usage.Lesson
sin
Englishand
Spanish.Navigationprovided
throug
hasimplified
interface,
includ
ingforw
ard/backwardbu
tton
sforuser
control.Advancedfeatures
includ
ed“pop
-up”
supp
lemen
tary
text
inform
ationor
additio
nal
testim
onialsrelatedto
the
concurrent
screen
concep
tPerson
nelinvolved:
bilingu
alresearch
assistant
Setting:
urbanou
tpatient
clinics
Con
trol
grou
p:simplemultip
le-
choice
quizzeson
diabetes-related
concep
ts
A1c,BMI,BP,eye
exam
,diabetes
know
ledg
e,self-
efficacy,self-repo
rted
med
icalcare,and
per-
ceived
suscep
tibility
tocomplications
Stratificationby
levelo
fhe
alth
literacy
Nosign
ificant
differences
for
allo
utcomes
butpe
rceived
suscep
tibility
todiabetes
complications
Lower
literacygrou
p%
change
A1c
−0.21
±2.0vs
−0.1%
±1.3
MD=−0.10
[−0.67,0.47]
Peop
lewith
A1c
>9%
−2.1vs
−0.3(p=0.036)
Perceivedsuscep
tibility
tocomplications
%change
score=
1.48
±2.7vs
0.19
±2.5(p=0.016)
Self-efficacy
tren
dtowardgreaterim
provem
ent
inself-efficacy
1.51
±1.5vs.0.99±1.4
(p=0.113)
Highe
rliteracy
%change
A1c
+0.3%
±1.6vs.-0.5±1.5
MD=0.80
[0.22,1.38]
Perceivedsuscep
tibility
tocomplications
0.76
±2.5vs.0.29±2.4(p=0.267)
Med
icalcare
Improvem
entover
time(p<0.012fortim
einteraction)
butno
effect
foreither
lower-or
high
er-literacy
grou
ps
Terens et al. BMC Endocrine Disorders (2018) 18:31 Page 13 of 18
Table
2Eviden
cesynthe
sison
differentialeffect
analyses
byPROGRESS-Plusfactors(Con
tinued)
Stud
y,coun
try
PROGRESS-factor
Interven
tiontype
Outcome
Metho
dof
analysis
Overallinterven
tioneffect
Differen
tialeffect
Sixta2008
[28]
USA
age
Health
care
level
Num
berof
expe
rimen
talcon
ditio
ns:
2(1
interven
tion,1control)
Interven
tion:
Diabe
tescultu
rally
self-managem
ent
educationwith
grou
psessions
Person
nelinvolved:
prom
otores
inconsultatio
nwith
acare
team
Con
trol
grou
p:Usualcare
delivered
byprovider
attheclinicor
toa
self-care
managem
ent
A1C
,kno
wledg
e,be
liefs
Stratifiedanalysis
byage
A1C
,kno
wledg
e,be
liefs
A1C
Nodifferencebe
tweengrou
psDKQ
,HBQ
.Nodifferencebe
tweengrou
psDKQ
,HBQ
,and
HbA
1cresults
were
sign
ificantlyaffected
byage;
Slightlyne
gativeeffect
onDKQ
scores
peryear
ofage.
Slightlyne
gativeeffect
onHBQ
scores
andHbA
1clevelspe
ryear
ofage
West2007
[70]
USA
Race/ethnicity
Patient
level
Num
berof
expe
rimen
talcon
ditio
ns:
2(1
interven
tion,1control)
Interven
tion:
•42
grou
psessionof
behavioral
weigh
tcontrolp
rogram
focusing
onattainableandsustainable
change
sin
dietaryandph
ysical
activity
habits
•Motivationalinterview
ing:
5individu
alsessions
lasted
45min
Person
nelinvolved:
Behaviorist,
nutrition
ist,diabetes
educator,
traine
dclinicalpsycho
logist
Setting:
outpatient
clinic
Con
trol
grou
p:he
alth
education
sessions
with
focuson
wom
en’s
health
topics
A1C
,glucose
mon
itorin
gTheweigh
tpatterns
over
time
byrace
were
exam
ined
using
atw
o-factor
repe
ated
measuresANOVA
stratifiedby
treatm
ent
Weigh
tAt6mon
ths
Means:−
4.7±5.4kg
vs−
3.1±3.9kg
(p=0.03)
Over18
mon
ths:
Means:−
3.5±6.8Kg
vs−
1.7±5.7Kg(p=0.04)
A1C
Decreasein
both
grou
ps(p<0.0001)at
6mon
ths
butno
tsustaine
dat
18mon
ths
Greater
decrease
inthe
interven
tionthan
inthe
controlg
roup
(p=0.002)
Weigh
tat
6mon
thsregardless
treatm
ent:
African-American
vsWhite
-3kg
±3.9vs.-4.5±5.1kg
(p=0.03)
Weigh
tat
12mon
thsregardless
treatm
ent::
−2.3kg
±4.4vs
−4.6±6.8kg
(p=0.09)
Weigh
tat
18mon
thsregardless
treatm
ent:
−1.4kg
±4.7vs
−3.3±7.1kg
(p=0.09)
ForAfrican-American
expe
rimen
tal
interven
tionprod
uced
greater
weigh
tloss
than
controlg
roup
at3
and6mon
ths.Thebe
nefit
was
not
sustaine
dafter12
mon
ths
A1c
AfricanAmerican
hadhigh
A1c
values
regardless
oftreatm
ent
assign
men
t.Nointeractionby
race
Atten
dancebe
tweengrou
pswas
comparable.
Dataaremeans
±SD
;Iinterven
tiongrou
p,Ccontrolg
roup
,ORod
dsratio
,A1c,G
lycatedhe
mog
lobin;
BMIB
odyMassInde
x,LD
Llow
density
cholesterol,BP
bloo
dpressure,SBP
systolicbloo
dpressure,D
BPdiastolic
bloo
dpressure,M
Dmeandifferen
ce,FHQfood
habitqu
estio
nnaire,P
HQ-9
Patie
ntHealth
Que
stionn
aire,D
SMEDiabe
tesself-man
agem
ented
ucation,
DKQ
diab
etes
know
ledg
equ
estio
nnaire,H
BQHealth
BeliefsQue
stionn
aire
a multiv
ariate
analysisad
justed
forstud
ygrou
p,ge
nder,d
ietary,e
xerciseactiv
ity;bun
ivariate
analysis(did
notpe
rsistaftertheothe
rcovaria
teswerecontrolledfor);^
b=regression
coefficient
Terens et al. BMC Endocrine Disorders (2018) 18:31 Page 14 of 18
settings and therefore address differences in baselineA1C values across studies in ways other than restrictingpatient participant inclusion.Another relevant issue in the evaluation of QI strat-
egies is that the control groups received a wide range ofinterventions, from basic education materials, usual care,to individualized coaching from community healthworkers. Furthermore, in many of these studies, the con-trol group intervention was not described in detail. Thisis important as the usual or routine care in different set-tings varies by a multitude of variables including pay-ment system, geographic location, country, and moregenerally, the resources and quality of services routinelyprovided to patients. In addition, type and quality ofusual care at a health center can impact baseline values,especially HbA1c. Moreover, biases may exist dependingon previous improvement activities implemented andgeneral commitment of medical staff and organizationalleadership to reducing disparities and improving care.The conclusions of this systematic review are largely
in accord with those in a previous review on this topicamong socially disadvantaged population living in indus-trialized countries published in 2006 [74]. The reviewidentified 17 studies, seven trials were with low SES pop-ulations, and ten focused on etno-racial groups. Thesmall number of studies in Glazier’s review providedlimited and inconclusive evidence on intervention attri-butes that improved diabetes quality of care and healthoutcomes, underlining the potential effect of some fea-tures in reducing health disparities.Our review provides an update and a more complete
overview of the available evidence considering three spe-cific aspects: use of PROGRESS framework to capturedifferent socio-economic dimensions; assessment of therisk of bias of included studies; and the inclusion ofstudies evaluating QI strategies defined according tointernational classification.Using an equity oriented approach, we identified a
large number of randomized studies showing that con-siderable strides have been made to test interventions toaddress health inequities in diabetes care and outcomes.Despite the increase of the number of trials, the meth-odological quality resulted to be low. This finding is con-sistent with a previous review [75] reporting that theincrease in the number of RCTs on QI strategies runsparallel to the proportion of trials having at least one do-main with high risk of bias. Most included trials did notreport the method of randomization and description ofthe allocation process. The area of the greatest potentialrisk of bias was the inadequate blinding of participantsand outcome assessors, and poor follow up. In some ofincluded trials the general lack of reporting of methodsmade it difficult to assess methodological quality andthereby judge risk of bias, independently of year of
publication. The issue of small sample size extends be-yond the quality of those studies included in this review.There were a number of studies, both pilot and not, thatwere excluded from this review because they had a sam-ple size smaller than 50. Furthermore, since most studieswere carried out in USA, their degree of external validityis uncertain. Results from these studies may be lesstransferrable to other countries and settings due to theirbeing tested in a market-based health care system. It islikely that the patients’ population covered by universal-istic care is more heterogeneous with regard tosocio-demographic and clinical characteristics. For ex-ample, those countries with universal health care sys-tems may have more heterogeneous patient populationsin a single community. It is therefore necessary to plantrials in other countries. By the same token, interven-tions addressing health disparities in other countries arelikely to involve groups of varying social advantage ordisadvantage being served under the same health centeror system. The approach to addressing inequity becomesmore about reducing health disparities on a more granu-lar level requiring tools such as health equity audit.Although the PROGRESS framework provides a vast
array of disadvantage categories, there was limited het-erogeneity in the dimensions of disadvantage consideredin RCTs. The most common PROGRESS factor were ageand race/ethnicity, this underlines the needs of furtherresearch with a focus on other characteristics such as so-cioeconomic status, social capital, place of residence, oc-cupation, education, and religion. Researchers studyingpopulations at social disadvantage must also describe thestudy population and the nature of their disadvantagemore specifically. This is of further importance becausea lack of description or definition of a socially disadvan-taged group was a common reason for study exclusionin this review and others.There is also a clear need for more RCTs at the provider
level, especially those evaluating interventions based oncomputerized provider reminder systems. With the wide-spread uptake of recognition and certification programs inprimary care (e.g. medical home, diabetes recognition pro-grams,), it is likely that audit and feedback strategies usingbenchmarking are common among primary care practices,but are less frequently reported for effectiveness amongdisadvantaged patient populations.This research reveals an overall lack of focus on inter-
ventions that address outcomes related to adherence toguidelines where disparities are stark according to theliterature. The paucity of studies measuring process ofcare may be a reflection of the few number of QI inter-ventions at the provider level who, in conjunction withother members of the primary care team, are responsiblefor performing or referring to these services. Clinicaloutcomes should derived from electronic health record
Terens et al. BMC Endocrine Disorders (2018) 18:31 Page 15 of 18
systems, but may not be as recurrently funded as bio-chemical diabetes outcomes. Process outcomes or adher-ence to guidelines is crucial to measure and address dueto the evidence of disparities that exist on the level ofclinical quality and care. It is also important to note thatseveral studies measured diabetes “self-care” or “self--management” activities but did not report results on dis-tinct components such as medication adherence orglucose monitoring. As these clinical outcome measuresare crucial in measuring effectiveness of diabetes inter-vention, it is important to report on these componentsas distinctive measures.We see many studies that aim to evaluate interven-
tions to improve care and/or outcomes among a disad-vantaged group, but seldom do we find studiesinvestigating the effect of QI interventions disentangledby different levels of indicators of socio-economic pos-ition or relevant socio-demographic factors. This maybecause practices are not disaggregating data to identifydisparities within patient populations and are thereforenot initiating action to address them. It should be neces-sary to promote and sustain a different approach includ-ing audit activities to identify inequities in care andoutcomes, and then work to address these disparities.Moreover, an “equity lens” approach should be adoptedby the scientific community when identifying researchpriorities aimed at contrasting socioeconomic differen-tials. This equity-oriented approach is necessary to iden-tify and describe the appropriate target population, todefine inequalities indicators, and select process andoutcome indicators useful for assessing the differentialeffect of an intervention.
ConclusionsBecause of the methodological differences and weak-nesses that precluded meta-analytic synthesis, we candraw no strong conclusions concerning the potentialbenefits or harms of QI strategies to reduce inequalitiesin access to care for patients with diabetes in primarycare. Moreover, the included studies did not allow for ananalysis of the differential effects of interventions acrosspopulation sub-groups.This review highlights some QI strategies for consider-
ation and in need of further study. Health care profes-sionals and policy makers need the best available evidenceto administer and support those interventions most likelyto be effective to reduce disparities in diabetes care.
Additional files
Additional file 1: Search strategy for PubMed. (DOCX 17 kb)
Additional file 2: Table S1. Inclusion and exclusion criteria (PICOS).(DOCX 14 kb)
Additional file 3: Table S2. Quality improvement strategies: level anddescription. (DOCX 13 kb)
Additional file 4: Table S3. Characteristics of eligible studies assessingthe efficacy of QI interventions in participants with type 2 diabetes.(DOCX 71 kb)
Authors’ contributionsNT, AB, and NA made substantial contributions to the conception anddesign of this systematic review. ZM completed the literature search. NT andAB screened studies against eligibility criteria, extracted data, and analysedand interpreted data. All authors contributed to writing and revising the finalmanuscript. All authors read and approved the final manuscript LA and MDcontributed to the critical revision.
Ethics approval and consent to participateNot applicable
Competing interestsThe authors declare that they have no competing interests.
Publisher’s NoteSpringer Nature remains neutral with regard to jurisdictional claims inpublished maps and institutional affiliations.
Author details1Trenton Health Team, Trenton, New Jersey, USA. 2Department ofEpidemiology, Lazio Region- ASL Rome1, Rome, Italy.
Received: 28 February 2018 Accepted: 16 May 2018
References1. World Health Organization. Global Report on Diabetes 2016. http://apps.who.
int/iris/bitstream/handle/10665/204871/9789241565257_eng.pdf;jsessionid=45F529CEFB7FB49CB7EE39B0F63BA11F?sequence=1. Accessed 20 Feb 2016.
2. Agardh E, Allebeck P, Hallqvist J, Moradi T, Sidorchuk A. Type 2 diabetesincidence and socio-economic position: a systematic review and meta-analysis. Int J Epidemiol. 2011;40:804–18.
3. Redle EE, Atkins D. The applicability of quality improvement research forcomparative effectiveness. Implement Sci. 2013;8(Suppl 1):S6.
4. Espelt A, Arriola L, Borrell C, Larrañaga I, Sandín M, Escolar-Pujolar A.Socioeconomic position and type 2 diabetes mellitus in Europe 1999-2009:a panorama of inequalities. Curr Diabetes Rev. 2011;7(3):148–58.
5. NICE. Type 2 diabetes in adults: management 2015. https://www.nice.org.uk/guidance/ng28/evidence/full-guideline-pdf-78671532569. Accessed 20Feb 2016.
6. Grintsova O, Maier W, Mielck A. Inequalities in health care among patientswith type 2 diabetes by individual socio-economic status (SES) and regionaldeprivation: a systematic literature review. Int J Equity Health. 2014;13:43.https://doi.org/10.1186/1475-9276-13-43.
7. Heidemann DL, Joseph NA, Kuchipudi A, Perkins DW, Drake S. Racial andeconomic disparities in Diabetes in a Large Primary Care Patient Population.Ethn Dis. 2016;26(1):85–90. https://doi.org/10.18865/ed.26.1.85.
8. Calvert M, Shankar A, McManus RJ, Lester H, Freemantle N. Effect of thequality and outcomes framework on diabetes care in the United Kingdom:retrospective cohort study. BMJ. 2009;338:b1870. https://doi.org/10.1136/bmj.b1870. Erratum in: BMJ. 2009;339:b2768
9. Rossi MC, Candido R, Ceriello A, Cimino A, Di Bartolo P, Giorda C, et al.Trends over 8 years in quality of diabetes care: results of the AMD annalscontinuous quality improvement initiative. Acta Diabetol. 2015;52(3):557–71.https://doi.org/10.1007/s00592-014-0688-6.
10. Tricco AC, Ivers NM, Grimshaw JM, Moher D, Turner L, Galipeau J, et al.Effectiveness of quality improvement strategies on the management ofdiabetes: a systematic review and meta-analysis. Lancet. 2012;379(9833):2252–61. https://doi.org/10.1016/S0140-6736(12)60480-2.
11. O'Neill J, Tabish H, Welch V, Petticrew M, Pottie K, Clarke M, et al. Applyingan equity lens to interventions: using PROGRESS ensures consideration ofsocially stratifying factors to illuminate inequities in health. J Clin Epidemiol.2014;67(1):56–64. https://doi.org/10.1016/j.jclinepi.2013.08.005.
Terens et al. BMC Endocrine Disorders (2018) 18:31 Page 16 of 18
12. Welch V, Petticrew M, Petkovic J, Moher D, Waters E, White H, et al. PRISMA-equity Bellagio group. Extending the PRISMA statement to equity-focusedsystematic reviews (PRISMA-E 2012): explanation and elaboration. J ClinEpidemiol. 2016;70:68–89. https://doi.org/10.1016/j.jclinepi.2015.09.001.
13. McPheeters ML, Kripalani S, Peterson NB, Idowu RT, Jerome RN, Potter SA,et al. Quality improvement interventions to address health disparities. In:Closing the quality gap: revisiting the state of the science. Evidence reportno. 208. (prepared by the Vanderbilt University evidence-based practicecenter under contract no. 290–2007-10065.) AHRQ publication no. 12-E009-EF. Rockville: Agency for Healthcare Research and Quality; 2012. https://effectivehealthcare.ahrq.gov/sites/default/files/pdf/disparities-quality-improvement_research.pdf.
14. Higgins JP, Altman DG, Gøtzsche PC, Jüni P, Moher D, Oxman AD, et al.Cochrane Bias methods group; Cochrane Statistical Methods Group TheCochrane Collaboration's tool for assessing risk of bias in randomised trials.BMJ. 2011;343:d5928. https://doi.org/10.1136/bmj.d5928.
15. RevMan 2014. The Nordic Cochrane Centre, The Cochrane Collaboration.Review Manager (RevMan). Version 5.3. Copenhagen: The Nordic CochraneCentre, The Cochrane Collaboration; 2014.
16. Bellary S, O'Hare JP, Raymond NT, Gumber A, Mughal S, Szczepura A, et al.Enhanced diabetes care to patients of south Asian ethnic origin (the UnitedKingdom Asian Diabetes Study): a cluster randomised controlled trial.Lancet. 2008;371(9626):1769–76.
17. Berry DC, Williams W, Hall EG, Heroux R, Bennett-Lewis T. Imbeddinginterdisciplinary diabetes group visits into a community-based medicalsetting. Diabetes Educ. 2016;42(1):96–107.
18. DePue JD, Rosen RK, Seiden A, Bereolos N, Chima ML, Goldstein MG, et al.Implementation of a culturally tailored diabetes intervention withcommunity health workers in American Samoa. Diabetes Educat. 2013;39(6):761–71.
19. McDermott RA, Schmidt B, Preece C, Owens V, Taylor S, Li M, et al.Community health workers improve diabetes care in remote Australianindigenous communities: results of a pragmatic cluster randomizedcontrolled trial. BMC Health Serv Res. 2015;15:68.
20. Gucciardi E, DeMelo M, Lee RN, Grace SL. Assessment of two culturallycompetent diabetes education methods: individual versus individual plusgroup education in Canadian Portuguese adults with type 2 diabetes. EthnHealth. 2007;12(2):163–87.
21. Guo H, Tian X, Li R, Lin J, Jin N, Wu Z, Yu D. Reward-based, task-settingeducation strategy on glycemic control and self-management for low-incomeoutpatients with type-á2 diabetes. J Diabetes Investig. 2014;5(4):410–7.
22. Hotu C, Collins J, Harwood L, Whalley G, Doughty R, Gamble G, Braatvedt G.A community-based model of care improves blood pressure control anddelays progression of proteinuria, left ventricular hypertrophy and diastolicdysfunction in Maori and Pacific patients with type 2 diabetes and chronickidney disease: a randomized controlled trial. Nephrol Dial Transplant. 2010;25(10):3260–6.
23. Partapsingh VA, Maharaj RG, Rawlins JM. Applying the Stages of Changemodel to Type 2 diabetes care in Trinidad: A randomised trial. J NegatResults Biomed. 2011;10(1):13.
24. Shahid M, Mahar SA, Shaikh S, Shaikh Z-U-D. Mobile phone intervention toimprove diabetes care in rural areas of Pakistan: a randomized controlledtrial. J Coll Physicians Surg Pak. 2015;25(3):166–71.
25. Frosch DL, Uy V, Ochoa S, Mangione CM. Evaluation of a behavior supportintervention for patients with poorly controlled diabetes. Arch Intern Med.2011;171(22):2011–7.
26. Khan MA, Shah S, Grudzien A, Onyejekwe N, Banskota P, Karim S, et al. Adiabetes education multimedia program in the waiting room setting.Diabetes Ther. 2011;2(3):178–88. https://doi.org/10.1007/s13300-011-0007-y.Epub 2011 Aug 22
27. Rosal MC, Ockene IS, Restrepo A, White MJ, Borg A, Olendzki B, et al.Randomized trial of a literacy-sensitive, culturally tailored diabetes self-management intervention for low-income latinos: latinos en control.Diabetes Care. 2011;34(4):838–44.
28. Sixta CS, Ostwald S. Texas-Mexico border intervention by promotores forpatients with type 2 diabetes. Diabetes Educ. 2008;34(2):299–309.
29. Hill-Briggs F, Lazo M, Peyrot M, Doswell A, Chang YT, Hill MN, et al. Effect ofproblem-solving-based diabetes self-management training on diabetescontrol in a low income patient sample. J Gen Intern Med. 2011;26(9):972–8.
30. Rothschild SK, Martin MA, Swider SM, Tumialán Lynas CM, Janssen I, AveryEF, et al. Mexican American trial of community health workers: a
randomized controlled trial of a community health worker intervention forMexican Americans with type 2 diabetes mellitus. Am J Public Health. 2014;104(8):1540–8.
31. Palmas W, Findley SE, Mejia M, Batista M, Teresi J, Kong J, et al. Results ofthe northern Manhattan diabetes community outreach project: arandomized trial studying a community health worker intervention toimprove diabetes care in hispanic adults. Diabetes Care. 2014;37(4):963–9.
32. Walker EA, Shmukler C, Ullman R, Blanco E, Scollan-Koliopoulus M, CohenHW. Results of a successful telephonic intervention to improve diabetescontrol in urban adults: a randomized trial. Diabetes Care. 2011;34(1):2–7.
33. Davis RM, Hitch AD, Salaam MM, Herman WH, Zimmer-Galler IE, Mayer-DavisEJ. TeleHealth improves diabetes self-management in an underservedcommunity: diabetes TeleCare. Diabetes Care. 2010;33(8):1712–7.
34. Philis-Tsimikas A, Fortmann A, Lleva-Ocana L, Walker C, Gallo LC. Peer-leddiabetes education programs in high-risk Mexican Americans improveglycemic control compared with standard approaches: a project Dulcepromotora randomized trial. Diabetes Care. 2011;34(9):1926–31.
35. Brown SA, Blozis SA, Kouzekanani K, Garcia AA, Winchell M, Hanis CL.Dosage effects of diabetes self-management education for MexicanAmericans: the Starr County border health initiative. Diabetes Care. 2005;28(3):527–32.
36. Gerber BS, Brodsky IG, Lawless KA, Smolin LI, Arozullah AM, Smith EV, et al.Implementation and evaluation of a low-literacy diabetes educationcomputer multimedia application. Diabetes Care. 2005;28(7):1574–80.
37. Anderson-Loftin W, Barnett S, Bunn P, Sullivan P, Hussey J, Tavakoli A. Soulfood light: culturally competent diabetes education. Diabetes Educ. 2005;31(4):555–63.
38. Tang TS, Funnell MM, Sinco B, Spencer MS, Heisler M. Peer-led,empowerment-based approach to self-management efforts in diabetes(PLEASED): a randomized controlled trial in an African American community.Ann Fam Med. 2015;13(Suppl 1):S27–35.
39. Toobert DJ, Strycker LA, King DK, Barrera M Jr, Osuna D, Glasgow RE. Long-term outcomes from a multiple-risk-factor diabetes trial for Latinas: -íVivaBien! Transl Behav Med. 2011;1(3):416–26.
40. Tang TS, Funnell M, Sinco B, Piatt G, Palmisano G, Spencer MS, Kieffer EC,Heisler M. Comparative effectiveness of peer leaders and community healthworkers in diabetes selfmanagement support: results of a randomizedcontrolled trial. Diabetes Care. 2014;37(6):1525–34.
41. Negarandeh R, Mahmoodi H, Noktehdan H, Heshmat R, Shakibazadeh E.Teach back and pictorial image educational strategies on knowledge aboutdiabetes and medication/dietary adherence among low health literatepatients with type 2 diabetes. Prim Care Diabetes. 2013;7(2):111–8.
42. Weinstein E, Galindo RJ, Fried M, Rucker L, Davis NJ. Impact of a focusednutrition educational intervention coupled with improved access to freshproduce on purchasing behavior and consumption of fruits and vegetablesin overweight patients with diabetes mellitus. Diabetes Educat. 2014;40(1):100–6.
43. Phillips LS, Ziemer DC, Doyle JP, Barnes CS, Kolm P, Branch WT, et al. Anendocrinologist-supported intervention aimed at providers improvesdiabetes management in a primary care site: improving primary care ofAfrican Americans with diabetes (IPCAAD) 7. Diabetes Care. 2005;28(10):2352–60.
44. Welch G, Zagarins SE, Santiago-Kelly P, Rodriguez Z, Bursell SE, Rosal MC,et al. An internet-based diabetes management platform improves teamcare and outcomes in an urban Latino population. Diabetes Care. 2015;38(4):561–7.
45. Shea S, Weinstock RS, Teresi JA, Palmas W, Starren J, Cimino JJ, et al.IDEATel consortium. A randomized trial comparing telemedicine casemanagement with usual care in older, ethnically diverse, medicallyunderserved patients with diabetes mellitus: 5 year results of the IDEATelstudy. J Am Med Inform Assoc. 2009;16(4):446–56.
46. Kim MT, Kim KB, Huh B, Nguyen T, Han H-R, Bone LR, et al. The effect of acommunity-based self-help intervention: Korean Americans with type 2diabetes. Am J Prev Med. 2015 Nov;49(5):726–37.
47. Perez-Escamilla R, Damio G, Chhabra J, Fernandez ML, Segura-Perez S, Vega-Lopez S, et al. Impact of a community health workers-led structuredprogram on blood glucose control among Latinos with type 2 diabetes:The DIALBEST Trial. Diabetes Care. 2015;38(2):197–205. // () *National Centerfor Advancing Translational Sciences*
48. Spencer MS, Rosland AM, Kieffer EC, Sinco BR, Valerio M, Palmisano G, et al.Effectiveness of a community health worker intervention among African
Terens et al. BMC Endocrine Disorders (2018) 18:31 Page 17 of 18
American and Latino adults with type 2 diabetes: a randomized controlledtrial. Am J Public Health. 2011;101(12):2253–60.
49. Prezio EA, Cheng D, Balasubramanian BA, Shuval K, Kendzor DE, Culica D.Community diabetes education (CoDE) for uninsured Mexican Americans: arandomized controlled trial of a culturally tailored diabetes education andmanagement program led by a community health worker. Diabetes ResClin Pract. 2013;100(1):19–28. https://doi.org/10.1016/j.diabres.2013.01.027.
50. Thom DH, Ghorob A, Hessler D, Vore D, Chen E, Bodenheimer TA. Impact ofpeer health coaching on glycemic control in low-income patients withdiabetes: a randomized controlled trial. Ann Fam Med. 2013;11(2):137–44.
51. Gary TL, Batts-Turner M, Yeh HC, Hill-Briggs F, Bone LR, Wang NY, et al. Theeffects of a nurse case manager and a community health worker team ondiabetic control, emergency department visits, and hospitalizations amongurban African Americans with type 2 diabetes mellitus: a randomizedcontrolled trial. Arch Intern Med. 2009;169(19):1788–94.
52. Kim MT, Han HR, Song HJ, Lee JE, Kim J, Ryu JP, et al. A community-based,culturally tailored behavioral intervention for Korean Americans with type 2diabetes. Diabetes Educat. 2009;35(6):986–94.
53. Liou J-K, Soon M-S, Chen C-H, Huang T-F, Chen Y-P, Yeh Y-P, et al. Sharedcare combined with telecare improves glycemic control of diabetespatients in a rural, underserved community. J Diabetes Sci Technol. 2013;7(1):A82.
54. Lujan J, Ostwald SK, Ortiz M. Promotora diabetes intervention for MexicanAmericans. Diabetes Educ. 2007;33(4):660–70.
55. Levy NK, Moynihan V, Nilo A, Singer K, Etiebet M-A, Bernik L, et al. Themobile insulin titration intervention (MITI) study: innovative chronic diseasemanagement of diabetes. J Gen Intern Med. 2015;30:S547–S8.
56. Cramer JS, Sibley RF, Bartlett DP, Kahn LS, Loffredo L. An adaptation of thediabetes prevention program for use with high-risk, minority patients withtype 2 diabetes. Diabetes Educat. 2007;33(3):503–8.
57. Garcia AA, Brown SA, Horner SD, Zuniga J, Arheart KL. Home-based diabetessymptom self-management education for Mexican Americans with type 2diabetes. Health Educ Res. 2015;30(3):484–96.
58. Babamoto KS, Sey KA, Camilleri AJ, Karlan VJ, Catalasan J, Morisky DE.Improving diabetes care and health measures among hispanics usingcommunity health workers: results from a randomized controlled trial.Health Educ Behav. 2009;36(1):113–26.
59. Lynch EB, Liebman R, Ventrelle J, Avery EF, Richardson D. A self-management intervention for African Americans with comorbid diabetesand hypertension: a pilot randomized controlled trial. Prev Chronic Dis.2014;11:E90.
60. Tobe SW, Pylypchuk G, Wentworth J, Kiss A, Szalai JP, Perkins N, et al. Effectof nurse-directed hypertension treatment among first nations people withexisting hypertension and diabetes mellitus: the diabetes risk evaluationand microalbuminuria (DREAM 3) randomized controlled trial. CMAJ. 2006;174(9):1267–71.
61. Anderson DR, Christison-Lagay J, Villagra V, Liu H, Dziura J. Managing thespace between visits: a randomized trial of disease management fordiabetes in a community health center. J Gen Intern Med. 2010;25(10):1116–22.
62. Baradaran HR, Knill-Jones RP, Wallia S, Rodgers A. A controlled trial of theeffectiveness of a diabetes education programme in a multi-ethniccommunity in Glasgow [ISRCTN28317455]. BMC Public Health. 2006;6:134.
63. Brown SA, García AA, Winter M, Silva L, Brown A, Hanis CL. Integratingeducation, group support, and case management for diabetic Hispanics.Ethn Dis. 2011;21(1):20–6.
64. Forjuoh SN, Bolin JN, Huber Jr JC, Vuong AM, Adepoju OE, Helduser JW,et al. Behavioral and technological interventions targeting glycemic controlin a racially/ethnically diverse population: a randomized controlled trial.BMC Public Health. 2014;14:71.
65. Gregg JA, Callaghan GM, Hayes SC, Glenn-Lawson JL. Improving diabetesself-management through acceptance, mindfulness, and values: arandomized controlled trial. J Consult Clin Psychol. 2007;75(2):336–43.
66. Heisler M, Choi H, Palmisano G, Mase R, Richardson C, Fagerlin A, et al.Comparison of community health worker-led diabetes medication decision-making support for low-income Latino and African American adults withdiabetes using e-health tools versus print materials: a randomized,controlled trial. Ann Intern Med. 2014;161(10 Suppl):S13–22.
67. Schillinger D, Hammer H, Wang F, Palacios J, McLean I, Tang A, et al. Seeingin 3-D: examining the reach of diabetes self-management supportstrategies in a public health care system. Health Educ Behav. 2008;35(5):664–82.
68. Skelly AH, Carlson JR, Leeman J, Holditch-Davis D, Soward AC. Symptom-focused management for African American women with type 2 diabetes: apilot study. J Nurs Scholarsh. 2005;18(4):213–20.
69. Wayne N, Perez DF, Kaplan DM, Ritvo P. Health coaching reduces HbA1c intype 2 diabetic patients from a lower-socioeconomic status community: arandomized controlled trial. J Med Internet Res. 2015;17(10):e224.
70. West DS, DiLillo V, Bursac Z, Gore SA, Greene PG. Motivational interviewingimproves weight loss in women with type 2 diabetes. Diabetes Care. 2007;30(5):1081–7.
71. Seligman HK, Wang FF, Palacios JL, Wilson CC, Daher C, Piette JD, et al.Physician notification of their diabetes patients' limited health literacy. Arandomized, controlled trial. J Gen Intern Med. 2005;20(11):1001–7.
72. Ruggiero L, Moadsiri A, Butler P, Oros SM, Berbaum ML, Whitman S, et al.Supporting diabetes self-care in underserved populations: a randomizedpilot study using medical assistant coaches. Diabetes Educ. 2010;36(1):127–31.
73. Willard-Grace R, Chen EH, Hessler D, DeVore D, Prado C, Bodenheimer T,et al. Health coaching by medical assistants to improve control of diabetes,hypertension, and hyperlipidemia in low-income patients: a randomizedcontrolled trial. Ann Fam Med. 2015;13(2):130–8.
74. Glazier RH, Bajcar J, Kennie NR, Willson K. A systematic review ofinterventions to improve diabetes care in socially disadvantagedpopulations. Diabetes Care. 2006;29(7):1675–88.
75. Ivers NM, Tricco AC, Taljaard M, Halperin I, Turner L, Moher D, et al. Qualityimprovement needed in quality improvement randomised trials: systematicreview of interventions to improve care in diabetes. BMJ Open. 2013;3(4):e002727. https://doi.org/10.1136/bmjopen-2013-002727.
Terens et al. BMC Endocrine Disorders (2018) 18:31 Page 18 of 18
Related Documents