University of Huddersfield Repository Dehe, Benjamin and Bamford, David Quality Function Deployment and operational design decisions – A healthcare infrastructure development case study Original Citation Dehe, Benjamin and Bamford, David (2017) Quality Function Deployment and operational design decisions – A healthcare infrastructure development case study. Production Planning & Control. ISSN 0953-7287 This version is available at http://eprints.hud.ac.uk/id/eprint/32321/ The University Repository is a digital collection of the research output of the University, available on Open Access. Copyright and Moral Rights for the items on this site are retained by the individual author and/or other copyright owners. Users may access full items free of charge; copies of full text items generally can be reproduced, displayed or performed and given to third parties in any format or medium for personal research or study, educational or not-for-profit purposes without prior permission or charge, provided: • The authors, title and full bibliographic details is credited in any copy; • A hyperlink and/or URL is included for the original metadata page; and • The content is not changed in any way. For more information, including our policy and submission procedure, please contact the Repository Team at: [email protected]. http://eprints.hud.ac.uk/

Welcome message from author
This document is posted to help you gain knowledge. Please leave a comment to let me know what you think about it! Share it to your friends and learn new things together.
Transcript

University of Huddersfield Repository
Dehe, Benjamin and Bamford, David
Quality Function Deployment and operational design decisions – A healthcare infrastructure development case study
Original Citation
Dehe, Benjamin and Bamford, David (2017) Quality Function Deployment and operational design decisions – A healthcare infrastructure development case study. Production Planning & Control. ISSN 09537287
This version is available at http://eprints.hud.ac.uk/id/eprint/32321/
The University Repository is a digital collection of the research output of theUniversity, available on Open Access. Copyright and Moral Rights for the itemson this site are retained by the individual author and/or other copyright owners.Users may access full items free of charge; copies of full text items generallycan be reproduced, displayed or performed and given to third parties in anyformat or medium for personal research or study, educational or notforprofitpurposes without prior permission or charge, provided:
• The authors, title and full bibliographic details is credited in any copy;• A hyperlink and/or URL is included for the original metadata page; and• The content is not changed in any way.
For more information, including our policy and submission procedure, pleasecontact the Repository Team at: [email protected].
http://eprints.hud.ac.uk/
Full Terms & Conditions of access and use can be found athttp://www.tandfonline.com/action/journalInformation?journalCode=tppc20
Download by: [Computing & Library Services, University of Huddersfield] Date: 03 August 2017, At: 05:36
Production Planning & ControlThe Management of Operations
ISSN: 0953-7287 (Print) 1366-5871 (Online) Journal homepage: http://www.tandfonline.com/loi/tppc20
Quality Function Deployment and operationaldesign decisions – a healthcare infrastructuredevelopment case study
Benjamin Dehe & David Bamford
To cite this article: Benjamin Dehe & David Bamford (2017): Quality Function Deployment andoperational design decisions – a healthcare infrastructure development case study, ProductionPlanning & Control, DOI: 10.1080/09537287.2017.1350767
To link to this article: http://dx.doi.org/10.1080/09537287.2017.1350767
© 2017 The Author(s). Published by InformaUK Limited, trading as Taylor & FrancisGroup
Published online: 13 Jul 2017.
Submit your article to this journal
Article views: 90
View related articles
View Crossmark data
Production Planning & control, 2017https://doi.org/10.1080/09537287.2017.1350767
Quality Function Deployment and operational design decisions – a healthcare infrastructure development case study
Benjamin Dehe and David Bamford
Huddersfield Business School, university of Huddersfield, Huddersfield, uK
ABSTRACT The purpose of this paper is to demonstrate how QFD can enhance a healthcare organisation’s strategic operational alignment, by synchronising the infrastructure design with the service intention. In this empirical paper, a case study of a £15 million infrastructure development has been used as the unique context to assess and test the experimental findings. QFD was utilised in order to capture and transform the requirements of decision-makers, providers, patients and local communities into both service and building design for Project K, a healthcare infrastructure, in the U.K. Two full iterations of the QFD results are presented. Using QFD generated effectiveness and efficiency by creating an information exchange platform and providing the stakeholders with a framework to optimise the decision-making. This paper makes a practical contribution by empirically testing the QFD modelling and providing evidence of its implementation within the complex, dynamic and evolving nature of the healthcare built environment sector.
1. Introduction
Infrastructure development is a complex and dynamic set of operations. Its complexity often creates uncertainty and varia-tion, which prevents the planning and design processes from being effective and efficient (Pellicer et al. 2014). Kagioglou and Tzortzopoulos (2010) identified that research has demonstrated that the current design of healthcare in the built environment does not effectively meet the users’ or consumers’ needs or desires. These infrastructures do not have the ability to provide and deliver efficient healthcare services. Francis (2010) and Trant (2010) explained how important the design is within healthcare infrastructures, as it impacts staff performance, patient health outcomes and users’ safety.
In their publication, commissioned by The Nuffield Trust, Francis and Glanville (2002) proposed that organisations need to engage further in a stimulating and creative dialogue with different groups of stakeholders; for instance, between the design decision-makers and the external design experts, in order to foster and develop quality buildings. In the report, it is suggested that the planning and design processes must be seen as catalyst pro-cesses for change, encouraging innovative approaches. Moreover, it emphasised that a framework for the iterative exchange of information between the different stakeholders needs to be put in place to explore and trigger innovation. However, according to Francis and Glanville (2002), the reality is that the vast major-ity of the design provision is disengaged from the needs of the healthcare system. Barlow and Koberle-Gaiser (2008) investigated the effects of planning, finance, construction and operation on the project delivery system for new hospitals. They suggested
that new public procurement models do not automatically pro-vide efficiency and innovation benefits. Therefore, certainly at a local level, there are inefficiencies throughout the development process, despite advice, guidance and support from the Estates and Facilities directorate in the procurement and management of healthcare infrastructures, facilities and services (DoH 2006). These issues have been directly observed by the researchers where particular healthcare organisations have experienced extremely long planning (average = 4 years) and design (aver-age = 2.5 years) cycle time (Bamford et al. 2015). An interviewee corroborated and explained that
the main issues are around the time it takes from planning to comple-tion. We need to find a solution to be able to reduce this cycle time; it can take up to 15 years, from the conception to the completion.
The current ad hoc methods used and the silo structure lead to inefficiencies in the planning, design, construction and man-agement, and is illustrated by the long development cycle time, the non-fitness for purpose and the lack of innovation (Alves, Milberg, and Walsh 2012) as well as the shortcomings of many new hospital design and layout (Kagioglou and Tzortzopoulos 2010; Wood et al. 2016).
This study will demonstrate to what extent Quality Function Deployment (QFD) can be applied in the built environment, despite its complexity, to overcome issues related to (i) linking the planning and design phases, (ii) capturing and using the ‘voice of the customer’ (VoC) as a design input, (iii) enhancing the communication and decision-making processes for the main stakeholders and (iv) provide an alternative and robust method to complex infrastructure procurement.
ARTICLE HISTORYreceived 17 october 2016 accepted 25 June 2017
KEYWORDSQFd; decision-making; healthcare infrastructure; built environment
© 2017 the author(s). Published by informa uK limited, trading as taylor & Francis group.this is an open access article distributed under the terms of the creative commons attribution-noncommercial-noderivatives license (http://creativecommons.org/licenses/by-nc-nd/4.0/), which permits non-commercial re-use, distribution, and reproduction in any medium, provided the original work is properly cited, and is not altered, transformed, or built upon in any way.
CONTACT Benjamin dehe [email protected]
OPEN ACCESS
Dow
nloa
ded
by [
Com
putin
g &
Lib
rary
Ser
vice
s, U
nive
rsity
of
Hud
ders
fiel
d] a
t 05:
36 0
3 A
ugus
t 201
7
2 B. DEHE AND D. BAMFORD
performances by meeting, or exceeding, customer demand and requirements by increasing customer satisfaction (Bouchereau and Rowlands 2000; Chan and Wu 2002; Gonzalez et al. 2004).
However, there are issues which have also been reported and summarised by Andronikidis et al. (2009). They explained that, firstly, QFD can be a long, onerous and cumbersome process (Bouchereau and Rowlands 2000; Chan and Wu 2002). A large amount of data must be gathered from customers, competi-tors and decision-makers, and processed to fit the QFD format. Sometimes, the relationships are difficult to establish and can depend upon the decision-makers’ perspectives and subjectivi-ties. It is possible that bias is injected at some stage of the QFD, the correlation amongst the various characteristics can lead to confusion, and the targets can be set imprecisely (Bouchereau and Rowlands 2000). Moreover, it is extremely important to note that QFD should be undertaken as an ongoing process, but that a saturation of data and information needs to be achieved for optimum results and conclusion. More specifically, QFD assumes that there are linear relationships between the customer require-ments and the product or service characteristics, which is a sim-plified version of the reality (Karsak, Sozer, and Alpteki 2002). In other words, QFD assumes that the customer requirements are deterministic, belonging to the known domain and do not change substantially over time (Xie, Tan, and Goh 2003). QFD is a technique that aggregates both qualitative and quantitative data, but remains overall an interpretative structure (Andronikidis et al. 2009; Bouchereau and Rowlands 2000; Dagersten, Heywood, and Chatwin 1998). Therefore, some authors explained that QFD could be improved using more quantitative techniques, such as Analytical Hierarchy Process (AHP), to compensate for some of its subjective weaknesses (Dai and Blackhurst 2012; Kwong and Bai 2003). Integrating pairwise comparison would bring in a system-atic process to overcome some of the disadvantages and reduce the decision-makers’ subjectivity, for instance by controlling the decision-makers’ bias, and improving the imprecise custom-ers’ ranking requirements (Kwong and Bai 2003). Ho, Dey, and Lockström (2011) combined QFD and AHP to enhance strategic sourcing decisions, where QFD enabled translating the require-ment into the selection criteria and AHP allowed the weighting and the evaluation of those criteria. Karsak, Sozer, and Alpteki (2002) merged both to determine the intensity of the relation-ship between the requirements and the characteristics and Dai and Blackhurst (2012) combined both to measure the voice of stakeholder in the process.
2.3. QFD applications
Despite their manufacturing grounded origins, QFD has been successfully implemented within other sectors. Deszca, Munro, and Noori (1999), Chang and Chen (2011) and Zawati and Dweiri (2016) explored its application to the service sector, such as hotels and airline, for improving service and process design. It has also been implemented in the e-commerce sector (Tan, Tang, and Forrester 2004; Waterworth and Eldridge 2010), education (Koksal and Egitman 1998; Lam and Zhao 1998), (e)banking (Gonzalez et al. 2004; Shahin, Bagheri Iraj, and Vaez Shahrestani 2016), hospitality and tourism (Das and Mukherjee 2008; Dube, Johnson, and Renaghan 1999), public sector (Gerst 2004), retail (Sher 2006), information services (Chin et al. 2001)
2. Literature review
2.1. QFD mechanism
In order to allow capturing and meeting customer requirements through the design process, QFD uses several linked matrix dia-grams to present and exchange information (Evans and Lindsay 1996; Waterworth and Eldridge 2010). These connections of matrices are often referred as the ‘House of Quality’ (HoQ); as they form the shape of a house when put together (Waterworth and Eldridge 2010). Kutucuoglu et al. (2001) explained that, often, a QFD activity may require several iterations of HoQ to get down to the appropriate level of detail, where, in sequence, the customer requirements will be translated into specific technical characteristics, and so on.
The primary difference between QFD and other conven-tional quality management tools is that quality is being built into a product, and not inspected out of it (Lochner and Matar 1990). It is emphasised that the main feature of QFD is to collect the VoC, in order to provide the starting point for the identifi-cation of the technical requirements during and throughout a new product or service development, in a systematic manner (Murali, Pugazhendhi, and Muralidharan 2016; Sharifi, Ismail, and Reid 2006). QFD is powerful as it provides a framework to break down the objectives and to optimise the trade-offs throughout all stages of the development, from design to productions (Abdul-Rahman, Kwan, and Woods 1999). To work effectively, QFD needs to be developed by a cross-functional team, including research and development, design engineering and production, as well as finance and marketing. When QFD is well implemented, it pro-vides an excellent interdepartmental means of communication that creates a common quality focus across all functions/opera-tions in an organisation (Andronikidis et al. 2009). Communication and teamwork, within an organisation, must be greatly enhanced in order to make QFD work successfully (Dube, Johnson, and Renaghan 1999; Gerst 2004; Griffin 1992). By integrating the cus-tomer demands with the technical aspects, and aligning these with the resources and capability of the organisation, a firm can optimise its products and services as well as its own structure. Hence, QFD is not only a methodological tool, but a universal concept that provides a means of translating customer require-ments during each stage of the service development (Chan and Wu 2002).
2.2. QFD benefits and drawbacks
Andronikidis et al. (2009) and Murali, Pugazhendhi, and Muralidharan (2016) reviewed the benefits of implementing QFD. They explained that it supports the cost reductions of new product development, reduces the rework and design changes, and reduces the risk of failure (Bouchereau and Rowlands 2000; Gonzalez et al. 2004; Griffin and Hauser 1993). It was identi-fied that QFD supports the process to speed up the design and lowers cycle times substantially (Griffin 1992; Xie, Tan, and Goh 2003), as well as bringing stability into the quality assur-ance planning and increasing the possibility for breakthrough innovation (Vinodh, Devadasan, and Rajanayagam 2008; Xie, Tan, and Goh 2003) notably by enhancing cross-functional team communication (Chan and Wu 2002; Griffin and Hauser 1993). Ultimately, it improves the firm’s overall operational
Dow
nloa
ded
by [
Com
putin
g &
Lib
rary
Ser
vice
s, U
nive
rsity
of
Hud
ders
fiel
d] a
t 05:
36 0
3 A
ugus
t 201
7
PRODUCTION PLANNING & CONTROL 3
and web interface (Hamilton and Selen 2004). Furthermore, some applications of QFD can be found within the healthcare sector (Chang 2006; George 2003; Lim and Tang 2000; Lim, Tang, and Jackson 1999) and the construction sector (Abdul-Rahman, Kwan, and Woods 1999; Dijkstra and Van der Bij 2001; Dikmen, Birgonul, and Kiziltas 2005; Gilbert III, Omar, and Farid 2016; Kassela, Papalexi, and Bamford 2017; Moghimi et al. 2017; Rahman and Qureshi 2008; Wang 2014). However, despite these construction-related studies, the application remains limited in depth, scale and scope, and implementations are scarce and embryonic compared to other sectors (Dikmen, Birgonul, and Kiziltas 2005). This is evidenced and supported by Cudney and Gillis (2016) who are aiming to propel further research of QFD in construction after their systematic literature review. Abdul-Rahman, Kwan, and Woods (1999) published a paper describing the concepts and techniques of QFD, applied to a low-cost housing scheme, which was the first example within the construction industry. John et al. (2014) undertook a study to understand the level of awareness of QFD in construction in Nigeria, finding very little evidence. Other applications of QFD in the built environment can be found in Ahmed, Sang, and Torbica (2003) who showed that QFD can be successfully used in the planning phase of civil engineering project. Delgado-Hernandez et al. (2007) applied QFD to plan and design a nurs-ery, while explaining that the QFD benefits have not been fully realised in construction. Finally, Eldin and Hikle (2003) used it to design large size classroom and Wood et al. (2016) applied it to design a ‘green’ hospital in Malaysia. Although academics and practitioners seem to slowly be moving more towards aspect of its application in the construction, this remains infrequent, sup-porting the contribution of this study both at the practical and theoretical level (Cudney and Gillis 2016 and Dikmen, Birgonul, and Kiziltas 2005).
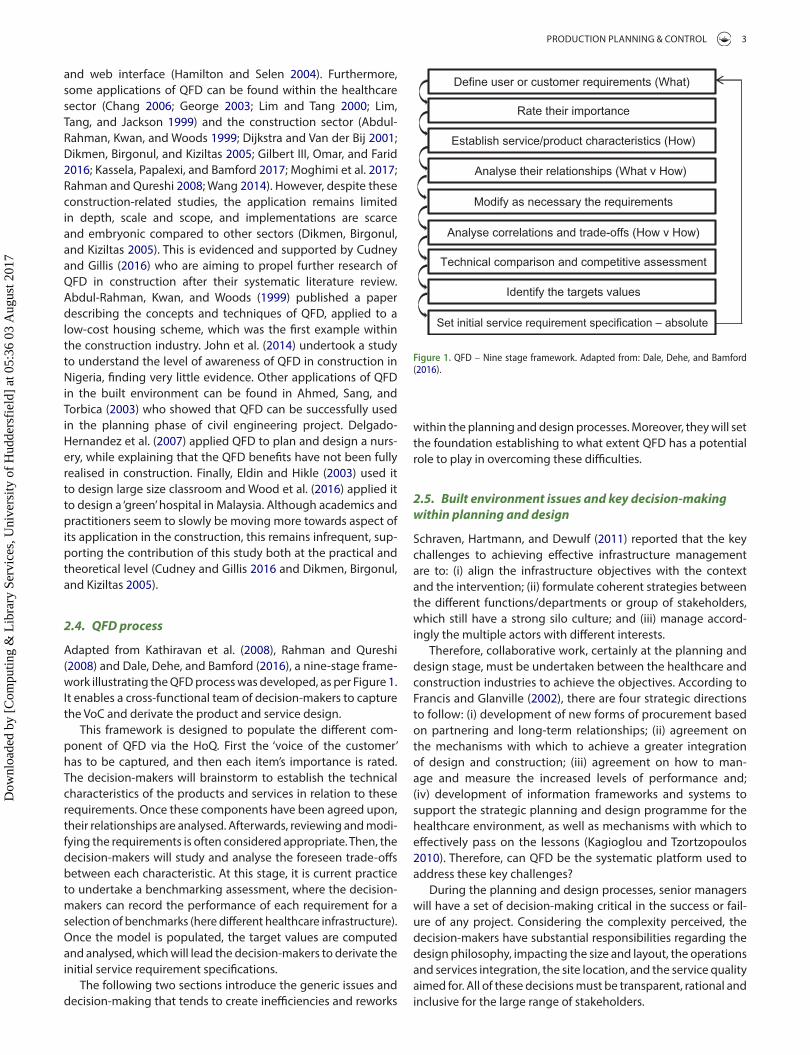
2.4. QFD process
Adapted from Kathiravan et al. (2008), Rahman and Qureshi (2008) and Dale, Dehe, and Bamford (2016), a nine-stage frame-work illustrating the QFD process was developed, as per Figure 1. It enables a cross-functional team of decision-makers to capture the VoC and derivate the product and service design.
This framework is designed to populate the different com-ponent of QFD via the HoQ. First the ‘voice of the customer’ has to be captured, and then each item’s importance is rated. The decision-makers will brainstorm to establish the technical characteristics of the products and services in relation to these requirements. Once these components have been agreed upon, their relationships are analysed. Afterwards, reviewing and modi-fying the requirements is often considered appropriate. Then, the decision-makers will study and analyse the foreseen trade-offs between each characteristic. At this stage, it is current practice to undertake a benchmarking assessment, where the decision- makers can record the performance of each requirement for a selection of benchmarks (here different healthcare infrastructure). Once the model is populated, the target values are computed and analysed, which will lead the decision-makers to derivate the initial service requirement specifications.
The following two sections introduce the generic issues and decision-making that tends to create inefficiencies and reworks
within the planning and design processes. Moreover, they will set the foundation establishing to what extent QFD has a potential role to play in overcoming these difficulties.
2.5. Built environment issues and key decision-making within planning and design
Schraven, Hartmann, and Dewulf (2011) reported that the key challenges to achieving effective infrastructure management are to: (i) align the infrastructure objectives with the context and the intervention; (ii) formulate coherent strategies between the different functions/departments or group of stakeholders, which still have a strong silo culture; and (iii) manage accord-ingly the multiple actors with different interests.
Therefore, collaborative work, certainly at the planning and design stage, must be undertaken between the healthcare and construction industries to achieve the objectives. According to Francis and Glanville (2002), there are four strategic directions to follow: (i) development of new forms of procurement based on partnering and long-term relationships; (ii) agreement on the mechanisms with which to achieve a greater integration of design and construction; (iii) agreement on how to man-age and measure the increased levels of performance and; (iv) development of information frameworks and systems to support the strategic planning and design programme for the healthcare environment, as well as mechanisms with which to effectively pass on the lessons (Kagioglou and Tzortzopoulos 2010). Therefore, can QFD be the systematic platform used to address these key challenges?
During the planning and design processes, senior managers will have a set of decision-making critical in the success or fail-ure of any project. Considering the complexity perceived, the decision-makers have substantial responsibilities regarding the design philosophy, impacting the size and layout, the operations and services integration, the site location, and the service quality aimed for. All of these decisions must be transparent, rational and inclusive for the large range of stakeholders.
Define user or customer requirements (What)
Rate their importance
Establish service/product characteristics (How)
Analyse their relationships (What v How)
Modify as necessary the requirements
Analyse correlations and trade-offs (How v How)
Technical comparison and competitive assessment
Identify the targets values
Set initial service requirement specification — absolute
Figure 1. QFd – nine stage framework. adapted from: dale, dehe, and Bamford (2016).
Dow
nloa
ded
by [
Com
putin
g &
Lib
rary
Ser
vice
s, U
nive
rsity
of
Hud
ders
fiel
d] a
t 05:
36 0
3 A
ugus
t 201
7
4 B. DEHE AND D. BAMFORD
research project, investigating the built environment practices of a healthcare organisation from a planning, design, construc-tion and management perspective. The researcher had an active role and unlimited access to the organisation over an extended time period of two years, and participated to some of the public consultation events.
Ryan, Scapens, and Theobald (2002) defined ‘a case study’ as a research method on its own. It can be used as an effective mech-anism by which to study, analyse and report on a phenomenon. Similarly, Yin (2009) explained that a case study can be selected by researchers who are interested in empirically exploring, explain-ing and illustrating a phenomenon in depth (i.e. the application of QFD within the healthcare built environment), by capturing a rich understanding of the phenomenon in a real-life context.
In this paper, the case study (referred to as Project K) was used as a vehicle, both to expose and test the experimental findings. QFD was led and deployed by one of the author to optimise the decision-making process behind the design of Project K, a £15 million infrastructure. The researcher proposed QFD, provided the expertise and facilitated its deployment, using a QFD Online template (QFD Online, 2007). The rationale for using a case study was to empirically test the modelling technique, provide evidence and proof of concept of its application in this complex healthcare built environment context.
To develop the QFD framework, a series of eight workshops, attended by different groups of stakeholders, was organised and facilitated by the researcher. To reach a satisfying level of detail to support the design decision-making process, two iterations of the models were necessary. The decision-makers were actively involved in the data collection, analysis and interpretation. The decision-makers were composed of a multi-disciplinary team of 10 senior managers: three members from Estates, three from Primary care, two service providers, one clinician and one planner. Moreover, the stakeholder group was composed of a sample of 22 patients, service users and providers, who had a direct inter-est in this project. Throughout the project, the groups remained the same to avoid confusion and promote continuity in the deci-sion-making process. Because of the nature and importance of this project, the decision-makers were committed and consist-ently actively participated to the workshops. Table 1 provides details regarding the different workshops organised.
As part of the public consultation for a new infrastructure develop process, the healthcare organisation collected a large set of data though patient needs’ questionnaires (an extensive survey of N = 3055 undertaken during the public consultation), focus group, and, from other consultation activities. These data were compiled to form the basis of the QFD inputs and was aggre-gated in the model during the series of workshop, as per Table 1.
Francis (2010) pointed out that effective design will provide efficient layout, supporting productive workflow, making best use of staff and technology, and will naturally impact on the reduction of waiting times and improve user experience by making path-ways clear. Moreover, Trant (2010) identified eight key attributes that make a good design: (i) the building needs to make a con-tribution to its local environment by being suitably integrated; (ii) the design should take advantage of open space; (iii) logical and clear pathways with one main reception is essential; (iv) the building needs to take advantage of the natural environment to create a sustainable infrastructure and utilise environmentally sensitive material and technology; (v) the design needs to con-sider a well-planned waiting area with fit for purpose finishes and furniture; (vi) the building should take advantage of natural light and have appropriate ventilation systems; (vii) the building needs to have effective, well-located storage space; and, finally (viii) the design should have the potential to be adapted easily for future changes and modifications. Hence, can QFD be the systematic platform used to capture and integrate these design attributes?
2.6. Evidence-based design (EBD), an emerging solution
Codinhoto et al. (2010) explained that evidence-based design (EBD) is a tool that supports sharing vast amounts of informa-tion in order to optimise design decisions between the archi-tects, engineers and healthcare planners. Malkin (2008) pointed out that EBD is an approach to assist decision-makers in mak-ing design decisions regarding the size design of the room, and the equipment within it, based on the available knowledge and information. Although Codinhoto et al. (2010) recognised its potential, they also acknowledged that the use of EBD for all decisions would be considerably challenging, given the times-cales and variety of decisions required. Therefore, it should only be used to support critical decisions (Codinhoto et al. 2010). Many of the EBD’s general features and objectives are similar to QFD; however, QFD mechanics are more detailed and prescrip-tive, as per the nine steps framework described in Section 2.4. It has been pointed out that EBD is relatively recent and lacks descriptive and practical evidence. Similarly to QFD, only a few applications are available in the context of new infrastructure development, and practitioners will need to develop their own models until EBD has been implemented within an effective interface, such as the Cochrane Collaboration. This emphasises the rationale for testing empirically QFD in a complex built envi-ronment in order to understand its potential and usefulness in this dynamic context of healthcare infrastructure development. To frame the research further, the following research questions have been posited: RQ1: to what extent is QFD a relevant and reliable solution to optimise new infrastructure design decisions? And RQ2: how can QFD be applied to support to capture the ser-vice needs, contribute towards the design decisions, and enable the alignment of the firm’s departments strategies?
3. Methodology
3.1. Research method
In order to address the two research questions, an embedded single-case study approach was derived from a wider action
Table 1. list of the QFd workshops.
No. Participants Workshop type Outcomes1 decision-makers (10) QFd presentation training and inputs2 decision-makers (10) QFd development initial model: QFd step 13 Stakeholders (22) QFd iteration iteration 1: QFd step 1–3 4 decision-makers (10) QFd iteration iteration 1: QFd step 4–95 decision-makers (10) QFd iteration iteration 2: QFd step 1–96 decision-makers (10) QFd assessment Model sense making 7 decision-makers (10) QFd assessment Model interpretation8 decision-makers (10) QFd assessment Model feedback
Dow
nloa
ded
by [
Com
putin
g &
Lib
rary
Ser
vice
s, U
nive
rsity
of
Hud
ders
fiel
d] a
t 05:
36 0
3 A
ugus
t 201
7
PRODUCTION PLANNING & CONTROL 5
Developing this infrastructure was a challenge for the organi-sation as this had not been planned or designed before. Therefore, QFD was proposed and tested to establish if it could offer a frame-work, to allow the decision-makers to conceptualise their ideas for Project K by integrating the voice of the local communities, and considering the financial and physical constraints.
4. Findings
4.1. The public consultation findings from the thematic analysis
Throughout the four months during which the local population and users directly engaged with the decision-makers to discuss Project K, a list of key requirements was developed. The follow-ing quotes represent some of the main and recurrent themes that were analysed from the different public consultation feed-back documents. It was important to the local population to have a: bright and welcoming building with lots of space, possi-bly with: multi-functional areas, ensuring maximum flexibility and some extra space for people to meet.
Moreover, members of the public and staff said that they were expecting: a building designed around people and their movements to ensure that it is cohesive. It was recorded that the users also required good communication and clear signage.
Future users said: the internal walls and static display should be used to provide information about where to access services. It was also mentioned that: signs should be written in several lan-guages and pictures provided, so that everyone can understand them. Some users explained that it would be important to have: friendly guides, or buddies, to help people to find their way around the building.
Furthermore, the aspects of sustainability and eco-friendliness were also specific requirements that the local population were keen to have: a purpose-built, efficient and eco-friendly building, using technologies to minimise the building’s environmental impact. Also, it was mentioned that: having an external area with wildlife and trees instead of shrubs would be beneficial.
The accessibility was a recurrent theme. The public were expecting: lots of free car parking, a dedicated space where people can be picked up or dropped off for appointments, and good bus routes, ideally with a bus stop outside the building.
Other issues, such as security and safety, were raised. It seemed important to have: security teams and cameras to help people feel secure, plus: first-class hygiene and infection control procedures were expected.
4.2. The QFD process – first iteration
QFD is used to assess the stakeholders’ key elements and require-ments, by following the nine steps process presented above.
4.2.1. Define service user and stakeholders’ requirementsThe decision-makers needed to define both the user and stake-holders’ requirements, based on their strategy and vision. This information was collected through the analysis of the patient needs’ questionnaires, focus group feedback, and, especially, from the consultation activities reports. Within the QFD team, the consensus was established and 10 main demands of quality,
The qualitative data collected from these four months of pub-lic consultation were analysed using thematic analysis and then coded to form the starting point of the QFD model. A coded com-prehensive list of the needs and requirements from the different stakeholder groups (patients, service users and providers) was established with their associated importance. This informed ele-ment of the weights and trade-offs in the QFD model. The public consultation for a new infrastructure development enabled the organisation to capture a large amount of qualitative data about the future users’ requirements, and ‘the voice of the customer’. Hence, the public consultation (part of the planning phase) and the QFD (part of the design phase) became two integrated pro-cesses for this project.
The analysis and interpretation of the QFD model was organic, iterative, and was led by the decision-makers once the consensus was established.
3.2. Data analysis
The assessments were agreed and made by the team based on primary and secondary data.
The workshops were structured around the review of the QFD model and the data from the public consultation, which would have been distributed to all decision-makers prior to the work-shops. A series of questions from the facilitator (the researcher) were asked throughout each workshop to ensure that all the dif-ferent perspectives had been captured and the data fully analysed. This enabled the recording of extra valuable data based on the feedback, reflections and comments from the decision-makers.
3.3. The case background – the decision-makers’ vision for Project K
Project K had a strategic and innovative focus. The healthcare organisation aimed to develop a state of the art building, to cre-ate an environment in which the local authorities, the council and the social services organisations could cohabit, under one roof, to offer and provide an integrated service to their local communities. This was part of the transformation programme, through which the decision-makers realised how important their infrastructure will be in the future as a vehicle, both to achieve their vision and to support the development of a com-petitive edge, and to become a world-class organisation.
The aim was to develop a range of innovative care packages, in collaboration with the aforementioned partners (local author-ities, council and social services), in order to provide an optimum care service for the patient. One of the objectives was to reduce hospital admissions, by being able to provide a fast diagnosis, and to have a more preventive approach to healthcare. To achieve this model of excellence of care, it was clear that, firstly, the infra-structure needed to be adequately designed. After all, it is the interface and the physical resource from which to provide the services. Furthermore, a new clinical services portfolio needed to be developed for creating the innovative care package; this would be achieved through suitable service and operation design. The organisation’s ambition for Project K was to design a patient-cen-tred approach, so as to create a sustainable local health economy for the local population and to change the current healthcare model, which is dominated by hospital delivery.
Dow
nloa
ded
by [
Com
putin
g &
Lib
rary
Ser
vice
s, U
nive
rsity
of
Hud
ders
fiel
d] a
t 05:
36 0
3 A
ugus
t 201
7
6 B. DEHE AND D. BAMFORD
access inside and outside; (xiii) to have different types of con-sulting rooms; (xiv) to have good signage and a clear layout, and; (xv) to be a single point of access with a pharmacy, physio and hot desk clinical specialist services.
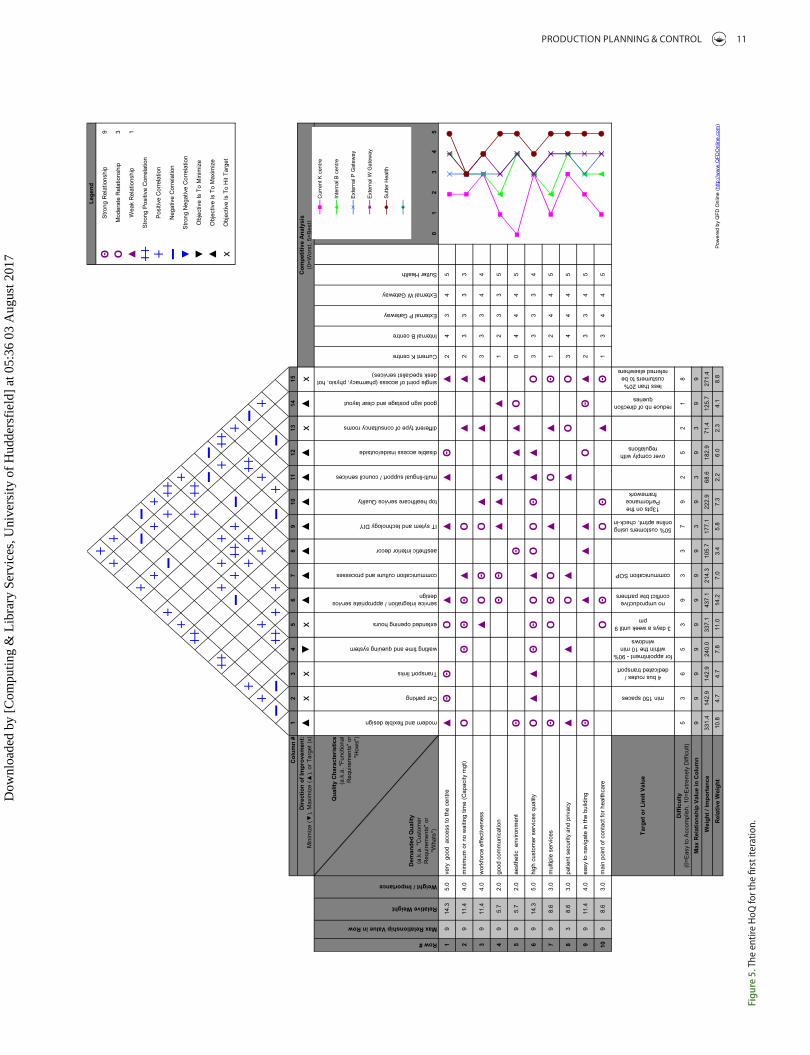
Following the technical characteristics, the HoQ facilitated the analysis between the requirements and the technical character-istics by analysis of each relationship, establishing a coefficient.
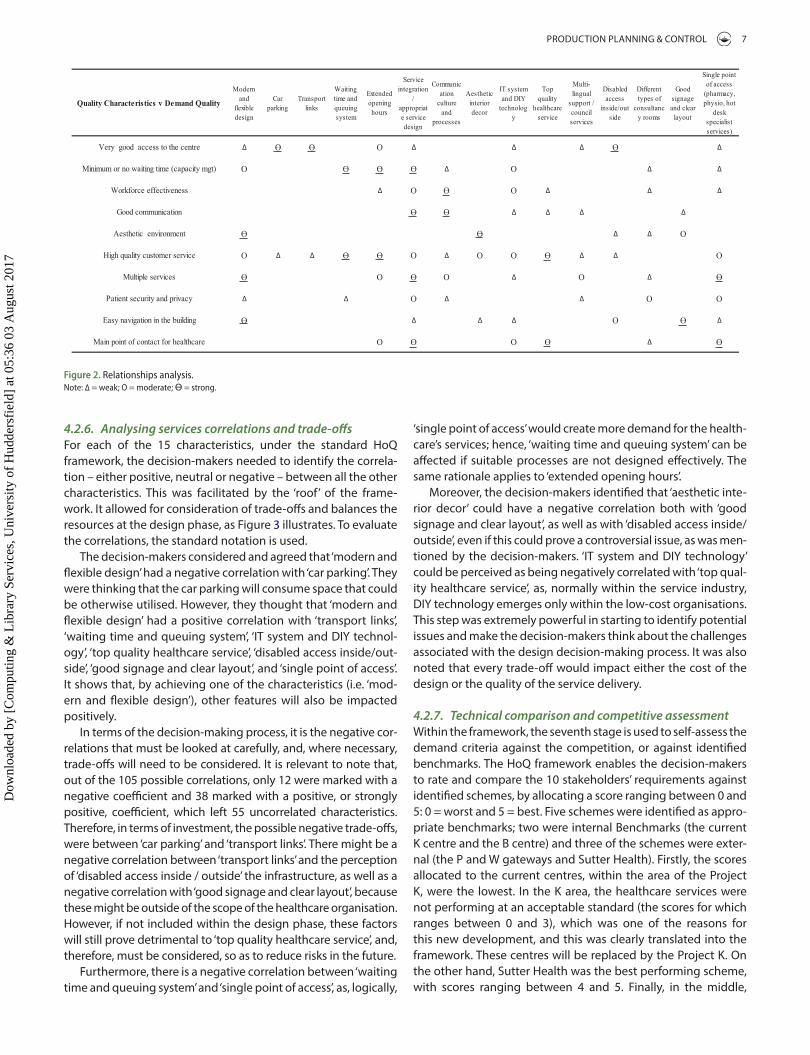
4.2.4. Analysing the requirements’ relationships with the characteristicsThe team of decision-makers analysed the relationships between each requirement and each characteristic in order to assess to what extent there was a correlation, according to a predefined scale. This needed to be agreed so as to build a consensus (1 or ∆ = weak relationship; 3 or O = moderate relationship; 9 or Ө = strong relationship), as Figure 2 shows.
The two most important requirements identified were ‘very good access to the centre’, and ‘high quality customer service’.
In this matrix, the decision-makers considered and agreed that ‘very good access to the centre’ had a weak relationship with ‘modern and flexible design’, ‘service integration/appropriate ser-vice design’, ‘IT system and DIY technology’, ‘multi-lingual support/council services’, and ‘single point of access’. The decision-makers deemed that ‘very good access to the centre’ would be achieved through the use of different aspects, and they did not think of it as external accessibility alone. Therefore, it was discussed that the use of performing IT systems and technology would support improvements in the access (i.e. use of telecare and providing an online booking website). Moreover, the decision-makers thought that providing ‘multi-lingual support/council services’ would increase access to a non-English speaking population, which happened to be high in this area. Furthermore, it was believed that, if the infrastructure was modern, patients would be more likely to use the services there instead of going to hospital. Lastly, if the service portfolio was to be integrated and the infrastructure had a single point of access strategy, then the patients would have greater access to the right care.
Furthermore, ‘very good access to the centre’ had a moderate relationship with ‘extended opening hours’. If the centre is open until 9 pm instead of 5 pm, more patients will have a greater access to care.
Finally, it was established that ‘very good access to the centre’ had a strong relationship with ‘car parking’, ‘transport links’ and ‘disabled access inside/outside’. The decision-makers agreed that these three characteristics would have a strong, positive impact on accessibility.
The researcher facilitated each intersection of the matrix dur-ing the workshops, in order to build a complete agreement with the decision-makers.
4.2.5. Modifying the requirements as necessaryAt this stage, a revision of the service/product characteristics is useful; this step created the opportunity to challenge the QFD results and the data input within the framework. As a result, it was decided to step back and review the process. The decision-makers agreed on the consensus, and aligned even further, their strategies and processes, in order to achieve the objectives which had started to emerge from the QFD, especially between Estates and Primary Care.
or stakeholder requirements, were identified. Therefore, the new infrastructure needed to meet the following requirements: (i) have very good accessibility; (ii) ensure minimum waiting time; (iii) have an effective workforce; (iv) demonstrate good communication; (v) provide an aesthetic environment; (vi) pro-vide excellent customer service; (vii) have multiple, integrated services; (viii) respect patient security and privacy; (ix) achieve a design which is easy to navigate through, and; (x) be the main and unique healthcare point of contact for the local population.
These requirements were sorted into different domains, including clinical vs. non-clinical, or infrastructure vs. services. This step translated the strategy and vision of the decision-mak-ers, and the users’ expectations.
4.2.2 Rates of importanceDuring the dedicated QFD workshop 3, 22 participants were asked to rate the importance of each of the 10 requirements, on a scale from 1 to 5 (1 = neutral, 2 = important, 3 = quite impor-tant, 4 = very important, 5 = extremely important). The mode for each of these 10 requirements was then selected, as shown in Table 2. This process allowed the decision-makers to focus on the features that the stakeholders perceived as being a priority in order to increase the user’s satisfaction.
‘Very good access to the centre’ and ‘high quality customer ser-vice’ were the most important criteria agreed by the decision-mak-ers to be ‘extremely important’, with an associated weighting of 5. Then, ‘minimum or no waiting time’, ‘workforce effectiveness’ and ‘easy navigation of the building’ were allocated a weighting of 4 and thought to be ‘very important’. ‘Multiple services’, ‘patient security and privacy’ and ‘main point of contact for healthcare’ had a weighting of 3, meaning that they were ‘quite important’. Finally, ‘good communication’ and ‘aesthetic environment’ had a weighting of 2.
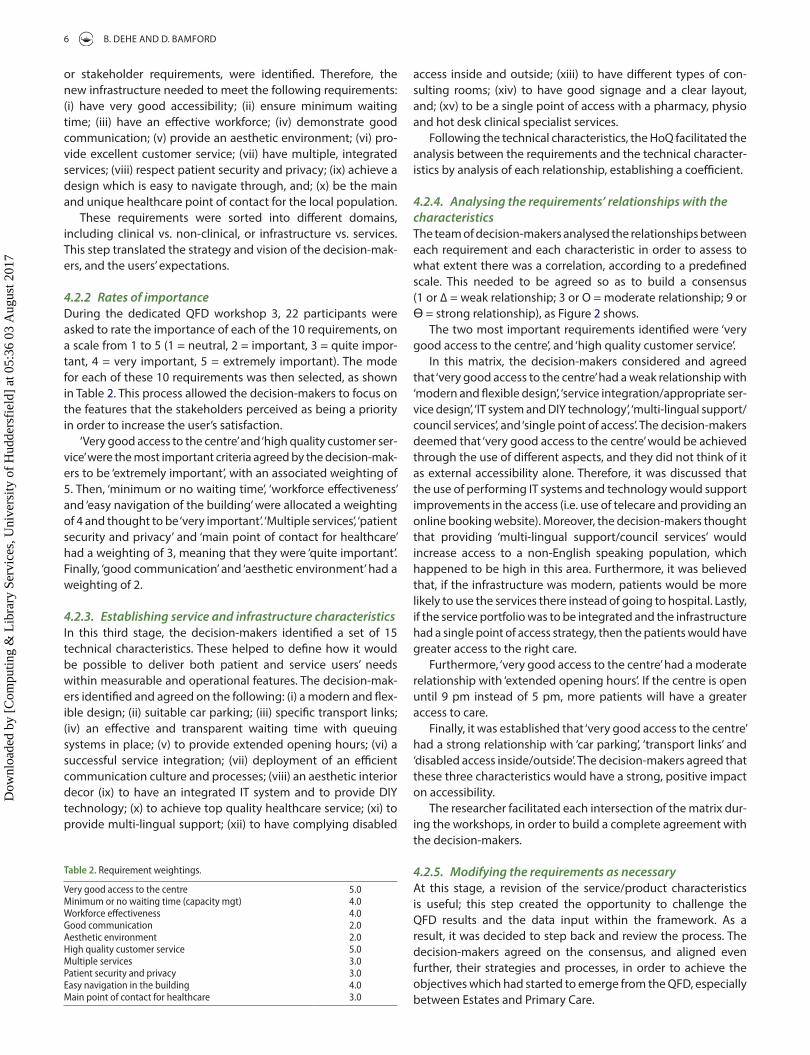
4.2.3. Establishing service and infrastructure characteristicsIn this third stage, the decision-makers identified a set of 15 technical characteristics. These helped to define how it would be possible to deliver both patient and service users’ needs within measurable and operational features. The decision-mak-ers identified and agreed on the following: (i) a modern and flex-ible design; (ii) suitable car parking; (iii) specific transport links; (iv) an effective and transparent waiting time with queuing systems in place; (v) to provide extended opening hours; (vi) a successful service integration; (vii) deployment of an efficient communication culture and processes; (viii) an aesthetic interior decor (ix) to have an integrated IT system and to provide DIY technology; (x) to achieve top quality healthcare service; (xi) to provide multi-lingual support; (xii) to have complying disabled
Table 2. requirement weightings.
Very good access to the centre 5.0Minimum or no waiting time (capacity mgt) 4.0Workforce effectiveness 4.0good communication 2.0aesthetic environment 2.0High quality customer service 5.0Multiple services 3.0Patient security and privacy 3.0Easy navigation in the building 4.0Main point of contact for healthcare 3.0
Dow
nloa
ded
by [
Com
putin
g &
Lib
rary
Ser
vice
s, U
nive
rsity
of
Hud
ders
fiel
d] a
t 05:
36 0
3 A
ugus
t 201
7
PRODUCTION PLANNING & CONTROL 7
‘single point of access’ would create more demand for the health-care’s services; hence, ‘waiting time and queuing system’ can be affected if suitable processes are not designed effectively. The same rationale applies to ‘extended opening hours’.
Moreover, the decision-makers identified that ‘aesthetic inte-rior decor’ could have a negative correlation both with ‘good signage and clear layout’, as well as with ‘disabled access inside/outside’, even if this could prove a controversial issue, as was men-tioned by the decision-makers. ‘IT system and DIY technology’ could be perceived as being negatively correlated with ‘top qual-ity healthcare service’, as, normally within the service industry, DIY technology emerges only within the low-cost organisations. This step was extremely powerful in starting to identify potential issues and make the decision-makers think about the challenges associated with the design decision-making process. It was also noted that every trade-off would impact either the cost of the design or the quality of the service delivery.
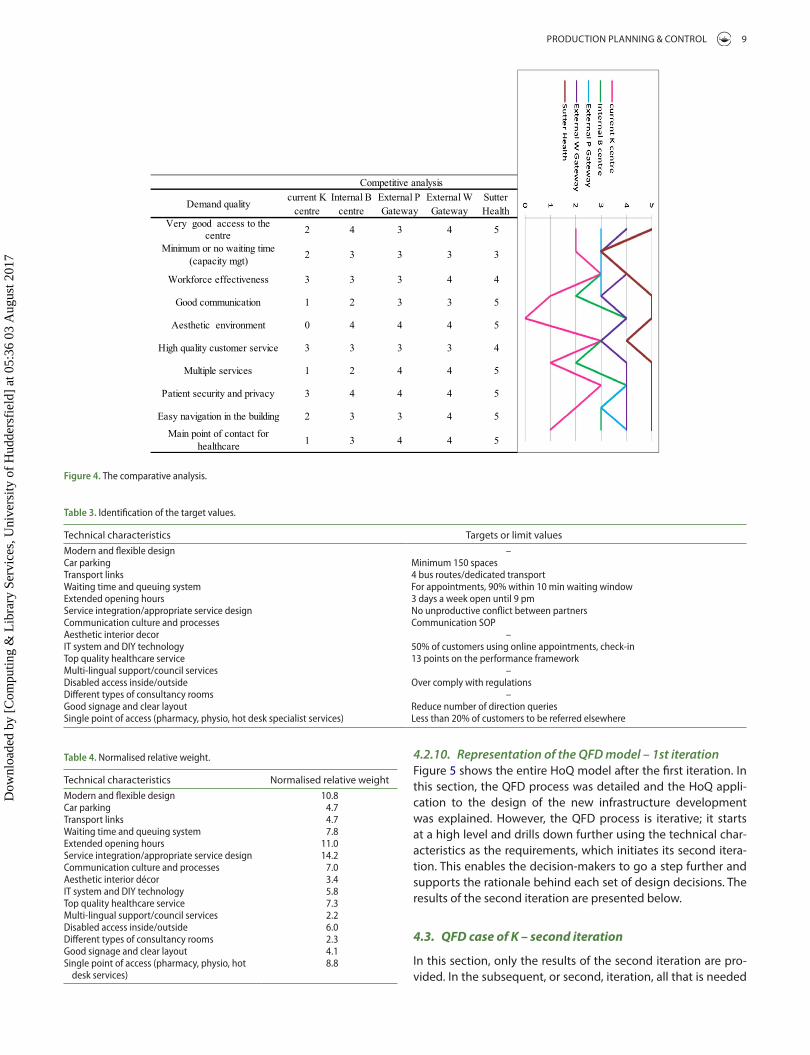
4.2.7. Technical comparison and competitive assessmentWithin the framework, the seventh stage is used to self-assess the demand criteria against the competition, or against identified benchmarks. The HoQ framework enables the decision-makers to rate and compare the 10 stakeholders’ requirements against identified schemes, by allocating a score ranging between 0 and 5: 0 = worst and 5 = best. Five schemes were identified as appro-priate benchmarks; two were internal Benchmarks (the current K centre and the B centre) and three of the schemes were exter-nal (the P and W gateways and Sutter Health). Firstly, the scores allocated to the current centres, within the area of the Project K, were the lowest. In the K area, the healthcare services were not performing at an acceptable standard (the scores for which ranges between 0 and 3), which was one of the reasons for this new development, and this was clearly translated into the framework. These centres will be replaced by the Project K. On the other hand, Sutter Health was the best performing scheme, with scores ranging between 4 and 5. Finally, in the middle,
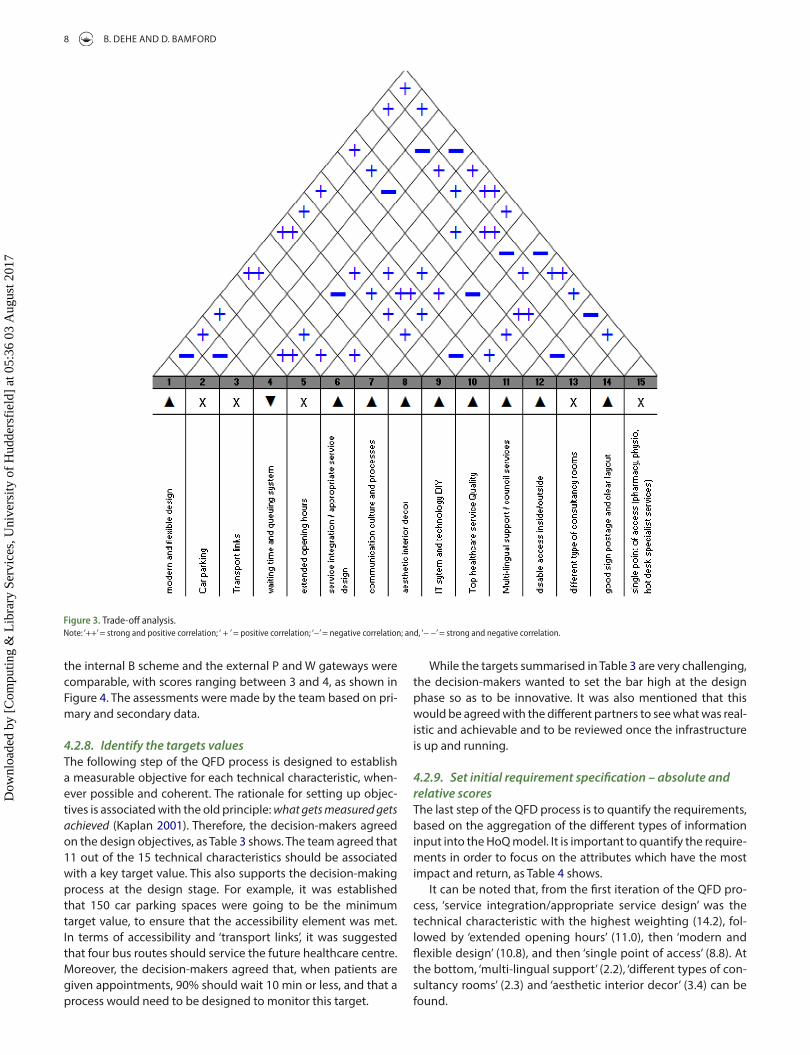
4.2.6. Analysing services correlations and trade-offsFor each of the 15 characteristics, under the standard HoQ framework, the decision-makers needed to identify the correla-tion – either positive, neutral or negative – between all the other characteristics. This was facilitated by the ‘roof’ of the frame-work. It allowed for consideration of trade-offs and balances the resources at the design phase, as Figure 3 illustrates. To evaluate the correlations, the standard notation is used.
The decision-makers considered and agreed that ‘modern and flexible design’ had a negative correlation with ‘car parking’. They were thinking that the car parking will consume space that could be otherwise utilised. However, they thought that ‘modern and flexible design’ had a positive correlation with ‘transport links’, ‘waiting time and queuing system’, ‘IT system and DIY technol-ogy’, ‘top quality healthcare service’, ‘disabled access inside/out-side’, ‘good signage and clear layout’, and ‘single point of access’. It shows that, by achieving one of the characteristics (i.e. ‘mod-ern and flexible design’), other features will also be impacted positively.
In terms of the decision-making process, it is the negative cor-relations that must be looked at carefully, and, where necessary, trade-offs will need to be considered. It is relevant to note that, out of the 105 possible correlations, only 12 were marked with a negative coefficient and 38 marked with a positive, or strongly positive, coefficient, which left 55 uncorrelated characteristics. Therefore, in terms of investment, the possible negative trade-offs, were between ‘car parking’ and ‘transport links’. There might be a negative correlation between ‘transport links’ and the perception of ‘disabled access inside / outside’ the infrastructure, as well as a negative correlation with ‘good signage and clear layout’, because these might be outside of the scope of the healthcare organisation. However, if not included within the design phase, these factors will still prove detrimental to ‘top quality healthcare service’, and, therefore, must be considered, so as to reduce risks in the future.
Furthermore, there is a negative correlation between ‘waiting time and queuing system’ and ‘single point of access’, as, logically,
Figure 2. relationships analysis.note: ∆ = weak; o = moderate; Ө = strong.
Dow
nloa
ded
by [
Com
putin
g &
Lib
rary
Ser
vice
s, U
nive
rsity
of
Hud
ders
fiel
d] a
t 05:
36 0
3 A
ugus
t 201
7
8 B. DEHE AND D. BAMFORD
While the targets summarised in Table 3 are very challenging, the decision-makers wanted to set the bar high at the design phase so as to be innovative. It was also mentioned that this would be agreed with the different partners to see what was real-istic and achievable and to be reviewed once the infrastructure is up and running.
4.2.9. Set initial requirement specification – absolute and relative scoresThe last step of the QFD process is to quantify the requirements, based on the aggregation of the different types of information input into the HoQ model. It is important to quantify the require-ments in order to focus on the attributes which have the most impact and return, as Table 4 shows.
It can be noted that, from the first iteration of the QFD pro-cess, ‘service integration/appropriate service design’ was the technical characteristic with the highest weighting (14.2), fol-lowed by ‘extended opening hours’ (11.0), then ‘modern and flexible design’ (10.8), and then ‘single point of access’ (8.8). At the bottom, ‘multi-lingual support’ (2.2), ‘different types of con-sultancy rooms’ (2.3) and ‘aesthetic interior decor’ (3.4) can be found.
the internal B scheme and the external P and W gateways were comparable, with scores ranging between 3 and 4, as shown in Figure 4. The assessments were made by the team based on pri-mary and secondary data.
4.2.8. Identify the targets valuesThe following step of the QFD process is designed to establish a measurable objective for each technical characteristic, when-ever possible and coherent. The rationale for setting up objec-tives is associated with the old principle: what gets measured gets achieved (Kaplan 2001). Therefore, the decision-makers agreed on the design objectives, as Table 3 shows. The team agreed that 11 out of the 15 technical characteristics should be associated with a key target value. This also supports the decision-making process at the design stage. For example, it was established that 150 car parking spaces were going to be the minimum target value, to ensure that the accessibility element was met. In terms of accessibility and ‘transport links’, it was suggested that four bus routes should service the future healthcare centre. Moreover, the decision-makers agreed that, when patients are given appointments, 90% should wait 10 min or less, and that a process would need to be designed to monitor this target.
Figure 3. trade-off analysis.note: ‘++’ = strong and positive correlation; ‘ + ’ = positive correlation; ‘−’ = negative correlation; and, ‘− −’ = strong and negative correlation.
Dow
nloa
ded
by [
Com
putin
g &
Lib
rary
Ser
vice
s, U
nive
rsity
of
Hud
ders
fiel
d] a
t 05:
36 0
3 A
ugus
t 201
7
PRODUCTION PLANNING & CONTROL 9
4.2.10. Representation of the QFD model – 1st iterationFigure 5 shows the entire HoQ model after the first iteration. In this section, the QFD process was detailed and the HoQ appli-cation to the design of the new infrastructure development was explained. However, the QFD process is iterative; it starts at a high level and drills down further using the technical char-acteristics as the requirements, which initiates its second itera-tion. This enables the decision-makers to go a step further and supports the rationale behind each set of design decisions. The results of the second iteration are presented below.
4.3. QFD case of K – second iteration
In this section, only the results of the second iteration are pro-vided. In the subsequent, or second, iteration, all that is needed
Figure 4. the comparative analysis.
Table 3. identification of the target values.
Technical characteristics Targets or limit valuesModern and flexible design –car parking Minimum 150 spacestransport links 4 bus routes/dedicated transportWaiting time and queuing system For appointments, 90% within 10 min waiting windowExtended opening hours 3 days a week open until 9 pmService integration/appropriate service design no unproductive conflict between partnerscommunication culture and processes communication SoPaesthetic interior decor –it system and diY technology 50% of customers using online appointments, check-intop quality healthcare service 13 points on the performance frameworkMulti-lingual support/council services –disabled access inside/outside over comply with regulationsdifferent types of consultancy rooms –good signage and clear layout reduce number of direction queriesSingle point of access (pharmacy, physio, hot desk specialist services) less than 20% of customers to be referred elsewhere
Table 4. normalised relative weight.
Technical characteristics Normalised relative weightModern and flexible design 10.8car parking 4.7transport links 4.7Waiting time and queuing system 7.8Extended opening hours 11.0Service integration/appropriate service design 14.2communication culture and processes 7.0aesthetic interior décor 3.4it system and diY technology 5.8top quality healthcare service 7.3Multi-lingual support/council services 2.2disabled access inside/outside 6.0different types of consultancy rooms 2.3good signage and clear layout 4.1Single point of access (pharmacy, physio, hot
desk services)8.8
Dow
nloa
ded
by [
Com
putin
g &
Lib
rary
Ser
vice
s, U
nive
rsity
of
Hud
ders
fiel
d] a
t 05:
36 0
3 A
ugus
t 201
7
10 B. DEHE AND D. BAMFORD
and Bamford 2015). However, much as with the application reported by Hamilton and Selen (2004), with the structured QFD framework in place, the respondents were more willing to share their ‘ambitious’ ideas, so that they could be taken into account. In terms of the synchronisation of agenda and strategy, QFD enabled the design process to be streamlined. Furthermore, echoing the research of Delano et al. (2000) it allowed materialising and visualising the decision-making pro-cesses, making the outcomes more objective and transparent for the stakeholders. This also aligns with the perspectives of Crowe and Cheng (1996).
5.2 RQ2: How can QFD be applied to support to capture the service needs, contribute towards the design decisions and enable the alignment of the firm’s departments strategies
QFD was used as a robust, user-oriented methodology, so as to speed-up the design decision process (Bamford et al. 2015) and help in achieving a consensus regarding service design, patient pathways, service integration and the building design, which came to pass through the discussions generated during the iter-ations of the HoQ. As with the Multiple Criteria Decision Analysis (MCDA) applications reported by Dehe and Bamford (2015), it tangibly helped to add transparency, rigour and robustness to the decision-making process, and was extremely effective when associated with the mapping of the service pathways and inte-grations. For this organisation, this was the first experiment to structure the design phase along with QFD or similar models such as EBD. The work of Bamford et al. (2015), reporting on the application of lean techniques within service and manufactur-ing domains, suggested that over time organisations will grow in maturity in their application of specific techniques. It can therefore be proposed that, each time QFD is applied the organ-isation will refine and develop its knowledge maturity and start the next application by populating it with even more accurate factors than the previous one. This then has the potential to further impact the tangible effectiveness and efficiency of the operational design decisions.
QFD also enables the focus to be on communication and cre-ates appropriate synergies between the different functions – it enables silo structures to be challenged, which was one of the main sources of frustrations and inefficiencies (Bamford et al. 2015). As per the early work by Hauser and Clausing (1988) report-ing the benefits of QFD, in this case it facilitated the planning and the communication, as well as supporting the co-ordination of skills, competencies and information needed to complete the design stage and optimise future construction and management of the infrastructure.
QFD was the planning and development technique deployed to provide the decision-makers, providers and suppliers, and con-tractors (Dehe and Bamford 2013) with a framework in which to collate and share structured information, in order to ensure that fitness for purpose was built into the design element of the infra-structure, as well as to take into account customer requirements. Ultimately, as per the work of Andronikidis et al. (2009) and Griffin (1992) this leads the organisation to achieve a competitive edge by satisfying customers, reducing costs, and, to a certain extent,
is to transfer the previous characteristics into the requirements. Therefore, without interpretation, this second iteration com-prises the 15 requirements, modified through the process of the first iteration as presented in Table 4, and the full cycle was undertaken again.
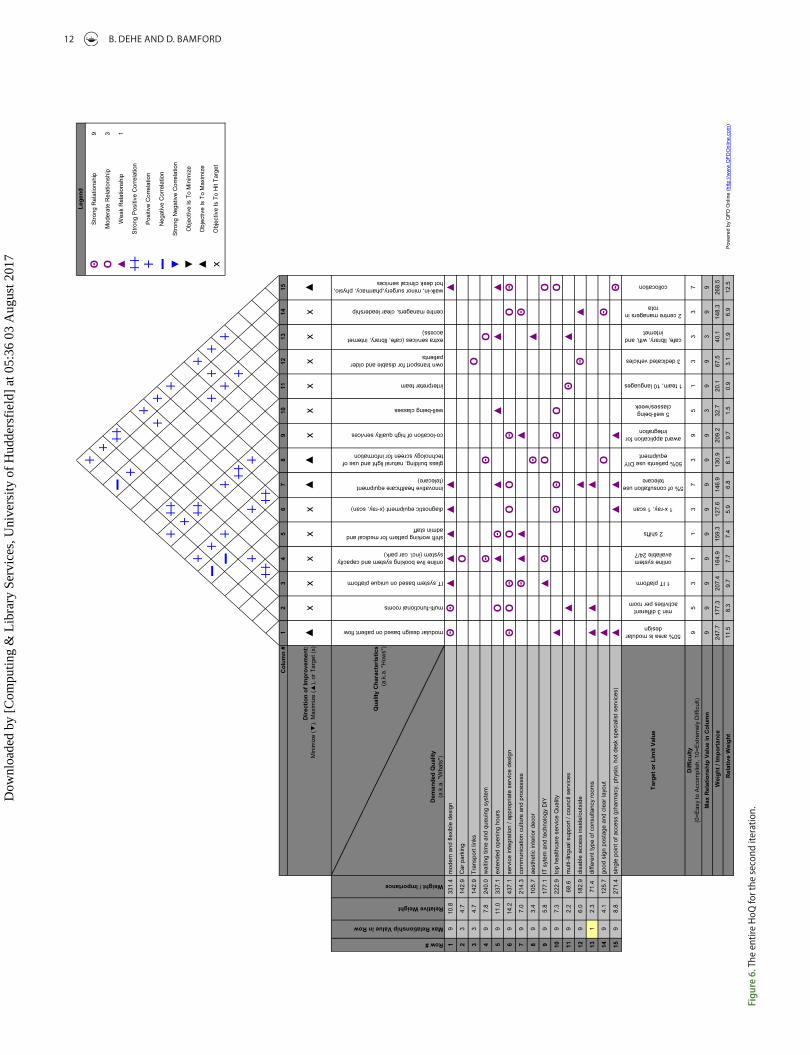
4.3.1. Representation of the QFD model – second iterationFigure 6 shows the entire HoQ model after the second iter-ation. This enabled the decision-makers to drill down a level to conceptualise the design even further, thus increas-ing their strategy alignment and developing a common vision. This also led the decision-makers to establish tar-gets, which will need to be achieved in line with their future perfect vision.
5. Discussion
To provide a clear structure for the discussion, this section has been arranged around the research questions.
5.1. RQ1: To what extent is QFD a relevant and reliable solution to optimise new infrastructure design decisions?
The results presented two iterations at the infrastructure level, in which the operations strategies and the ‘voice of the stake-holders’ were the starting point. The aims were: (i) to capture the voices of the decision-makers, customers, users and patients, and then translate them into the design of both the infrastruc-ture and the service operations; (ii) to further increase the align-ment of the different departmental strategies (estates, finance, primary care); and, (iii) to support the decision-making process at the design phase.
QFD was used to achieve higher performances in the design decisions and to ensure fitness for purpose within the design of the new infrastructure, which lead to user satisfaction, and, theo-retically, contribute to develop a competitive edge. This fits with the arguments put forward by Cauchick-Miguel (2005), Rahman and Qureshi (2008), and Sher (2006).
As with the work reported by Olhager and West (2002), the QFD process was well received by the team and they tangibly recognised its benefits. A decision-maker stated that
QFD adds value and supports the clarity of communication between the different stakeholder groups. It enabled synchronisation with the planners and architects. The more detailed information we can provide the architects, the designers, the planners, and the more accurate the tenant requirement documents are, the more chance we have got of getting the infrastructure fit for purpose.
It was explained that QFD enabled the organisation to cut down on some of the waste. Because we are more tightly speci-fying what we want, there is less waste, as we have more chance of getting what we want by identifying the requirements and commu-nicating them precisely, as opposed to providing vague instructions as we used to do.
It was observed that prior QFD, during a public consulta-tion of a new infrastructure development, respondents some-times struggled to generate positive, constructive feedback, and members of the public were only focused on the loca-tion rather than the service design (Bamford et al. 2015; Dehe
Dow
nloa
ded
by [
Com
putin
g &
Lib
rary
Ser
vice
s, U
nive
rsity
of
Hud
ders
fiel
d] a
t 05:
36 0
3 A
ugus
t 201
7
PRODUCTION PLANNING & CONTROL 11
Figu
re 5
. the
ent
ire H
oQ fo
r the
firs
t ite
ratio
n.
Dow
nloa
ded
by [
Com
putin
g &
Lib
rary
Ser
vice
s, U
nive
rsity
of
Hud
ders
fiel
d] a
t 05:
36 0
3 A
ugus
t 201
7
12 B. DEHE AND D. BAMFORD
Figu
re 6
. the
ent
ire H
oQ fo
r the
seco
nd it
erat
ion.
Dow
nloa
ded
by [
Com
putin
g &
Lib
rary
Ser
vice
s, U
nive
rsity
of
Hud
ders
fiel
d] a
t 05:
36 0
3 A
ugus
t 201
7
PRODUCTION PLANNING & CONTROL 13
interior decor’; ‘disabled access inside/outside’; ‘different types of consultancy rooms’; ‘good signage and clear layout’; ‘modular design based on patient flow’; ‘multi-functional rooms’; ‘diagnos-tic equipment (X-ray, scan)’; ‘glass building, natural light and use of technology screen for information’; ‘walk-in, minor surgery, pharmacy, physio, hot desk clinical and specialist services’ are all characteristics generated by and linked to the building structure, to a certain extent.
Conversely, ‘transport links’; ‘waiting time and queuing system’; ‘extended opening hours’; ‘service integration/appropriate service design’; ‘communication culture and processes’; ‘IT system and DIY technology’; ‘top quality healthcare service’; ‘multi-lingual support/council services’; ‘IT system based on unique platform’; ‘online, live booking system and capacity system (incl. car park)’; ‘shift working pattern for medical and admin staff’; ‘innovative healthcare equip-ment (telecare)’; ‘co-location of high quality services’; ‘well-being classes’; ‘interpreter team’; ‘own transport for disabled and older patients’; ‘extra services (cafe, library, internet access)’; ‘centre managers, clear leadership’ are all characteristics generated by and linked to the structure of the operations and services.
Hence, it could be suggested that HoQ models simulate each specific focus, increasing and optimising the decision-making processes still further, during the design phase, by bringing downstream stakeholders into upstream decision-making pro-cesses, and by increasing transparency and rationality. This helps to define and design the service integration, by overlaying the two structures – the building and the services. Ultimately, the decision-makers will be in position to reduce uncertainty and define the equipment and the workforce needs, with precision, by the end of the design phase.
In common with the results stated by Xie, Tan, and Goh (2003) regards the actual application of QFD, it tangibly sped up the design process compared to the original process; and hence,
by enhancing innovation (Vinodh, Devadasan, and Rajanayagam 2008) at infrastructure level.
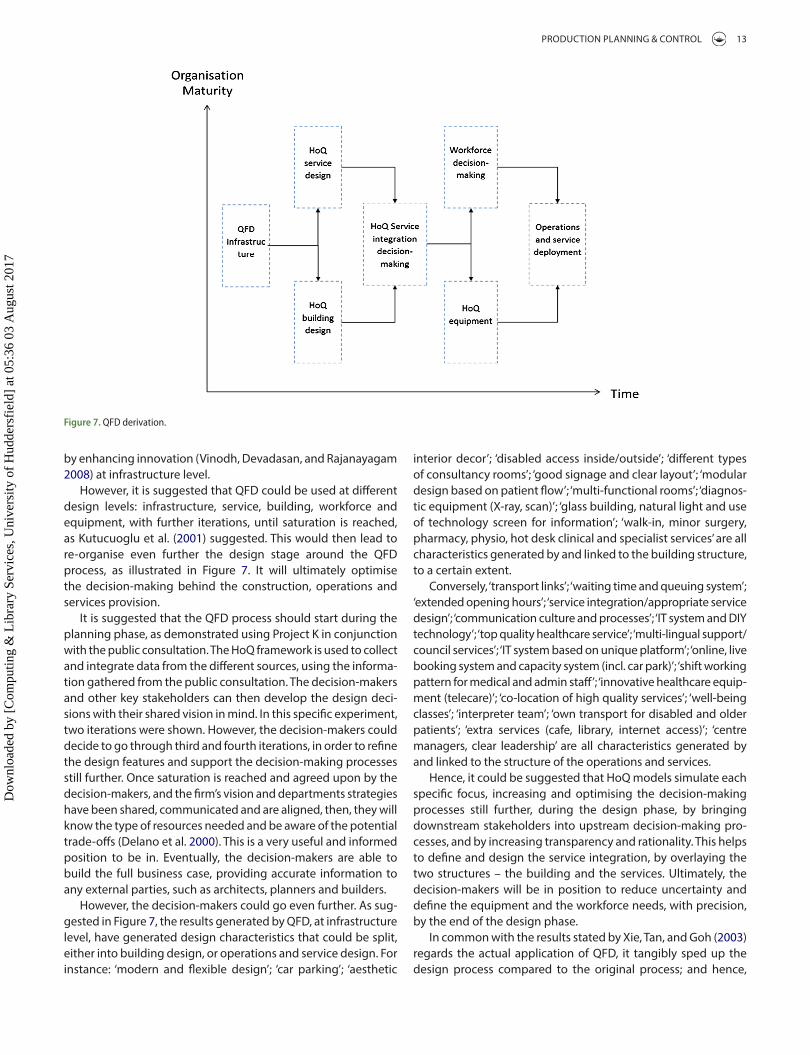
However, it is suggested that QFD could be used at different design levels: infrastructure, service, building, workforce and equipment, with further iterations, until saturation is reached, as Kutucuoglu et al. (2001) suggested. This would then lead to re-organise even further the design stage around the QFD process, as illustrated in Figure 7. It will ultimately optimise the decision-making behind the construction, operations and services provision.
It is suggested that the QFD process should start during the planning phase, as demonstrated using Project K in conjunction with the public consultation. The HoQ framework is used to collect and integrate data from the different sources, using the informa-tion gathered from the public consultation. The decision-makers and other key stakeholders can then develop the design deci-sions with their shared vision in mind. In this specific experiment, two iterations were shown. However, the decision-makers could decide to go through third and fourth iterations, in order to refine the design features and support the decision-making processes still further. Once saturation is reached and agreed upon by the decision-makers, and the firm’s vision and departments strategies have been shared, communicated and are aligned, then, they will know the type of resources needed and be aware of the potential trade-offs (Delano et al. 2000). This is a very useful and informed position to be in. Eventually, the decision-makers are able to build the full business case, providing accurate information to any external parties, such as architects, planners and builders.
However, the decision-makers could go even further. As sug-gested in Figure 7, the results generated by QFD, at infrastructure level, have generated design characteristics that could be split, either into building design, or operations and service design. For instance: ‘modern and flexible design’; ‘car parking’; ‘aesthetic
Figure 7. QFd derivation.
Dow
nloa
ded
by [
Com
putin
g &
Lib
rary
Ser
vice
s, U
nive
rsity
of
Hud
ders
fiel
d] a
t 05:
36 0
3 A
ugus
t 201
7
14 B. DEHE AND D. BAMFORD
implementations have been actively described within the built environment sector (Ahmed, Sang, and Torbica 2003; Cudney and Gillis 2016; Delgado-Hernandez, Bampton, and Aspinwall 2007; Dikmen, Birgonul, and Kiziltas 2005). This study addressed issues raised by academics (Cudney and Gillis 2016; Eldin and Hikle 2003; Moghimi et al. 2017) by demonstrating how QFD, based on its standard framework, the HoQ, was used by the decision-makers to support design decisions, in a very trans-parent and rational way, in a complex healthcare construction environment. Moreover, this led to the practical contribution of this study addressing concrete organisational problems. Design is an extremely complex activity; often lagging behind the over-all phase, and is regularly passed on to the external planners and architects, leading to long delays and poor decisions because disconnected to the users. QFD was implemented into Project K and demonstrated how: (i) it captures the ‘voice of the stake-holders, customers and patients’, and translating them into the design of both the infrastructure and the service operations; (ii) it further increases the alignment between the different depart-mental strategies, and; (iii) it supports the decision-making process during the design phase. This was achieved through an iterative process, facilitated by the HoQ, which enabled the cross-functional teams to drill down to the service design level, by analysing the service/product characteristics and setting up specific, explicit, transparent and measurable target values, based upon the desired requirements. QFD enabled: (i) the decision-makers to explore the relationships between the stake-holders’ vision and integrate it with the requirements from the local population, at the end of the planning phase and during the design phase; as well as, (ii) capturing the service needs to support the design decisions. This detailed, unique and doc-umented application of QFD constitutes relevant empirical findings for managers and project managers alike in the built environment, it offers a structured alternative to their planning and design practices. Moreover, it provides academics with a successful and in-depth case study, building on the embryonic and scare body of evidence of QFD implementations in the con-struction industry, complementing Ahmed, Sang, and Torbica (2003), Delgado-Hernandez, Bampton, and Aspinwall (2007), Dikmen, Birgonul, and Kiziltas (2005) and Eldin and Hikle (2003) works and addressing Cudney and Gillis (2016) calls.
6.2. Limitations and future research
Despite the contribution, we acknowledge three limitations. First, this study was ambitious in scope and scale but was still subject to restrictions in terms of time and access. It would have been beneficial to have been able to track further in time the imple-mentation and to analyse its impact onto the overall service quality. However, the practicalities of the research did not allow this. Second, arguably more iterations would lead to more accu-rate and detailed results. The study stopped after two iterations due its novelty for the decision-makers and the organisation’s maturity. We anticipate that the organisation convinced of the QFD impact will fully adopt it as part of its design processes in the future and run several iterations until saturation is reached. Third, these sets of findings are based on a single case study. This does not diminish the results’ quality and validity, but does not allow for their generalisation, and further applications will be studied.
reduced the overall cycle time, as well as bringing stability into the quality assurance planning, along with increased possi-bility for innovation (Bamford et al. 2015; Vinodh, Devadasan, and Rajanayagam 2008). This also fits with the reported works of Griffin (1992) regards the outputs from capturing the VoC. Furthermore, as per the works of Bouchereau and Rowlands (2000), who examined the ways QFD could be helped, and Gonzalez et al. (2004), who observed customer satisfaction of using QFD with e-banking, it perceptibly contributes towards cost reductions in the new infrastructure, by reducing the rework and design changes and reducing the risks of failure. Additionally, QFD allows the enhancement of cross-functional team communica-tion, as mentioned by Chan and Wu (2002), and Waterworth and Eldridge (2010). Finally, it will have improved the organisation’s overall, operational performances, by meeting or exceeding cus-tomer demands and requirements, thus increasing their overall satisfaction (Andronikidis et al. 2009; Bouchereau and Rowlands 2000; Chan and Wu 2002; Gonzalez et al. 2004).
The authors strongly believe that QFD can be used as an innovative solution to support the entire design phase (Vinodh, Devadasan, and Rajanayagam 2008). It has many similarities with EBD, as Codinhoto et al. (2010) suggested in their work focused on improving the healthcare built environment. Malkin (2008) also helped highlight the potential of providing a visual reference for EBD; like EBD, QFD assists the decision-makers in optimising decisions, regarding size and design of the infrastructure and the equipment needed, based on the available knowledge and information.
6. Conclusion
The purpose of this paper was to demonstrate how QFD has been implemented to support healthcare infrastructure design decisions. The planning and design phases need to be effec-tively linked – it was observed that a loss of momentum and time was occurring between these two phases (Bamford et al. 2015). It was established that using QFD, as the design process, could allow generating effectiveness and efficiency into the design phase. Through analysing the data collected during the planning phase, using QFD, it becomes possible to transparently build quality into the design of the operations and infrastruc-ture, especially when the integration of the services is being sought.
In terms of key messages, during the design phase of this £15 million project, it was important to create an information exchange structure between all the stakeholders involved. Here it was: GPs, clinical staff, the architects, the contractors, the sub-con-tractors and the experts: Estates, Finance, Service Development and Primary Care, which became possible through the use of QFD. By having a robust process in place to organise the design phase, the tenant requirements and the full business case, along with the financial modelling, could be integrated and synchronised. Through doing this, decision-making processes, within the design phase, were tangibly improved.
6.1 Managerial and theoretical contribution
The attractiveness of QFD is irrefutable and applications have been well documented, however, very few successful
Dow
nloa
ded
by [
Com
putin
g &
Lib
rary
Ser
vice
s, U
nive
rsity
of
Hud
ders
fiel
d] a
t 05:
36 0
3 A
ugus
t 201
7
PRODUCTION PLANNING & CONTROL 15
Barlow, J., and M. Koberle-Gaiser. 2008. “The Private Finance Initiative, Project Form and Design Innovation.” Research Policy 37: 1392–1402.
Bouchereau, V., and H. Rowlands. 2000. “Methods and Techniques to Help Quality Function Deployment (QFD).” Benchmarking: An International Journal 7 (1): 8–20.
Cauchick-Miguel, P. A. 2005. “Evidence of QFD Best Practices for Product Development: A Multiple Case Study.” International Journal of Quality and Reliability Management 22 (1): 72–82.
Chan, L. K., and M. L. Wu. 2002. “Quality Function Deployment: A Comprehensive Review of Its Concepts and Methods.” Quality Engineering 15 (1): 23–35.
Chang, C. L. 2006. “Application of Quality Function Deployment Launches to Enhancing Nursing Home Service Quality.” Total Quality Management & Business Excellence 17 (3): 287–302.
Chang, K. C., and M. C. Chen. 2011. “Applying the Kano Model and QFD to Explore Customers’ Brand Contacts in the Hotel Business: A Study of a Hot Spring Hotel.” Total Quality Management & Business Excellence 22 (1): 1–27.
Chin, K. S., K. F. Pun, M. W. Leung, and H. Lau. 2001. “A Quality Function Deployment Approach for Improving Technical Library and Information Services: A Case Study.” Library Management 22 (4/5): 195–204.
Codinhoto, R., B. Platten, P. Tzortzopoulos, and M. Kagioglou. 2010. “Supporting Evidence-based Design.” In Improving Healthcare through Built Environment Infrastructure, edited by M. Kagioglou and P. Tzortzopoulos, 151–165. Chichester: Wiley-Blackwell.
Crowe, T. J., and C. C. Cheng. 1996. “Using Quality Function Deployment in Manufacturing Strategic Planning.” International Journal of Operations and Production Management 16 (4): 35–48.
Cudney, E. A., and W. L. Gillis. 2016. “Quality Function Deployment Implementation in Construction: A Systematic Literature Review.” Frontiers of Engineering Management 3 (3): 224–230.
Dagersten, N., M. I. Heywood, and C. R. Chatwin. 1998. “Batch Process Control Using QFD Matrices and Simulation.” Production Planning and Control 9 (4): 335–348.
Dai, J., and J. Blackhurst. 2012. “A Four-phase AHP–QFD Approach for Supplier Assessment: A Sustainability Perspective.” International Journal of Production Research 50 (19): 5474–5490.
Dale, B., B. Dehe, and D. Bamford. 2016. “Quality Management Techniques.” In Managing Quality, An Essential Guide and Resource Gateway, edited by B. Dale, D. Bamford, and T. Van der Wiele, 215–267. Chichester: Wiley.
Das, D., and K. Mukherjee. 2008. “A QFD Approach to Addressing the Impacts of Tourism Development.” Journal of Quality Assurance in Hospitality & Tourism 8 (3): 1–38.
Dehe, B., and D. Bamford. 2013. “An Investigation into the Issues and Perceived Performances within Healthcare New Infrastructure Development Process.” The British Academy of Management Conference Proceedings, Liverpool, September 10–12th.
Dehe, B., and D. Bamford. 2015. “Development, Test and Comparison of Two Multiple Criteria Decision Analysis (MCDA) Models: A Case of Healthcare Infrastructure Location.” Expert Systems with Applications 42 (19): 6717–6727.
Delano, G., G. Parnell, C. Smith, and M. Vance. 2000. “Quality Function Deployment and Decision Analysis: A R&D Case Study.” International Journal of Operations and Production Management 20 (5): 591–609.
Delgado-Hernandez, D. J., K. E. Bampton, and E. Aspinwall. 2007. “Quality Function Deployment in Construction.” Construction Management and Economics 25 (6): 597–609.
Deszca, G., H. Munro, and H. Noori. 1999. “Developing Breakthrough Products: Challenges and Options for Market Assessment.” Journal of Operations Management 17: 613–630.
Dijkstra, L., and H. Van der Bij. 2001. “Quality Function Deployment in Healthcare, Methods for Meeting Customer Requirements in Redesign and Renewal.” International Journal of Quality and Reliability Management 19 (1): 67–89.
Dikmen, I., M. T. Birgonul, and S. Kiziltas. 2005. “Strategic Use of Quality Function Deployment (QFD) in the Construction Industry.” Building and Environment 40 (2): 245–255.
DoH (Department of Health). 2006. Our Health, Our Care, Our Community: Investing in the Future of Community Hospitals and Services. London: Her Majesty’s Stationery Office [HMSO].
Dube, L., M. D. Johnson, and L. M. Renaghan. 1999. “Adapting the QFD Approach to Extended Service Transactions.” Production and Operations Management 8 (3): 301–317.
With regard to potential future research, the authors would highly recommend increase used of QFD within innovative design projects to enhance infrastructure service quality. For instance, sim-ilar techniques can be used to optimise universities’ infrastructure design, where decision-makers face comparable issues. As QFD emerged from manufacturing, there is great potential for it to be used on a more frequent basis with regard to aspects of infrastruc-ture design and service provision. Perhaps the use of more quality techniques such as QFD, design of experiment, benchmarking and MCDA would result in more seamless construction delivery?
Disclosure statementNo potential conflict of interest was reported by the authors.
FundingThis work was supported by the Technology Strategy Board under [grant number 7698].
Notes on contributorsBenjamin Dehe, PhD, is a senior lecturer in Operations Management at the Business School, University of Huddersfield, U.K.. He focuses his research and work in the application of operations excellence, lean and six-sigma concepts and theories in manufacturing, built environment and sport. His work, which has been pub-lished in national and international journals such as: International Journal of Operations and Production Management, Expert Systems with Applications and
International Journal of Quality & Reliability Management, often focus on the decision-making processes.
David Bamford is Professor of Operations Management at the Business School, University of Huddersfield, U.K.. He is an experienced industrialist/academic with numer-ous publications to his name with over 100 articles, book chapters and reports. His multiple publications include two co-authored books: Managing Quality (2016); and Essential Guide to Operations Management (2010). Knowledge transfer projects, across many sectors, have been central to his academic career and his research
interests are focused towards operations improvement strategies, organisa-tional change, leadership and quality management.
ORCIDBenjamin Dehe http://orcid.org/0000-0002-3016-1871
ReferencesAbdul-Rahman, H., C. L. Kwan, and P. Woods. 1999. “Quality Function Deployment
in Construction Design: Application in Low‐cost Housing Design.” International Journal of Quality & Reliability Management 16 (6): 591–605.
Ahmed, S. M., L. P. Sang, and Ž. M. Torbica. 2003. “Use of Quality Function Deployment in Civil Engineering Capital Project Planning.” Journal of Construction Engineering and Management 129 (4): 358–368.
Alves, T., C. Milberg, and K. Walsh. 2012. “Exploring Lean Construction Practice, Research, and Education.” Engineering, Construction and Architectural Management 19 (5): 512–525.
Andronikidis, A., A. C. Georgiou, K. Gotzamani, and K. Kamvysi. 2009. “The Application of Quality Function Deployment in Service Quality Management.” The TQM Journal 21 (4): 319–333.
Bamford, D., P. Forrester, B. Dehe, and R. Leese. 2015. “Partial and Iterative Lean Implementation: Two Case Studies.” International Journal of Operations and Production Management 35 (5): 702–727.
Dow
nloa
ded
by [
Com
putin
g &
Lib
rary
Ser
vice
s, U
nive
rsity
of
Hud
ders
fiel
d] a
t 05:
36 0
3 A
ugus
t 201
7
16 B. DEHE AND D. BAMFORD
Lim, P. C., N. K. H. Tang, and P. M. Jackson. 1999. “An Innovative Framework for Health Care Performance Measurement.” Managing Service Quality 9 (6): 423–433.
Lochner, R. H., and J. E. Matar. 1990. Designing for Quality. New York: Chapman and Hall.
Malkin, J. 2008. A Visual Reference for Evidence-based Design. Concord, CA: The Centre for Health Design.
Moghimi, V., M. B. M. Jusan, P. Izadpanahi, and J. Mahdinejad. 2017. “Incorporating User Values into Housing Design through Indirect User Participation Using MEC-QFD Model.” Journal of Building Engineering 9: 76–83.
Murali, S., S. Pugazhendhi, and C. Muralidharan. 2016. “Integration of IPA and QFD to Assess the Service Quality and to Identify after Sales Service Strategies to Improve Customer Satisfaction–A Case Study.” Production Planning and Control 27 (5): 394–407.
Olhager, J. B., and M. West. 2002. “The House of Flexibility: Using the QFD Approach to Deploy Manufacturing Flexibility.” International Journal of Operations and Production Management 22 (1): 50–79.
Pellicer, E., V. Yepes, J. C. Teixeira, H. P. Moura, and J. Catala. 2014. Construction Management. Chichester: Wiley-Blackwell.
QFD Online. 2007. Traditional House of Quality. Accessed May 19 2017. http://www.qfdonline.com/templates/
Rahman, Z., and M. N. Qureshi. 2008. “Developing New Services Using Fuzzy QFD: A LIFENET Case Study.” International Journal of Health Care Quality Assurance 21 (7): 638–658.
Ryan, R. J., R. W. Scapens, and M. Theobald. 2002. Research Methods and Methodology in Accounting and Finance. 2nd ed. London: Thomson Learning.
Schraven, D., A. Hartmann, and G. Dewulf. 2011. “Effectiveness of Infrastructure Asset Management: Challenges for Public Agencies.” Built Environment Project and Asset Management 1 (1): 61–74.
Shahin, A., E. Bagheri Iraj, and H. Vaez Shahrestani. 2016. “Developing House of Quality by Integrating Top Roof and Side Roof Matrices and Service TRIZ with a Case Study in Banking Services.” The TQM Journal 28 (4): 597–612.
Sharifi, H., H. S. Ismail, and I. Reid. 2006. “Achieving Agility in Supply Chain through Simultaneous ‘Design of’ and ‘Design for’ Supply Chain.” Journal of Manufacturing Technology Management 17 (8): 1078–1098.
Sher, S. S. 2006. “The Application of Quality Function Deployment (QFD) in Product Development – The Case of Taiwan Hypermarket Building.” Journal of American Academy of Business 8 (2): 292–295.
Tan, B. L., N. K. Tang, and P. L. Forrester. 2004. “Application of QFD for e-business Planning.” Production Planning and Control 15 (8): 802–818.
Trant, K. 2010. “Designed with Care?: The Role of Design in Creating Excellent Community Healthcare Building.” In Improving Healthcare through Built Environment Infrastructure, edited by M. Kagioglou and P. Tzortzopoulos, 53–70. Chichester: Wiley-Blackwell.
Vinodh, S., S. R. Devadasan, and D. Rajanayagam. 2008. “The Case of Implementing Innovative Total Quality Function Deployment for Preventing the Sticking of the Latching Star in Electronic Switches.” Production Planning and Control 19 (8): 754–769.
Wang, A. J. 2014. “Application of QFD in the Design Stage of Comfortable Housing Project.” In Applied Mechanics and Materials, edited by C. Chen, G. Li, Q. Shen and B. Jiang. 2427–2431. Zurich: Trans Tech Publications.
Waterworth, A., and S. Eldridge. 2010. “An Investigation into the Application of QFD in e-commerce.” International Journal of Productivity and Quality Management 5 (3): 231–251.
Wood, L. C., C. Wang, H. Abdul-Rahman, and N. S. J. Abdul-Nasir. 2016. “Green Hospital Design: Integrating Quality Function Deployment and End-user Demands.” Journal of Cleaner Production 112: 903–913.
Xie, M., K. C. Tan, and T. N. Goh. 2003. Advanced QFD Applications – American Society for Quality. Milwaukee, WI: Quality Press.
Yin, R. K. 2009. Case Study Research Design and Methods. 4th ed. London: Sage.
Zawati, O. A. L., and F. Dweiri. 2016. “Application of Quality Function Deployment to Improve Smart Services Applications, Dubai Public Entity as a Case Study.” In Industrial Engineering and Engineering Management (IEEM), 2016 IEEE International Conference, Bali, Indonesia, 881–885.
Eldin, N., and V. Hikle. 2003. “Pilot Study of Quality Function Deployment in Construction Projects.” Journal of Construction Engineering and Management 129 (3): 314–329.
Evans, J. R., and W. M. Lindsay. 1996. The Management and Control of Quality. Cincinnati, OH: West Publishing.
Francis, S. 2010. “Plan for Uncertainty: Design for Change.” In Improving Healthcare through Built Environment Infrastructure, edited by M. Kagioglou and P. Tzortzopoulos, 40–52. Wiley-Blackwell.
Francis, S., and R. Glanville. 2002. 2020 Vision: Our Future Healthcare Environments. Commissioned by The Nuffield Trust. Accessed January 18, 2016. https://www.buildingfutures.org.uk/assets/downloads/pdffile_1.pdf.
George, M. L. 2003. Lean Six Sigma for Service: How to Use Lean Speed and Six Sigma Quality to Improve Services and Transactions. New York: McGraw-Hill.
Gerst, M. R. 2004. “QFD in Large-scale Social System Redesign.” International Journal of Quality and Reliability Management 21 (9): 959–972.
Gilbert III, L. R., M. A. Omar, and A. M. Farid. 2016. “An Application of Quality Function Deployment and Axiomatic Design to the Conceptual Design of Temporary Housing.” In Axiomatic Design in Large Systems, 201–222. Cham: Springer International Publishing.
Gonzalez, M. E., G. Quesada, F. Picado, and C. A. Eckelman. 2004. “Customer Satisfaction Using QFD: An e-banking Case.” Managing Service Quality: An International Journal 14 (4): 317–330.
Griffin, A. 1992. “Evaluating QFD’s Use in US Firms as a Process for Developing Products.” Journal of Product Innovation Management 9 (3): 171–187.
Griffin, A., and J. R. Hauser. 1993. “The Voice of the Customer.” Marketing Science 12 (1): 1–27.
Hamilton, J., and W. Selen. 2004. “Enabling Real Estate Service Chain Management through Personalised Web Interfacing Using QFD.” International Journal of Operations and Production Management 24 (3): 270–288.
Hauser, J., and D. Clausing. 1988. “The House of Quality.” Harvard Business Review, May–June 1988: 63–73.
Ho, W., P. K. Dey, and M. Lockström. 2011. “Strategic Sourcing: A Combined QFD and AHP Approach in Manufacturing.” Supply Chain Management: An International Journal 16 (6): 446–461.
John, R., A. Smith, S. Chotipanich, and M. Pitt. 2014. “Awareness and Effectiveness of Quality Function Deployment (QFD) in Design and Build Projects in Nigeria.” Journal of Facilities Management 12 (1): 72–88.
Kagioglou, M., and P. Tzortzopoulos, eds. 2010. Improving Healthcare through Built Environment Infrastructure. Chichester: Wiley-Blackwell.
Kaplan, R. S. 2001. “Strategic Performance Measurement and Management in Nonprofit Organizations.” Nonprofit Management and Leadership 11 (3): 353–370.
Karsak, E. E., S. Sozer, and S. E. Alpteki. 2002. “Product Planning in Quality Function Deployment Using a Combined Analytic Network Process and Goal Programming Approach.” Computers and Industrial Engineering 44: 171–190.
Kassela, K., M. Papalexi, and D. Bamford. 2017. “Applying Quality Function Deployment to Social Housing?” The TQM Journal 29 (3): 422–437.
Kathiravan, N., S. R. Devadasan, T. B. Michael, and S. K. Goyal. 2008. “Total Quality Function Deployment in a Rubber Processing Company: A Sample Application Study.” Production Planning and Control 19 (1): 53–66.
Koksal, G., and A. Egitman. 1998. “Planning and Design of Industrial Engineering Education Quality.” Computers and Industrial Engineering 35 (3-4): 639–642.
Kutucuoglu, K., J. Hamali, Z. Irani, and J. M. Sharp. 2001. “A Framework for Managing Maintenance Using Performance Measurement Systems.” International Journal of Operations and Production Management 21 (1/2): 173–195.
Kwong, C. K., and H. Bai. 2003. “Determining the Importance Weights for the Customer Requirements in QFD Using a Fuzzy AHP with an Extent Analysis Approach.” IIE Transactions 35 (7): 619–626.
Lam, K., and X. Zhao. 1998. “An Application of Quality Function Deployment to Improve the Quality of Teaching.” International Journal of Quality and Reliability Management 15 (4): 389–413.
Lim, P. C., and N. K. H. Tang. 2000. “The Development of a Model for Total Quality Healthcare.” Managing Service Quality 10 (2): 103–111.
Dow
nloa
ded
by [
Com
putin
g &
Lib
rary
Ser
vice
s, U
nive
rsity
of
Hud
ders
fiel
d] a
t 05:
36 0
3 A
ugus
t 201
7
Related Documents