A PROJECT REPORT ON QUALITY CIRCLES AT BHEL A PROJECT REPORT ON QUALITY CIRCLES AT BHEL 1

Welcome message from author
This document is posted to help you gain knowledge. Please leave a comment to let me know what you think about it! Share it to your friends and learn new things together.
Transcript

A PROJECT REPORT ON
QUALITY CIRCLES AT BHEL
A PROJECT REPORT ON
QUALITY CIRCLES AT BHEL
1
CONTENTS
CHAPTER-I PAGE. NO.
INTRODUCTION 01-33NEED FOR THE STUDYSCOPE OF THE STUDYOBJECTIVES OF THE STUDYRESEARCH METHODOLOGYLIMITATIONS OF THE STUDY
CHAPTER-II
REVIEW OF LITERATURE 34-41
CHAPTER-III
COMPANY PROFILE 42-55
CHAPTER-IV
DATA ANALYSIS AND INTERPRETATION 56-71
CHAPTER-V
FINDINGS, CONCLUSIONS, SUGGESTIONS 72-74
2

BIBILIOGRAPHYAPPENDICES
3

CHAPTER-IINTRODUCTION
1.0 INTRODUCTION:
Organization development is an effort (1) Planned (2)
Organization wide and (3) managed from the top, to (4)
Increase Organization effectiveness and health through (5)
Planned Interventions in the organization’s “process” using
behavioral-science knowledge.
4

-Richard Beckhard
“Organizational Development requires a plan approach to
change based on meeting the needs of both the people in the
organization”
-Kilion &Harrrison(1990)
Due to globalization and redefining in the field of
information Technology, the advancement and applicability of
Organizational Development has changed. Luckily, most of the
organizations are adopting various kinds of
organizational changes which are inevitable to survive in
today’s competitive environment. In this regard, Employee
Involvement Interventions is adopted to improve the
responsiveness and progress of the members of the
organization which directly improves organization’s
effectiveness and productivity.
OD is an effort planned organization wide, managed from the
top, through planned intervention, using processes of
behavioral science
1.1 organizational development process:
5

The process, it takes minimum of one year and sometimes
continues indefinitely. There are different approaches to OD
process but the typical process consists of seven steps,
viz., initial diagnosis, data collection, data feedback and
confrontation, action planning and problem solving, team
building, inter group development and evaluation and follow”
up.
If executives recognize that there are inadequacies within
organization which can be corrected by OD activities, it is
necessary to find out the professional and competent people
within the organization to plan and execute OD activities.
If competent people are not available within the
organization the services activities are to be taken. The
consultants adopt various methods including interviews,
questionnaires, direct observation, analysis of documents
and reports for diagnosing the problem.
Survey method is used to collect the data and information
for determining organizational climate and identifying the
behavioral problems.
6

Data collected are analyzed and reviewed by various work
groups formed from this purpose in order to mediate in the
areas of disagreement or confrontation of ideas or opinions
and to establish priorities.
The interventions are the planned activities that are
introduced into the system to accomplish desired changes and
improvements. At this stage the suitable interventions are
to be selected and designed.
1.2 Implementation of intervention:
The selected intervention should be implemented.
Intervention may take the form of workshops, feedback of
data to the participants, group discussions, written
exercises, on-the-job activities, redesign of control system
etc. Interventions are to be implemented steadily as the
process is not a one-short, quick cure for organizational
malady. But it achieves real and lasting change in the
attitudes and behavior of employees.
Groups prepare recommendations and specific action planning
to solve the specific and identified problems by using data
collected.
7
The consultants encourage the employees throughout the
process to form into groups and teams by explaining the
advantages of the teams in the OD process, by arranging
joint meetings with the managers, subordinates etc.
The consultants encourage the inter group meetings,
interaction etc., after the formation of groups/teams.
The organization finally has to evaluate the OD programs,
find out their utility, and develop the programs further for
correcting the deviations and/or improved results. The
consultants help the organization in this respect. All the
steps in the OD processes should be followed by the
organization in order to derive full range of OD benefits.
The following a few of most common OD Interventions, that
most of the companies practice:
1.3 Organizational interventions areI. Survey Feed back
II. Quality Circles
III. Process Consultation
8

IV. Sensitivity training
V. The Managerial grid
VI. Goal setting and Planning
VII. Team building and management by objectives
VIII. Job enrichment, change in organizational
structure and participative management and, ISO, TQM
1.4 QUALITY CIRCLES
DEFINITION:
Quality Circle is a small group of 6 to 8 employees doing
similar work who voluntarily meet together on a regular
basis to identify improvements in their respective work
areas using proven techniques for analyzing and solving work
related problems coming in the way of achieving and
sustaining excellence leading to mutual up liftment of
employees as well as the organization.
It is "a way of capturing the creative and innovative power
that lies within the work force".
1.5 HISTORY OF THE QUALITY CIRCLES:
9

The history of Quality Circles cannot be discussed with- out
discussing the country of its Origin .The success of any
concept or philosophy gains conviction and spreads only when
it was practiced sincerely .The Japanese have not merely
evolved a concept but practiced it with sincerity of purpose
bringing forth amazing results .This has drawn the attention
of the nation the world over and they have found great
potential in involving the people by 1947: General
Douglas McArthur requested US Govt. to send experts to help
Japanese rejuvenate their industries.Dr.Edward Deming was
sent.
1949: An Overseas Technical Research Committee was organized
by the Union of Japanese Scientists Engineers (JUSE)
1949: JUSE organized a seminar on “SQC”
1949: JUSE organized a seminar “Quality Control-Basic
Course”
1950: JUSE published a magazine “SQC”
1950: Dr Deming invited to eight day Quality Control seminar
organized by JUSE.
1951: Deming prize instituted.
10

1954: Dr Joseph Juran invited to Quality Control Management
seminar organized by JUSE.
1956: Japan’s radio started broadcasting a Quality Control
Course organized by JUSE.
1960: Japanese Govt. declared November as Quality Month and
Q-flag was adopted.
Quality Control Circles (Japan)
1962: First QC Circles was registered with Circle Head
Quarters
1962: First annual QC Conference for Foremen was held
1964: Regional chapters of QC were organized in four
different districts
1966: Dr.Juran observed QC Circles activities
1966: Special QC Circle session was organized at the
10th conference of European Organization for Quality Control
held in Stockholm, Sedan
1967: Number of registered QC Circles grew to 10000
1968: JUSE dispatched the first QC Circle Study Team
overseas
1969: Registered Circles grew t 20000
1969: 100th QC Circle Conference was held in Tokyo
11

1970: Registered Circles grew to 30000
1971: JUSE organized the first QC Circle seminar
1971: 200thQC conference was held
1971: Registered QC Circles grew t 40000
1971: First National QC Circle Conference was held in Tokyo
1972: Regional Circles grew to 50,000
1973: 300th QC Circle Conference was held
1974: Registered circles grew to 60,000
1974: 400th QC Circle conference as held
1975: Registered Circes grew to 70,000.500th Conference held
1977: Registered Circles grew to 80,000.700th Conference was
held
1978: Registered Circles grew t 90,000
1978: First international QC Circles Convention was held
1979: 800th QC Circles Conference was held
1979: Registered QC Circles Conference numbered 1000000
1980: 900th Conference was held
1981: International QC Circles Convention was held
1985: Third International QC Circles Convention was held
1988: More than one million Circles with over ten million
members
12

QUALITY CIRCLES (OTHER THAN JAPAN)
1974: Lockheed Company, USA Started Quality Circles movement
1977: International Association of Quality Circles (IACC)
was formed in USA
1980:230 Companies in USA has Quality Circles
1983: There were more than 500,000 known Quality active in
the world
QUALITY CIRCLES (INDIA)
1980: BHEL, Hyderabad first in India to start Quality
Circles
1982: Quality Circle Forum of India (QCFI) was founded
1983: Tata Motors (formerly Telco) started Circles by 1985
they had more than Circles
1985: BHEL had 1411 Circles covering around 13362 members
1.6 QUALITY CIRCLES IN INDIA
In India, Quality Circles movement was introduced in BHEL in
January1981, after preparing the ground in 1980.Its success
in a large public enterprise like BHEL having 73000
employees naturally drew the attention of many organizations
in the country and it triggered off the spread of the
13
movement in the country .BHEL kept its door open in sharing
its experiences and organizing National Seminars in
association with other National Bodies and thus the Q.C
movement started catching up.
FORMAL AND INFORMAL GROUPS
Formal Groups
Family.
Organization.
Departments.
Informal Groups
Employees meet near water cooler and gossip.
Five salesmen from marketing department meet once a
month for lunch to discuss mutual concerns and to seek
relief from tedious aspects of their job.
Four computer programmers form a jogging club that
meets three days per week at lunch time to run two
miles.
All employees of a section meet and discuss how to
improve and beautify office layouts.
14
Seven workers of a production shop floor meet once a
week to solve their technical problems.
Maintenance department staff meets regularly to
maintain machines in a better way.
1.7 WHAT IS QUALITY CIRCLE (QC)?
Quality Circles are (informal) groups of employees who
voluntarily meet together on a regular basis to identify,
define, analyze and solve work related problems.
Usually the members of a particular team (quality circle)
should be from the same work area or who do similar work so
that the problems they select will be familiar to all of
them. In addition, interdepartmental or cross functional
quality circles may also be formed.
An ideal size of quality circle is seven to eight members.
But the number of members in a quality circle can vary.
OTHER NAMES OF QUALITY CIRCLES
Small Groups
Action Circles
Excellence Circles
15
Human Resources Circles
Productivity Circles
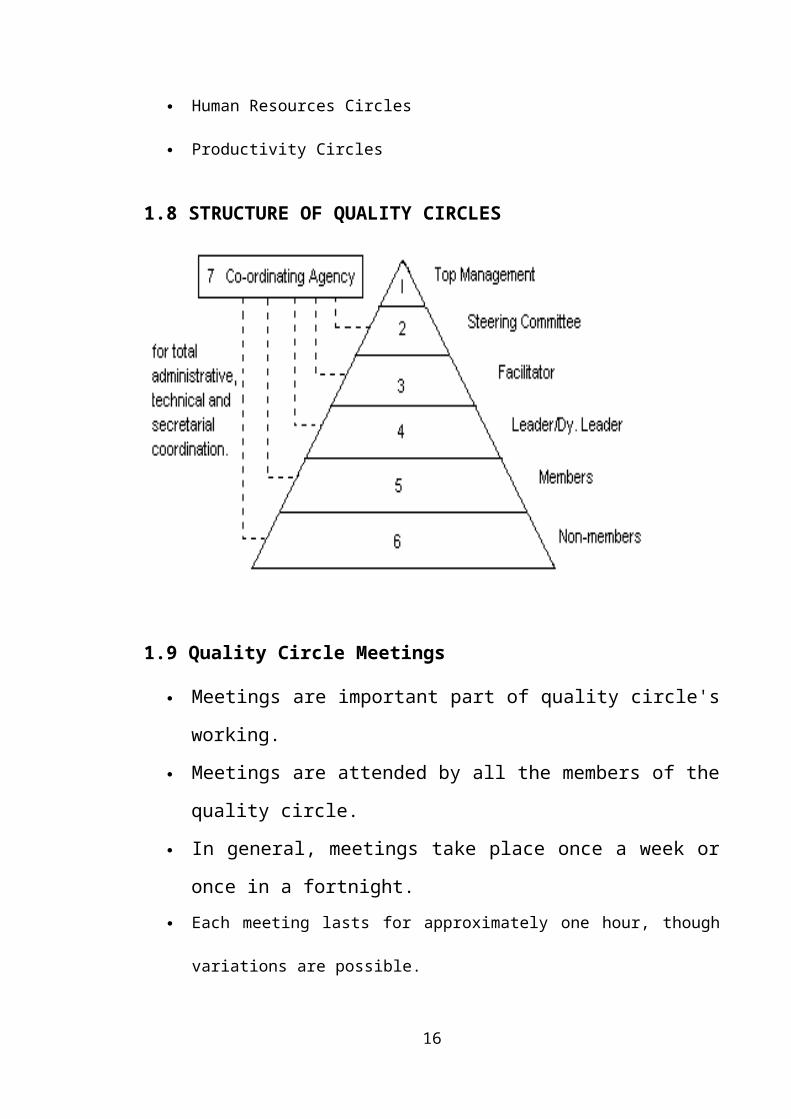
1.8 STRUCTURE OF QUALITY CIRCLES
1.9 Quality Circle Meetings
Meetings are important part of quality circle's
working.
Meetings are attended by all the members of the
quality circle.
In general, meetings take place once a week or
once in a fortnight. Each meeting lasts for approximately one hour, though
variations are possible.
16
Apart from the frequency of the meetings, what is
important is the regularity of the meetings.
1.10 What takes place during quality circle meetings?
Any of the several activities may occur during a meeting
such as:
Identifying a theme or a problem to work on.
Getting training as required to enable members to
analyze problems.
Analyzing problem(s).
Preparing recommendations for implementing solution(s).
Follow up of implementation of suggestions.
Prepare for a presentation to the management.
1.11 Pitfalls and problems
Lack of faith in and support to Quality Circle
activities among management personnel
Lack of interest or incompetence of leaders/facilitator
Apathy, fear and misunderstanding among middle level
executives
Delay or non-implementation of Circle recommendations
17
Irregularity of Quality Circle activities
Lack of or non-participation by some members in the
Circle activities
1.12 QUALITY CIRCLES IN BHELTo facilitate the employees of grass root level to involve
in improvement activities and take-up problems related to
their respective work area, analyze and solve them in a
systematic way to enable self development & mutual
development of Quality circle Team members.
PROBLEM SOLVING TECHNIQUES:
Quality commonly uses certain basics techniques to identify
analyze and resolve problems they are:
1) Brain storming
2) Data collection
3) Stratification
4) Pareto analysis
5) Cause and Effective diagram
18

6) Histogram
7) Scatter diagram
8) Graphs
These techniques through simple, but are very powerful ones
and they help they quality circles investigation the case
for their work related problems and find solutions in
scientific way.
1.BRAIN STROMING:
Stimulating generation of ideas in a group is done through
brain storming, which more effective then is trying to
generate ideas alone brain storming helps to realize the
creative power of the group. It is also helps effective
group participation. Its effectiveness would increase with
the skill of application by the leader.
Brain storming generally usually three stages by quality
circles.
19

1. While listing out the problem,
2. While listing out the probable causes influencing
the effect,
3. While listing out the suggestions /recommendations,
Guidelines for brainstorming:
Each member, by rotating, is asked for ideas (this continues
unit all ideas are exhausted), only one idea is offered by
individual per turn,
Member having no idea, just says ‘Pass’
No idea should be treated as stupid (criticizing or
ridiculing any idea would in habit free flow of ideas
Rigid formality may be avoided good natured humor would
enthuse members to open up freely,
Leader should help in summarizing an idea and guide members
in clarity of expression,
No evaluation of ideas is done during brain storming,
A black-board or a large sheet of paper could be used for
listing out ideas.
Brain storming technique can be fruitfully used to identify
problems effecting the work area; factors which help prevent
20

potential problem causes responsible for problems, solutions
to problems to etc.
2. DATA COLLECTION:
Data is nothing but collection of act in terms of figures,
which gives a clear picture of any work situation allows for
comparison. data collection forms the first step in
statistical analysis of a problem. it would also form a
sound basis for decision making and corrective action. The
analysis and solution would depends on the correctness and
accuracy of data must be related to the problem under review
Types of data
Generally data can be of two types one variable i.e. which
is measurable, eg.length, weight, time, etc, and the other
attribute .i.e. which is countable data, is a example:
smooth running of a machine small etc,(attribute).
Source of data:
There are two sources f data, past data(previous record,
previous feedback) and live data (current observations).
Past data:
21

In many cases the required data will be ready available with
some agency or the recorded through a feedback system. The
data so available is termed as “Past data”. The past data
helps to have a preliminary study and to understand the
causes of the problem.
Live Data:
Where such a recorded data is not available we have to
systematically collect data through observation over a
period of time and this is termed as “Live data”.
Collection of data:
Before the start of the data collection, one should be clear
in his mind about the parameters or characteristics and
their periodicity for which data is to collected. For easier
collection of data, a Pre-designed checklist/format/ check
sheet or any designed format as per the requirement could be
used. This would simplify the process of analysis.
Data collection format:
22

SI. No
Name of the machine
Type of operation
No of components made Any
special ReminderAccepted Rejected
Vertical Boring Bring
Horizontal Lathe Turning
Coil Winding Final Taping
Grinding Final Grinding
Cutting Length Cutting
Analysis of data
After the data is collected, it is analyzed and information
is extracted by applying statistical method. Decision making
or further course of action should be based on analyzed
data.
3. STRATIFICATION:
23
The technique of data segregation based on segregated
element is called stratification data collected should be
properly classified for giving meaningful and correct
inference.
The stratification of data is nothing but segregation of are
groping the data. machine wise, operator wise, shift wise
etc,. for identifying the influencing the factors
Material Base:
data is stratified n the basis of the supplier of the
materials, delivery lot of the materials, preliminary
process etc, by this the effects of the materials have on
the quality of the final product.
Quality Base:
Data is stratified by kind’s f products specification etc.
if phenomenon inherent to a special group of product can
thus be traced.
Work Base:
Stratification on the basis of worker is often very effective.
Time base:
24
Data is stratified by the seasons, day-and-night,
atmospheric conditions such as temperature, humidity and
physiological conditions of the workers differ from time to
time. the influence of these elements on quality is
sometimes founded by time based stratification .
Surrounding conditions:
The quality of product may be influenced by such surrounding
conditions as weather, productions schedules, tightness r
slowness of the market etc.
Processing:
Element such as production equipment, measuring instrument,
manufacturing methods etc. There are more stratification
bases other than the listed above.
4. PARETO ANALYSIS:
Pareto was an Italian economist who discovered a universal
relationship between value and quantity and he used this
technique for assessing uneven distribution of wealth.
Pareto analysis helps in the identification of “the vital
few trivial many” at a glance hen projected, using the
25

column graph named after Pareto diagrams are frequently used
to select the few important problems out of many.
What is Pareto Diagram:
Pareto diagram is a column graph, drawn after datacollection for the purpose of:-
a. Differentiating the major factors (vital) thatcontributes most to the unsatisfactory situation fromother minor ones (trivial).
b. Trackling the major factors responsible for anyproblem.
How to prepare Pareto diagram:
Stratify the problem points according to purpose (by causes,
by phenomena, by equipment) and represent them numerically,
Preferably data should be expressed in monetary values
rather than quantity, counts or percentage,
Select a data period proper for the purpose,
Arrange the stratified items in descending order of value
and bar chart ,in descending order of value and draw a
bar chart,(on a graph paper)
PARETO CHART
26

Simple example of a Pareto chart using hypothetical data
showing the relative frequency of reasons for arriving late
at work.
A Pareto chart is a special type of bar chart where the
values being plotted are arranged in descending order. The
graph is accompanied by a line graph which shows the
cumulative totals of each category, left to right. The chart
is named after Vilfredo Pareto, and its use in quality
assurance was popularized by Joseph M. Juran and Kaoru
Ishikawa.
Typically on the left vertical axis is frequency of
occurrence, but it can alternatively represent cost or other
important unit of measure. The right vertical axis is the
cumulative percentage of the total number of occurrences,
27

total cost, or total of the particular unit of measure. The
purpose is to highlight the most important among a
(typically large) set of factors. In quality control, the
Pareto chart often represents the most common sources of
defects, the highest occurring type of defect, or the most
frequent reasons for customer complaints, etc.
The Pareto chart was developed to illustrate the 80-20 Rule
that 80 percent of the problems stem from 20 percent of the
various causes.
5).CAUSE& EFFECTIVE DIAGRAM
Ishikawa diagram Ishikawa diagram, in fishbone shape, showing factors of men,
machines, milieu (workplace), materials, methods,
measurement, all affecting the overall problem. Smaller
arrows connect the sub-causes to major causes.
The Ishikawa diagram (or fishbone diagram or also cause-and-
effect diagram) are diagrams, that shows the causes of a
certain event. A common use of the Ishikawa diagram is in
product design, to identify potential factors causing an
overall effect.
28
OverviewIshikawa diagrams were proposed by Kaoru Ishikawa in the
1960s, who pioneered quality management processes in the
Kawasaki shipyards, and in the process became one of the
founding fathers of modern management.
It was first used in the 1960s, and is considered one of the
seven basic tools of quality management, along with the
histogram, Pareto chart, check sheet, control chart,
flowchart, and scatter diagram. See Quality Management
Glossary. It is known as a fishbone diagram because of its
shape, similar to the side view of a fish skeleton.
Mazda Motors famously used an Ishikawa diagram in the
development of the Miata sports car, where the required
result was "Jinba Ittai" or "Horse and Rider as One". The
main causes included such aspects as "touch" and "braking"
with the lesser causes including highly granular factors
such as "50/50 weight distribution" and "able to rest elbow
on top of driver's door". Every factor identified in the
diagram was included in the final design.
29

CausesCauses in the diagram are often based on a certain set of
causes, such as the 6 M's, 8 P's or 4 S's, described below.
Cause-and-effect diagrams can reveal key relationships among
various variables, and the possible causes provide
additional insight into process behavior.
Causes in a typical diagram are normally grouped into
categories, the main ones of which are:
The 6 m's Machine, Method, Materials, Maintenance, Man and Mother
Nature (Environment) (recommended for the manufacturing
industry).
Note: a more modern selection of categories used in
manufacturing includes Equipment, Process, People,
Materials, Environment, and Management.
The 8 p's Price, Promotion, People, Processes, Place/Plant, Policies,
Procedures, and Product (or Service) (recommended for the
administration and service industries).
THE 4 S'S Surroundings, Suppliers, Systems, Skills (recommended for
the service industry).
30

Causes should be derived from brainstorming sessions. Then
causes should be sorted through affinity-grouping to collect
similar ideas together. These groups should then be labeled
as categories of the fishbone. They will typically be one of
the traditional categories mentioned above but may be
something unique to your application of this tool. Causes
should be specific, measurable, and controllable. Appearance
A generic Ishikawa diagram showing general (red) and more
refined (blue) causes for an event.
31
Most Ishikawa diagrams have a box at the right hand side,
where the effect to be examined is written. The main body of
the diagram is a horizontal lines from which stem the
general causes, represented as "bones". These are drawn
towards the left-hand side of the paper and are each labeled
with the causes to be investigated often brainstormed
beforehand and based on the major causes listed above.
Off each of the large bones there may be smaller bones
highlighting more specific aspects of a certain cause, and
sometimes there may be a third level of bones or more. These
can be found using the '5 Whys' technique. When the most
probable causes have been identified, they are written in
the box along with the original effect. The more populated
bones generally outline more influential factors, with the
opposite applying to bones with fewer "branches". Further
analysis of the diagram can be achieved with a Pareto chart.
6).HISTOGRAM:
32

In statistics, a histogram is a graphical display of
tabulated frequencies, shown as bars. It shows what
proportion of cases fall into each of several categories.
The categories are usually specified as non-overlapping
intervals of some variable. The categories (bars) must be
adjacent. The intervals (or bands) should ideally be of the
same size.
Histograms are used to plot density. The total area of a
histogram always equals 1. If the length of the intervals on
the x-axis is all 1, then a histogram is identical to a
relative frequency plot.
The word histogram is derived from Greek: histos 'anything
set upright' (as the masts of a ship, the bar of a loom, or
the vertical bars of a histogram); gramma 'drawing, record,
33

and writing’. A generalization of the histogram is kernel
smoothing techniques. This will construct a very smooth
probability density function from the supplied data.
ExamplesAs an example we consider data collected by the U.S. Census
Bureau on time to travel to work (2000 census, [1], Table
2). The census found that there were 124 million people who
work outside of their homes. This rounding is a common
phenomenon when collecting data from people.
In other words a histogram represents a frequency
distribution by means of rectangles whose widths represent
class intervals and whose areas are proportional to the
corresponding frequencies. They only place the bars together
to make it easier to compare data.
Check sheet
34

The check sheet is a simple document that is used for
collecting data in real-time and at the location where the
data is generated. The document is typically a blank form
that is designed for the quick, easy, and efficient
recording of the desired information, which can be either
quantitative or qualitative. When the information is
quantitative, the check sheet is sometimes called a tally
sheet.
A defining characteristic of a check sheet is that data is
recorded by making marks ("checks") on it. A typical check
sheet is divided into regions, and marks made in different
regions have different significance. Data is read by
observing the location and number of marks on the sheet. 5
Basic types of Check Sheets:
Classification: A trait such as a defect or failure mode must be classified
into a category.
35

Location: The physical location of a trait is indicated on a picture
of a part or item being evaluated.
Frequency: The presence or absence of a trait or combination of traits
is indicated. Also number of occurrences of a trait on a
part can be indicated.
Measurement Scale: A measurement scale is divided into intervals, and
measurements are indicated by checking an appropriate
interval.
Check List:
36

The items to be performed for a task are listed so that, as
each is accomplished, it can be indicated as having been
completed.
7).CONTROL CHARTThe control chart, also known as the Stewart chart or
process-behavior chart, in statistical process control is a
tool used to determine whether a manufacturing or business
process is in a state of statistical control or not.
Overview
37

If the chart indicates that the process is currently
under control then it can be used with confidence to predict
the future performance of the process. If the chart
indicates that the process being monitored is not in
control, the pattern it reveals can help determine the
source of variation to be eliminated to bring the process
back into control. A control chart is a specific kind of run
chart that allows significant change to be differentiated
from the natural variability of the process.
This is a key to effective process control and improvement.
On a practical level the control chart can be seen as part
of an objective disciplined approach that facilitates the
decision as to whether process performance warrants
attention or not.
38

Types of Control charts: A Control chart form Varies
According to Kind of data it contains .For variable
data the following charts are used
1. P-chart=Fraction defective,
2. np-chart=No. of defectives,
3. c-chart=No. of defects.
Here the quality circles are coordination by
the quality assurance in BHEL, Hyderabad.
1.13 Quality assurance co-ordination activities:
a) Formation of Quality Circles & Registration
b) Re-organization of circles (based on the need)
39

c) Maintaining data base of circles (Membership data)
d) Providing necessary inputs to circles like arranging
training, Meeting register, QC related books,
formats etc.,
e) Maintaining performance record of Quality Circles(
SIPs : Small Improvement Projects, MMPs :Middle
Management Presentations)
f) Keeping records of active circles (Active circles
shall have Minimum of24 Meetings ,2 Case studies, &
one Middle Management Presentation made in a
calendar year)
g) Conducting Annual Unit Quality Circle Convention
(AUQCC).
h) Nomination for External Conventions (Facilitating
QCs to participating in external Conventions)
i) Republic day, EDs Rolling shield for best performing
Quality circle by Evaluating the case studies and
performance of the previous year.
40
j) Procurement and performance of mementoes to active
Circles.
k) Reporting the performance of Quality circles to
corporate Quality from time to time.
l) Facilitate Quality Circle teams to participate in
International Conventions as per corporate guide
lines.
1.14 Formation of new circles:
Max 5 members Minimum 4 employees (worker category,
supervisor category) working at a particular function /area
can form Quality Circles(QC).The Quality Circles also have
to select an Executive Guide(preferably from their work
centre).
The proposed Team Members shall fill up the registration
form(Format No : QA/QCC-001) available with a QA-Quality
Circles coordination centre. Members shall give consent by
signing on the form. After obtaining the signatures of area
Co-ordinator and facilitator f the concerned work
41

area/product/service group, form to be submitted to Quality
circle coordination (QA).
QA shall Register the Quality Circle and allocate “Quality
circle Number” and issue meeting Register, copies of
“handbook n Quality circles” to the newly formed Quality
Circles All the New Quality circles formed shall be
encouraged with a welcome Memento to each member f the team
(including Executive Guide)
1.15 Re-organization of quality circles:
If the circle strength is reduced due to retirement or
transfer of team members or otherwise, shall fill in the
Form (Format No: QA/QCC-001) with revised Team and indicate
“Re-organization of Quality Circles” with the consent of
members and with the signature of area Co-ordinator and
facilitator of concerned work area/Product/Service Group and
submit to Quality Circle Co-ordination (QA)
Quality Circle Coordination shall update the data base
accordingly.
Maintaining performance record of Quality Circles (Small
problems solved, MMPs (Middle Management Presentation).MMP
42

Format No: QA/QCC-04, Rev-00and SIP Format No: QA/QCC-03,
Rev: 00
Based on the Submitted documents (Filled in signed SIP
booklets &MMP Booklets) QA shall update the data on problems
solved by teams. Solved problems also can registered as
IMPRESS project by respective Quality Circle Team.
Keeping Records of Active Circles (Min.24 Meetings I a year,
2 case studies (SIPs) &ne middle management Presentation in
a calendar year). QA shall prepare the list of active
circles for calendar year based on SIPs and MMPs data
received from Teams.
1.16 Annual unit quality circle convention:
The QA shall organize Annual Unit Quality Circle convention
to provide a platform to present the case studies by Quality
Circles. The case studies shall be evaluated by external
Judges and winning Quality Circles Teams shall be awarded.
The Category for participation are: (a) Manufacturing (b)
Support Services (c) Manufacturing-New Circle (d) Support
Services-New Circle.
43
Qualification for a New Circle is “First time participation
in the Annual Unit Quality Circle convention” and “Should
have formed in the past calendar years”
1.17 Key activities of quality circlescoordination:
Quality Assurance is the coordination agency for promoting,
monitoring the quality circles in the unit.
To encourage the formation of QC Circles by potential
members
To organize 2 day training program for all Newly joined
members and also to organize refresher program to existing
members.
1. All the Ne Members shall be given a 2 day class room
training on simple problem solving Tools, Presentation
techniques.
2. As per training need identified by area co-ordinator,
one day refresher programs shall be organized to
members of Existing Circles.
3. Organizing appreciation programs t area coordinators,
Facilitators.
44
4. Training Shall be planned based on the requirement as
at pint 4 above, and get incorporated in HRDC
Calendar.
5. In addition to HRDC Calendar programs, need based
programs shall be organize with due approvals.
To organize to review of Quality Circles functioning by
verifying meeting registers, collecting Small Improvement
Project (SIPs), facilitating Middle management Presentations
(MMPs) at function/shop level.
To plan to conducting steering committee meetings (twice a
year)t discuss the status of Quality circles movements and
achievements and obtain directions for improvement.
Members of Steering committee: All GMs and DRO of unit.
ED is the chairman and Head/QS will be the convener.
Measurement parameters for Quality circles are:
1).No. of Circles formed
2).No. of dormant circles made active
3).No. of Awards on in external conventions
(Prizes in IUQCC, CCQC, NCQC, ICQCC, APPC, CII etc.,)
4).No. of Training imparted-No of Man days
45

To plan the budget and obtain financial concurrence towards
“Delegation fee” for Quality Circles participation in
External conventions, and for organizing AUQCC for the year.
To plan, get approved for the procurement of mementos for
distribution to eligible quality circles as per norms.
To plan the budget and obtain financial concurrence
towards inter unit Quality Circle Convention f BHEL (On
rotation of Major Units of BHEL,BHEL Hyderabad may have to
host once in 5 years)
1.18 Roles and responsibilities of quality circle
members
Quality Circle: Circle consist of Leader, Dy.Leader,
4members (Total QC Team members=6) from working class
(workers &Supervisors) and an Executives will be an
Executive guide from work area of team
Leader: Quality circle leader organizes and conducts
quality circle meetings /activities as per schedule and
records meeting notes in the meeting register. Leads the
team in all activities.
46
Dy.Leader: In the absence of leader, Dy.Leader will take
over as leader role.
Members: All members including leader, Dy.Leader are equal
in sharing, discussing problems, coming out with solutions
and implementations of solution for the problem with the
consent of concerned work centre in-charge. Through the
Quality Circles are voluntary, they have responsibility of
functioning with in a frame work of rules of company for the
improvement.
Executive Guide: The person chosen to guide the team
possessing-work area job knowledge, Basic SQC skills and PPT
skills. Executive Guide shall support the circle in
implementation of solution, providing technical inputs,
preparation of presentation etc.
Area Coordinator: The person nominated by the respective
product/service GM to act as a link between Quality
Assurance & Quality Circle of the product/Functional area.
The area coordinator will liaisons with work centre in-
charge of concerned circles and provide facility for
conducting weekly meetings.
47

Facilitator: Facilitator shall be nominated by concerned
product/Service GM. He/She coordinates the several quality
circles through the circle leaders. the facilitator shall
provide resources for model making, trail implementation of
solutions fund by Quality circle team. Encouraging the
Quality circles for greater involvement. The vetting of
gains of the projects shall be done by work centre in-charge
&Facilitator.
Steering committee: Steering Committee consists of Unit
head as Chairman, all product& Service GMs& DROs as members
and head of Quality Assurance shall be the convener for
committee meetings.
1.19 Terms of reference for steering
Committee are:
• To set goals and objectives for the Movement of Quality
Circles.
• To formulate/revise the policies for development of the
Quality Circles
• Approve the guide lines for measuring the effectiveness
of Quality Circles
48

• Review the Performance and progress of Quality Circles
periodically
• To provide all support and encouragement to Quality
Circle movement in the organization
• Recommend for monetary benefits for nurturing the
Quality Circles &Encouraging the Best performing
Quality Circles.
QA-Quality Circle coordination shall organize Steering
Committee meeting periodically (once in a Quarter)
1.20 NEED FOR THE STUDY Self development.
Promotes leadership qualities among participants.
Recognition.
Achievement satisfaction.
Promotes group/team working.
49
Promotes continuous improvement in products and
services.
1.21 SCOPE OF THE STUDY Facilitating all the eligible employees of BHEL,
Hyderabad to participate in the Quality Circle movement.
Though, the participation by workers in Quality Circles is
voluntary, the role of QA is to encourage the formation of
Quality Circles and to nurture them to take up improvement
activities /solving the problem in their respective
functions. Providing platform for presenting the Improvement
made.
BHEL Hyderabad initiated the first five quality circles
in the country on 5th January 1981. 3 circles were started in
manufacturing area and two circles in materials management
function of pump shop. this five circles presented their
case studies within three months i.e. on 20th march1981in
the presence of sri.M.R.Naidu,the then executive director
one of the circles made a presentation on “ work place
improvement”
50
BHEL, Hyderabad facilitated starting of Quality circles in
other sister units in 1981
BHEL, Hyderabad played a key roll in organizing first inter
unit Quality circle convention at R&D, in august 1981.
First annual unit Quality circle convention was held in
august 1985.
BHEL, Hyderabad as adjudged as the “Best organization for
promoting Quality circles” for seven consecutive years from
Andhra Pradesh productivity council (1997-2003).
“Best organization for promoting quality circles” from QCFI
from 2003 onwards
BHEL, Hyderabad initiated student quality circles first time
in schools of township.
BHEL, Hyderabad circles participated in international
Quality circles conventions held at Bangkok (2004), Bali
(2006-Silvel medal) Beijing (2007-Gold medal) and Singapore
(2008)
1.22 OBJECTIVES OF THE STUDY
51

1. Create problem solving capability, Improve
communication, Promote leadership qualities & personal
development.
2. Improve morale through closer identity of employee
objectives with organization's objectives, Enhance
quality, and awareness for cleanliness &Reduce errors.
3. Build an attitude of problem prevention, Job
involvement, harmonious relationship between supervisor
and worker.
4. Improve productivity, Reduce downtime of machines and
equipment &Increase employee motivation
RESEARCH METHOLOGY
As the organization identified human resource as their
asset, taking care of them is very important to make them
motivate for the achievement of the goal. How welfare
activities to be structured so that it should be up to the
satisfactory level of the employees is very critical.
Quality Circles are to know the Quality circle activities
and hoe it is practiced, and to know whether the employees
are aware of it and availing the benefits.
52

The main objective of Quality Circles is “self” and mutual
development, cohesive team work and engaged in continuous
improvement activities, thus improving their quality of work
life”.
METHODOLOGY:
The methodology used in this project has been that of
unstructured interview of the guide, which has facilitated
the extractions of information. Although there has been a
structured questionnaire to capture the information.
DATA COLLECTION
Primary dataCollected through responses of employees related to the
topic with the help of the structure questionnaire.
Secondary dataCollected through Broachers’ news magazines, Hand Books,
corporate journals and apex manuals, web sites.
SELECTION OF THE MEASUREMENT TECHNIQUE
1. Fully aware 2.Aware 3.only basics
4.Not aware
5 Frequently 6.Sometimes 7.rarely
8.Never
53

9 Fully agree 10.To some extent 11.satisfied
12. Fully satisfied 13strongly disagree 14.Important
15. Very important
SAMPLINGPopulation – employees of BHEL, Hyderabad
Sample size – 100 employees from all categories.
ANALYTICAL APPROACHThe assumption has been carried out with the help of chi –
square method, presuming hypothesis for each question. Pie
chart representation shows the percentage responses received
from the questionnaire.
ASSUMPTIONSThe study assumes that the information revealed by the
respondents is authentic and not misleading.
1.23 LIMITATIONS OF THE STUDY
The experimenters had no control over the extent to
which managerial support of the QC programs differed in the
work groups and organizations under the study
As the Quality Training was provided by the base of QC
Facilitator, the experimenters had no control over any
54

differences in training emphasis and/or technique to which
the various QC were exposed.
Non-attitudinal measures of QC outcomes (such as number
of problem solutions suggested or implemented) were not
investigated.
55

CHAPTER-IIREVIEW OF LITERATURE
56

2.0 LITERATURE REVIEW
Quality Circles (QC), participative decision making (with
selected consideration of the broader area of decision
making in organization), Job Involvement, communication
climate and job satisfaction,
Literature concerning participating decision making,
decision making, job involvement, communication climate and
job satisfaction is reviewed because this study seeks to
determine whether QC membership results many changes with
respect to these work attitudes (as measured by the AFIT
survey of the work attitude). Each of the above listed
topics is reviewed separately.
Quality circles research:
Few studies have attempted to evaluate the attitudinal or
behavioral outcomes associated with participation in a QC
program. Also, there is a severe shortage of research
57
involving quantitative assessments of factors which are
considered necessary for success. It is with a discussion of
the suggested “basic elements” necessary for a successful QC
program that this review of the literature will begin.
The most notable listing of significant factors related to
QC success arises from the results of a survey administered
to 50 QC experts attending the third annual conference of
the International Association of Quality Circles
(Stevens&Moore, 1981).Ranked according to frequency of
mention, these factors are:
1. Management acceptance/support/understanding
2. Training for the circle leader(s) and facilitator(s)
3. Voluntary participation
4. A. “people-building” managerial philosophy
5. Allowance of sufficient time for assessment of results
and return on investment
6. Open channels of communication with upper management
7. A “team effort” approach to problem solving
8. Team member and management participation
9. Recognition
58

10. Confining circle activities to work-related
problems
Stevens and Moore believe that the presence of each of the
above 10 factors is crucial for the survival of a QC
program.
Metz (1980) and Cole ((1980) have warned that failure
to include and /or educate middle management personnel when
QC programs are initiated can lead to oppositional when QC
programs are initiated can lead to oppositional and
obstructional attitudes and behaviors on the part of
supervisors. these attitudes and behaviors stem from the
belief the circle activities are an infringement on their
( the supervisors’) own job responsibilities and/or QC
suggestions are a reflection of their own inadequate job
performance (and hence represent a threat to their job
security) Burck (1981) points to the importance of a
trusting relationship between management and employees as a
necessary ingredient for QC success. Cole (1980b) further
emphasizes the importance of financial incentives and
recognition as additional motivators for QC members.
59
These impressions of QC experts concerning the
necessary ingredients for QC success all assume that QC
programs indeed result in improvements related to the
increased organizational effectiveness. However, given the
lack of research on the subject even this most basic of
assumptions cannot be made. Despite the assertion by Rieker
and Sullivan (1981) that assessing QC effectiveness may
cannot be possible or cost effective in the near term
because of the difficulty in isolating the effects of one
relatively small component of an integrated organizational
structure, research must be conducted in to the area if the
QC concept is to be anything more than merely a passing fad
(Ouchi, 1981)
Only four studies QC outcomes presently appear in the
literature. The first, an uncontrolled field experiment
conducted by general dynamic Pomona Division (Hunt, 1981)
reports the results of a six month pilot program, the
purpose of which was to provide information for management
as an aid for the evaluation of the long range potential of
QC’s within the firm. Several morale, motivation and
60
performance criteria were monitored with “before” and
“after” comparisons made for Quality Circle members and
other employees. No mention was made of controls for
possible differences between members of the QC group and the
“other employees” comparison group; nor were there
indications of controls made for changing group composition.
Though the author noted that Quality circle members
demonstrated superior performance on measures of product
Quality, error reduction job involvement and problem-solving
capabilities when contrasted with other employees, these
conclusions must be viewed with caution due to the
limitations of the experimental design. Results of this
study therefore should not be generalized to other
organizations. The value of the experiment is that it
demonstrates an interest by management in empirically
evaluating QC success before organization-wide adoption of
the QC concept.
In noting the need for QC program evolution, Donovan and Van
Horn (1980) have provided the following suggestions:
61

1. Measuring of “multiple levels which includes
objective measures of productivity and quality (such as
hours/unit and defects/.unit) and assessment which provide
an overview of program coats.
2. Effective research tools including surveys and
questionnaires which provide information concerning job and
climate variables related to high productivity and
satisfaction.
3. Adequate research. Designs providing pre-and post
circle implementation comparisons and, where possible,
control group of baseline information.
The authors conducted five independent studies of QC
effectiveness at Honeywell, Inc. upon which they concluded
that the intervention was responsible for dramatic
performance and efficiency improvements. However, due to
significant flaws in study design, it is impossible to
assess the true impact of the circles. No controls for the
changing memberships of the QC and control groups were
incorporated into the study. Further, the authors made no
specific mention of the composition of the various circle
and control groups if circles membership was voluntary; it
62

was likely that the circle member exhibited differences of
personality and motivation which distinguished them from
those who chose not to participate. If the composition of
the QC group was not a representative sample of employees
performing similar work at Honeywell, Inc., then no
generalization of the study result can be made which will
apply to others organizational employee groups. On the other
hand, if existing work groups were designated as QC groups
and controls , group equivalence is not assured through
randomization through pretests were administrated to both QC
and control groups; no mantion was made as to whether
pretest observations were used to develop correction factors
to be used to compensate for pre-existing group differences.
Tortorich at all (1981) developed a method of QC evaluation
at Martin Marietta Corporation Michoud Assembly division
which avoid some of the pitfalls discussed above .the
following three categories of effectiveness measures were
developed for internal use by managers, program
administrators’, facilitators and the circles themselves.
1. Program measures are obtained which are direct measures of
QC growth and efficiency and include assessments of the
63
number of supervisors and management personnel completing
circle leadership training, the number of employees
completing circle training, the number of circles formed,
the average circle membership size, success rate, the ratio
of trained employees volunteering for circle activity, the
number and rate of presentations made by circles to
management, the percentage of approved proposals , and the
direct cost savings. Resulting from circles activities.
2. Personnel outcomes are asses; these are defined as the
effect of QCs on employees’ attitudes concerning their job
situation as measured by various attitude questionnaires.
3. Organizational outcomes are also evaluated Organizational
outcomes are the effects of QCs on such cost related
criteria as performance rates, defect rates, scrap rates,
attrition rates, lost time, grievance rates and accident
rates.
Depending on need, assessment information is calculated
monthly or at six-month intervals. The former approach is
use to identified and quickly respond to problems or to
provide managers with summery information about circle
related variables. Six month data interval is use to
64

contrast the personal and organizational outcomes of QC
Groups members with those of non-circle employees. The
effectiveness of the QC programs is also analyzed in terms
of individual changes on measure of personal and
organizational outcomes which are attributed to the effects
of circle membership or non membership. To performed this
analysis, performance data for each circle member is
analyzed in six-month intervals using the data of entry into
the circle as the point of reference. Hence, data collected
six-months prior to entry in to a QC group is compared with
data collected six months following initial circle
membership. A similar analysis is conducted on performance.
Information collected on employees not joining circles
within the same time frame under study for circle members.
Therefore, for both circle and non circles employees, data
are collected for staggered, but identical, time intervals
thud controlling for the fact that circle members join and
resign QC group at difference times during the life of the
program. Circles effectiveness can then be analyzed by
calculating the difference with in circles members’ six-
months before and six-months after entry in to the QC
65

program while concurrently performing a similar analysis of
non circle members over the identical six months intervals.
Group and individual comparisons can then be made.
Summary data is presented in Tortorich et al paper through
rigorous statistical analysis is not included, between 90 to
100% of the suggestions offered to management by the QC
groups in the areas of Quality improvement, cost reduction,
tooling and training were approved over the January, 1980 to
june,1981 time period.
Employee attitudes, as measured by a survey, were assessed
When the work attitudes of those who had participated in QC
activity for at least six-months were concurrently compared
with the work attitudes of untrained QC members,the formed
were found by Tortorich et al. to demonstrate a number of
more positive work attitudes. For the year 1980, significant
differences (P=.05) were found between the comparisons
groups for the following job related attitudes: employee
supervisor relations, satisfaction which supervisor,
employee influence, internal motivation, job satisfaction,
66
team climate, growth satisfaction and job performance. In
short, the results suggested that QC groups can provide
potentially help full inputs to the managerial decision
making process as well as promote improved employee work
attitudes.
The most rigorous evaluation of QC outcomes in the
literature is reported by Steel, Lloyd, Ovalle and Hendrix
(1982) and Steel, Ovalle and Lloyd (1982). The
organizational assessment package (OAP), a survey
questionnaire consisting of 109 items (rating scales) and 24
factors, was administered to all members of a base civil
engineering division at a Department of Defense installation
shortly before a QC program was initiated in December, 1980.
Employees of 14 departments were trained in QC techniques
and then offered the opportunity to participate in one of
several QC groups. Members of an additional 37 Departments
from the same division were provided no direct exposure to
67

the Qc program and served as the control group for this
study. There were no controls for changing group membership
this is a serious methodological limitation but one which
difficult to incorporate in field study research.
Considerable fluctuations in the demographic measures during
the six-to-nine month’s interval between administrations of
the preset measures suggest changes in the composition of
treatment groups during the course of this experiment the
absence of controls for changing group membership such as
those employed by Tortorich et al.(1981) are likely to limit
the interpretability of findings for any study where QC and
control groups are characterized by high mortality of
subjects.
Utilization of intact work group as experimental (QC) and
control subjects necessitated the use of the non equivalent
control group design (Campbell & Stanley, 1963). This quasi-
experimental design is characterized by taking preset of
both experimental and control groups before the intervention
is initiated A statistical correction adjusting for pretest
differences was then made group differences on the posttest
were evaluated in order to compensate for pre-existing group
68

differences. The data were analyzed employing stepwise
hierarchical regression analysis with the result that no
significant increases in R2 were observed for the 23 OAP
attitudinal measures. This suggests that QC participation
did not significance impact employee work attitude through
the authors’ state that the following methodological
limitations severely impacted study results:
1. Because QC groups were formed at staggered intervals,
some did not have enough time to reach maturity prior to
post test data collection. Three of the six QC groups
functioned for less than one month when post test data
was collected.
2. Experimental mortality (discussed above)
3. Several significant demographic differences existed
between the treatment and control groups at the study’s
outset.
4. Behavioral and group effectiveness outcomes of QC
participation were not measured.
5. The sample size was small: the treatment condition
contained only 14 functional work units, enhancing the
likelihood of Type II errors.
69

The interpretability and generalized of findings are
restricted by these limitations, yet this study is important
from a historical perspective. It is the first research
reported by these limitations, yet this study is important
from a historical perspective. It is the first research
reported in the QC literature that assesses attitudinal
outcomes of QC activity while employing an experimental
design that incorporates control group comparisons and
statistical control for non Equivalent of matched groups.
Whereas research regarding the outcomes associated with the
QC approach to employee participation in decision making is
quite in both its scope and methodology, much work has been
coming the more general area of participative decision
making. It is to the body of Literature addressing this
topic that we now turn.
70

CHAPTER-IIICOMPANY PROFILE
71
COMPANY PROFILE
BHEL (Bharat Heavy Electricals Limited) is the largest
engineering and manufacturing enterprise in India in the
energy-related/infrastructure sector.
2.1 Manufacturing
• Establishments in the Manufacturing sector are often
described as plants, factories, or mills and
characteristically use power-driven machines and
materials-handling equipment.
• Manufacturing establishments may process materials or may
contract with other establishments to process their
materials for them. Both types of establishments are
included in manufacturing.
• BHEL was founded in 1950s.Its operations are organized
around three business sectors:
• Power.
• Industry-including Transmission, Transportation, and
Telecommunication & Renewable Energy.
• Overseas Business.
72

2.2 Industry
• BHEL has also emerged as a major supplier of controls and
instrumentation systems especially distributed digital
control systems for industries, and simulators for various
applications.
• BHEL is supplying X'mas tree valves and well heads up to a
rating of 10,000 psi to ONGC and Oil India. It can also
supply on-shore drilling rigs, sub-sea well heads, super
deep drilling rigs, desert rigs and heli-rigs.
2.3 Transmission• BHEL supplies a wide range of transmission products and
systems of up to 400 kV class. Those include: high-voltage
power and distribution transformers, instrument
transformers, dry-type transformers, SF6 switchgear,
capacitors and ceramic insulators.
• Equipment for high-voltage direct current (HVDC) systems
are also supplied, for economic transmission of bulk power
over long distances. Series and shunt compensation systems
are also manufactured to minimize transmission losses.
73

• BHEL has developed and commercialized the country’s first
indigenous 36 kV Gas Insulated Substation and has also
developed 145 kV Gas Insulated Substation (GIS) which has
undergone successful testing at CESI, Italy.
• BHEL has also established its capability in the area of
Flexible AC Transmission systems (FACTS).
2.4 Transportation
• Most of the trains of the Indian Railways are equipped
with BHELs traction and traction control equipment.
• India's first underground metro at Calcutta runs on
drives and controls supplied by BHEL.
• The Company has developed and supplied broad gauge 3900 HP
AC locomotives, 5000/4600 HP AC/DC locomotives, diesel
shunting locomotives of up to 2600 HP, battery powered
road vehicles, including electrics & control electronics.
• BHEL has acquired the technology for 6000 HP 3-phase AC
Locos and started manufacturing the electrics & controls
as well as those for 3-phase AC EMUs, Diesel EMUs and OHE
cars.
74

2.5 Telecommunication• BHEL manufactures telecom switching equipment based on C-
DOT technology, the major products being MAX-XL of up to
40,000 lines capacity and Single Base Module RAX for rural
applications.
2.6 Renewable Energy• Technologies have been developed and commercialized for
exploiting non-conventional and renewable sources of
energy.
• These include photovoltaic cells and modules, solar
lanterns, grid-interactive PV Power Plants and solar
heating systems.
• BHEL has emerged as a major manufacturer of wind electric
generators of up to 250 kW unit size. The Company has set
up its own wind farms of 3000 kW capacity (12x250 kW) at
Ramgiri (A.P.) and another of 4000 kW capacity (16x250 kW)
at Kadavakkallu (A.P.).
• Today, BHEL has a wide-spread network comprising 14
manufacturing divisions, 8 service centers, 4 power sector
regional centers, 18 regional offices, and a large number
of project sites spread all over India and abroad.
75
• This enables BHEL to have a strong customer orientation,
to be sensitive to his needs and respond quickly to the
changes in the market.
• It manufactures over 180 products under 30 major product
groups and caters to sectors including power generation
and transmission, transportation, and renewable energy,
among others.
2.7 Profits and losses of BHEL
• The company recorded revenues of INR331, 544.8 million
($6,962.4 million) during the financial year ended March
2010 (FY2010), an increase of 25.2% over FY2009.
• The operating profit of the company was INR55, 957.7
million ($1,175.1 million) during FY2010, a decrease of
8.3% compared to FY2009.
• The net profit was INR43, 269.2 million ($908.7 million)
in FY2010, an increase of 38.9% over FY2009.
76

• Bharat Heavy Electricals Limited (BHEL) - SWOT Analysis
examines the company's key business structure and
operations, history and products, and provides summary
analysis of its key revenue lines and strategy.
2.8 Strengths
• The company has 180 products under 30 major product groups
that cater to the needs of the core sector like power,
industry, transmission, transportation, defense,
telecommunications and oil business.
• BHEL's ability to acquire modern technology and make it
suitable to Indian conditions has been an exceptional
strength of the company.
• Strong relationship with NTPC is strength as NTPC is
planning a capacity expansion of Rs. 52 bn and based on
the past, 85% of NTPC projects have been bagged by BHEL.
The company also enjoys purchase price preference.
• Huge investment in R&D.
• Merger & Acquisition – The Company has taken over the
Management & Control of Bharat Pumps & Compressors Ltd and
77

completely taken over M/s- Bharat Heavy Plate & Vessels
Ltd.
2.9 Opportunities
• The power sector reforms are expected to pick up in the
near future in India, which would directly benefit BHEL.
• Increase in defense budget will increase the top line for
the company.
• NTPC is planning additional capacities to the tune of
2,800 MW, at a cost of Rs 52 bn.
• BHEL could benefit a lot as it has happened in the past
that significant portion of the project of NTPC is handled
by BHEL. Nearly 85% of the NTPC projects were assigned to
BHEL only.
• Huge order for setting up of nuclear power plant
2.10 Competitors of BHEL
L&T
SUZLON
BEML
78
BGR ENERGY
AIA ENGINEERING
ALFA LAVAL
PRAJ INDUSTRIES
SANGHVL MOTORS
WALCHAND NAGAR
VISION
A World-class Engineering Enterprise Committed to enhancing
Stakeholder Value.
MISSIONTo be an Indian Multinational Engineering Enterprise
providing Total Business Solutions through Quality Products,
Systems and Services in the fields of Energy, Industry,
Transportation, Infrastructure and other potential areas
BHEL has been a pioneer in the area of Human Resource
Development, being the first Public Sector Undertaking of
its kind, in India, to have setup an extensive HRD
79

infrastructure as way back as the early sixties. Human
Resource Development Centre (HRDC) of BHEL R.C.Puram,
Hyderabad occupies a significant place not only among other
HRDCs of BHEL but also as an important Training and
Development Centre in the twin cities of Hyderabad [Andhra
Pradesh].
VALUES Zeal to Excel and Zest for Change
Integrity and Fairness in all Matters
Respect for Dignity and Potential of Individuals
Strict Adherence to Commitments
Ensure Speed of Response
Foster learning, Creativity and Team-Work
Loyalty and Pride in the Company
OVERVIEW OF BHEL
80
Established in the mid fifties, Bharat Heavy
Electricals Limited-BHEL, has today emerged as the largest
engineering and manufacturing enterprise of its kind in
India and ranks amongst the top ten power generation
equipment manufacturers in the world. BHEL has diversified
its product base over the years and today caters to the
needs of almost all the key sectors of the economy. In
addition to the power generation equipment, BHEL products
cater to a wide spectrum of customers encompassing various
fields of operation, like Fertilizers & Petrochemicals,
Refineries, Oil Exploration and production, steel and
metals, cement, sugar and paper plants, transportation and
non-conventional energy sources etc.
With a massive network of 14 manufacturing Units
located at various important centers all over India, BHEL
manufactures almost all critical high technology products
required for power sector like Gas Turbines, Steam Turbines,
Turbo generators, Boilers, Pumps and Heat exchangers,
Pulverizes and electrical switch gears.
81
With strategic alliances and technological
collaborations with world leaders for its products, BHEL's
technological strength is today on par with the best in the
world.
The BHEL, which set up it’s first in Bhopal was
established in the year 1956. It is the first and largest
industrial undertaking in the country manufacturing power
equipment. It has now 4 Regional Centers, 8 Service
Centers and 18 Regional Offices. The corporate head-
quarters is located in New Delhi. In the early sixties
three major plants were set up at Haridwar, Hyderabad and
Tiruchirapalli. It’s products cover a wide range like
power, transmission, industry, transportation, oil and gas,
telecommunication etc., besides non-conventional energy
systems. The other areas covered by the BHEL includes
defense and civil aviation. It’s services extend from
Project Feasibility Studies to after sales service including
undertaking turn-key projects. It’s credibility and standing
in the industrial scene of the country is evident from the
report of the World Bank as the Indian Public Sector wherein
it is described as “ One of the most efficient enterprises
82

in the industrial sector, at par with international
standards of efficiency. BHEL has acquired the ISO-9000
Certification for most of its operations”.
According to the organization’s vision 2002, it aims to
become a world class, innovative, competitive and profitable
engineering enterprise providing total business solutions.
It’s declared mission is to acquired the status of leading
engineering enterprise providing quality products, systems
and services in the field of energy, transportation,
industry, infra-structure and other areas covered by the
electricity industry.
The value system of the organization envisages meeting
commitments to customers, both internal and external, faster
learning experiences and creativity among the work force,
maintain the dignity of the individuals working in the
organization as well as customers and outsiders, promote
loyalty and a sense of pride among the workers, encourage
team spirit, create a zeal to excel and follow a policy of
fairness among all those with whom it deals.
The leadership styles in the organization are oriented
towards fostering and sustaining organizational values,
83

empowering everyone with responsibility but ensuring
accountability at all levels. The leadership styles include
a vision, courage, credibility, versatility with due
importance given to recognition of merit, acting on feedback
from the lower levels and counseling those who need it,
adopt a system of information sharing and consultation. In
short, it would like to project itself as a role model for
others.
The organizational objectives of BHEL has been carefully and
judiciously formulated to ensure study growth in the current
global environment of competition, secure a reasonable and
adequate return on the capital invested, ensure a high
degree customer satisfaction, to motivate it’s employees for
performance of improvement and aim as a career growth within
the organization to achieve technological up gradation and
to fulfill the expectations of it’s share holders, customers
and the BHEL manufactures wide range of transmission
equipment such as transformers, reactors, switches, control
relay panel, insulators, capacitors, instrument transformer
sets etc. It has developed capability to provide a wide
84

variety of electrical, electronic and mechanical equipment
for industrial requirements particularly fertilizers,
petrochemicals, coal mining etc. It’s role in the
transportation sector as today over 60% of the Indian
Railways is equipped with the traction equipment
manufactured by the BHEL. It’s investment in the
development of oil and gas industry in the country, both on
shore and off shore is considerable. Its entry into the
telecommunication industry has given India an Electronic
Private Automatic Branch Exchange (EPABX) system, the Rural
Automatic Exchange (RAX) based on indigenous technology from
C-Dot. The latest digital switching used in these exchanges
and their network capability opens up endless possibilities.
BHEL’s engineering and R&D efforts are focused on
improving the quality of it’s products, upgrading the
existing technologies, accelerating the process of
indigenization and diversifying its products.
It is a matter of pride to the country that BHEL’s
products and services are used in over 50 countries all over
the world. It caters to export orders ranging from
individual specified products to complete power stations.
85

BHEL’s future plans include up gradation of its product
engineering manufacturing technology through induction of
the state of the art technologies and absorption of knowhow
and know why its collaborators form.
BHEL’s strength lies in its dedicated work force, of about
63,000 employees who undergo entry and on the job training
to promote appropriate work culture through participatory
management techniques to meet the challenges of the current
millennium.
BHEL - Hyderabad (Ramachandrapuram) Unit:
BHEL’s Ramachandrapuram Unit located in the out skirts of
Hyderabad city was established in the early sixties to
“bring power to the people”. The products of the unit
include TG sets up to 200 mw, industrial TG sets, gas
turbines, turbo-compressor systems, heat exchangers, switch
gears etc. Around 7000 employees work in the Hyderabad unit
of whom about 1500 are executives, 1200 supervisors and 4300
others.
As a member of the prestigious 'BHEL family', BHEL-Hyderabad
has earned a reputation as one of its most important
86
manufacturing units, contributing its lion's share in BHEL
Corporation's overall business operations.
The Hyderabad unit was set up in 1963 and started its
operations with manufacture of Turbo-generator sets and
auxiliaries for 60 and 110 MW thermal utility sets. Over the
years it has increased its capacity range and diversified
its operations to many other areas. Today, a wide range of
products are manufactured in this unit, catering to the
needs of variety of industries like Fertilizers & Chemicals,
Petrochemicals & Refineries, Paper, sugar, steel, etc.
BHEL-Hyderabad unit has collaborations with world
renowned MNCs like M/S General Electric, USA, M/S Siemens,
Germany, M/S Nuovo Pignone, etc BHEL is the largest
engineering and manufacturing enterprise in India in the
energy-related/infrastructure sector, today. BHEL was
established more than 40 years ago, ushering in the
indigenous Heavy Electrical Equipment industry in India - a
dream that has been more than realized with a well-
recognized track record of performance. The company has been
earning profits continuously since 1971-72 and paying
dividends since 1976-77.
87

BHEL manufactures over 180 products under 30 major
product groups and caters to core sectors of the Indian
Economy viz., Power Generation & Transmission, Industry,
Transportation, Telecommunication, Renewable Energy, etc.
The wide network of BHEL's 14 manufacturing divisions, four
Power Sector regional centre’s, over 100 project sites,
eight service centers and 18 regional offices, enables the
Company to promptly serve its customers and provide them
with suitable products, systems and services -- efficiently
and at competitive prices. The high level of quality &
reliability of its products is due to the emphasis on
design, engineering and manufacturing to international
standards by acquiring and adapting some of the best
technologies from leading companies in the world, together
with technologies developed in its own R&D centers
Product Profile:
• Gas turbines • Heat Exchangers • Steam
turbines
• Pumps • Pulverizes • Turbo
generators
88
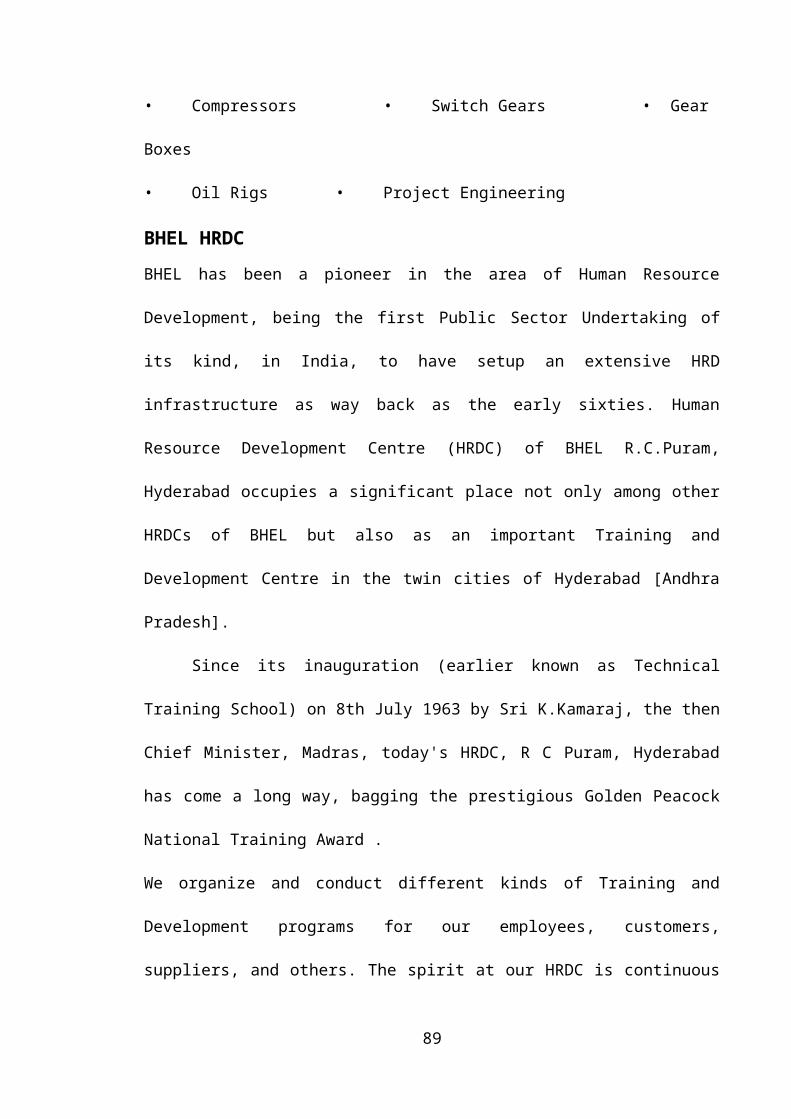
• Compressors • Switch Gears • Gear
Boxes
• Oil Rigs • Project Engineering
BHEL HRDCBHEL has been a pioneer in the area of Human Resource
Development, being the first Public Sector Undertaking of
its kind, in India, to have setup an extensive HRD
infrastructure as way back as the early sixties. Human
Resource Development Centre (HRDC) of BHEL R.C.Puram,
Hyderabad occupies a significant place not only among other
HRDCs of BHEL but also as an important Training and
Development Centre in the twin cities of Hyderabad [Andhra
Pradesh].
Since its inauguration (earlier known as Technical
Training School) on 8th July 1963 by Sri K.Kamaraj, the then
Chief Minister, Madras, today's HRDC, R C Puram, Hyderabad
has come a long way, bagging the prestigious Golden Peacock
National Training Award .
We organize and conduct different kinds of Training and
Development programs for our employees, customers,
suppliers, and others. The spirit at our HRDC is continuous
89

learning and "the learning" which move towards focussed
Individual and Organizational Growth.
BHEL’s Human Resource Development Institute endeavors to –
BHEL has a Human Resource Development Center the provision
of knowledge, skills and appropriate attitudes among it’s
work force. They are trained through General Management,
Behavioural, Safety, Computer, Customer and other general
programmes. Besides, the center provides opportunities for
training students from the universities and colleges to do
their project work in fulfillment of their academic
requirement.
(i) Help formulate Human Resource Development Policies
to meet the present and future needs of the
organization as well as promote an organizational
culture emphasizing team work.
(ii) Integrate and co-ordinate Human Resource
Development activities of various units to provide
necessary corporate guidelines required from time
to time.
90

(iii) Help the executives to improve their managerial
effectiveness to take up new responsibility and
face the current and future challenges.
(iv) Strengthen organization’s value system.
(v) Collaborate with academic institutions and
professional bodies of repute both in and out side
India for knowledge sharing.
It’s track record can boast of continuous profits from 1971
and paying dividends from 1976.
BHEL has installed equipment for over 62000 mw of power
generation for utilities, captive and industrial users.
Supplied 2,00,000 MVA Transformer capacity and sustained
equipment operating in transmission and distribution network
up to 400 kv – AC and DC. Supplied over 25,000 motors with
drive control system to power projects, petrochemicals,
refineries, steel, aluminum, fertilizers, cement plants,
etc. Supplied traction electrics and AC/DC locos to power
over 17000 km railway networks. Supplied over one million
valves to power plants and other industries.
The capital employed rose from Rs.23,707 millions in 1995-
96 to Rs.35,985 millions in 1999-2000. The value of sales
91

increased from Rs.48,335 millions to Rs.66,340 millions
during the same period. Thus, while the capital employed
rose by about 52% the sales rose by only 31%. The Company’s
profit was Rs.5, 994 millions after tax in 1999-2000 while
it was only Rs.3, 502 millions in 1995-96 thus registering
an increase of over 70% (71%). In 2000-01 the company’s
after tax was Rs. 3,126 millions. It will be seen that the
profits of the company declined 2000-01 compared what it
earned in 1995-96 and 1999-2000.
These in brief study of BHEL an electrical industry of
international repute and a bright jewel among the public
sector undertakings in the country.
BHEL - OVERSEAS BUSINESS
BHEL, Ranking among the major power plant equipment
suppliers in the world, is one of the largest exporters of
engineering products and services from India. Over the
years, BHEL has established its reference in around 60
countries of the world, ranging from the united state in the
92

west to new Zealand In the far east. BHEL’s exports range
cover individual product to complete power stations, turnkey
contracts for power plants, EPC contracts, HV/EHV
substations, O&M services for familiar technologies,
specialized after- market service like residual life
assessment (RLA) studies and retrofitting, refurbishing and
overhauling, and supplies to manufacturers and EPC
contractors.
BHEL has assimilated and updated / adopted the state-of-the-
art technologies in the power and industrial equipment
sectors acquired from world leaders. BHEL has successfully
undertaken turnkey projects on its own and possesses the
requisite flexibility to interface and compliment
international companies for large projects, and has
exhibited adaptability by manufacturing and supplying
intermediate products to the design of other manufacturer
and original equipment manufacturers (OEMs)
The success in the area of rehabilitation and life
extension of power projects has established BHEL as a
reliable alternative to the OEMs for such power plants.
93

CHAPTER-IVDATA ANALYSIS AND INTERPRETATION
94

Q.1 Since how many years have you been working with this organization?
S. No OpinionNo. of
respondents
Percentage
1 0-5 Years 28 28
2 5-10 Years 47 47
3 10-15Years 14 14
4 More than15 Years 11 11
Total 100 100
95

INFERENCE:1. 0-5 Years (28%)
2. 5-10 Years (47%)
3. 10-15 Years (14%)
4. More than 15 Years (11%)
Q.2 Are you aware of Quality Circles?
S. No OpinionNo. of
respondents
Percentage
1 Fully Aware 44 44
2 Partiallyaware 31 31
3 only basics 21 21
4 Not aware 4 4
96
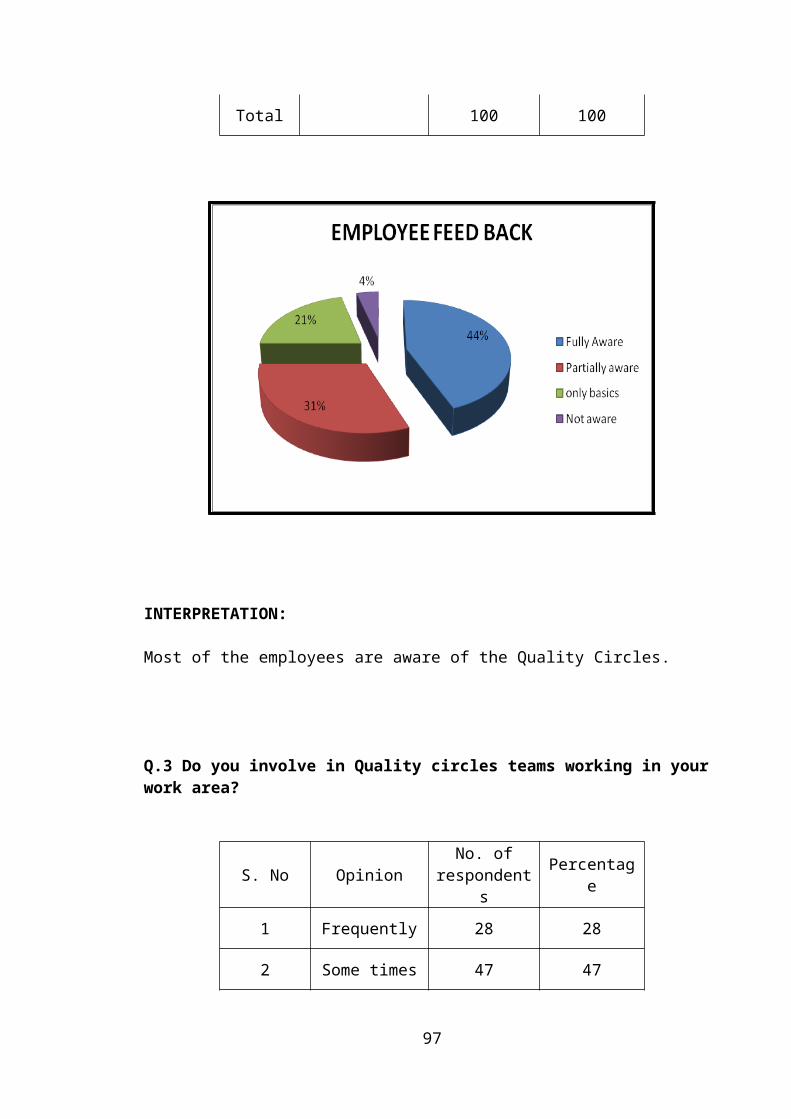
Total 100 100
INTERPRETATION:
Most of the employees are aware of the Quality Circles.
Q.3 Do you involve in Quality circles teams working in your work area?
S. No OpinionNo. of
respondents
Percentage
1 Frequently 28 28
2 Some times 47 47
97
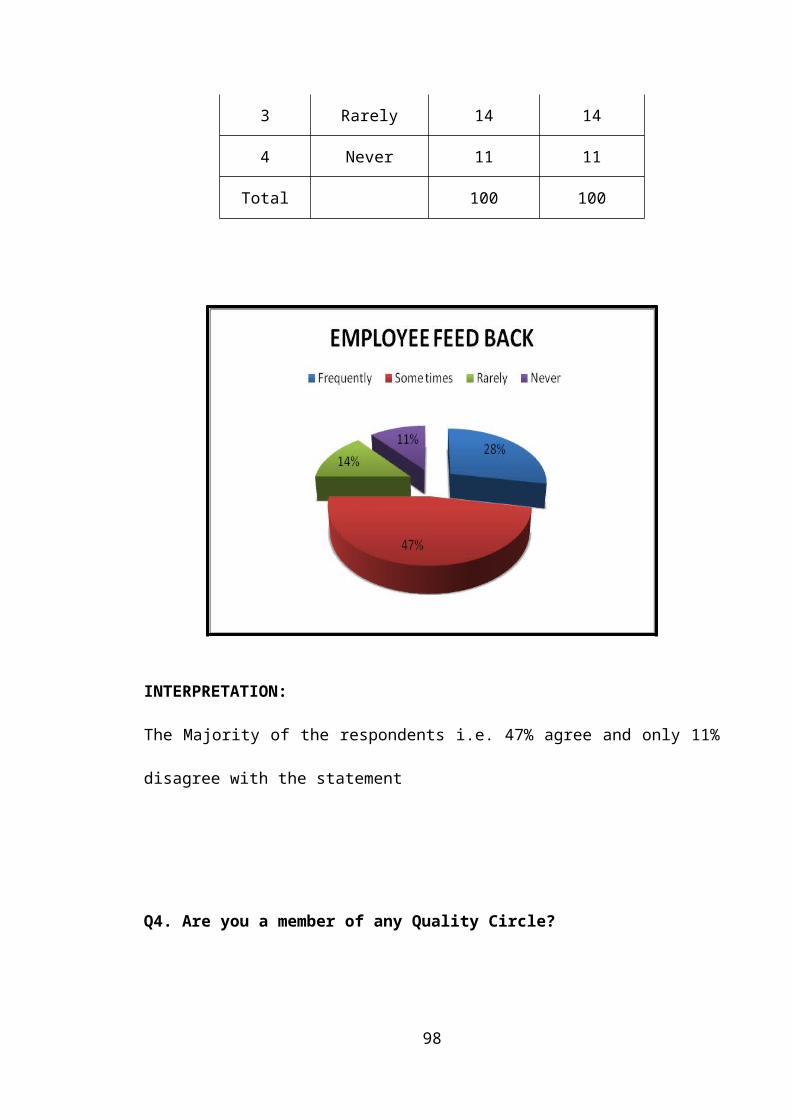
3 Rarely 14 14
4 Never 11 11
Total 100 100
INTERPRETATION:
The Majority of the respondents i.e. 47% agree and only 11%
disagree with the statement
Q4. Are you a member of any Quality Circle?
98
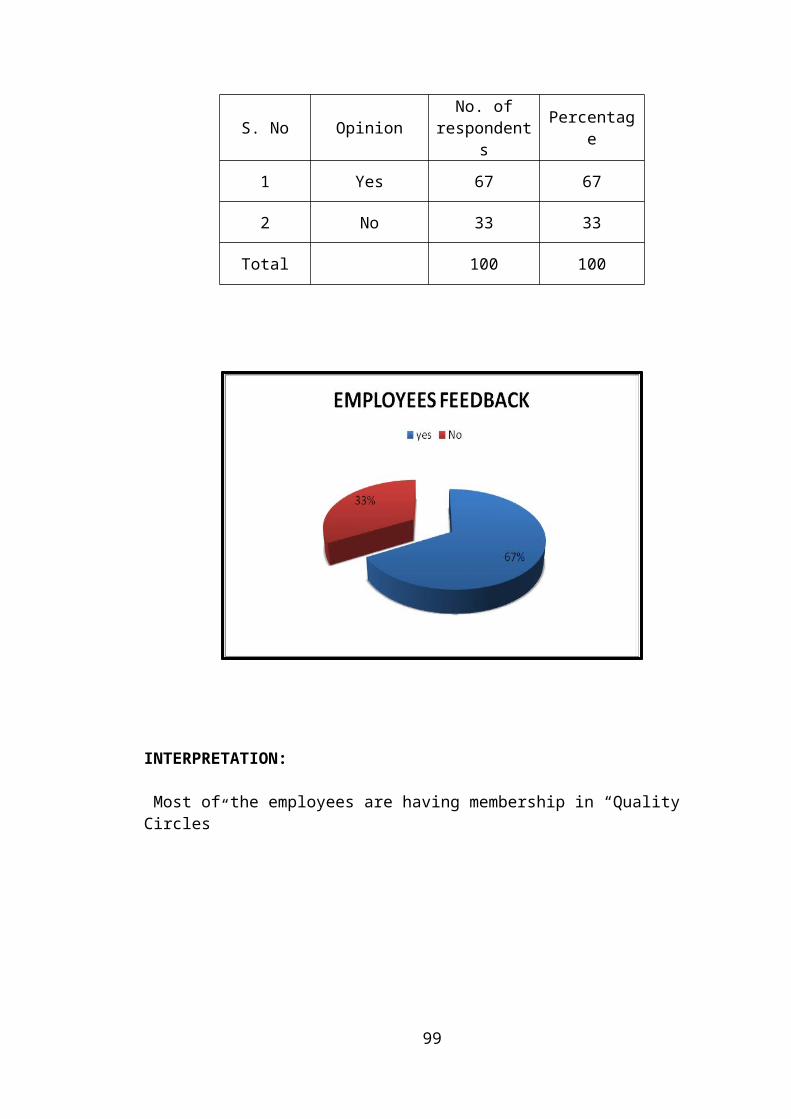
S. No OpinionNo. of
respondents
Percentage
1 Yes 67 67
2 No 33 33
Total 100 100
INTERPRETATION:
Most of the employees are having membership in “Quality Circles”
99

Q.5 What is the main purpose of Quality Circles in your Organization?
S.No Opinion
No. ofrespondent
s
Percentage
1 Improvement inHuman Relations 1 1
2 Promotion ofWork Culture 2 2
3 Develop TeamWork 19 19
4 ImproveProductivity 13 13
5Enhance Problem
SolvingCapacity
12 12
6 All of theAbove 53 53
Total 100 100
100

INTERPRETATION:
The majority of the respondents’ i.e. 53% agree and only1%
of respondent wants to make some improvement in human
relations.
Q.6 Do you think quality circle develops a participative environment in the Organization?
S. No OpinionNo. of
respondents
Percentage
1 Fullyagree 55 55
2 To Someextent 38 38
3 Does not 4 4
4 Not aware 3 3
Total 100 100
101
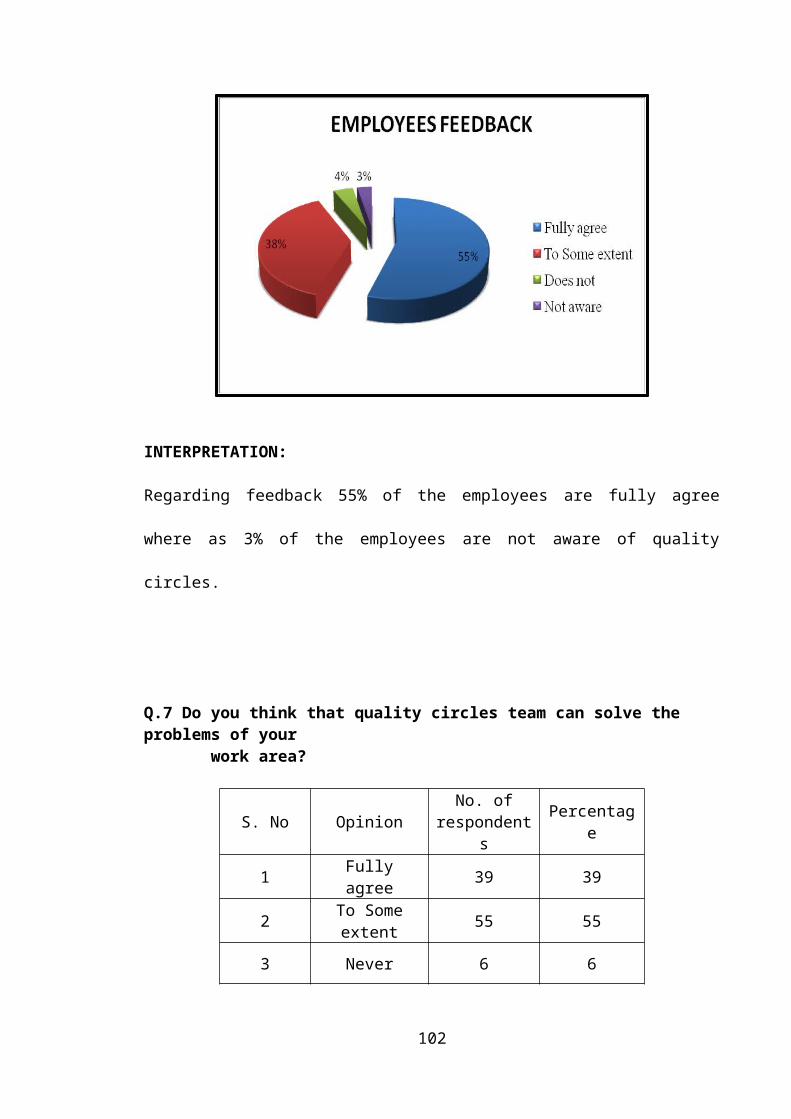
INTERPRETATION:
Regarding feedback 55% of the employees are fully agree
where as 3% of the employees are not aware of quality
circles.
Q.7 Do you think that quality circles team can solve the problems of your work area?
S. No OpinionNo. of
respondents
Percentage
1 Fullyagree 39 39
2 To Someextent 55 55
3 Never 6 6
102

Total 100 100
INTERPRATATION:
Most of the employees are agree to take active part in
quality circles team to solve the problems in that work area
Q.8 Do you think that Quality Circles are helpful in Cost Reduction?
S. No OpinionNo. of
respondents
Percentage
1 Fully 59 59
103

agree
2 To Someextent 37 37
3 Never 4 4
Total 100 100
INTERPRETATION:
Out of 100 employees 59% of the employees are agree to
belive Quality Circles are helpful in Cost Reduction.
Q.9 Do you think that Quality Circles are helpful in increasing Productivity?
104
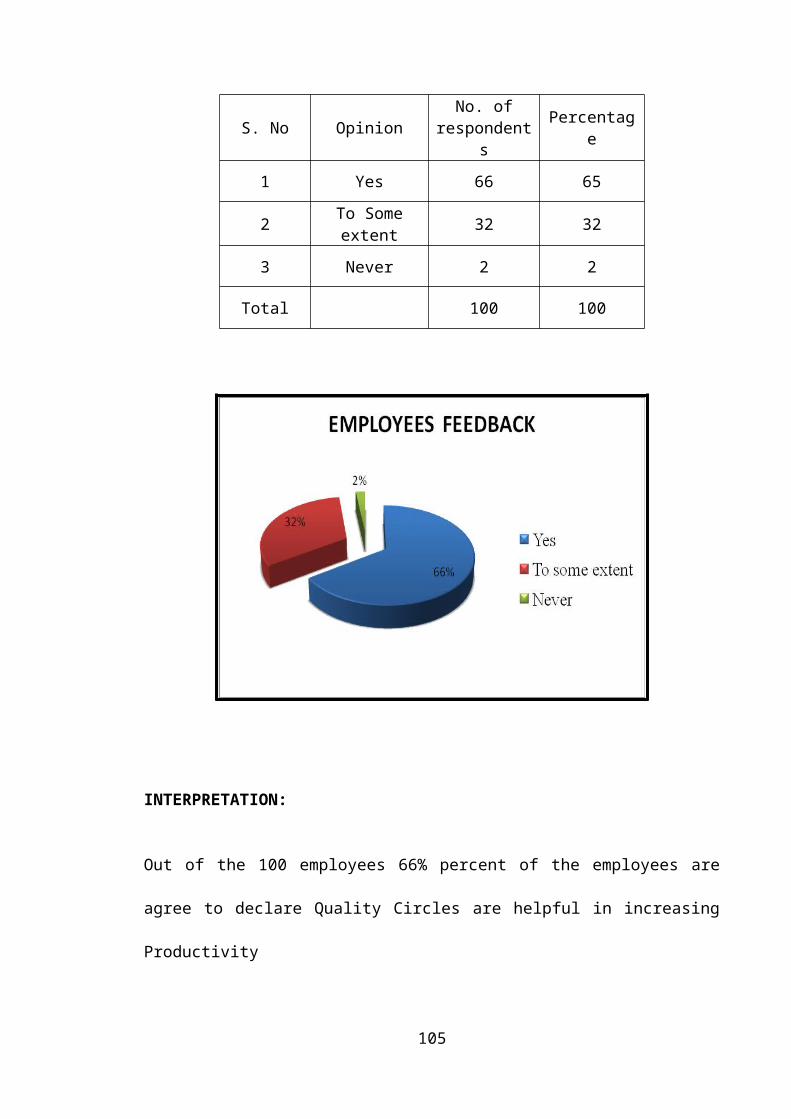
S. No OpinionNo. of
respondents
Percentage
1 Yes 66 65
2 To Someextent 32 32
3 Never 2 2
Total 100 100
INTERPRETATION:
Out of the 100 employees 66% percent of the employees are
agree to declare Quality Circles are helpful in increasing
Productivity
105

Q10. Do you think that Quality Circles are helpful in
building a Positive
Work Culture?
S. No OpinionNo. of
respondents
Percentage
1 Yes 70 70
2 To Someextent 28 28
3 Never 2 2
Total 100 100
106

INTERPRETATION:
Regarding feed back 70% of the employees are satisfied
whereas 2% of the employees are not satisfied with this
statement.
Q11. Does the management keep track on the activities of Quality Circles?
S. No OpinionNo. of
respondents
Percentage
1 Yes 56 56
2 To Someextent 41 41
3 Never 1 1
Total 100 100
107
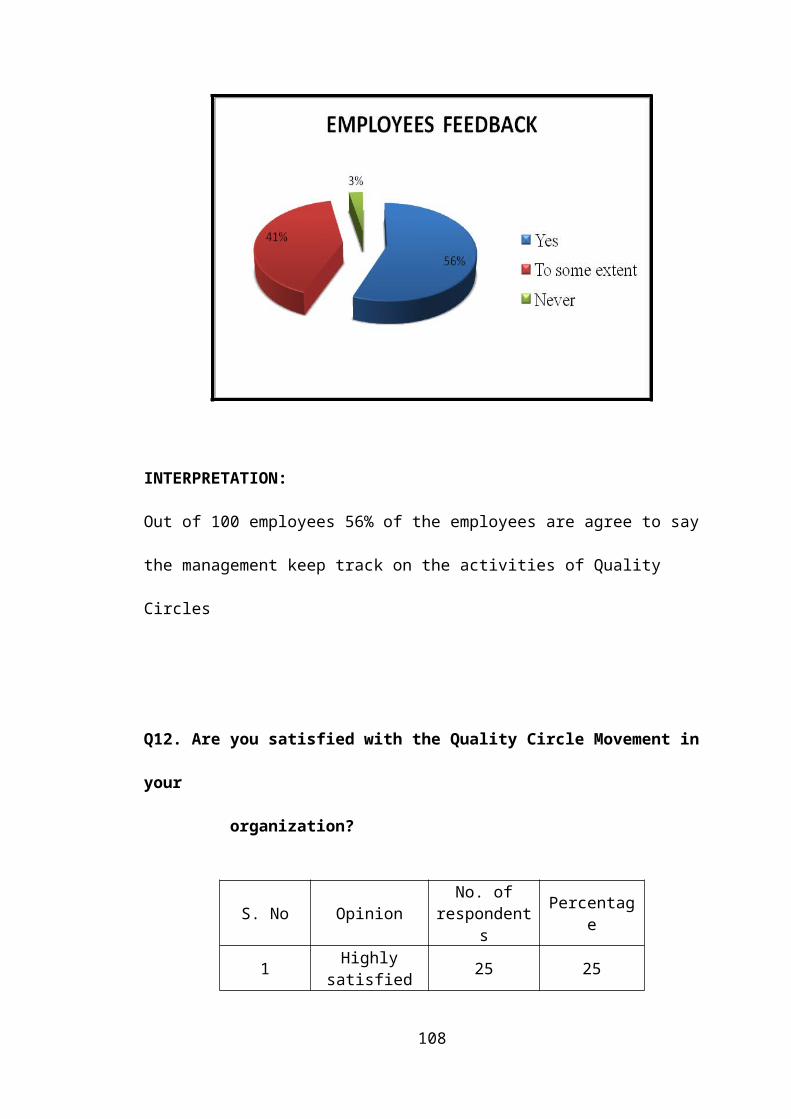
INTERPRETATION:
Out of 100 employees 56% of the employees are agree to say
the management keep track on the activities of Quality
Circles
Q12. Are you satisfied with the Quality Circle Movement in
your
organization?
S. No OpinionNo. of
respondents
Percentage
1 Highlysatisfied 25 25
108

2 Satisfied 70 70
3 dissatisfied 5 5
Total 100 100
INTERPRETATION:
Out of 100 employees are 70 % of the employees are Satisfied
with the Quality Circle Movement in BHEL, Hyderabad.
Q13. Rate the statement “Top Management is interested in
motivating the
employees through Quality Circles”
109

S. No OpinionNo. of
respondents
Percentage
1 Stronglyagree 22 22
2 Agree 61 61
3 Disagree 14 14
Can't say 3 3
Total 100 100
INTERPRETATION:
The majority of respondents i.e 61%agree and only 3%of the
employees are not able to satisfied with this statement.
110

Q14. Do you think” quality circles” are important for the
growth of the
company?
S. No OpinionNo. of
respondents
Percentage
1 Veryimportant 45 45
2 Important 51 51
3 Notimportant 2 2
4 Can't say 2 2
Total 100 100
INTERPRETATION:
111
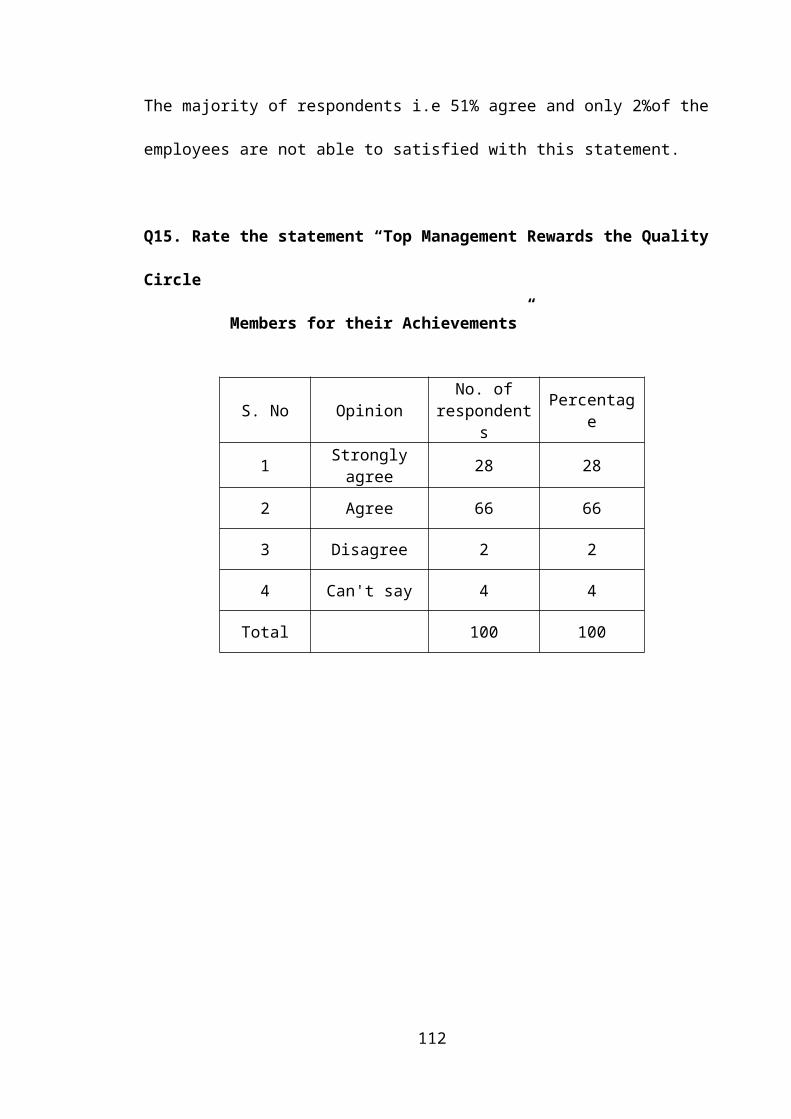
The majority of respondents i.e 51% agree and only 2%of the
employees are not able to satisfied with this statement.
Q15. Rate the statement “Top Management Rewards the Quality
Circle
Members for their Achievements”
S. No OpinionNo. of
respondents
Percentage
1 Stronglyagree 28 28
2 Agree 66 66
3 Disagree 2 2
4 Can't say 4 4
Total 100 100
112

INTERPRETATIONS:
Out of the 100 employees 66% of the employees are agree and
28% of the employees are strongly agree to say “Top
Management Rewards the Quality Circle Members for their
Achievements”
Q16. Do you think involvement in Quality Circles is un-
productive or waste
of time?
S. No OpinionNo. of
respondents
Percentage
1 Stronglyagree 0 0
2 Agree 4 4
113

3 Disagree 91 91
4 Can't say 5 5
Total 100 100
INTERPRETATION:
The majority of the respondents’ i.e.91% disagree and only
4% of the respondents agree with this statement.
114
CHAPTER-VFINDINGS, CONCLUSIONS, SUGGESTIONS
115

FINDINGS
• Most of the employees are aware of the Quality Circles.
• Most of the employees are interested to make use of the
Quality Circles
• Most of the employees are think quality circles team will
solve the problems in that work area
• Out of 100 employees 59% of the employees are fullyagree
&37% of the employees are To some extent to say Quality
Circles are helpful in Cost Reduction.
• Out of 100 employees 70% percentage of the employees
agree, Quality Circles are helpful in building a Positive
Work Culture
• Out of 100 employees 56% of the employees are fully agree
&41% of the employees are think To some extent to say the
management keep track on the activities of Quality Circles
• Out of 100 employees are 70percentage of the employees
Satisfied &25% of the employees are highly satisfied with
the Quality Circle Movement in BHEL, Hyderabad.
• Most of the emplyees think “Top Management is interested
in motivating the employees through Quality Circles”.
116

• Out of the 100% employees 51% of them think quality
circles” are useful for the growth of the company.
• Out of the 100 employees 66% of them agree the Top
Management Rewards the Quality Circle Members for their
Achievements
CONCLUSION
It would be a great service to the cause of Quality
Circles.
Helps develop ability to work in teams and appreciate
other’s point of view
If all those who are interested in the healthy
propagation of the philosophy in the country take every
opportunity to stress “What Quality Circles are not?,
as enumerated above, because there are quite a few
instances
117

Where Quality Circles failed to “take off” due to such
misconceptions prevailing in the minds of the
Management personnel
Hence it can be safely concluded that no progressive
organization can afford to ignore the concept of
quality circles.
Quality Circles are not limited to manufacturing firms
only.
Quality Circles are relevant for factories, firms,
schools, hospitals, universities, research institutes,
banks, government offices etc.
118

SUGGESTIONS Conducting the motivational classes every month last
week
It is very important to provide the opportunity to the
employees of the organization to express their ideas or
whatever they want to express
Management should give the importance to mental
relaxation &social cultural development of an employees
who strives hard for the company
Reward or Praise/appreciation works as magic for an
individual and motivates them for work.
Role clarity of each position should be defined and
based on that individuals can plan their work
accordingly.
Self-potential system should be encouraged
There are regular review and comparison of current &
past performance to detect gradual deterioration in the
strategy
Proper cooperation should be necessary in the company
119

BIBILIOGRAPHY
120

BIBLOGRAPHY
Text Books
1. K.Aswathappa (1997), “Human Resources and Personnel
management” Tata McGraw-Hill publishing Company Ltd, New
Delhi-110001
2. John M.Ivancevich (2003), “Human Resources and Personnel
management” Tata McGraw-Hill publishing Company Ltd, New
Delhi-110001
121

3. C.R.Kothari (2001) “Research Methodology” of wishwa
prakashan Publishing,Chennai-17,Edition
4. C.B. Mamoria and S.V.Gankar (2001), Personnel Management
Text &Cases”,Himalaya Publishing houses Mumbai, XXI
Edition.
5. R.S.N,Pillai and V.Bhavathi(1998), “Statistics” of Sultan
Chand and sons,New Delhi,pp.132-141,II Edition.
6. Management of change -Palmer,Dunford,Akin
Journals & articles:
1. HRM REVIEW by IUP Publication
2. Quality circles guide by BHEL
3. Quality circles Handbook by BHEL
Websites:
www.citehr.com
www.managementparadise.cm
www.scribd.com
www.wikipidia.com
www.qualityof worklife.com
122

ANNEXURE
123

Questionnaire
Q1. Since how many years have you been working with this
organization?
A) 0-5 Year B) 5-10 Years C) 10 to 15 Years D)
More than 15 Years
Q2. Are you aware of Quality Circles?
A) Fully aware B) Partially aware C) Only Basics
D) Not aware
Q3. Do you involve in Quality Circle teams working in your
work area
A) Frequently B) Sometimes C) Rarely
D) Never
Q4. Are you a member of any Quality Circle?
A) Yes B) No
124

Q5. What is the main purpose of Quality Circles in your
Organization?
A) Improvement in Human Relations B) Promotion
of Work Culture
C) Develop Team Work D)
Improve Productivity
E) Enhance Problem Solving Capacity F) All of
the Above
Q6. Do you think quality circle develops a participative
environment in the organization?
A) Fully Agree B) To some extent C) Does not D)
Not aware
Q7. Do you think that quality circles team can solve the
problems of your work area?
A) Fully B) To some extent C) Never
125

Q8. Do you think that Quality Circles are helpful in Cost
Reduction?
A) Yes B) To some extent
C)Never
Q9. Do you think that Quality Circles are helpful in
increasing Productivity?
A) Yes B) To some extent C)
Never
Q10. Do you think that Quality Circles are helpful in
building a Positive Work Culture?
A) Yes B) To some extent C) Never
Q11. Does the management keep track on the activities of
Quality Circles ?
A) Yes B) to some extent C) Never
Q12. Are you satisfied with the Quality Circle Movement in
your organization?
126

A) Highly-Satisfied B)Satisfied
C)Dissatisfied
Q13. Rate the statement “Top Management is interested in
motivating the employees through Quality Circles”
A) Strongly Agree B) Agree C) Disagree D)
Can’t say
Q14. Do you think” quality circles” are important for the
growth of the Company?
A) Very Important B) Important C) Not
Important D) Can’t say
Q15. Rate the statement “Top Management Rewards the Quality
Circle Members for their Achievements”
A) Strongly Agree B) Agree C) Disagree D)
Can’t say
Q16. Do you think involvement in Quality Circles is un-
productive or waste of time?
A) Strongly Agree B) Agree C) Disagree D)
Can’t say
127

128
Related Documents