Quality by design approach for optimizing the formulation and physical properties of extemporaneously prepared orodispersible films J. Carolina Visser a, *, Willem M.C. Dohmen a , Wouter L.J. Hinrichs a , Jörg Breitkreutz b , Henderik W. Frijlink a , Herman J. Woerdenbag a a Department of Pharmaceutical Technology and Biopharmacy, University of Groningen, Antonius Deusinglaan 1, 9713 AV Groningen, The Netherlands b Institute of Pharmaceutics and Biopharmaceutics, Heinrich-Heine-University Düsseldorf, Universitätsstrasse 1, 40225 Düsseldorf, Germany A R T I C L E I N F O Article history: Received 24 December 2014 Received in revised form 2 March 2015 Accepted 4 March 2015 Available online 5 March 2015 Chemical compounds studied in this article: Hypromellose (PubChem CID: 57503849) Glycerol (PubChem CID: 753) Keywords: Orodispersible films Extemporaneous pharmacy preparations Optimizing formulation Quality by design Quality target product profile Critical quality attributes A B S T R A C T The quality by design (QbD) approach was applied for optimizing the formulation of extemporaneously prepared orodispersible films (ODFs) using Design-Expert 1 Software. The starting formulation was based on earlier experiments and contained the film forming agents hypromellose and carbomer 974P and the plasticizer glycerol (Visser et al., 2015). Trometamol and disodium EDTA were added to stabilize the solution. To optimize this formulation a quality target product profile was established in which critical quality attributes (CQAs) such as mechanical properties and disintegration time were defined and quantified. As critical process parameters (CPP) that were evaluated for their effect on the CQAs the percentage of hypromellose and the percentage of glycerol as well as the drying time were chosen. Response surface methodology (RMS) was used to evaluate the effects of the CPPs on the CQAs of the final product. The main factor affecting tensile strength and Young’s modulus was the percentage of glycerol. Elongation at break was mainly influenced by the drying temperature. Disintegration time was found to be sensitive to the percentage of hypromellose. From the results a design space could be created. As long as the formulation and process variables remain within this design space, a product is obtained with desired characteristics and that meets all set quality requirements. ã 2015 Elsevier B.V. All rights reserved. 1. Introduction Pharmaceutical quality, patient safety and efficacy are best controlled by a fundamental understanding of the formulation and manufacturing of pharmaceutical preparations (Yu, 2008). Quality by design (QbD) is a systematic approach to optimize pharmaceu- tical preparations and to improve the control over and the quality of the production process. The quality by design approach consistently yields a product with desired characteristics and built in quality (ICH Q8, 2008). Extemporaneously prepared orodispersible films (ODFs) are a promising new development, which - as small scale pharmacy preparations – can be applied in personalized medicine approach (Visser et al., 2015). ODFs have various advantages over other oral dosage forms such as tablets or syrups that are directly swallowed: they stick to the tongue or palatal immediately which prevents spitting out or choking, they disintegrate within a few seconds, there is no need of fluid intake, they may enhance the onset of action by bypassing first-pass metabolism (when absorption occurs via the oromucosal route) and can be used for systemic as well as local drug delivery (El-Malah and Nazzal, 2013; ElMeshad and El Hagrasy, 2011; Hoffmann et al., 2011). Extempo- raneously prepared ODFs can be made from a standard casting solution in which different active pharmaceutical ingredients (APIs) are dissolved or suspended. The desired composition and characteristics of a standard casting solution should be defined in relation to the properties of the final product. The preferred tool for strategic drug development using the QbD approach is the establishment of a quality target product profile (QTPP) (Delasko et al., 2005; Rathore and Winkle, 2009). A QTPP starts with defining the critical quality attributes (CQAs) for the final product. A CQA can be defined as: ‘a physical, chemical, biological or microbiological property or characteristic that should be within an appropriate limit, range or distribution to ensure the desired product quality’ and thereby adequate performance and safety of the drug product when used (Rathore and Winkle, 2009). If we consider an ideal ODF to be flexible, easy to administer, easy to handle and physically stable (Hoffmann et al., 2011) these characteristics can be translated into a high tensile strength, high elongation at break and low Young’s modulus (Preis et al., 2013, * Correspondending author. Tel.: +31 50 363 3282; fax: +31 50 363 2500. E-mail address: [email protected] (J. C. Visser). http://dx.doi.org/10.1016/j.ijpharm.2015.03.005 0378-5173/ ã 2015 Elsevier B.V. All rights reserved. International Journal of Pharmaceutics 485 (2015) 70–76 Contents lists available at ScienceDirect International Journal of Pharmaceutics journa l home page : www.e lsevier.com/loca te/ijpharm

Welcome message from author
This document is posted to help you gain knowledge. Please leave a comment to let me know what you think about it! Share it to your friends and learn new things together.
Transcript
International Journal of Pharmaceutics 485 (2015) 70–76
Quality by design approach for optimizing the formulation and physicalproperties of extemporaneously prepared orodispersible films
J. Carolina Visser a,*, Willem M.C. Dohmen a, Wouter L.J. Hinrichs a, Jörg Breitkreutz b,Henderik W. Frijlink a, Herman J. Woerdenbag a
aDepartment of Pharmaceutical Technology and Biopharmacy, University of Groningen, Antonius Deusinglaan 1, 9713 AV Groningen, The Netherlandsb Institute of Pharmaceutics and Biopharmaceutics, Heinrich-Heine-University Düsseldorf, Universitätsstrasse 1, 40225 Düsseldorf, Germany
A R T I C L E I N F O
Article history:Received 24 December 2014Received in revised form 2 March 2015Accepted 4 March 2015Available online 5 March 2015
Chemical compounds studied in this article:Hypromellose (PubChem CID: 57503849)Glycerol (PubChem CID: 753)
Keywords:Orodispersible filmsExtemporaneous pharmacy preparationsOptimizing formulationQuality by designQuality target product profileCritical quality attributes
A B S T R A C T
The quality by design (QbD) approach was applied for optimizing the formulation of extemporaneouslyprepared orodispersible films (ODFs) using Design-Expert1 Software. The starting formulation wasbased on earlier experiments and contained the film forming agents hypromellose and carbomer 974Pand the plasticizer glycerol (Visser et al., 2015). Trometamol and disodium EDTA were added to stabilizethe solution. To optimize this formulation a quality target product profile was established in whichcritical quality attributes (CQAs) such as mechanical properties and disintegration time were defined andquantified. As critical process parameters (CPP) that were evaluated for their effect on the CQAs thepercentage of hypromellose and the percentage of glycerol as well as the drying time were chosen.Response surface methodology (RMS) was used to evaluate the effects of the CPPs on the CQAs of the finalproduct. The main factor affecting tensile strength and Young’s modulus was the percentage of glycerol.Elongation at break was mainly influenced by the drying temperature. Disintegration time was found tobe sensitive to the percentage of hypromellose. From the results a design space could be created. As longas the formulation and process variables remain within this design space, a product is obtained withdesired characteristics and that meets all set quality requirements.
ã 2015 Elsevier B.V. All rights reserved.
Contents lists available at ScienceDirect
International Journal of Pharmaceutics
journa l home page : www.e l sev ier .com/ loca te / i jpharm
1. Introduction
Pharmaceutical quality, patient safety and efficacy are bestcontrolled by a fundamental understanding of the formulation andmanufacturing of pharmaceutical preparations (Yu, 2008). Qualityby design (QbD) is a systematic approach to optimize pharmaceu-tical preparations and to improve the control over and the qualityof the production process. The quality by design approachconsistently yields a product with desired characteristics andbuilt in quality (ICH Q8, 2008).
Extemporaneously prepared orodispersible films (ODFs) are apromising new development, which - as small scale pharmacypreparations – can be applied in personalized medicine approach(Visser et al., 2015). ODFs have various advantages over other oraldosage forms such as tablets or syrups that are directly swallowed:they stick to the tongue or palatal immediately which preventsspitting out or choking, they disintegrate within a few seconds,there is no need of fluid intake, they may enhance the onset of
* Correspondending author. Tel.: +31 50 363 3282; fax: +31 50 363 2500.E-mail address: [email protected] (J. C. Visser).
http://dx.doi.org/10.1016/j.ijpharm.2015.03.0050378-5173/ã 2015 Elsevier B.V. All rights reserved.
action by bypassing first-pass metabolism (when absorptionoccurs via the oromucosal route) and can be used for systemicas well as local drug delivery (El-Malah and Nazzal, 2013;ElMeshad and El Hagrasy, 2011; Hoffmann et al., 2011). Extempo-raneously prepared ODFs can be made from a standard castingsolution in which different active pharmaceutical ingredients(APIs) are dissolved or suspended. The desired composition andcharacteristics of a standard casting solution should be defined inrelation to the properties of the final product.
The preferred tool for strategic drug development using theQbD approach is the establishment of a quality target productprofile (QTPP) (Delasko et al., 2005; Rathore and Winkle, 2009). AQTPP starts with defining the critical quality attributes (CQAs) forthe final product. A CQA can be defined as: ‘a physical, chemical,biological or microbiological property or characteristic that shouldbe within an appropriate limit, range or distribution to ensure thedesired product quality’ and thereby adequate performance andsafety of the drug product when used (Rathore and Winkle, 2009).If we consider an ideal ODF to be flexible, easy to administer, easyto handle and physically stable (Hoffmann et al., 2011) thesecharacteristics can be translated into a high tensile strength, highelongation at break and low Young’s modulus (Preis et al., 2013,
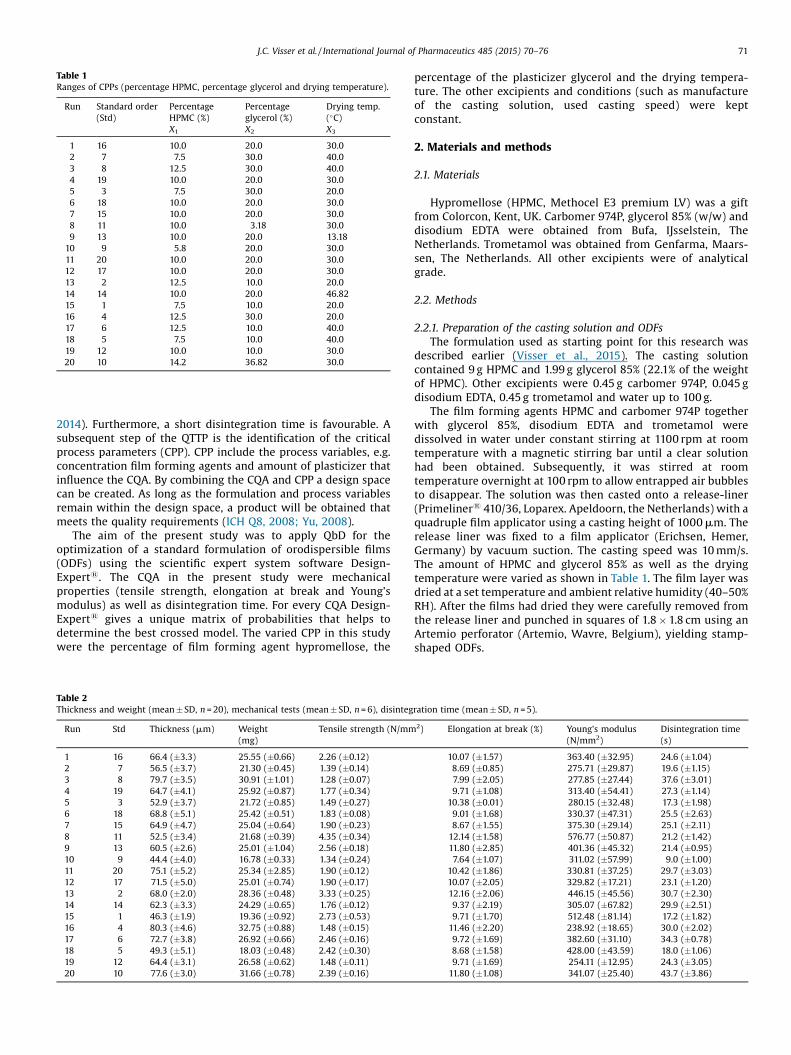
Table 1Ranges of CPPs (percentage HPMC, percentage glycerol and drying temperature).
Run Standard order(Std)
PercentageHPMC (%)X1
Percentageglycerol (%)X2
Drying temp.(�C)X3
1 16 10.0 20.0 30.02 7 7.5 30.0 40.03 8 12.5 30.0 40.04 19 10.0 20.0 30.05 3 7.5 30.0 20.06 18 10.0 20.0 30.07 15 10.0 20.0 30.08 11 10.0 3.18 30.09 13 10.0 20.0 13.18
10 9 5.8 20.0 30.011 20 10.0 20.0 30.012 17 10.0 20.0 30.013 2 12.5 10.0 20.014 14 10.0 20.0 46.8215 1 7.5 10.0 20.016 4 12.5 30.0 20.017 6 12.5 10.0 40.018 5 7.5 10.0 40.019 12 10.0 10.0 30.020 10 14.2 36.82 30.0
J.C. Visser et al. / International Journal of Pharmaceutics 485 (2015) 70–76 71
2014). Furthermore, a short disintegration time is favourable. Asubsequent step of the QTTP is the identification of the criticalprocess parameters (CPP). CPP include the process variables, e.g.concentration film forming agents and amount of plasticizer thatinfluence the CQA. By combining the CQA and CPP a design spacecan be created. As long as the formulation and process variablesremain within the design space, a product will be obtained thatmeets the quality requirements (ICH Q8, 2008; Yu, 2008).
The aim of the present study was to apply QbD for theoptimization of a standard formulation of orodispersible films(ODFs) using the scientific expert system software Design-Expert1. The CQA in the present study were mechanicalproperties (tensile strength, elongation at break and Young’smodulus) as well as disintegration time. For every CQA Design-Expert1 gives a unique matrix of probabilities that helps todetermine the best crossed model. The varied CPP in this studywere the percentage of film forming agent hypromellose, the
Table 2Thickness and weight (mean � SD, n = 20), mechanical tests (mean � SD, n = 6), disinteg
Run Std Thickness (mm) Weight(mg)
Tensile strength (N/mm
1 16 66.4 (�3.3) 25.55 (�0.66) 2.26 (�0.12)
2 7 56.5 (�3.7) 21.30 (�0.45) 1.39 (�0.14)
3 8 79.7 (�3.5) 30.91 (�1.01) 1.28 (�0.07)
4 19 64.7 (�4.1) 25.92 (�0.87) 1.77 (�0.34)
5 3 52.9 (�3.7) 21.72 (�0.85) 1.49 (�0.27)
6 18 68.8 (�5.1) 25.42 (�0.51) 1.83 (�0.08)
7 15 64.9 (�4.7) 25.04 (�0.64) 1.90 (�0.23)
8 11 52.5 (�3.4) 21.68 (�0.39) 4.35 (�0.34)
9 13 60.5 (�2.6) 25.01 (�1.04) 2.56 (�0.18)
10 9 44.4 (�4.0) 16.78 (�0.33) 1.34 (�0.24)
11 20 75.1 (�5.2) 25.34 (�2.85) 1.90 (�0.12)
12 17 71.5 (�5.0) 25.01 (�0.74) 1.90 (�0.17)
13 2 68.0 (�2.0) 28.36 (�0.48) 3.33 (�0.25)
14 14 62.3 (�3.3) 24.29 (�0.65) 1.76 (�0.12)
15 1 46.3 (�1.9) 19.36 (�0.92) 2.73 (�0.53)
16 4 80.3 (�4.6) 32.75 (�0.88) 1.48 (�0.15)
17 6 72.7 (�3.8) 26.92 (�0.66) 2.46 (�0.16)
18 5 49.3 (�5.1) 18.03 (�0.48) 2.42 (�0.30)
19 12 64.4 (�3.1) 26.58 (�0.62) 1.48 (�0.11)
20 10 77.6 (�3.0) 31.66 (�0.78) 2.39 (�0.16)
percentage of the plasticizer glycerol and the drying tempera-ture. The other excipients and conditions (such as manufactureof the casting solution, used casting speed) were keptconstant.
2. Materials and methods
2.1. Materials
Hypromellose (HPMC, Methocel E3 premium LV) was a giftfrom Colorcon, Kent, UK. Carbomer 974P, glycerol 85% (w/w) anddisodium EDTA were obtained from Bufa, IJsselstein, TheNetherlands. Trometamol was obtained from Genfarma, Maars-sen, The Netherlands. All other excipients were of analyticalgrade.
2.2. Methods
2.2.1. Preparation of the casting solution and ODFsThe formulation used as starting point for this research was
described earlier (Visser et al., 2015). The casting solutioncontained 9 g HPMC and 1.99 g glycerol 85% (22.1% of the weightof HPMC). Other excipients were 0.45 g carbomer 974P, 0.045 gdisodium EDTA, 0.45 g trometamol and water up to 100 g.
The film forming agents HPMC and carbomer 974P togetherwith glycerol 85%, disodium EDTA and trometamol weredissolved in water under constant stirring at 1100 rpm at roomtemperature with a magnetic stirring bar until a clear solutionhad been obtained. Subsequently, it was stirred at roomtemperature overnight at 100 rpm to allow entrapped air bubblesto disappear. The solution was then casted onto a release-liner(Primeliner1 410/36, Loparex. Apeldoorn, the Netherlands) with aquadruple film applicator using a casting height of 1000 mm. Therelease liner was fixed to a film applicator (Erichsen, Hemer,Germany) by vacuum suction. The casting speed was 10 mm/s.The amount of HPMC and glycerol 85% as well as the dryingtemperature were varied as shown in Table 1. The film layer wasdried at a set temperature and ambient relative humidity (40–50%RH). After the films had dried they were carefully removed fromthe release liner and punched in squares of 1.8 � 1.8 cm using anArtemio perforator (Artemio, Wavre, Belgium), yielding stamp-shaped ODFs.
ration time (mean � SD, n = 5).
2) Elongation at break (%) Young’s modulus(N/mm2)
Disintegration time(s)
10.07 (�1.57) 363.40 (�32.95) 24.6 (�1.04)8.69 (�0.85) 275.71 (�29.87) 19.6 (�1.15)7.99 (�2.05) 277.85 (�27.44) 37.6 (�3.01)9.71 (�1.08) 313.40 (�54.41) 27.3 (�1.14)
10.38 (�0.01) 280.15 (�32.48) 17.3 (�1.98)9.01 (�1.68) 330.37 (�47.31) 25.5 (�2.63)8.67 (�1.55) 375.30 (�29.14) 25.1 (�2.11)12.14 (�1.58) 576.77 (�50.87) 21.2 (�1.42)11.80 (�2.85) 401.36 (�45.32) 21.4 (�0.95)7.64 (�1.07) 311.02 (�57.99) 9.0 (�1.00)
10.42 (�1.86) 330.81 (�37.25) 29.7 (�3.03)10.07 (�2.05) 329.82 (�17.21) 23.1 (�1.20)12.16 (�2.06) 446.15 (�45.56) 30.7 (�2.30)9.37 (�2.19) 305.07 (�67.82) 29.9 (�2.51)9.71 (�1.70) 512.48 (�81.14) 17.2 (�1.82)11.46 (�2.20) 238.92 (�18.65) 30.0 (�2.02)9.72 (�1.69) 382.60 (�31.10) 34.3 (�0.78)8.68 (�1.58) 428.00 (�43.59) 18.0 (�1.06)9.71 (�1.69) 254.11 (�12.95) 24.3 (�3.05)11.80 (�1.08) 341.07 (�25.40) 43.7 (�3.86)
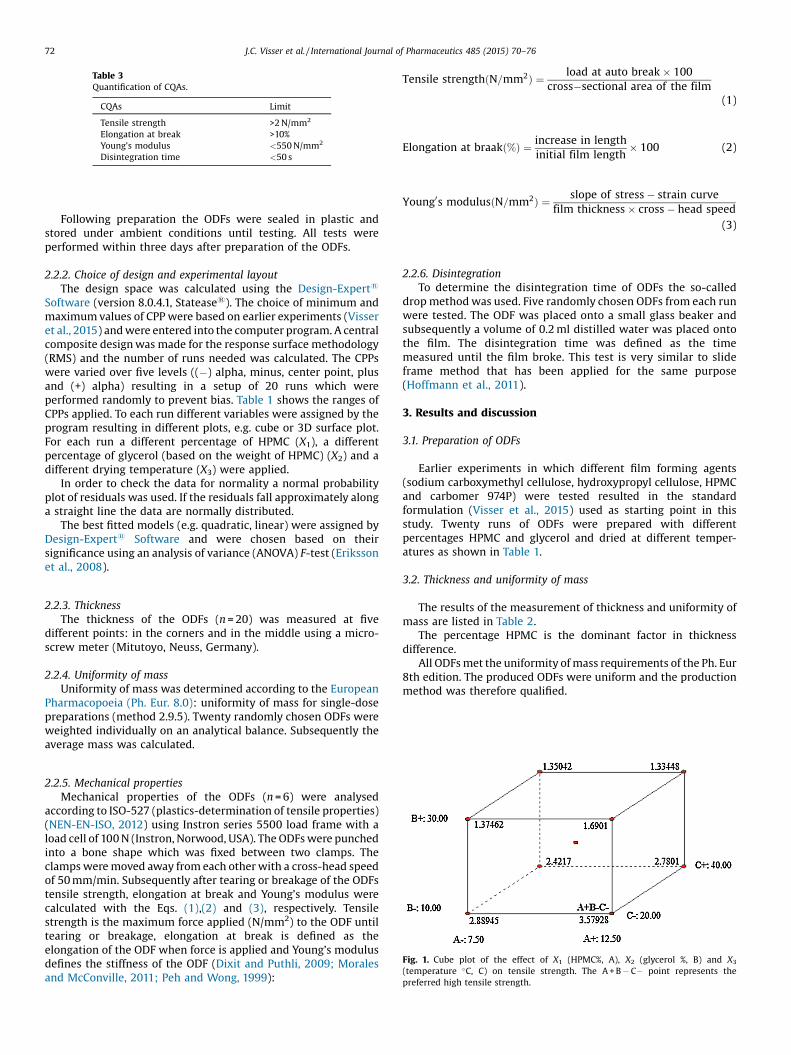
Table 3Quantification of CQAs.
CQAs Limit
Tensile strength >2 N/mm2
Elongation at break >10%Young’s modulus <550 N/mm2
Disintegration time <50 s
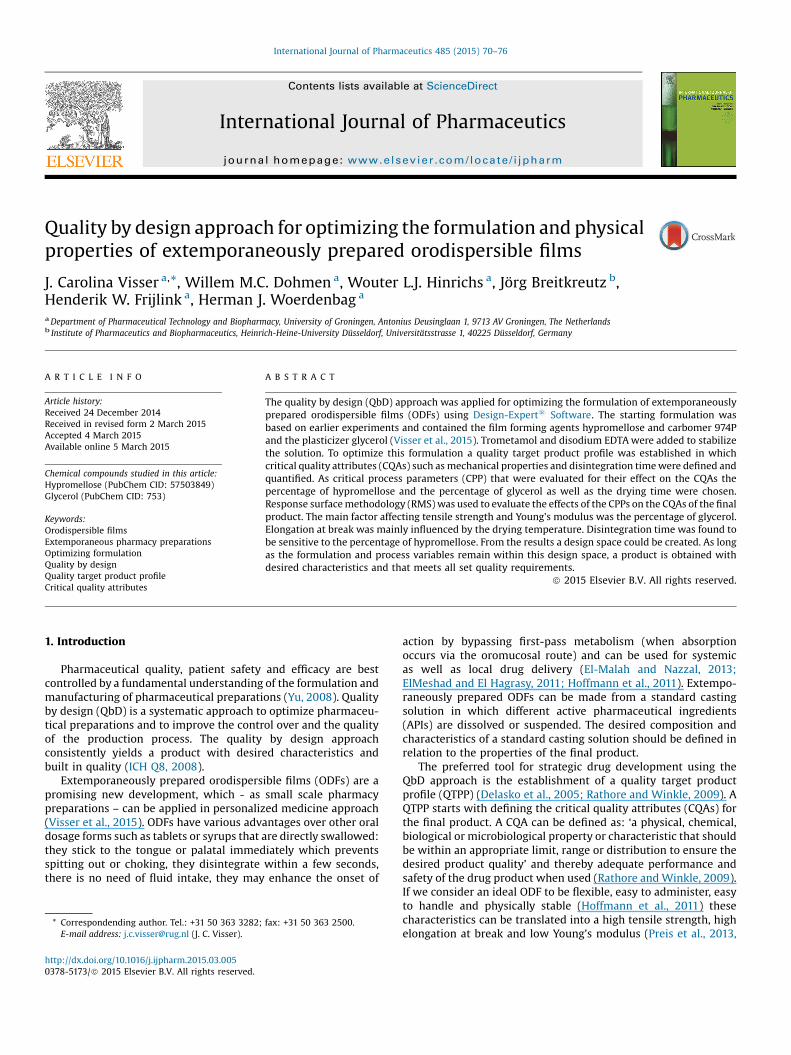
Fig. 1. Cube plot of the effect of X1 (HPMC%, A), X2 (glycerol %, B) and X3
(temperature �C, C) on tensile strength. The A + B � C� point represents thepreferred high tensile strength.
72 J.C. Visser et al. / International Journal of Pharmaceutics 485 (2015) 70–76
Following preparation the ODFs were sealed in plastic andstored under ambient conditions until testing. All tests wereperformed within three days after preparation of the ODFs.
2.2.2. Choice of design and experimental layoutThe design space was calculated using the Design-Expert1
Software (version 8.0.4.1, Statease1). The choice of minimum andmaximum values of CPP were based on earlier experiments (Visseret al., 2015) and were entered into the computer program. A centralcomposite design was made for the response surface methodology(RMS) and the number of runs needed was calculated. The CPPswere varied over five levels ((�) alpha, minus, center point, plusand (+) alpha) resulting in a setup of 20 runs which wereperformed randomly to prevent bias. Table 1 shows the ranges ofCPPs applied. To each run different variables were assigned by theprogram resulting in different plots, e.g. cube or 3D surface plot.For each run a different percentage of HPMC (X1), a differentpercentage of glycerol (based on the weight of HPMC) (X2) and adifferent drying temperature (X3) were applied.
In order to check the data for normality a normal probabilityplot of residuals was used. If the residuals fall approximately alonga straight line the data are normally distributed.
The best fitted models (e.g. quadratic, linear) were assigned byDesign-Expert1 Software and were chosen based on theirsignificance using an analysis of variance (ANOVA) F-test (Erikssonet al., 2008).
2.2.3. ThicknessThe thickness of the ODFs (n = 20) was measured at five
different points: in the corners and in the middle using a micro-screw meter (Mitutoyo, Neuss, Germany).
2.2.4. Uniformity of massUniformity of mass was determined according to the European
Pharmacopoeia (Ph. Eur. 8.0): uniformity of mass for single-dosepreparations (method 2.9.5). Twenty randomly chosen ODFs wereweighted individually on an analytical balance. Subsequently theaverage mass was calculated.
2.2.5. Mechanical propertiesMechanical properties of the ODFs (n = 6) were analysed
according to ISO-527 (plastics-determination of tensile properties)(NEN-EN-ISO, 2012) using Instron series 5500 load frame with aload cell of 100 N (Instron, Norwood, USA). The ODFs were punchedinto a bone shape which was fixed between two clamps. Theclamps were moved away from each other with a cross-head speedof 50 mm/min. Subsequently after tearing or breakage of the ODFstensile strength, elongation at break and Young’s modulus werecalculated with the Eqs. (1),(2) and (3), respectively. Tensilestrength is the maximum force applied (N/mm2) to the ODF untiltearing or breakage, elongation at break is defined as theelongation of the ODF when force is applied and Young’s modulusdefines the stiffness of the ODF (Dixit and Puthli, 2009; Moralesand McConville, 2011; Peh and Wong, 1999):
Tensile strengthðN=mm2Þ ¼ load at auto break � 100cross�sectional area of the film
(1)
Elongation at braakð%Þ ¼ increase in lengthinitial film length
� 100 (2)
Young0s modulusðN=mm2Þ ¼ slope of stress � strain curvefilm thickness � cross � head speed
(3)
2.2.6. DisintegrationTo determine the disintegration time of ODFs the so-called
drop method was used. Five randomly chosen ODFs from each runwere tested. The ODF was placed onto a small glass beaker andsubsequently a volume of 0.2 ml distilled water was placed ontothe film. The disintegration time was defined as the timemeasured until the film broke. This test is very similar to slideframe method that has been applied for the same purpose(Hoffmann et al., 2011).
3. Results and discussion
3.1. Preparation of ODFs
Earlier experiments in which different film forming agents(sodium carboxymethyl cellulose, hydroxypropyl cellulose, HPMCand carbomer 974P) were tested resulted in the standardformulation (Visser et al., 2015) used as starting point in thisstudy. Twenty runs of ODFs were prepared with differentpercentages HPMC and glycerol and dried at different temper-atures as shown in Table 1.
3.2. Thickness and uniformity of mass
The results of the measurement of thickness and uniformity ofmass are listed in Table 2.
The percentage HPMC is the dominant factor in thicknessdifference.
All ODFs met the uniformity of mass requirements of the Ph. Eur8th edition. The produced ODFs were uniform and the productionmethod was therefore qualified.
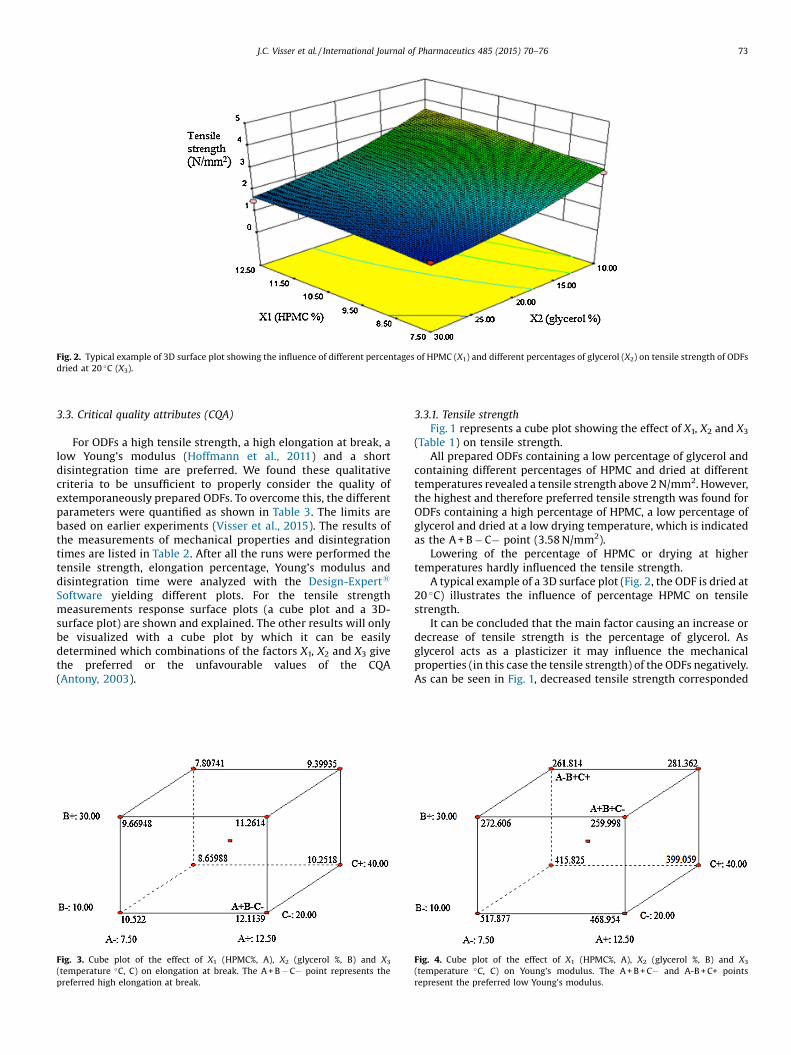
Fig. 2. Typical example of 3D surface plot showing the influence of different percentages of HPMC (X1) and different percentages of glycerol (X2) on tensile strength of ODFsdried at 20 �C (X3).
J.C. Visser et al. / International Journal of Pharmaceutics 485 (2015) 70–76 73
3.3. Critical quality attributes (CQA)
For ODFs a high tensile strength, a high elongation at break, alow Young’s modulus (Hoffmann et al., 2011) and a shortdisintegration time are preferred. We found these qualitativecriteria to be unsufficient to properly consider the quality ofextemporaneously prepared ODFs. To overcome this, the differentparameters were quantified as shown in Table 3. The limits arebased on earlier experiments (Visser et al., 2015). The results ofthe measurements of mechanical properties and disintegrationtimes are listed in Table 2. After all the runs were performed thetensile strength, elongation percentage, Young’s modulus anddisintegration time were analyzed with the Design-Expert1
Software yielding different plots. For the tensile strengthmeasurements response surface plots (a cube plot and a 3D-surface plot) are shown and explained. The other results will onlybe visualized with a cube plot by which it can be easilydetermined which combinations of the factors X1, X2 and X3 givethe preferred or the unfavourable values of the CQA(Antony, 2003).
Fig. 3. Cube plot of the effect of X1 (HPMC%, A), X2 (glycerol %, B) and X3
(temperature �C, C) on elongation at break. The A + B � C� point represents thepreferred high elongation at break.
3.3.1. Tensile strengthFig. 1 represents a cube plot showing the effect of X1, X2 and X3
(Table 1) on tensile strength.All prepared ODFs containing a low percentage of glycerol and
containing different percentages of HPMC and dried at differenttemperatures revealed a tensile strength above 2 N/mm2. However,the highest and therefore preferred tensile strength was found forODFs containing a high percentage of HPMC, a low percentage ofglycerol and dried at a low drying temperature, which is indicatedas the A + B � C� point (3.58 N/mm2).
Lowering of the percentage of HPMC or drying at highertemperatures hardly influenced the tensile strength.
A typical example of a 3D surface plot (Fig. 2, the ODF is dried at20 �C) illustrates the influence of percentage HPMC on tensilestrength.
It can be concluded that the main factor causing an increase ordecrease of tensile strength is the percentage of glycerol. Asglycerol acts as a plasticizer it may influence the mechanicalproperties (in this case the tensile strength) of the ODFs negatively.As can be seen in Fig. 1, decreased tensile strength corresponded
Fig. 4. Cube plot of the effect of X1 (HPMC%, A), X2 (glycerol %, B) and X3
(temperature �C, C) on Young’s modulus. The A + B + C� and A-B + C+ pointsrepresent the preferred low Young’s modulus.
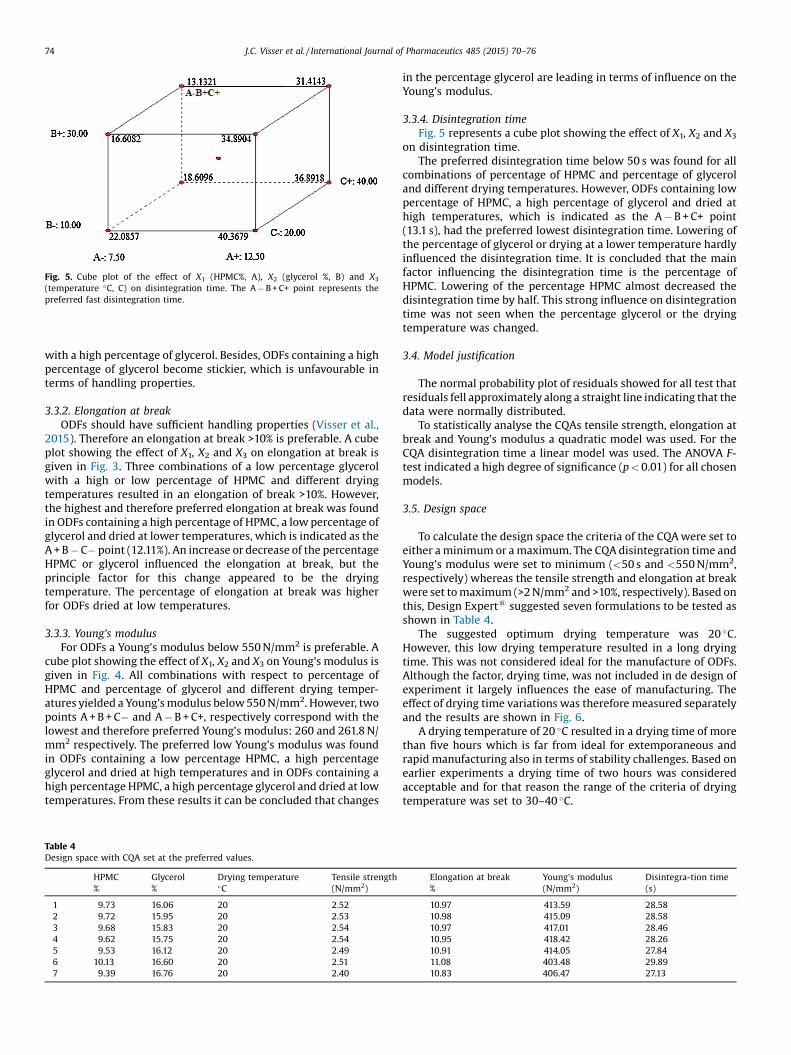
Fig. 5. Cube plot of the effect of X1 (HPMC%, A), X2 (glycerol %, B) and X3
(temperature �C, C) on disintegration time. The A � B + C+ point represents thepreferred fast disintegration time.
74 J.C. Visser et al. / International Journal of Pharmaceutics 485 (2015) 70–76
with a high percentage of glycerol. Besides, ODFs containing a highpercentage of glycerol become stickier, which is unfavourable interms of handling properties.
3.3.2. Elongation at breakODFs should have sufficient handling properties (Visser et al.,
2015). Therefore an elongation at break >10% is preferable. A cubeplot showing the effect of X1, X2 and X3 on elongation at break isgiven in Fig. 3. Three combinations of a low percentage glycerolwith a high or low percentage of HPMC and different dryingtemperatures resulted in an elongation of break >10%. However,the highest and therefore preferred elongation at break was foundin ODFs containing a high percentage of HPMC, a low percentage ofglycerol and dried at lower temperatures, which is indicated as theA + B � C� point (12.11%). An increase or decrease of the percentageHPMC or glycerol influenced the elongation at break, but theprinciple factor for this change appeared to be the dryingtemperature. The percentage of elongation at break was higherfor ODFs dried at low temperatures.
3.3.3. Young’s modulusFor ODFs a Young’s modulus below 550 N/mm2 is preferable. A
cube plot showing the effect of X1, X2 and X3 on Young’s modulus isgiven in Fig. 4. All combinations with respect to percentage ofHPMC and percentage of glycerol and different drying temper-atures yielded a Young’s modulus below 550 N/mm2. However, twopoints A + B + C� and A � B + C+, respectively correspond with thelowest and therefore preferred Young’s modulus: 260 and 261.8 N/mm2 respectively. The preferred low Young’s modulus was foundin ODFs containing a low percentage HPMC, a high percentageglycerol and dried at high temperatures and in ODFs containing ahigh percentage HPMC, a high percentage glycerol and dried at lowtemperatures. From these results it can be concluded that changes
Table 4Design space with CQA set at the preferred values.
HPMC Glycerol Drying temperature Tensile strength
% % �C (N/mm2)
1 9.73 16.06 20 2.52
2 9.72 15.95 20 2.53
3 9.68 15.83 20 2.54
4 9.62 15.75 20 2.54
5 9.53 16.12 20 2.49
6 10.13 16.60 20 2.51
7 9.39 16.76 20 2.40
in the percentage glycerol are leading in terms of influence on theYoung’s modulus.
3.3.4. Disintegration timeFig. 5 represents a cube plot showing the effect of X1, X2 and X3
on disintegration time.The preferred disintegration time below 50 s was found for all
combinations of percentage of HPMC and percentage of glyceroland different drying temperatures. However, ODFs containing lowpercentage of HPMC, a high percentage of glycerol and dried athigh temperatures, which is indicated as the A � B + C+ point(13.1 s), had the preferred lowest disintegration time. Lowering ofthe percentage of glycerol or drying at a lower temperature hardlyinfluenced the disintegration time. It is concluded that the mainfactor influencing the disintegration time is the percentage ofHPMC. Lowering of the percentage HPMC almost decreased thedisintegration time by half. This strong influence on disintegrationtime was not seen when the percentage glycerol or the dryingtemperature was changed.
3.4. Model justification
The normal probability plot of residuals showed for all test thatresiduals fell approximately along a straight line indicating that thedata were normally distributed.
To statistically analyse the CQAs tensile strength, elongation atbreak and Young’s modulus a quadratic model was used. For theCQA disintegration time a linear model was used. The ANOVA F-test indicated a high degree of significance (p < 0.01) for all chosenmodels.
3.5. Design space
To calculate the design space the criteria of the CQA were set toeither a minimum or a maximum. The CQA disintegration time andYoung’s modulus were set to minimum (<50 s and <550 N/mm2,respectively) whereas the tensile strength and elongation at breakwere set to maximum (>2 N/mm2 and >10%, respectively). Based onthis, Design Expert1 suggested seven formulations to be tested asshown in Table 4.
The suggested optimum drying temperature was 20 �C.However, this low drying temperature resulted in a long dryingtime. This was not considered ideal for the manufacture of ODFs.Although the factor, drying time, was not included in de design ofexperiment it largely influences the ease of manufacturing. Theeffect of drying time variations was therefore measured separatelyand the results are shown in Fig. 6.
A drying temperature of 20 �C resulted in a drying time of morethan five hours which is far from ideal for extemporaneous andrapid manufacturing also in terms of stability challenges. Based onearlier experiments a drying time of two hours was consideredacceptable and for that reason the range of the criteria of dryingtemperature was set to 30–40 �C.
Elongation at break Young’s modulus Disintegra-tion time% (N/mm2) (s)
10.97 413.59 28.5810.98 415.09 28.5810.97 417.01 28.4610.95 418.42 28.2610.91 414.05 27.8411.08 403.48 29.8910.83 406.47 27.13
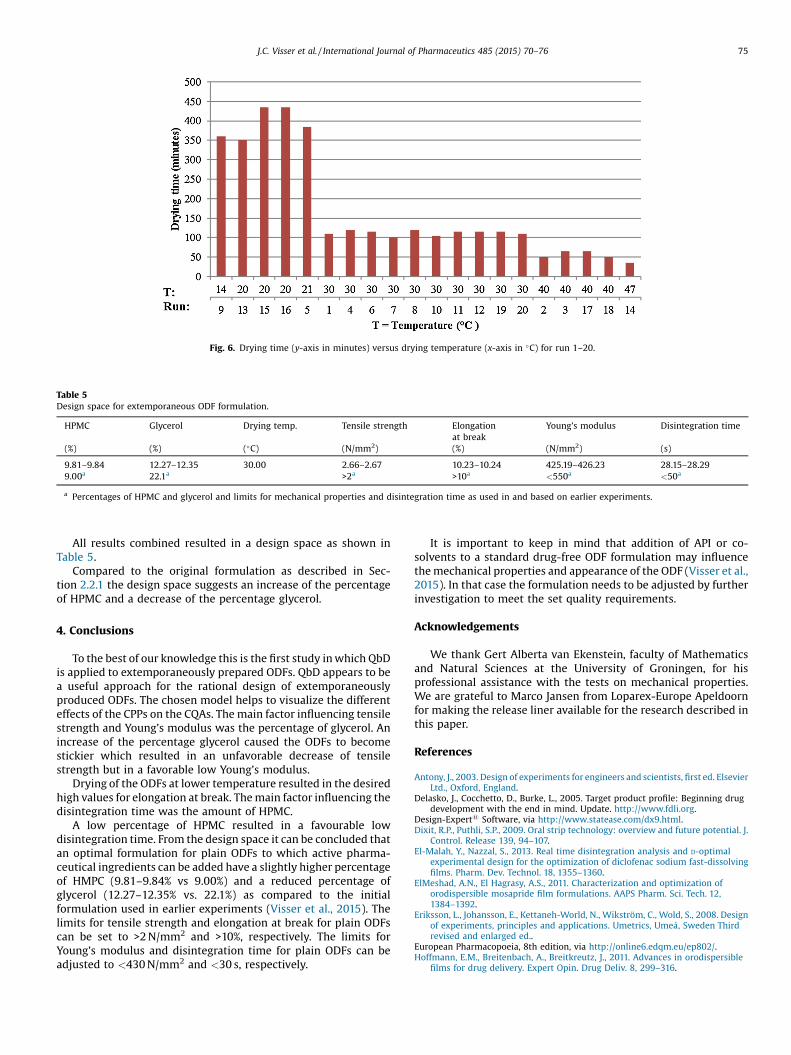
Fig. 6. Drying time (y-axis in minutes) versus drying temperature (x-axis in �C) for run 1–20.
Table 5Design space for extemporaneous ODF formulation.
HPMC Glycerol Drying temp. Tensile strength Elongationat break
Young’s modulus Disintegration time
(%) (%) (�C) (N/mm2) (%) (N/mm2) (s)
9.81–9.84 12.27–12.35 30.00 2.66–2.67 10.23–10.24 425.19–426.23 28.15–28.299.00a 22.1a >2a >10a <550a <50a
a Percentages of HPMC and glycerol and limits for mechanical properties and disintegration time as used in and based on earlier experiments.
J.C. Visser et al. / International Journal of Pharmaceutics 485 (2015) 70–76 75
All results combined resulted in a design space as shown inTable 5.
Compared to the original formulation as described in Sec-tion 2.2.1 the design space suggests an increase of the percentageof HPMC and a decrease of the percentage glycerol.
4. Conclusions
To the best of our knowledge this is the first study in which QbDis applied to extemporaneously prepared ODFs. QbD appears to bea useful approach for the rational design of extemporaneouslyproduced ODFs. The chosen model helps to visualize the differenteffects of the CPPs on the CQAs. The main factor influencing tensilestrength and Young’s modulus was the percentage of glycerol. Anincrease of the percentage glycerol caused the ODFs to becomestickier which resulted in an unfavorable decrease of tensilestrength but in a favorable low Young’s modulus.
Drying of the ODFs at lower temperature resulted in the desiredhigh values for elongation at break. The main factor influencing thedisintegration time was the amount of HPMC.
A low percentage of HPMC resulted in a favourable lowdisintegration time. From the design space it can be concluded thatan optimal formulation for plain ODFs to which active pharma-ceutical ingredients can be added have a slightly higher percentageof HMPC (9.81–9.84% vs 9.00%) and a reduced percentage ofglycerol (12.27–12.35% vs. 22.1%) as compared to the initialformulation used in earlier experiments (Visser et al., 2015). Thelimits for tensile strength and elongation at break for plain ODFscan be set to >2 N/mm2 and >10%, respectively. The limits forYoung’s modulus and disintegration time for plain ODFs can beadjusted to <430 N/mm2 and <30 s, respectively.
It is important to keep in mind that addition of API or co-solvents to a standard drug-free ODF formulation may influencethe mechanical properties and appearance of the ODF (Visser et al.,2015). In that case the formulation needs to be adjusted by furtherinvestigation to meet the set quality requirements.
Acknowledgements
We thank Gert Alberta van Ekenstein, faculty of Mathematicsand Natural Sciences at the University of Groningen, for hisprofessional assistance with the tests on mechanical properties.We are grateful to Marco Jansen from Loparex-Europe Apeldoornfor making the release liner available for the research described inthis paper.
References
Antony, J., 2003. Design of experiments for engineers and scientists, first ed. ElsevierLtd., Oxford, England.
Delasko, J., Cocchetto, D., Burke, L., 2005. Target product profile: Beginning drugdevelopment with the end in mind. Update. http://www.fdli.org.
Design-Expert1 Software, via http://www.statease.com/dx9.html.Dixit, R.P., Puthli, S.P., 2009. Oral strip technology: overview and future potential. J.
Control. Release 139, 94–107.El-Malah, Y., Nazzal, S., 2013. Real time disintegration analysis and D-optimal
experimental design for the optimization of diclofenac sodium fast-dissolvingfilms. Pharm. Dev. Technol. 18, 1355–1360.
ElMeshad, A.N., El Hagrasy, A.S., 2011. Characterization and optimization oforodispersible mosapride film formulations. AAPS Pharm. Sci. Tech. 12,1384–1392.
Eriksson, L., Johansson, E., Kettaneh-World, N., Wikström, C., Wold, S., 2008. Designof experiments, principles and applications. Umetrics, Umeå, Sweden Thirdrevised and enlarged ed..
European Pharmacopoeia, 8th edition, via http://online6.edqm.eu/ep802/.Hoffmann, E.M., Breitenbach, A., Breitkreutz, J., 2011. Advances in orodispersible
films for drug delivery. Expert Opin. Drug Deliv. 8, 299–316.
76 J.C. Visser et al. / International Journal of Pharmaceutics 485 (2015) 70–76
IHC Q8 International Conference of Harmonization, 2008. ICH Harmonized.Tripartite Guideline: Q8 (R1) Pharmaceutical Development via: http://www.ich.org/LOB/media/MEDIA4986.pdf.
Morales, J.O., McConville, J.T., 2011. Manufacture and characterization ofmucoadhesive buccal films. Eur. J. Pharm. Biopharm. 77, 187–199.
NEN-EN-ISO: Plastics-Determination of tensile properties – Part 1: Generalprinciples (ISO 527-1:2012).
Peh, K.K., Wong, C.F., 1999. Polymeric films as vehicle for buccal delivery: swelling,mechanical, and bioadhesive properties. J. Pharm. Pharm. Sci. 2, 53–61.
Preis, M., Wörtz, C., Kleinebudde, P., Breitkreutz, J., 2013. Characterization oforomucosal film preparations. Expert Opin. Drug Deliv. 10, 1303–1317.
Preis, M., Knop, K., Breitkreutz, J., 2014. Mechanical strength test for orodispersibleand buccal films. Int. J. Pharm. 461, 22–29.
Rathore, A.S., Winkle, H., 2009. Quality by design for biopharmaceuticals. Nat.Biotechnol 27, 26–34.
Visser, J.C., Woerdenbag, H.J., Crediet, S., Gerrits, E., Lesschen, M.A., Hinrichs, W.L.J.,Breitkreutz, J., Frijlink, H.W., 2015. Orodispersible films in individualizedpharmacotherapy: the development of a formulation for pharmacypreparations. Int. J. Pharm. 478, 155–163.
Yu, L.X., 2008. Pharmaceutical Quality by Design: Product and Process.Development, Understanding, and Control. Pharma. Res. 25, 781–791.
Related Documents