Quality Base Material Produced Using Full Depth Reclamation on Existing Asphalt Pavement Structure FHWA Report No. FHWA-HIF-12-015 (FHWA Contract No. DTFH61-06-R-00038) Task 4 Report: Development of FDR Mix Design Guide Submitted to Federal Highway Administration December, 2011

Welcome message from author
This document is posted to help you gain knowledge. Please leave a comment to let me know what you think about it! Share it to your friends and learn new things together.
Transcript
Quality Base Material Produced Using Full Depth Reclamation on Existing Asphalt Pavement Structure
FHWA Report No. FHWA-HIF-12-015
(FHWA Contract No. DTFH61-06-R-00038)
Task 4 Report: Development of FDR Mix Design Guide
Submitted to
Federal Highway Administration
December, 2011
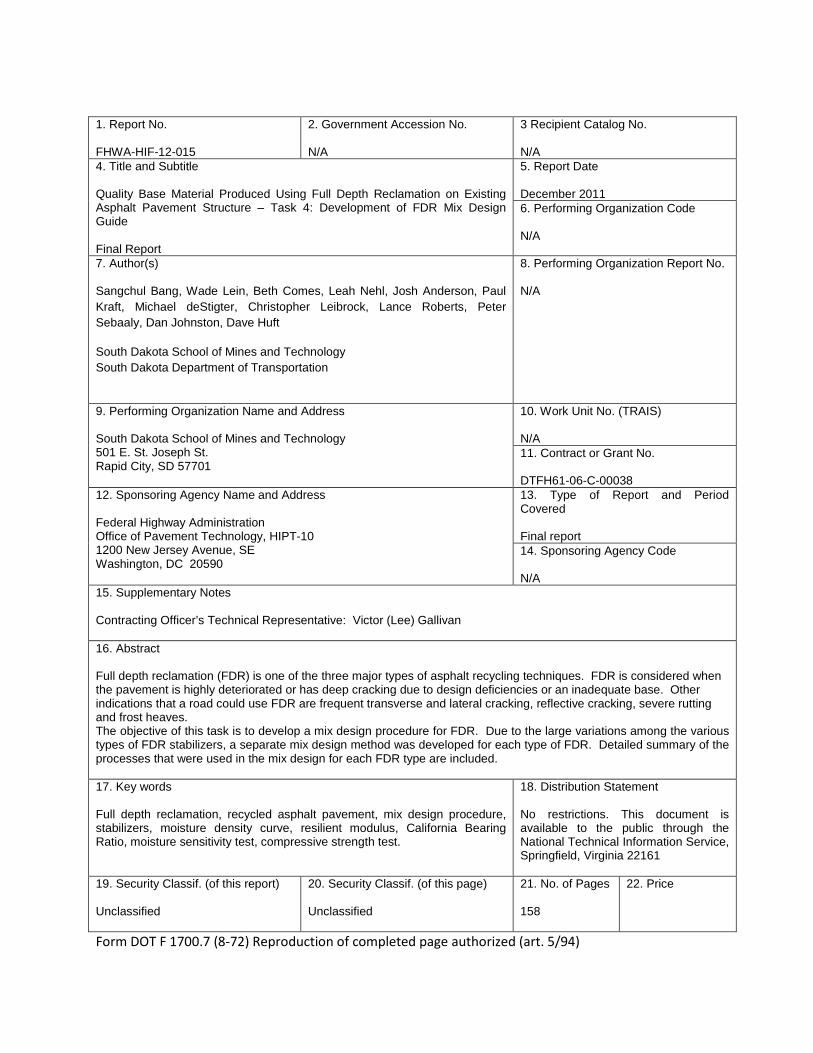
1. Report No. FHWA-HIF-12-015
2. Government Accession No. N/A
3 Recipient Catalog No. N/A
4. Title and Subtitle Quality Base Material Produced Using Full Depth Reclamation on Existing Asphalt Pavement Structure – Task 4: Development of FDR Mix Design Guide Final Report
5. Report Date December 2011 6. Performing Organization Code N/A
7. Author(s) Sangchul Bang, Wade Lein, Beth Comes, Leah Nehl, Josh Anderson, Paul Kraft, Michael deStigter, Christopher Leibrock, Lance Roberts, Peter Sebaaly, Dan Johnston, Dave Huft
South Dakota School of Mines and Technology South Dakota Department of Transportation
8. Performing Organization Report No. N/A
9. Performing Organization Name and Address South Dakota School of Mines and Technology 501 E. St. Joseph St. Rapid City, SD 57701
10. Work Unit No. (TRAIS) N/A 11. Contract or Grant No. DTFH61-06-C-00038
12. Sponsoring Agency Name and Address Federal Highway Administration Office of Pavement Technology, HIPT-10 1200 New Jersey Avenue, SE Washington, DC 20590
13. Type of Report and Period Covered Final report 14. Sponsoring Agency Code N/A
15. Supplementary Notes Contracting Officer’s Technical Representative: Victor (Lee) Gallivan 16. Abstract Full depth reclamation (FDR) is one of the three major types of asphalt recycling techniques. FDR is considered when the pavement is highly deteriorated or has deep cracking due to design deficiencies or an inadequate base. Other indications that a road could use FDR are frequent transverse and lateral cracking, reflective cracking, severe rutting and frost heaves. The objective of this task is to develop a mix design procedure for FDR. Due to the large variations among the various types of FDR stabilizers, a separate mix design method was developed for each type of FDR. Detailed summary of the processes that were used in the mix design for each FDR type are included. 17. Key words Full depth reclamation, recycled asphalt pavement, mix design procedure, stabilizers, moisture density curve, resilient modulus, California Bearing Ratio, moisture sensitivity test, compressive strength test.
18. Distribution Statement No restrictions. This document is available to the public through the National Technical Information Service, Springfield, Virginia 22161
19. Security Classif. (of this report) Unclassified
20. Security Classif. (of this page) Unclassified
21. No. of Pages 158
22. Price
Form DOT F 1700.7 (8-72) Reproduction of completed page authorized (art. 5/94)
ii
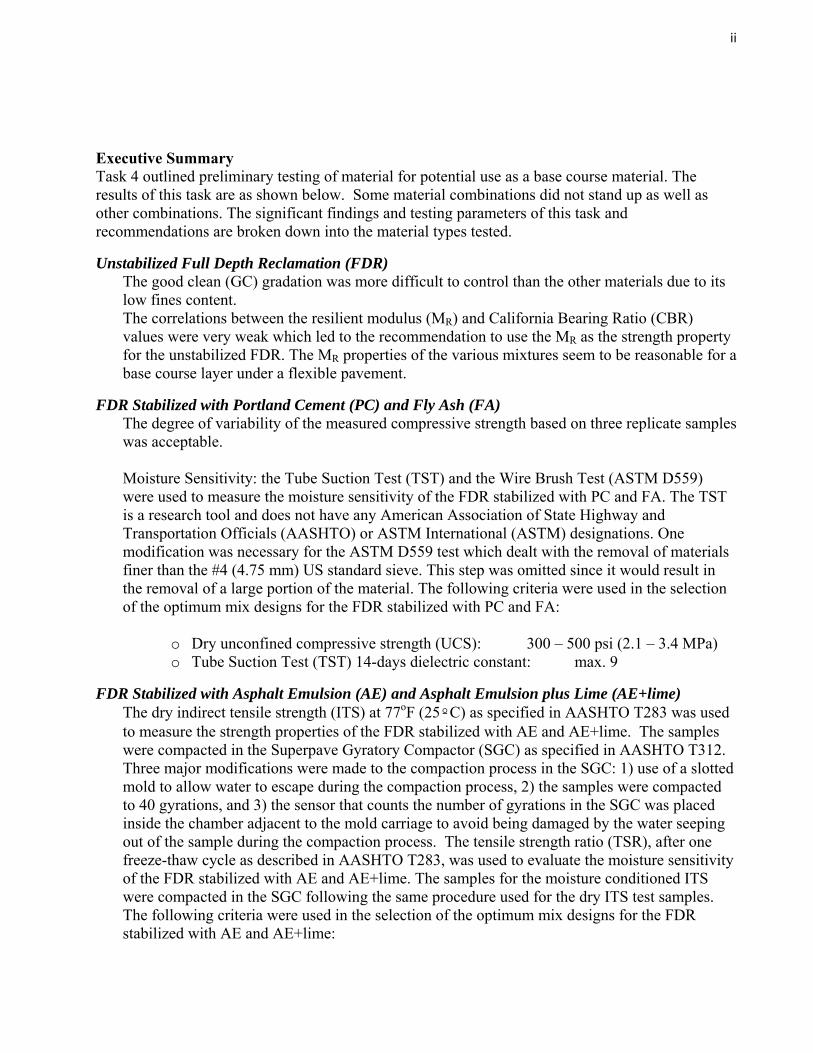
Executive Summary Task 4 outlined preliminary testing of material for potential use as a base course material. The results of this task are as shown below. Some material combinations did not stand up as well as other combinations. The significant findings and testing parameters of this task and recommendations are broken down into the material types tested.
Unstabilized Full Depth Reclamation (FDR) The good clean (GC) gradation was more difficult to control than the other materials due to its low fines content. The correlations between the resilient modulus (MR) and California Bearing Ratio (CBR) values were very weak which led to the recommendation to use the MR as the strength property for the unstabilized FDR. The MR properties of the various mixtures seem to be reasonable for a base course layer under a flexible pavement.
FDR Stabilized with Portland Cement (PC) and Fly Ash (FA) The degree of variability of the measured compressive strength based on three replicate samples was acceptable. Moisture Sensitivity: the Tube Suction Test (TST) and the Wire Brush Test (ASTM D559) were used to measure the moisture sensitivity of the FDR stabilized with PC and FA. The TST is a research tool and does not have any American Association of State Highway and Transportation Officials (AASHTO) or ASTM International (ASTM) designations. One modification was necessary for the ASTM D559 test which dealt with the removal of materials finer than the #4 (4.75 mm) US standard sieve. This step was omitted since it would result in the removal of a large portion of the material. The following criteria were used in the selection of the optimum mix designs for the FDR stabilized with PC and FA:
o Dry unconfined compressive strength (UCS): 300 – 500 psi (2.1 – 3.4 MPa) o Tube Suction Test (TST) 14-days dielectric constant: max. 9
FDR Stabilized with Asphalt Emulsion (AE) and Asphalt Emulsion plus Lime (AE+lime) The dry indirect tensile strength (ITS) at 77oF (25ºC) as specified in AASHTO T283 was used to measure the strength properties of the FDR stabilized with AE and AE+lime. The samples were compacted in the Superpave Gyratory Compactor (SGC) as specified in AASHTO T312. Three major modifications were made to the compaction process in the SGC: 1) use of a slotted mold to allow water to escape during the compaction process, 2) the samples were compacted to 40 gyrations, and 3) the sensor that counts the number of gyrations in the SGC was placed inside the chamber adjacent to the mold carriage to avoid being damaged by the water seeping out of the sample during the compaction process. The tensile strength ratio (TSR), after one freeze-thaw cycle as described in AASHTO T283, was used to evaluate the moisture sensitivity of the FDR stabilized with AE and AE+lime. The samples for the moisture conditioned ITS were compacted in the SGC following the same procedure used for the dry ITS test samples. The following criteria were used in the selection of the optimum mix designs for the FDR stabilized with AE and AE+lime:
iii
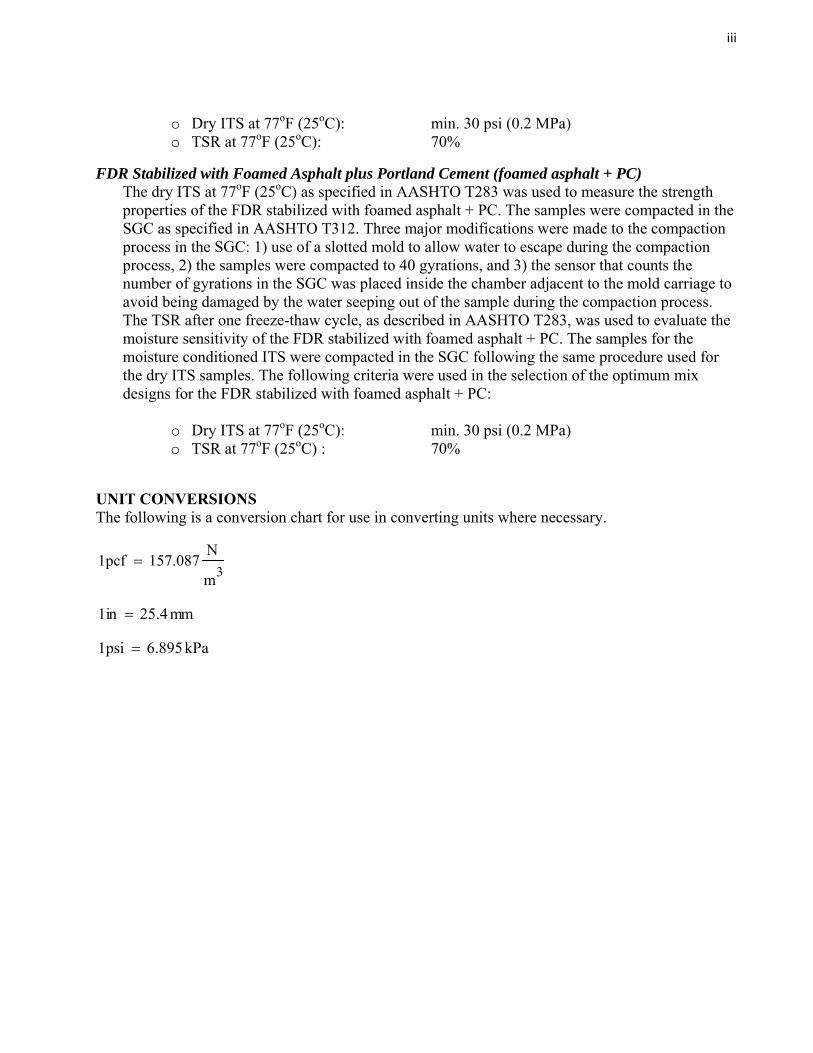
o Dry ITS at 77oF (25oC): min. 30 psi (0.2 MPa) o TSR at 77oF (25oC): 70%
FDR Stabilized with Foamed Asphalt plus Portland Cement (foamed asphalt + PC) The dry ITS at 77oF (25oC) as specified in AASHTO T283 was used to measure the strength properties of the FDR stabilized with foamed asphalt + PC. The samples were compacted in the SGC as specified in AASHTO T312. Three major modifications were made to the compaction process in the SGC: 1) use of a slotted mold to allow water to escape during the compaction process, 2) the samples were compacted to 40 gyrations, and 3) the sensor that counts the number of gyrations in the SGC was placed inside the chamber adjacent to the mold carriage to avoid being damaged by the water seeping out of the sample during the compaction process. The TSR after one freeze-thaw cycle, as described in AASHTO T283, was used to evaluate the moisture sensitivity of the FDR stabilized with foamed asphalt + PC. The samples for the moisture conditioned ITS were compacted in the SGC following the same procedure used for the dry ITS samples. The following criteria were used in the selection of the optimum mix designs for the FDR stabilized with foamed asphalt + PC:
o Dry ITS at 77oF (25oC): min. 30 psi (0.2 MPa) o TSR at 77oF (25oC) : 70%
UNIT CONVERSIONS The following is a conversion chart for use in converting units where necessary.
1pcf 157.087N
m3=
1in 25.4mm=
1psi 6.895kPa=
iv
Contents Executive Summary ...................................................................................................................................... ii
Unstabilized Full Depth Reclamation (FDR) ....................................................................................... ii
FDR Stabilized with Portland Cement (PC) and Fly Ash (FA) ............................................................ ii
FDR Stabilized with Asphalt Emulsion (AE) and Asphalt Emulsion plus Lime (AE+lime).................. ii
FDR Stabilized with Foamed Asphalt plus Portland Cement (foamed asphalt + PC) ........................ iii
UNIT CONVERSIONS ............................................................................................................................... iii
1. INTRODUCTION .................................................................................................................................... 9
1.1 Material Description ........................................................................................................................... 9
2. TEST METHODS ..................................................................................................................................... 4
2.1 Unstabilized FDR (Mechanically Stabilized) ..................................................................................... 4
2.1.1 Moisture -Density Curves (MDC) ............................................................................................... 4
2.1.2 Resilient Modulus (MR) ............................................................................................................... 4
2.1.3 California Bearing Ratio (CBR) ................................................................................................ 12
2.2 FDR Stabilized with Portland Cement (PC) and Fly Ash (FA) ........................................................ 12
2.2.1 Moisture -Density Curves (MDC) ............................................................................................. 12
2.2.2 Compressive Strength ................................................................................................................ 12
2.2.3 Moisture Sensitivity ................................................................................................................... 15
2.3 FDR Stabilized with Asphalt Emulsion (AE) and Asphalt Emulsion and Lime (AE+Lime) ........... 21
2.3.1 Moisture -Density Curves (MDC) ............................................................................................. 21
2.3.2 Superpave Gyratory Compactor (SGC) ..................................................................................... 21
2.3.3 Bulk and Maximum Density Using CoreLok ............................................................................ 25
2.3.4 Moisture Sensitivity ................................................................................................................... 27
2.4 FDR Stabilized with Foamed Asphalt and Portland Cement ............................................................ 28
2.4.1 Moisture -Density Curves (MDC) ............................................................................................. 31
2.4.2 Superpave Gyratory Compactor (SGC) ..................................................................................... 31
2.4.3 Bulk Density Using CoreLok ..................................................................................................... 31
2.4.4 Moisture Sensitivity ................................................................................................................... 31
3. RESULTS AND ANALYSIS ................................................................................................................. 32
v
3.1 Unstabilized FDR (Mechanically Stabilized) ................................................................................... 32
3.1.1 Moisture -Density Curves (MDC) ............................................................................................. 32
3.1.2 Resilient Modulus (MR) ............................................................................................................. 32
3.1.3 California Bearing Ratio (CBR) ................................................................................................ 35
3.2 FDR Stabilized with Portland Cement (PC) and Fly Ash (FA) ........................................................ 36
3.2.1 Moisture -Density Curves (MDC) ............................................................................................. 36
3.2.2 Compressive Strength ................................................................................................................ 36
3.2.3 Moisture Sensitivity ................................................................................................................... 39
3.3 FDR Stabilized with Asphalt Emulsion (AE) and, Asphalt Emulsion plus Lime (AE+Lime) and, Foamed Asphalt plus 1% Portland Cement (Foamed Asphalt+1%, and Foamed Asphalt plus 2% Portland Cement (Foamed Asphalt+2%PC) .......................................................................................................... 41
3.3.1 Moisture -Density Curves (MDC) ............................................................................................. 41
3.3.2 Indirect Tensile Strength (ITS) .................................................................................................. 41
3.3.3 Moisture Conditioning ............................................................................................................... 52
4. OPTIMUM DESIGNS ............................................................................................................................ 54
5. SUMMARY AND RECOMMENDATIONS ......................................................................................... 61
5.1 Unstabilized FDR .......................................................................................................................... 61
5.2 FDR Stabilized with PC and FA ................................................................................................... 61
5.3 FDR Stabilized with Asphalt Emulsion (AE) and Asphalt Emulsion plus Lime (AE+lime) ....... 62
5.4 FDR Stabilized with Foamed Asphalt plus Portland Cement (PC) .............................................. 63
6. REFERENCES ....................................................................................................................................... 64
7. ACKNOWLEDGEMENTS .................................................................................................................... 64
vi
LIST OF TABLES
Table 1: Testing matrix for task 4. ....................................................................................................... 3 Table 2: Optimum moisture content and maximum dry density for the various FDR mixtures. ........ 6 Table 3: Average stress values used to calculate resilient modulus values. ...................................... 33 Table 4: Resilient modulus results and constants. ............................................................................. 34 Table 5: CBR results and statistics. ................................................................................................... 35 Table 6: Unconfined compressive strength for PC -stabilized FDR. ................................................. 37 Table 7: Unconfined compressive strength for FA -stabilized FDR. ................................................ 38 Table 8: Tube suction results measured in dielectric constants for PC and FA stabilized FDR. ...... 40 Table 9: Average percent of weight loss from the Wire Brush Test. ................................................ 41 Table 10: Results of the ITS tests for the AE specimens. .................................................................. 42 Table 11: Results of the ITS tests for the AE+1%lime specimens. ................................................... 43 Table 12: Results of the ITS tests for the Foamed Asphalt+1%PC specimens. ................................ 44 Table 13: Results of the ITS tests for the Foamed Asphalt+2%PC specimens. ................................ 45 Table 14: AASHTO T283 results after one freeze-thaw cycle for AE and AE+1% Lime. ............... 52 Table 15: AASHTO T-283 freeze thaw results after one cycle for Foamed Asphalt+PC. ................ 52 Table 16: Optimum designs for PC -stabilized FDR. ........................................................................ 55 Table 17: Optimum designs for FA -stabilized FDR. ........................................................................ 56 Table 18: Optimum designs for AE and AE+1%Lime stabilized FDR. ............................................ 57 Table 19: Optimum designs for Foamed Asphalt+1%PC and Foamed Asphalt+2%PC stabilized
FDR. .................................................................................................................................. 58

vii
LIST OF FIGURES
Figure 1: Initial grain size distributions. .............................................................................................. 2 Figure 2: MDC for 0% RAP poor source clean gradation material. .................................................... 5 Figure 3: Preparing samples for compaction. ...................................................................................... 7 Figure 4: Compacting resilient modulus samples. ............................................................................... 7 Figure 5: Removing the sides of the mold. .......................................................................................... 8 Figure 6: Preparing to flip the specimen. ............................................................................................. 8 Figure 7: Placing the flipped specimen on the bottom platen. ............................................................. 9 Figure 8: Testing specimen before the membrane is placed over it. ................................................... 9 Figure 9: Placing the membrane on the sample. ................................................................................ 10 Figure 10: Placing the rubber o-rings on the platens. ........................................................................ 10 Figure 11: Adjusting the o-rings for testing. ...................................................................................... 11 Figure 12: Resilient modulus sample in the SPT being tested. .......................................................... 11 Figure 13: CBR sample in loading frame. ......................................................................................... 13 Figure 14: CBR with loading piston being lowered into test specimen. ........................................... 13 Figure 15: Loading of the unconfined compression samples. ........................................................... 14 Figure 16: Breaking of the unconfined compression samples. .......................................................... 14 Figure 17: Rainbow dielectric meter. ................................................................................................ 15 Figure 18: Moisture sensitivity samples. ........................................................................................... 16 Figure 19: Testing the samples with the dielectric sensor. ................................................................ 16 Figure 20: Molded and cured wire brush samples. ............................................................................ 18 Figure 21: Samples being wire brushed 4 times on the ends. ............................................................ 18 Figure 22: Samples being wire brushed 18 to 20 times on the sides. ................................................ 19 Figure 23: Samples being soaked between the wire brush cycles. .................................................... 20 Figure 24: Good Clean material with 50% RAP and 12% FA after 12 cycles. ................................. 20 Figure 25: Fisher Scientific Oven. ..................................................................................................... 22 Figure 26: Gyratory compactor with sample in the mold carriage. ................................................... 23 Figure 27: Slotted mold and sample placed in the SGC. ................................................................... 24 Figure 28: Sample being extruded. .................................................................................................... 25 Figure 29: Specimen in bag before testing. ....................................................................................... 26 Figure 30: Specimen in bag after testing. .......................................................................................... 27 Figure 31: Indirect tensile strength (ITS) testing setup. .................................................................... 28 Figure 32: Wirtgen asphalt binder foaming machine. ....................................................................... 29 Figure 33: Pugmill mixer. .................................................................................................................. 30 Figure 34: Asphalt binder foaming machine with pugmill mixer. ..................................................... 30 Figure 35: Unstabilized FDR material density chart. ........................................................................ 32 Figure 36: Unstabilized FDR material moisture content chart. ......................................................... 33 Figure 37: Average resilient modulus values versus RAP content for unstabilized FDR. ................ 34

viii
Figure 38: CBR values versus RAP content for unstabilized FDR. .................................................. 36 Figure 39: 3.0% AE dry material results. .......................................................................................... 46 Figure 40: 4.5% AE dry material results. .......................................................................................... 46 Figure 41: 6.0% AE dry material results. .......................................................................................... 47 Figure 42: 3.0% AE + 1% Lime material results. .............................................................................. 47 Figure 43: 4.5% AE + 1% Lime material results. .............................................................................. 48 Figure 44: 6.0% AE + 1% Lime material results. .............................................................................. 48 Figure 45: 2.5% Foamed Asphalt+1% PC material results. .............................................................. 49 Figure 46: 3.0% Foamed Asphalt+1% PC material results. .............................................................. 49 Figure 47: 3.5% Foamed Asphalt +1% PC material results. ............................................................. 50 Figure 48: 2.5% Foamed Asphalt +2% PC material results. ............................................................. 50 Figure 49: 3.0% Foamed Asphalt+2% PC material results. .............................................................. 51 Figure 50: 3.5% Foamed Asphalt +2% PC material results. ............................................................. 51 Figure 51: AASHTO T283 Freeze-thaw AE one cycle results. ......................................................... 53 Figure 52: AASHTO T283 Freeze-thaw Foamed Asphalt + PC one cycle results. .......................... 53 Figure 53: Good dirty AE and AE+1% Lime material results........................................................... 57 Figure 54: Poor dirty AE and AE+1% Lime material results. ........................................................... 58 Figure 55: Good clean Foamed Aasphalt+1%PC and +2%PC material results. ............................... 59 Figure 56: Good dirty Foamed Asaphalt+1%PC and +2%PC material results. ................................ 59 Figure 57: Poor clean Foamed Asphalt+1%PC and +2%PC material results. .................................. 60 Figure 58: Poor dirty Foamed Asphalt+1%PC and +2%PC material results. ................................... 60

ix
1. INTRODUCTION The overall objective of Task 4 is to evaluate and recommend the appropriate laboratory tests that can be used in a mix design for FDR. The types of FDR materials evaluated in Task 4 are: unstabilized, stabilized with Portland cement, stabilized with fly ash, stabilized with asphalt emulsion, and stabilized with foamed asphalt. In addition to the stabilization, all FDR materials included three levels of recycled asphalt pavements (RAP) at: 25, 50, and 75%.
The approach used to evaluate the appropriate laboratory test methods consisted of evaluating the standard methods that have been historically used to conduct designs of FDR materials and other methods that have been recently introduced to the pavement industry. In addition, the evaluated methods needed to be consistent with the two currently available flexible pavement design methods: the AASHTO 1993 Pavement Design Guide and the AASHTO Mechanistic-Empirical Pavement Design Guide (MEPDG). In other words, the methods selected for the mix design process of FDR needs to generate properties that can be directly used in the two pavement design methods.
As a first step, the various standard laboratory tests were identified for each of the five FDR types. In this context, the term standard means that the test method has an established AASHTO or ASTM standard procedure. Once the tests were identified, their applicability and repeatability were evaluated using four types of virgin aggregate: good clean, good dirty, poor clean, poor dirty. The applicability of the tests was evaluated in terms of their ability to produce results that are consistent with engineering principles of paving materials. The repeatability of the tests was evaluated in terms of their ability to generate reproducible results on multiple samples.
In cases where standard tests did not exist, new test methods were evaluated and modified as needed to be applicable for the design of FDR materials. An example of this situation is the use of the Superpave Gyratory Compactor (SGC) for the design of FDR stabilized with asphalt emulsion and FDR stabilized with foamed asphalt. FDR materials stabilized with asphalt emulsion or foamed asphalt are not as stable as hot mixed asphalt mixtures and usually contain free moisture. These unique conditions necessitate a few modifications to adopt the SGC to the design of FDR materials while keeping the same overall design concept.
In summary, the evaluated and recommended mix design methods for FDR materials were selected to generate engineering properties that can be directly incorporated into the two commonly used pavement design methods for flexible pavements. This report summarizes the data generated from the evaluations of the various laboratory tests and recommends any needed modifications of the test methods to make them applicable for the design of FDR materials. A concerted effort was made to recommend laboratory tests commonly used in the design of paving materials in order to eliminate the need of state highway agencies and the consulting industry to purchase new equipment which will require additional training of their personnel.
1.1 Material Description The experimental program included the testing matrix shown in Table 1 which involves five stabilization methods with four levels of Recycled Asphalt Pavement (RAP) material of 0, 25, 50,
2
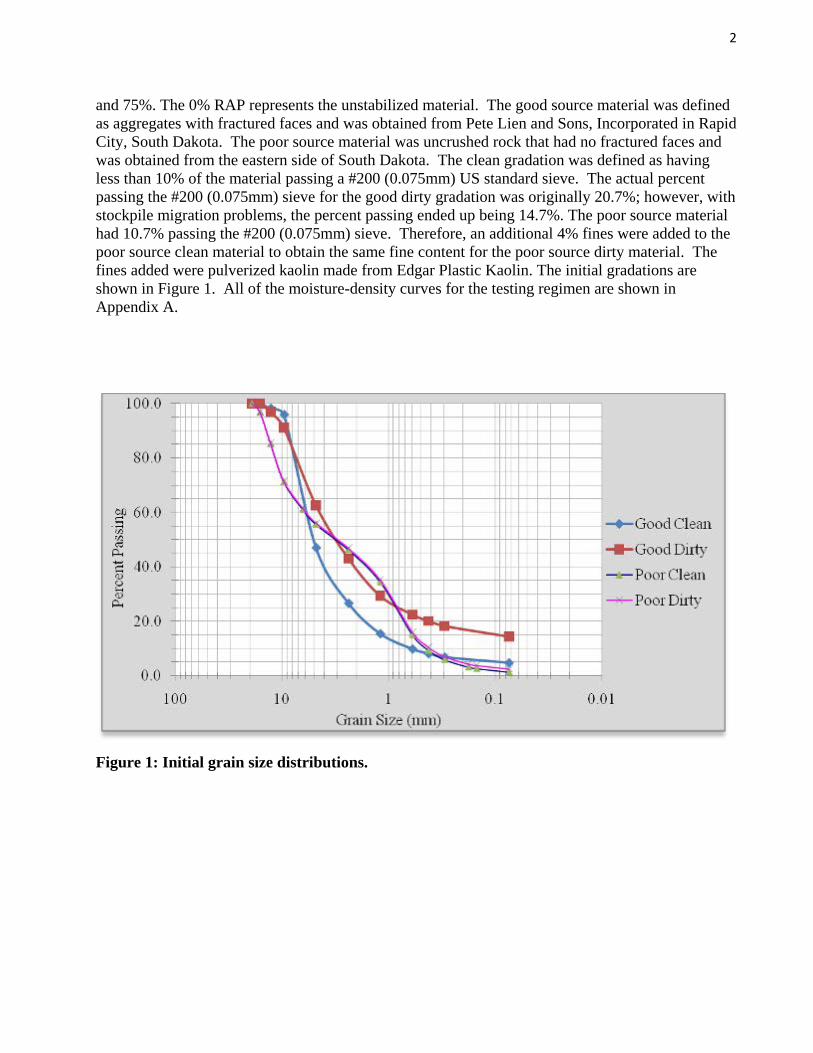
and 75%. The 0% RAP represents the unstabilized material. The good source material was defined as aggregates with fractured faces and was obtained from Pete Lien and Sons, Incorporated in Rapid City, South Dakota. The poor source material was uncrushed rock that had no fractured faces and was obtained from the eastern side of South Dakota. The clean gradation was defined as having less than 10% of the material passing a #200 (0.075mm) US standard sieve. The actual percent passing the #200 (0.075mm) sieve for the good dirty gradation was originally 20.7%; however, with stockpile migration problems, the percent passing ended up being 14.7%. The poor source material had 10.7% passing the #200 (0.075mm) sieve. Therefore, an additional 4% fines were added to the poor source clean material to obtain the same fine content for the poor source dirty material. The fines added were pulverized kaolin made from Edgar Plastic Kaolin. The initial gradations are shown in Figure 1. All of the moisture-density curves for the testing regimen are shown in Appendix A.
Figure 1: Initial grain size distributions.

3
Table 1: Testing matrix for task 4.
FDR Type FDR Source
Gradation Un-stabilized
Stabilized with PC (3, 5, 7%)
Stabilized with Fly Ash (10, 12, 15%)
Stabilized with Asphalt Emulsion (3, 4.5, 6%)
Stabilized with Asphalt Emulsion + 1% Lime (3, 4.5, 6%)
Stabilized with Foamed Asphalt + 1 or 2%PC (2.5, 3, 3.5%)
Poor
Dirty Moisture-density curve
Moisture-density curve
Moisture-density curve
Superpave Gyratory
Superpave Gyratory
Superpave Gyratory
MR and CBR
Compressive strength
Compressive strength
Moisture -density curve
Moisture -density curve
Moisture -density curve
Moisture sensitivity
Moisture sensitivity
Bulk density using CoreLok
Bulk density using CoreLok
Bulk density using CoreLok
Moisture sensitivity
Moisture sensitivity
Moisture sensitivity
Clean Moisture-density curve
Moisture-density curve
Moisture-density curve
Superpave Gyratory
Superpave Gyratory
Superpave Gyratory
MR and CBR
Compressive strength
Compressive strength
Moisture -density curve
Moisture -density curve
Moisture -density curve
Moisture sensitivity
Moisture sensitivity
Bulk density using CoreLok
Bulk density using CoreLok
Bulk density using CoreLok
Moisture sensitivity
Moisture sensitivity
Moisture sensitivity
Good
Dirty Moisture-density curve
Moisture-density curve
Moisture-density curve
Superpave Gyratory
Superpave Gyratory
Superpave Gyratory
MR and CBR
Compressive strength
Compressive strength
Moisture -density curve
Moisture -density curve
Moisture -density curve
Moisture sensitivity
Moisture sensitivity
Bulk density using CoreLok
Bulk density using CoreLok
Bulk density using CoreLok
Moisture sensitivity
Moisture sensitivity
Moisture sensitivity
Clean Moisture-density curve
Moisture-density curve
Moisture-density curve
Superpave Gyratory
Superpave Gyratory
Superpave Gyratory
MR and CBR
Compressive strength
Compressive strength
Moisture -density curve
Moisture -density curve
Moisture -density curve
Moisture sensitivity
Moisture sensitivity
Bulk density using CoreLok
Bulk density using CoreLok
Bulk density using CoreLok
Moisture sensitivity
Moisture sensitivity
Moisture sensitivity
4
2. TEST METHODS The test methods used follow as closely and practically as possible ASTM or AASHTO standards. The following sections describe the tests performed, the deviations from the standards and why these deviations were necessary.
2.1 Unstabilized FDR (Mechanically Stabilized) This includes materials stabilized using only mechanical compaction means. These tests were performed on 0, 25, 50, and 75% RAP mixtures with good clean, good dirty, poor clean, and poor dirty material.
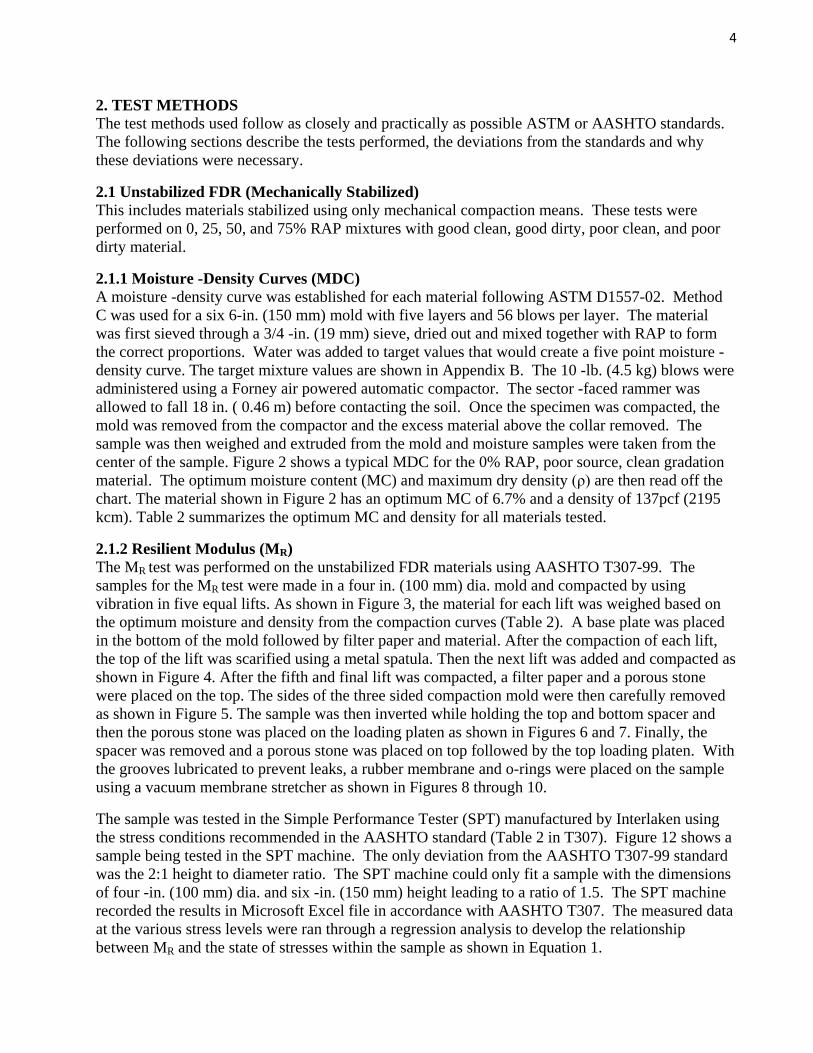
2.1.1 Moisture -Density Curves (MDC) A moisture -density curve was established for each material following ASTM D1557-02. Method C was used for a six 6-in. (150 mm) mold with five layers and 56 blows per layer. The material was first sieved through a 3/4 -in. (19 mm) sieve, dried out and mixed together with RAP to form the correct proportions. Water was added to target values that would create a five point moisture -density curve. The target mixture values are shown in Appendix B. The 10 -lb. (4.5 kg) blows were administered using a Forney air powered automatic compactor. The sector -faced rammer was allowed to fall 18 in. ( 0.46 m) before contacting the soil. Once the specimen was compacted, the mold was removed from the compactor and the excess material above the collar removed. The sample was then weighed and extruded from the mold and moisture samples were taken from the center of the sample. Figure 2 shows a typical MDC for the 0% RAP, poor source, clean gradation material. The optimum moisture content (MC) and maximum dry density (ρ) are then read off the chart. The material shown in Figure 2 has an optimum MC of 6.7% and a density of 137pcf (2195 kcm). Table 2 summarizes the optimum MC and density for all materials tested.
2.1.2 Resilient Modulus (MR) The MR test was performed on the unstabilized FDR materials using AASHTO T307-99. The samples for the MR test were made in a four in. (100 mm) dia. mold and compacted by using vibration in five equal lifts. As shown in Figure 3, the material for each lift was weighed based on the optimum moisture and density from the compaction curves (Table 2). A base plate was placed in the bottom of the mold followed by filter paper and material. After the compaction of each lift, the top of the lift was scarified using a metal spatula. Then the next lift was added and compacted as shown in Figure 4. After the fifth and final lift was compacted, a filter paper and a porous stone were placed on the top. The sides of the three sided compaction mold were then carefully removed as shown in Figure 5. The sample was then inverted while holding the top and bottom spacer and then the porous stone was placed on the loading platen as shown in Figures 6 and 7. Finally, the spacer was removed and a porous stone was placed on top followed by the top loading platen. With the grooves lubricated to prevent leaks, a rubber membrane and o-rings were placed on the sample using a vacuum membrane stretcher as shown in Figures 8 through 10.
The sample was tested in the Simple Performance Tester (SPT) manufactured by Interlaken using the stress conditions recommended in the AASHTO standard (Table 2 in T307). Figure 12 shows a sample being tested in the SPT machine. The only deviation from the AASHTO T307-99 standard was the 2:1 height to diameter ratio. The SPT machine could only fit a sample with the dimensions of four -in. (100 mm) dia. and six -in. (150 mm) height leading to a ratio of 1.5. The SPT machine recorded the results in Microsoft Excel file in accordance with AASHTO T307. The measured data at the various stress levels were ran through a regression analysis to develop the relationship between MR and the state of stresses within the sample as shown in Equation 1.
5
32
11
k
a
oct
k
aaR p
τpθpkM
+×
××= (1)
Where, MR = resilient modulus at optimum MC, k1, k2, k3 = regression parameters, pa = atmospheric (normalizing) pressure,
=++= 321 σσσθ bulk stress, and
( ) ( ) ( )2322
312
2131 σσσσσστ −+−+−=oct = octahedral shear stress.
Figure 2: MDC for 0% RAP poor source clean gradation material.
6
Table 2: Optimum moisture content and maximum dry density for the various FDR mixtures.
GOOD SOURCE - CLEAN GRADATION
% of RAP
Unstabilized
Stabilized Cement Fly Ash 3% 5% 7% 10% 12% 15%
75% MC (%) = 9.30 10.25 8.25 9.00 7.28 7.25 6.67 ρ (lb/ft^3) = 120.20 120.90 122.25 124.80 128.00 127.20 129.00
50% MC (%) = 7.70 9.20 8.60 8.75 7.50 7.50 7.52 ρ (lb/ft^3) = 118.90 125.00 125.50 128.00 129.00 130.00 130.30
25% MC (%) = 9.00 9.75 10.30 9.20 7.20 7.30 6.60 ρ (lb/ft^3) = 128.00 128.00 127.50 129.50 131.40 133.00 132.80
0% MC (%) = 8.25 ρ (lb/ft^3) = 132.50
GOOD SOURCE - DIRTY GRADATION
% of RAP
Unstabilized
Stabilized Cement Fly Ash 3% 5% 7% 10% 12% 15%
75% MC (%) = 9.80 8.85 9.20 8.60 7.60 7.35 6.80 ρ (lb/ft^3) = 119.75 122.80 121.80 125.50 128.50 126.30 128.50
50% MC (%) = 7.90 8.60 8.60 7.90 7.10 7.30 6.80 ρ (lb/ft^3) = 128.00 128.00 128.00 130.60 128.00 129.50 128.90
25% MC (%) = 8.10 7.70 7.60 7.80 7.60 7.20 7.10 ρ (lb/ft^3) = 132.50 134.50 133.60 133.10 129.90 130.20 130.00
0% MC (%) = 7.25 ρ (lb/ft^3) = 135.30
POOR SOURCE - CLEAN GRADATION
% of RAP
Unstabilized
Stabilized Cement Fly Ash 3% 5% 7% 10% 12% 15%
75% MC (%) = 9.49 6.85 7.04 6.25 8.06 6.58 8.11 ρ (lb/ft^3) = 116.63 131.11 130.00 130.40 123.52 124.53 123.82
50% MC (%) = 7.72 7.76 5.12 6.05 6.65 7.08 7.89 ρ (lb/ft^3) = 126.06 129.04 134.26 136.31 127.09 125.04 127.29
25% MC (%) = 7.40 6.04 5.26 4.99 5.92 5.22 6.47 ρ (lb/ft^3) = 131.02 138.38 136.41 140.56 127.08 122.93 131.23
0% MC (%) = 6.70 ρ (lb/ft^3) = 137.00
POOR SOURCE - DIRTY GRADATION
% of RAP
Unstabilized
Stabilized Cement Fly Ash 3% 5% 7% 10% 12% 15%
75% MC (%) = 7.40 7.75 7.30 7.20 7.35 6.25 6.50 ρ (lb/ft^3) = 127.00 128.50 128.70 131.50 127.10 131.20 132.60
50% MC (%) = 7.00 5.80 6.30 7.00 7.25 5.80 4.50 ρ (lb/ft^3) = 131.00 135.50 134.00 132.90 129.00 134.80 136.80
25% MC (%) = 7.25 5.50 6.10 6.50 6.50 5.20 5.15 ρ (lb/ft^3) = 133.50 137.00 134.50 135.30 134.60 137.00 135.80
7
Figure 3: Preparing samples for compaction.
Figure 4: Compacting resilient modulus samples.

8
Figure 5: Removing the sides of the mold.
Figure 6: Preparing to flip the specimen.
9
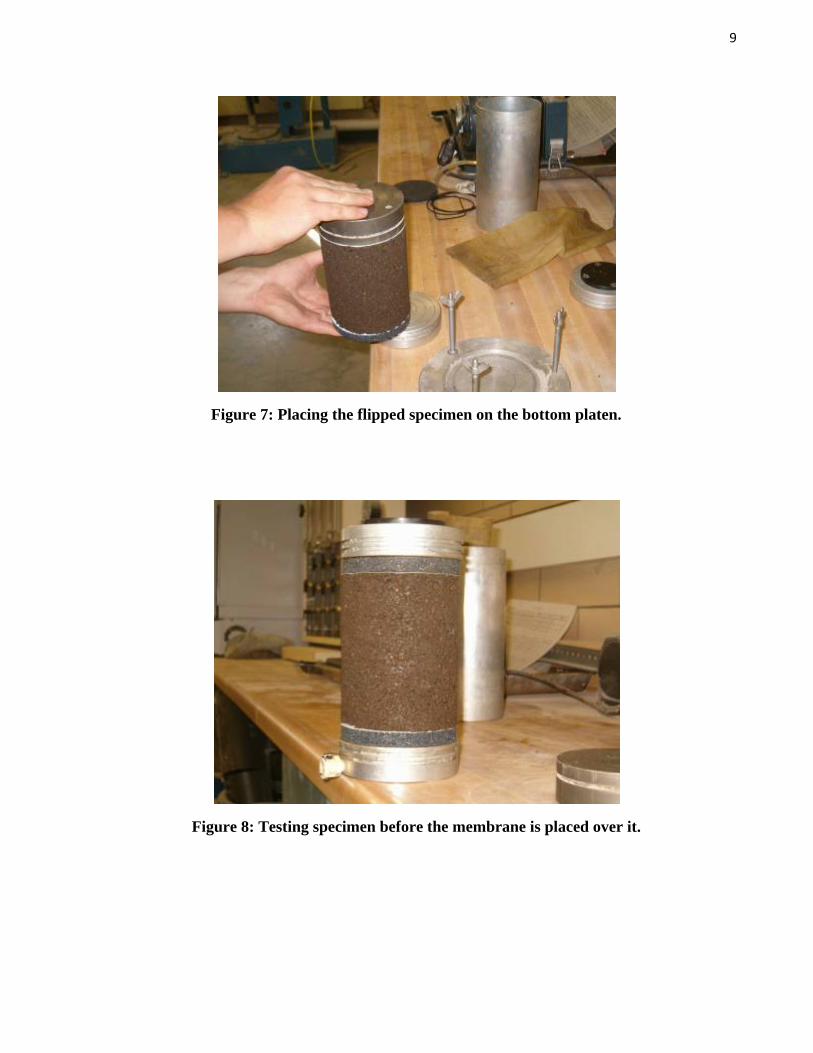
Figure 7: Placing the flipped specimen on the bottom platen.
Figure 8: Testing specimen before the membrane is placed over it.

10
Figure 9: Placing the membrane on the sample.
Figure 10: Placing the rubber o-rings on the platens.

11
Figure 11: Adjusting the o-rings for testing.
Figure 12: Resilient modulus sample in the SPT being tested.

12
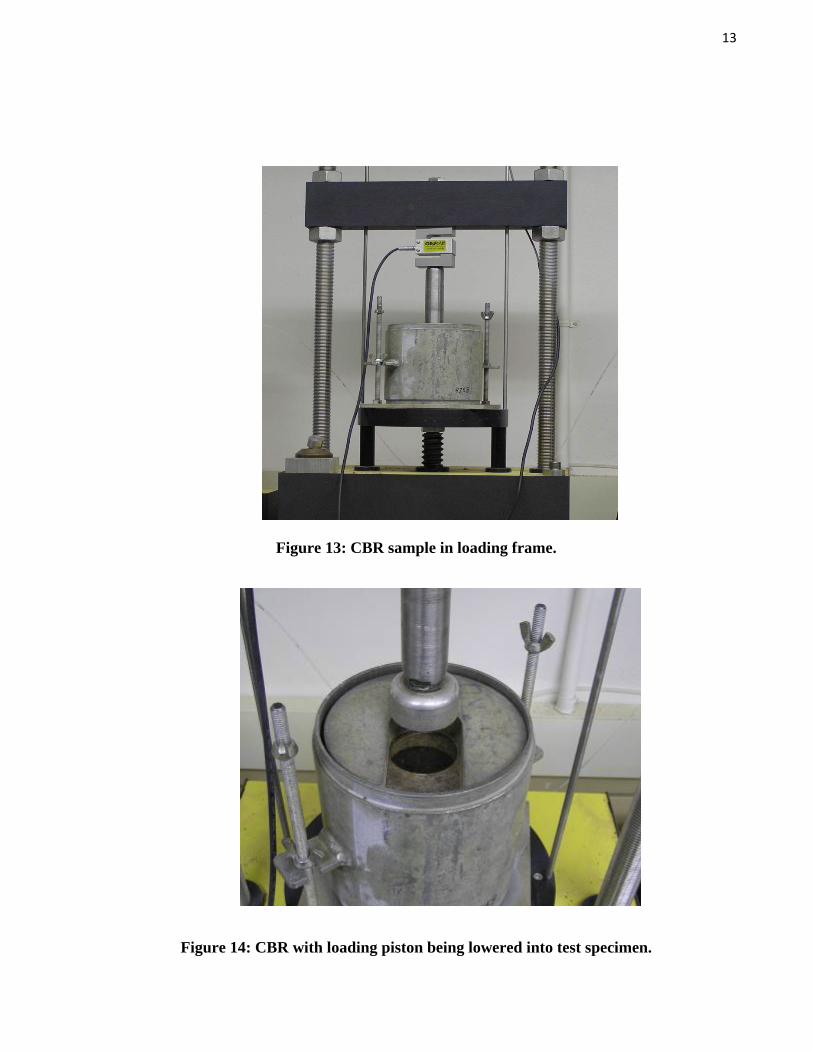
2.1.3 California Bearing Ratio (CBR) The California Bearing Ratio (CBR) test was conducted following ASTM D1883-05. The material was first sieved and dried. A six -in. (150 mm) dia. mold was used to compact the samples at the optimum moisture-dry density condition shown in Table 2. The same compaction method used for the MR samples was also used for the CBR samples. Soaked CBR samples were not produced for this task, as they were not representative of field conditions. Ten -pound (4.5 kg) surcharge weights were added to the top of the sample and a 1.954 in2 (1261 mm2) penetration piston was lowered into the sample through the holes in the weights at a rate of approximately 0.05 in (1.3 mm)/min. Two replicates were tested for each material type and the results were averaged. The CBR samples were tested in a GeoTac Sigma-1 automated load test frame. Measurements from the CBR tests were recorded digitally and stored automatically to data files. Figures 13 and 14 show the load frame and setup of the CBR testing.
2.2 FDR Stabilized with Portland Cement (PC) and Fly Ash (FA) The samples stabilized with PC were tested at three different levels of cement at 3, 5, and 7% by weight of dry aggregate. All evaluations were performed on 0, 25, 50, and 75% RAP mixtures with good clean, good dirty, poor clean, and poor dirty material.
The samples stabilized with FA were tested at three different levels of FA at 10, 12, and 15% by weight of dry aggregate. All evaluations were performed on 0, 25, 50, and 75% RAP mixtures with good clean, good dirty, poor clean, and poor dirty material. The same tests were used to evaluate the FDR materials stabilized with PC and FA.
2.2.1 Moisture -Density Curves (MDC) The moisture -density curves were obtained using the same process as the unstabilized material (Table 2).
2.2.2 Unconfined Compressive Strength The unconfined compressive strength (UCS) cylinders were made following ASTM D1633-00 for the PC -stabilized FDR and ASTM C593-95 for the FA -stabilized FDR. The PC -stabilized samples were made following Method A of the specification. The material was mixed to the correct percentages and moisture contentMC as determined by the compaction curves (Table 2). The samples were placed in a four -in. (100 mm) dia. mold and compacted using the Forney compactor in five layers using 25 blows per layer. The samples were kept in the molds overnight and placed in a moisture curing room. The samples were removed from the molds the next day and placed in the moist curing room for six more days for a total of seven days. Following the seven day moist curing, the samples were placed in water for four hours and then broken in the GeoTacan InstroTek, Incorporated loading frame. The load was applied at a rate of approximately 0.05in. (1.3mm)/min. Figures 15 and 16 show the loading and failure mode of the tested cylinders.
13
Figure 13: CBR sample in loading frame.
Figure 14: CBR with loading piston being lowered into test specimen.

14
Figure 15: Loading of the unconfined compression samples.
Figure 16: Breaking of the unconfined compression samples.
15
2.2.3 Moisture Sensitivity The moisture sensitivity of the PC -stabilized and FA -stabilized FDR were evaluated using both the TST and the Wire Brush Tests.
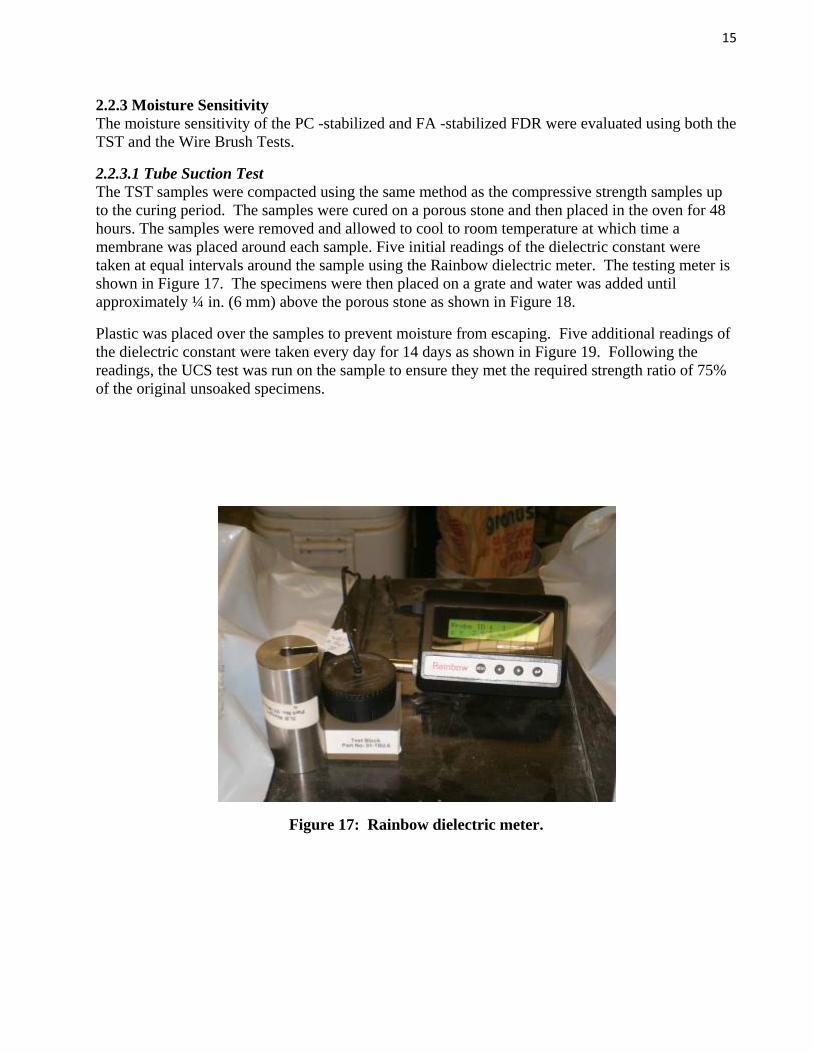
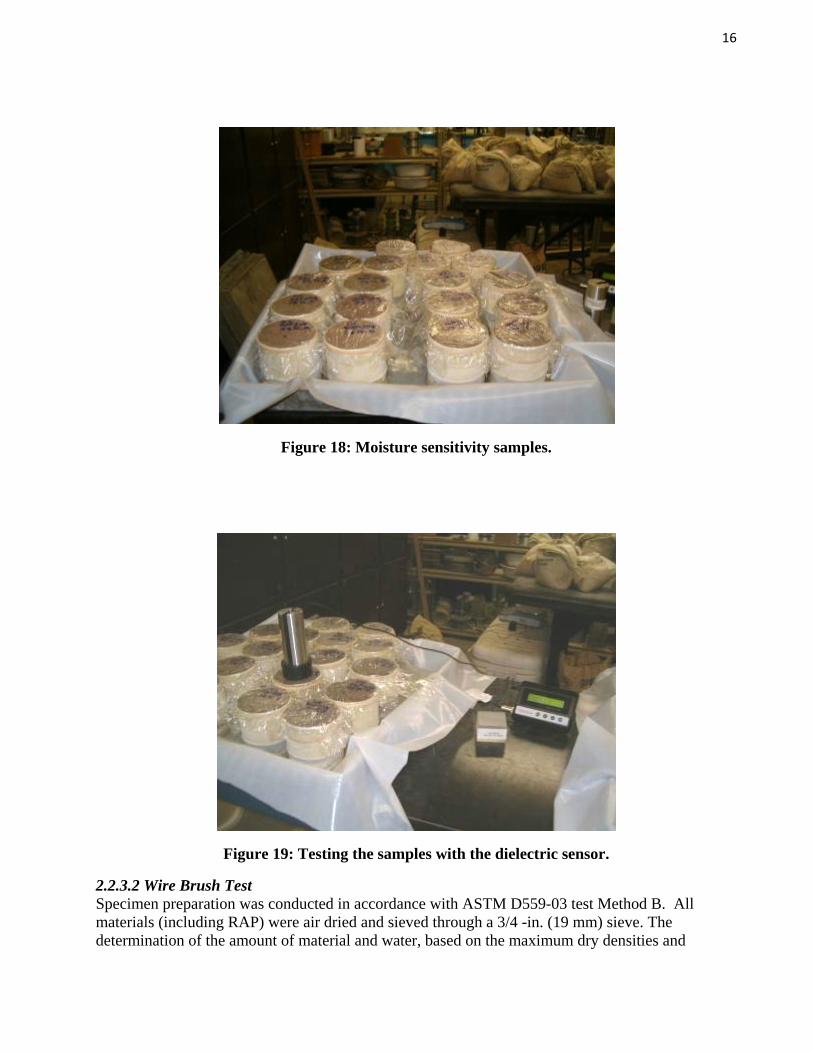
2.2.3.1 Tube Suction Test The TST samples were compacted using the same method as the compressive strength samples up to the curing period. The samples were cured on a porous stone and then placed in the oven for 48 hours. The samples were removed and allowed to cool to room temperature at which time a membrane was placed around each sample. Five initial readings of the dielectric constant were taken at equal intervals around the sample using the Rainbow dielectric meter. The testing meter is shown in Figure 17. The specimens were then placed on a grate and water was added until approximately ¼ in. (6 mm) above the porous stone as shown in Figure 18.
Plastic was placed over the samples to prevent moisture from escaping. Five additional readings of the dielectric constant were taken every day for 14 days as shown in Figure 19. Following the readings, the UCS test was run on the sample to ensure they met the required strength ratio of 75% of the original unsoaked specimens.
Figure 17: Rainbow dielectric meter.
16
Figure 18: Moisture sensitivity samples.
Figure 19: Testing the samples with the dielectric sensor.
2.2.3.2 Wire Brush Test Specimen preparation was conducted in accordance with ASTM D559-03 test Method B. All materials (including RAP) were air dried and sieved through a 3/4 -in. (19 mm) sieve. The determination of the amount of material and water, based on the maximum dry densities and

17
optimum MC from Table 2, were placed into a mixer. PC was added at three different percentages of 3, 5, and 7%. FA was added at three different percentages of 10, 12, and 15%. ASTM D559 test Method B requires the use of a # 4 (4.75 mm) sieve to remove soil particles finer than 0.19 in. (4.75 mm). This step was not used because too much of the material would have been discarded. Six samples of each material mix were made.
The compaction method followed the modified Proctor test method used to make the MDC samples. A four -in. (100 mm) dia. Proctor mold was weighed and had the inside coated with lubricant. The specimen was compacted with 25 blows per layer in five equal layers by weight. The Proctor hammer weighed ten pounds (4.5 kg) and dropped 18 in. (0.46 m). The Proctor mold extension was removed after compaction and the surface was leveled with a straight edge by shearing the protruding soil. Then, the sample was weighed and recorded together as the mold and compacted specimen weight. All produced specimens were then placed in a cure room for seven days; the mold however, may be removed from the specimen after one day. After the molded samples were placed in a curing room for seven days they were weighed and dimensions measured.
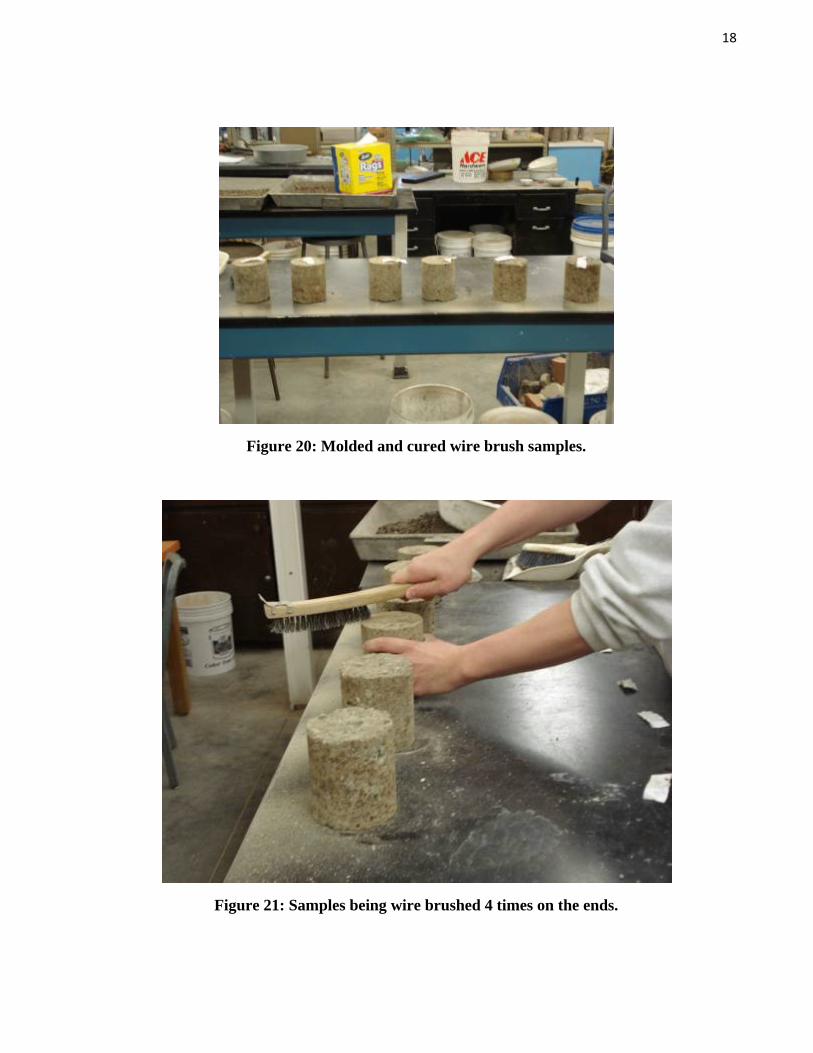
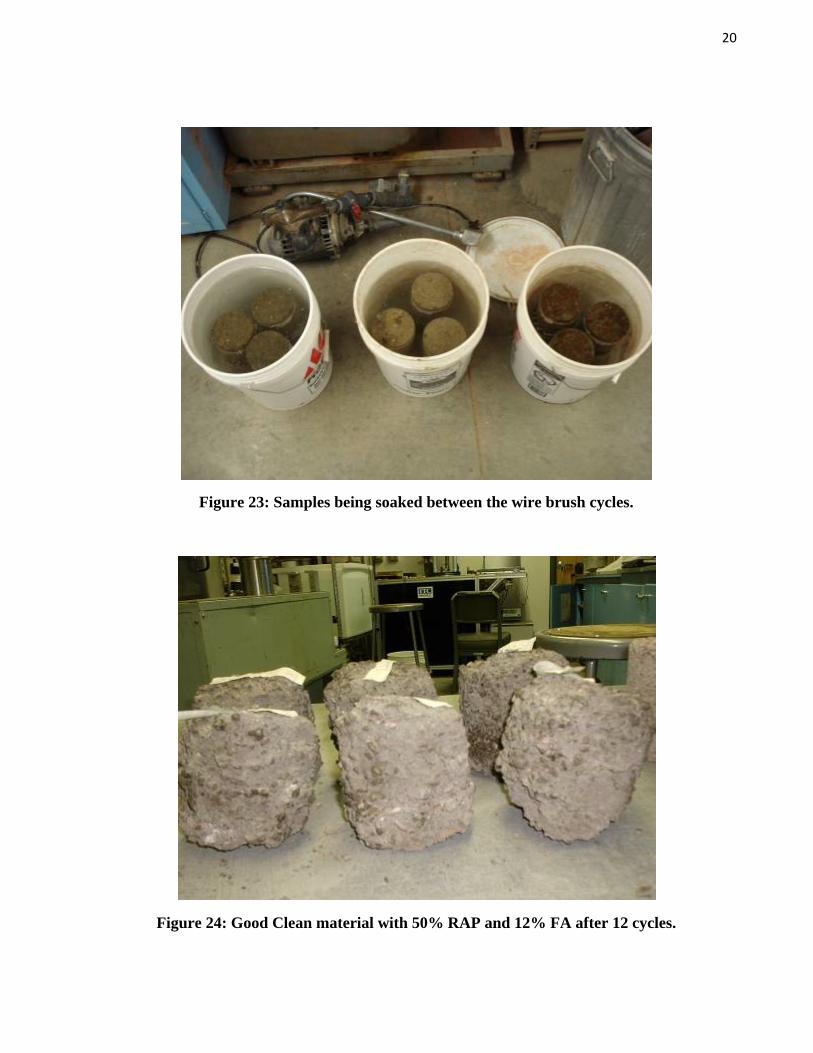
The moisture conditioning test continued in accordance with ASTM D559 procedure 7.3. After removal from the curing room, the specimen’s weight, diameter, and height were measured with a scale and caliper. Cycle one began with the specimen being submerged in water for five hours with a deviation of ± 15 minutes. Afterward, the samples were removed from the water and allowed to reach a saturated surface dry state. The specimen’s weight, diameter, and height were again recorded. The specimens were then placed in an oven at 160°F (71°C) for 42 hours. The samples were then removed from the oven and allowed to cool until they could be handled. The specimen’s weight, height, and diameter were recorded. Figure 20 shows samples that were molded and ready to be wire brushed. The specimen was then brushed 20 times on the side and four times on each end (Figures 21 and 22), after which the final specimens were weighed, ending cycle one. Figure 23 shows the samples being submerged in water for five hours. The test procedure was then repeated with 11 more cycles for a total of 12 cycles. Figure 24 shows a set of samples following the 12 cycle testing procedure.
18
Figure 20: Molded and cured wire brush samples.
Figure 21: Samples being wire brushed 4 times on the ends.

19
Figure 22: Samples being wire brushed 18 to 20 times on the sides.
20
Figure 23: Samples being soaked between the wire brush cycles.
Figure 24: Good Clean material with 50% RAP and 12% FA after 12 cycles.
21
2.3 FDR Stabilized with Asphalt Emulsion (AE) and Asphalt Emulsion and Lime (AE+Lime) The samples stabilized with AE were tested at three different levels of emulsion of 3, 4.5, and 6% by weight. The AE+Lime materials were made by the addition of 1% lime to the AE mixtures. All evaluations were performed on 0, 25, 50, and 75% RAP mixtures with good clean, good dirty, poor clean, and poor dirty material.
2.3.1 Moisture -Density Curves (MDC) The MDC for this material was used from the unstabilized material. These values were used because of the small amount of emulsion used and the non-absorptive nature of the aggregate. It was assumed that this would not change the values of the optimum MC or the maximum dry density enough to make a significant difference in the results.
2.3.2 Superpave Gyratory Compactor (SGC) The amount of FDR source material and the percentage of RAP being tested were weighed into the mixing bowl and mixed for 60 seconds. If lime and/or fines were required, they were weighed and added to the mixing bowl, then mixed for an additional 60 seconds. The amount of water was calculated based on the optimum moisture percentage, added to the mixing bowl and mixed for an additional 60 seconds. After all of these steps were completed, the mixing bowl was placed back onto the scale and the percentage of emulsion was added. Three different percentages of AE were tested: 3%, 4.5%, and 6% by weight. Before the emulsion was added to the mixture, the emulsion containers were mixed by shaking the container vigorously for several minutes. If needed, the emulsion was stirred until its consistency was the same throughout the container. The contents of the mixing bowl were then mixed for another 60 seconds. The amount of material required for each sample was calculated using the optimum MC and maximum dry density as well as the approximate dimensions of the sample that were to be achieved. The material was placed into a plastic container having a diameter of approximately six in. (150 mm) and a height of about 12 in. (300 mm). The three samples were placed into the oven set to 104°F (40°C) for 30 minutes. The oven used for this procedure was a Fisher Scientific Isotemp Premium 700 Series Oven, Forced Air Model 750F, as shown in Figure 25.
The appropriate amount of material was placed into a slotted mold to allow water to escape during compaction as shown in Figure 26. Both the top and bottom plates were lubricated with WD-40 before placing filter paper disks. The flange of the mold was also lubricated with a rag moistened with WD-40. The mold was placed into the SGC (Figure 27) and subjected to 40 gyrations at an angle of gyration of 1.26o. After the 40 gyrations, the mold was removed from the chamber, placed over the specimen extruder and the sample was removed from the mold. An example of a specimen being extruded can be seen in Figure 28. The specimen was placed into the oven for 72 hours at 104°F (40°C). The SGC used for compaction was model number AFGC125X, Pine Instrument Company, Grove City, Pennsylvania.
22
Figure 25: Fisher Scientific Oven.

23
Figure 26: Gyratory compactor with sample in the mold carriage.

24
Figure 27: Slotted mold and sample placed in the SGC.

25
Figure 28: Sample being extruded.
A few problems did arise while using the SGC to compact specimens of FDR stabilized with AE. The biggest issue was the excess liquid being forced out of the samples during compaction. This water would escape out of the slotted mold and leak down inside the SGC, causing one of the sensors to malfunction. This sensor counts the number of gyrations and is located in the compartment below the mold carriage. To fix this problem, the machine was altered with the sensor being moved inside the chamber adjacent to the mold carriage. This alteration eliminated most of the problems. Another problem that took place was the lower chambers of the compactor needed to be cleaned after each day of use. This was due to the build-up from the liquid on the mechanical parts (such as the chain) of the compactor.
2.3.3 Bulk and Maximum Density Using CoreLok The bulk specific gravity of the compacted samples was determined using an InstroTek, Inc. CoreLok machine. The procedure for this test was obtained from the CoreLok Operator’s Guide. The first step was to check the bag for holes or damage, and with none, weigh the bag on the scale with the cushioned weighing basket attached to the scale in the water tank. The dry sample was also weighed before sealing. The sample was placed inside the bag and then placed inside the CoreLok machine on top of the sliding plate (with rubber strips up to reduce the friction to the bag) in the chamber with approximately one in.(25 mm) of the open end of the bag resting on the sealing bar. The vacuum was set to 99% on the CoreLok machine. Once the sample was positioned, the lid was closed for 2 – 3 seconds until the vacuum started as shown in Figure 29. After the cycle had run through and the lid automatically opened, the sample was removed and the bag was gently pulled on to make sure the bag was tightly conformed to the sample as demonstrated in Figure 30.

26
The sample was submerged into the water tank and gently placed on the cushioned weighing basket being sure any air bubbles were removed from the folded areas. The scale was allowed to stabilize and the weight was recorded. The sample was removed from the water tank and the bag was cut open without getting water on the sample. The sample was again weighed and the weight recorded which had to be within ± 0.18 oz. (5.0 gm) of the original weight of the dry sample. If it was not within the allowance, the test was repeated after the sample had dried. The calculations were performed as indicated on the data collection table. An example of this can be found on the data CD.
The maximum specific gravity of the loose mix was also determined with the CoreLok machine using the procedures from the CoreLok Operator’s Guide. The machine was set to a dwell time of 300 seconds and all three filler plates were placed inside the chamber. The total weight of one large bag and one channel bag was recorded, including the weight of the dry sample of up to 70.55 oz. (2,000 grams). The sample was placed inside the channel bag and the channel bag with sample were placed inside a large bag with the channel side face down. The large bag was placed inside the chamber and the sample was spread evenly within the internal channel bag. The external bag opening was placed over the seal, making sure the internal bag was not over the seal. The lid was closed and the machine ran its cycle with the door opening automatically. The sample was placed inside the water tank and, while the bag was completely submerged (at least two in. (50 mm) under water), the bag was cut under the seal joint leaving about one in.(25 mm) intact. Both bags were opened while under water for 15 seconds, allowing the water to enter the bags and wet the sample. The bags were folded over, placed on the weighing basket, and opened back up to freely let water enter the bags. Once the scale had stabilized, the weight was recorded and the calculations were performed according to the data collection table as shown on the data CD.
Figure 29: Specimen in bag before testing.
27
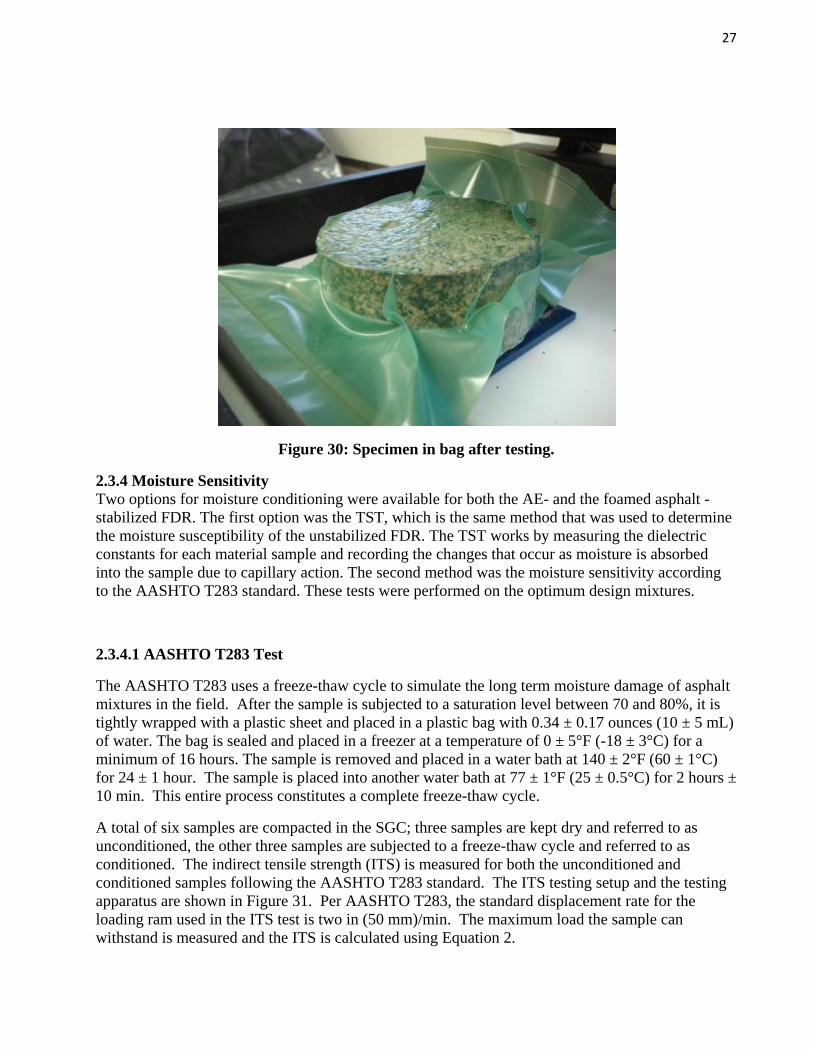
Figure 30: Specimen in bag after testing.
2.3.4 Moisture Sensitivity Two options for moisture conditioning were available for both the AE- and the foamed asphalt -stabilized FDR. The first option was the TST, which is the same method that was used to determine the moisture susceptibility of the unstabilized FDR. The TST works by measuring the dielectric constants for each material sample and recording the changes that occur as moisture is absorbed into the sample due to capillary action. The second method was the moisture sensitivity according to the AASHTO T283 standard. These tests were performed on the optimum design mixtures.
2.3.4.1 AASHTO T283 Test
The AASHTO T283 uses a freeze-thaw cycle to simulate the long term moisture damage of asphalt mixtures in the field. After the sample is subjected to a saturation level between 70 and 80%, it is tightly wrapped with a plastic sheet and placed in a plastic bag with 0.34 ± 0.17 ounces (10 ± 5 mL) of water. The bag is sealed and placed in a freezer at a temperature of 0 ± 5°F (-18 ± 3°C) for a minimum of 16 hours. The sample is removed and placed in a water bath at 140 ± 2°F (60 ± 1°C) for 24 ± 1 hour. The sample is placed into another water bath at 77 ± 1°F (25 ± 0.5°C) for 2 hours ± 10 min. This entire process constitutes a complete freeze-thaw cycle.
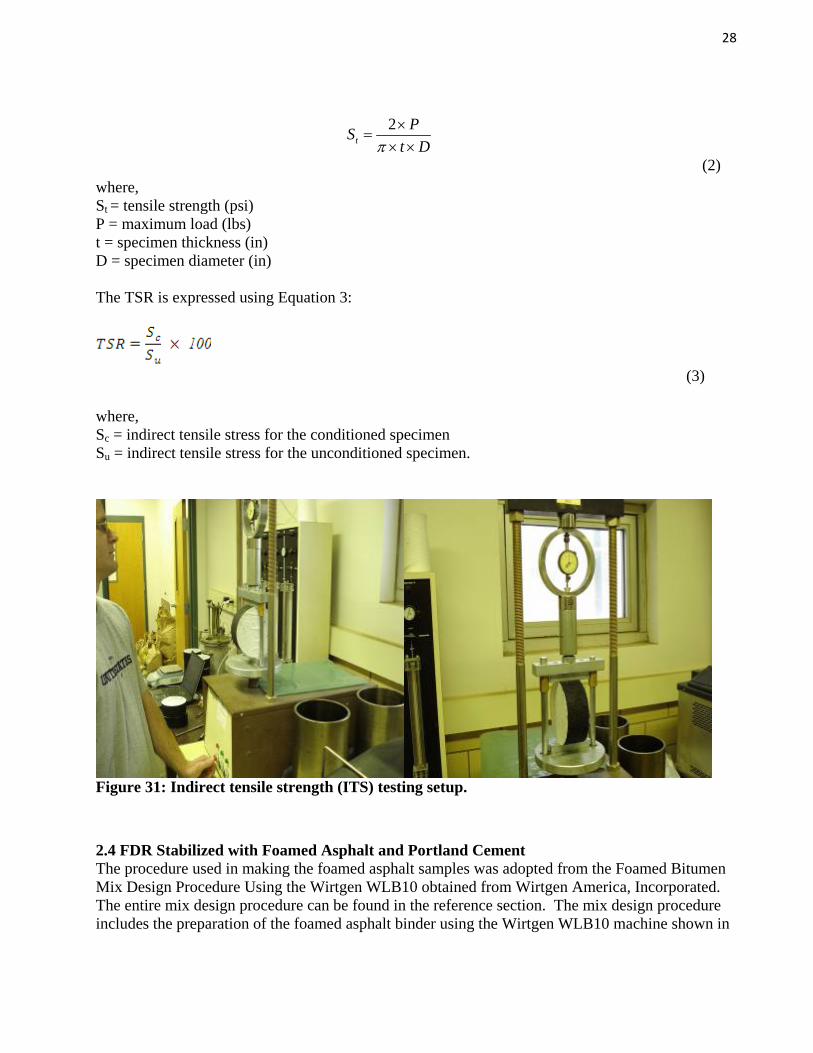
A total of six samples are compacted in the SGC; three samples are kept dry and referred to as unconditioned, the other three samples are subjected to a freeze-thaw cycle and referred to as conditioned. The indirect tensile strength (ITS) is measured for both the unconditioned and conditioned samples following the AASHTO T283 standard. The ITS testing setup and the testing apparatus are shown in Figure 31. Per AASHTO T283, the standard displacement rate for the loading ram used in the ITS test is two in (50 mm)/min. The maximum load the sample can withstand is measured and the ITS is calculated using Equation 2.
28
DtPSt ××
×=π
2
(2) where, St = tensile strength (psi) P = maximum load (lbs) t = specimen thickness (in) D = specimen diameter (in) The TSR is expressed using Equation 3:
(3)
where, Sc = indirect tensile stress for the conditioned specimen Su = indirect tensile stress for the unconditioned specimen.
Figure 31: Indirect tensile strength (ITS) testing setup.
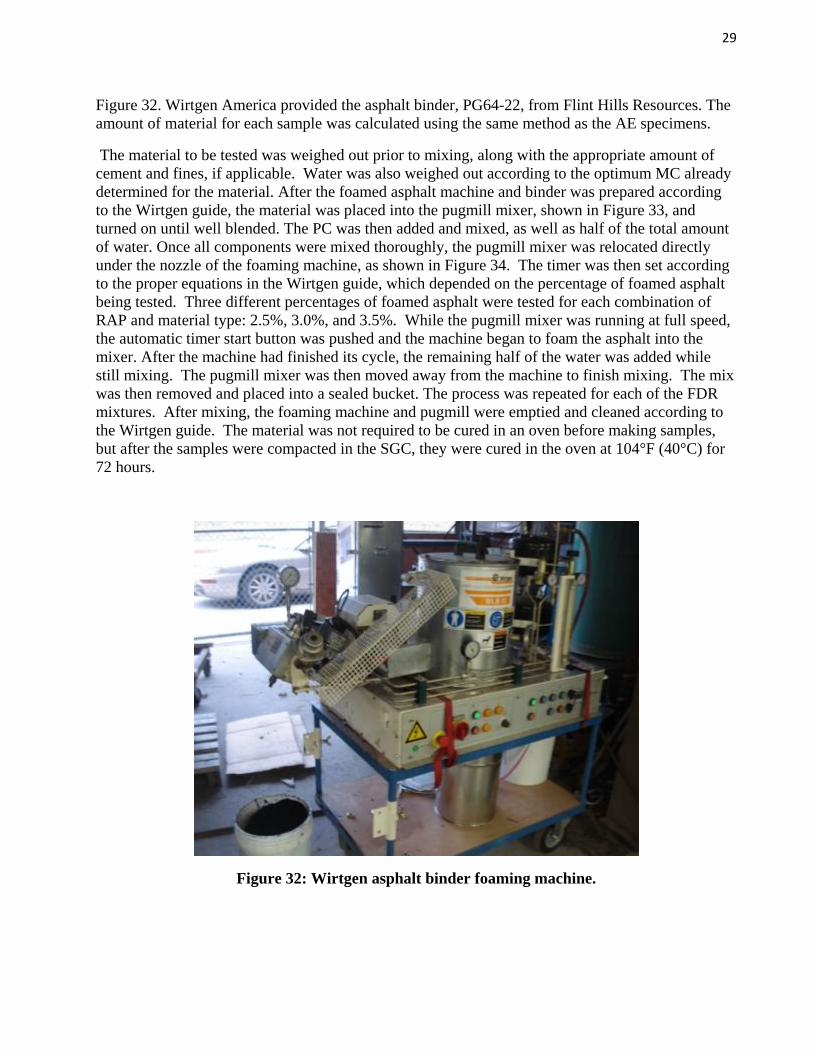
2.4 FDR Stabilized with Foamed Asphalt and Portland Cement The procedure used in making the foamed asphalt samples was adopted from the Foamed Bitumen Mix Design Procedure Using the Wirtgen WLB10 obtained from Wirtgen America, Incorporated. The entire mix design procedure can be found in the reference section. The mix design procedure includes the preparation of the foamed asphalt binder using the Wirtgen WLB10 machine shown in
29
Figure 32. Wirtgen America provided the asphalt binder, PG64-22, from Flint Hills Resources. The amount of material for each sample was calculated using the same method as the AE specimens.
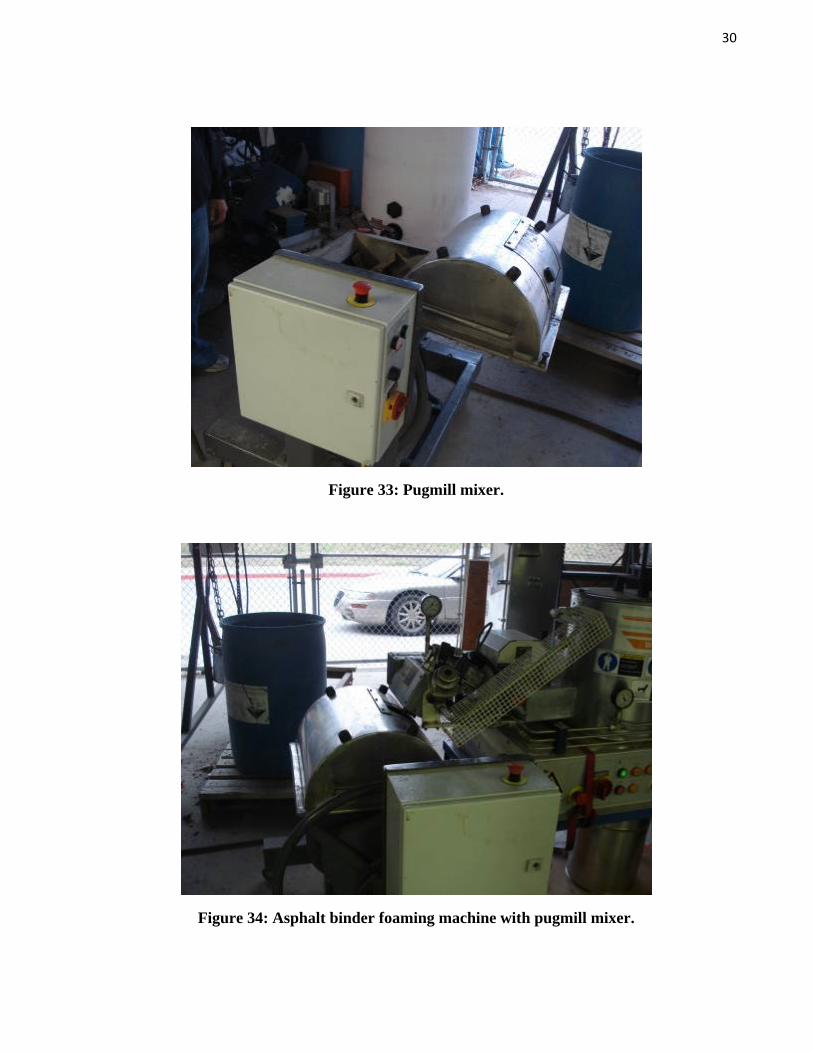
The material to be tested was weighed out prior to mixing, along with the appropriate amount of cement and fines, if applicable. Water was also weighed out according to the optimum MC already determined for the material. After the foamed asphalt machine and binder was prepared according to the Wirtgen guide, the material was placed into the pugmill mixer, shown in Figure 33, and turned on until well blended. The PC was then added and mixed, as well as half of the total amount of water. Once all components were mixed thoroughly, the pugmill mixer was relocated directly under the nozzle of the foaming machine, as shown in Figure 34. The timer was then set according to the proper equations in the Wirtgen guide, which depended on the percentage of foamed asphalt being tested. Three different percentages of foamed asphalt were tested for each combination of RAP and material type: 2.5%, 3.0%, and 3.5%. While the pugmill mixer was running at full speed, the automatic timer start button was pushed and the machine began to foam the asphalt into the mixer. After the machine had finished its cycle, the remaining half of the water was added while still mixing. The pugmill mixer was then moved away from the machine to finish mixing. The mix was then removed and placed into a sealed bucket. The process was repeated for each of the FDR mixtures. After mixing, the foaming machine and pugmill were emptied and cleaned according to the Wirtgen guide. The material was not required to be cured in an oven before making samples, but after the samples were compacted in the SGC, they were cured in the oven at 104°F (40°C) for 72 hours.
Figure 32: Wirtgen asphalt binder foaming machine.
30
Figure 33: Pugmill mixer.
Figure 34: Asphalt binder foaming machine with pugmill mixer.
31
2.4.1 Moisture -Density Curves (MDC) The MDC for this material was used from the unstabilized material. These values were used because of the small amount of emulsion used and the non-absorptive nature of the emulsion. It is assumed this would not change the values of the optimum MC or the maximum dry density enough to make a significant difference in the results.
2.4.2 Superpave Gyratory Compactor (SGC) The procedure for this test was the same one used for the FDR stabilized with emulsion.
2.4.3 Bulk Density Using CoreLok The procedure for this test was the same one used for the FDR stabilized with emulsion.
2.4.4 Moisture Sensitivity The procedure for this test was the same one used for the FDR stabilized with emulsion.

32
3. RESULTS AND ANALYSIS This section presents the analyses of the overall results from the various tests. The individual test results are summarized in the Appendices.
3.1 Unstabilized FDR (Mechanically Stabilized) The results and analysis of the unstabilized materials mixed with the proper proportions of RAP are presented in this section.
3.1.1 Moisture -Density Curves (MDC) The actual values for maximum dry density and optimum MC are summarized in Table 2. Figures 35 and 36 show the maximum dry density decreases and the optimum MC increases as the amount of RAP increases. As shown, the good clean (GC) material was hard to control and did not follow the general trend of the rest of the material. This is due to the gradation of the GC material.
Figure 35: Unstabilized FDR material density chart.
3.1.2 Resilient Modulus (MR) Equation 1 was used with the laboratory data to establish a relationship between MR and the state of stresses within the sample for the unstabilized FDR material. The individual MR values and calculations are included in Appendix D. However, in order to compare the impact of the various factors, a single representative MR value was needed. For this purpose, a multi-layer elastic analysis was conducted on a flexible pavement having four in. (100 mm) of Hot Mix Asphalt over a 16 in. (400 mm) of FDR base layer to determine the state of stresses at the middle of the FDR layer under a standard single axle load.
33
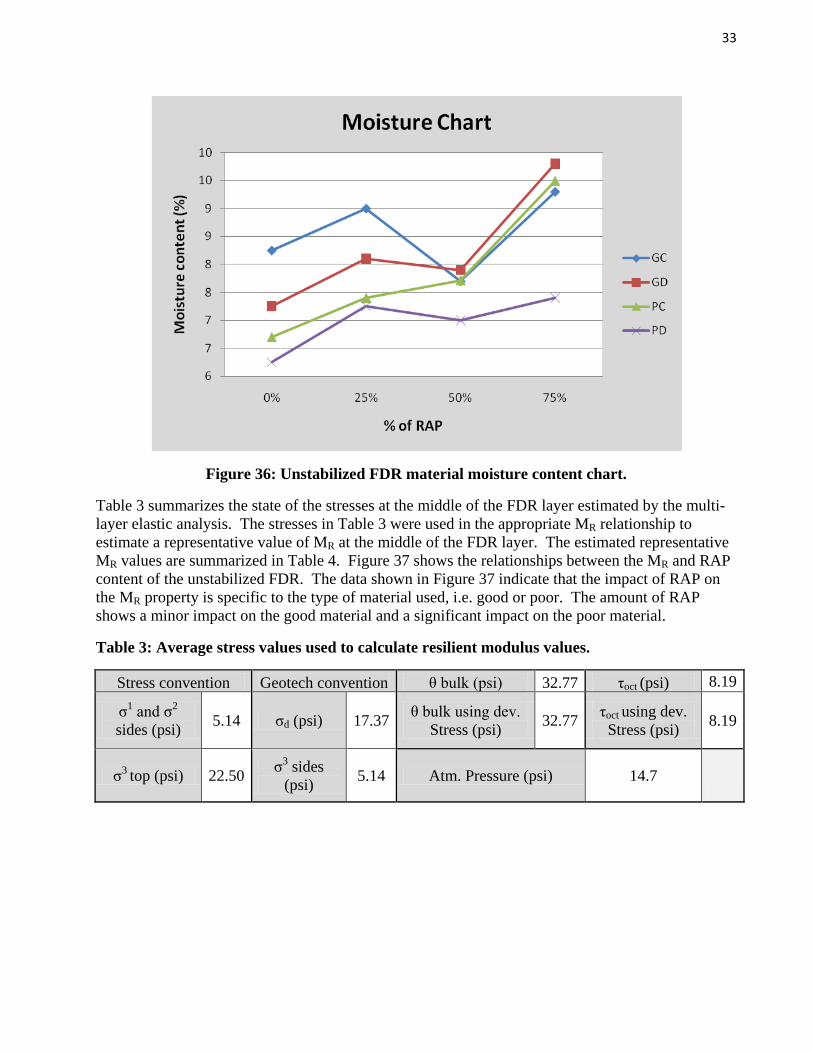
Figure 36: Unstabilized FDR material moisture content chart.
Table 3 summarizes the state of the stresses at the middle of the FDR layer estimated by the multi-layer elastic analysis. The stresses in Table 3 were used in the appropriate MR relationship to estimate a representative value of MR at the middle of the FDR layer. The estimated representative MR values are summarized in Table 4. Figure 37 shows the relationships between the MR and RAP content of the unstabilized FDR. The data shown in Figure 37 indicate that the impact of RAP on the MR property is specific to the type of material used, i.e. good or poor. The amount of RAP shows a minor impact on the good material and a significant impact on the poor material.
Table 3: Average stress values used to calculate resilient modulus values.
Stress convention Geotech convention θ bulk (psi) 32.77 τoct (psi) 8.19
σ1 and σ2
sides (psi) 5.14 σd (psi) 17.37 θ bulk using dev. Stress (psi) 32.77 τoct using dev.
Stress (psi) 8.19
σ3 top (psi) 22.50 σ3 sides (psi) 5.14 Atm. Pressure (psi) 14.7

34
Table 4: Resilient modulus results and constants.
Good Clean RAP % R2 value k1 k2 k3 MR (psi)
75 0.96 1,310 0.58 -0.30 26,814 50 0.97 1,038 0.54 -0.07 22,833 25 0.96 1,011 0.67 -0.17 23,546 0 0.90 1,055 0.67 -0.12 25,250
Good Dirty RAP % R2 value k1 k2 k3 MR (psi)
75 0.94 1,209 0.56 -0.19 25,581 50 0.68 1,031 0.63 -0.12 23,843 25 0.91 992 0.69 -0.26 22,606 0 0.96 1,126 0.61 -0.10 25,709
Poor Clean RAP % R2 value k1 k2 k3 MR (psi)
75 0.96 1,039 0.68 -0.35 22,589 50 0.96 772 0.68 -0.22 17,792 25 0.93 776 0.65 -0.10 18,490 0 0.95 683 0.74 -0.12 17,197
Poor Dirty RAP % R2 value k1 k2 k3 MR (psi)
75 0.92 1,197 0.60 -0.31 24,760 50 0.84 998 0.63 -0.28 21,501 25 0.95 825 0.61 -0.10 18,920 0 0.91 927 0.60 -0.11 20,997
Figure 37: Average resilient modulus values versus RAP content for unstabilized FDR.
35
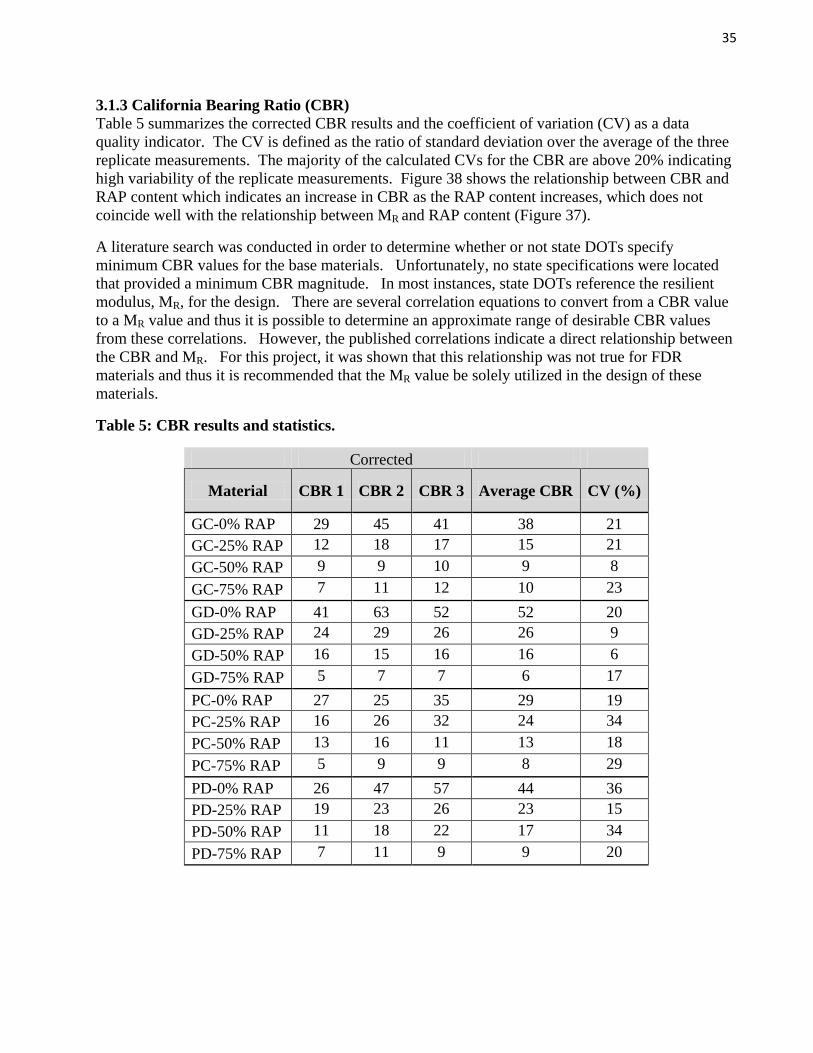
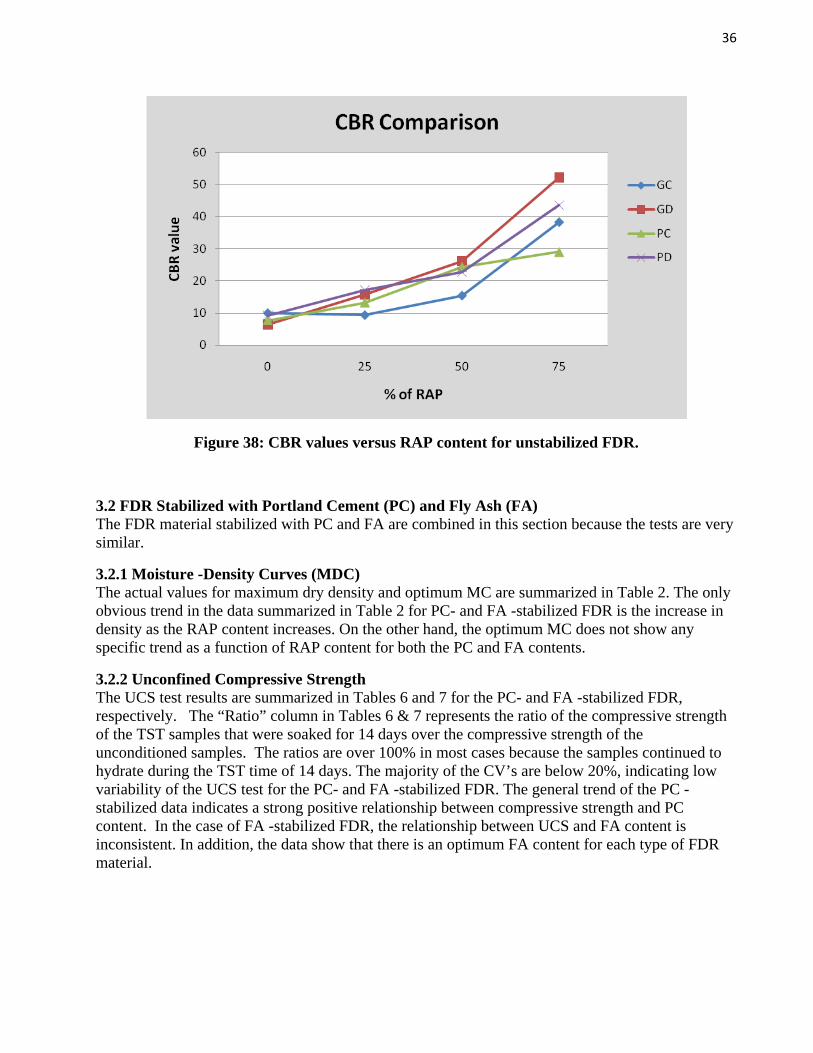
3.1.3 California Bearing Ratio (CBR) Table 5 summarizes the corrected CBR results and the coefficient of variation (CV) as a data quality indicator. The CV is defined as the ratio of standard deviation over the average of the three replicate measurements. The majority of the calculated CVs for the CBR are above 20% indicating high variability of the replicate measurements. Figure 38 shows the relationship between CBR and RAP content which indicates an increase in CBR as the RAP content increases, which does not coincide well with the relationship between MR and RAP content (Figure 37).
A literature search was conducted in order to determine whether or not state DOTs specify minimum CBR values for the base materials. Unfortunately, no state specifications were located that provided a minimum CBR magnitude. In most instances, state DOTs reference the resilient modulus, MR, for the design. There are several correlation equations to convert from a CBR value to a MR value and thus it is possible to determine an approximate range of desirable CBR values from these correlations. However, the published correlations indicate a direct relationship between the CBR and MR. For this project, it was shown that this relationship was not true for FDR materials and thus it is recommended that the MR value be solely utilized in the design of these materials.
Table 5: CBR results and statistics.
Corrected
Material CBR 1 CBR 2 CBR 3 Average CBR CV (%)
GC-0% RAP 29 45 41 38 21 GC-25% RAP 12 18 17 15 21 GC-50% RAP 9 9 10 9 8 GC-75% RAP 7 11 12 10 23 GD-0% RAP 41 63 52 52 20 GD-25% RAP 24 29 26 26 9 GD-50% RAP 16 15 16 16 6 GD-75% RAP 5 7 7 6 17 PC-0% RAP 27 25 35 29 19 PC-25% RAP 16 26 32 24 34 PC-50% RAP 13 16 11 13 18 PC-75% RAP 5 9 9 8 29 PD-0% RAP 26 47 57 44 36 PD-25% RAP 19 23 26 23 15 PD-50% RAP 11 18 22 17 34 PD-75% RAP 7 11 9 9 20
36
Figure 38: CBR values versus RAP content for unstabilized FDR.
3.2 FDR Stabilized with Portland Cement (PC) and Fly Ash (FA) The FDR material stabilized with PC and FA are combined in this section because the tests are very similar.
3.2.1 Moisture -Density Curves (MDC) The actual values for maximum dry density and optimum MC are summarized in Table 2. The only obvious trend in the data summarized in Table 2 for PC- and FA -stabilized FDR is the increase in density as the RAP content increases. On the other hand, the optimum MC does not show any specific trend as a function of RAP content for both the PC and FA contents.
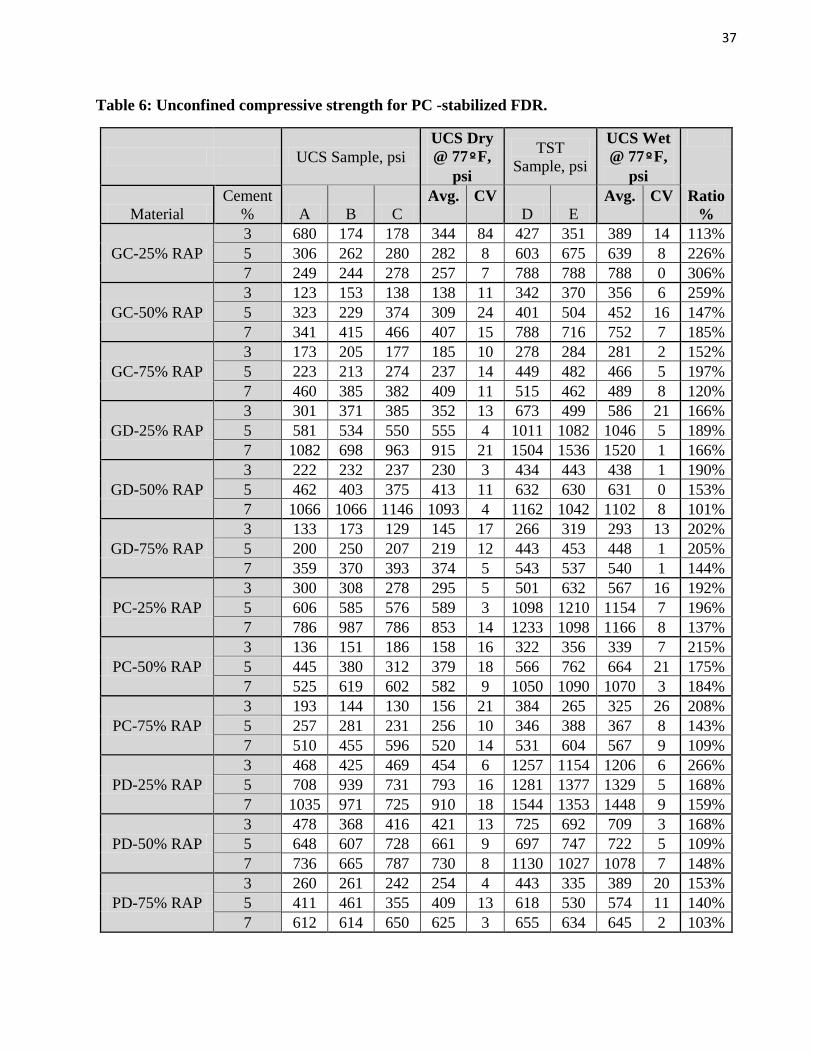
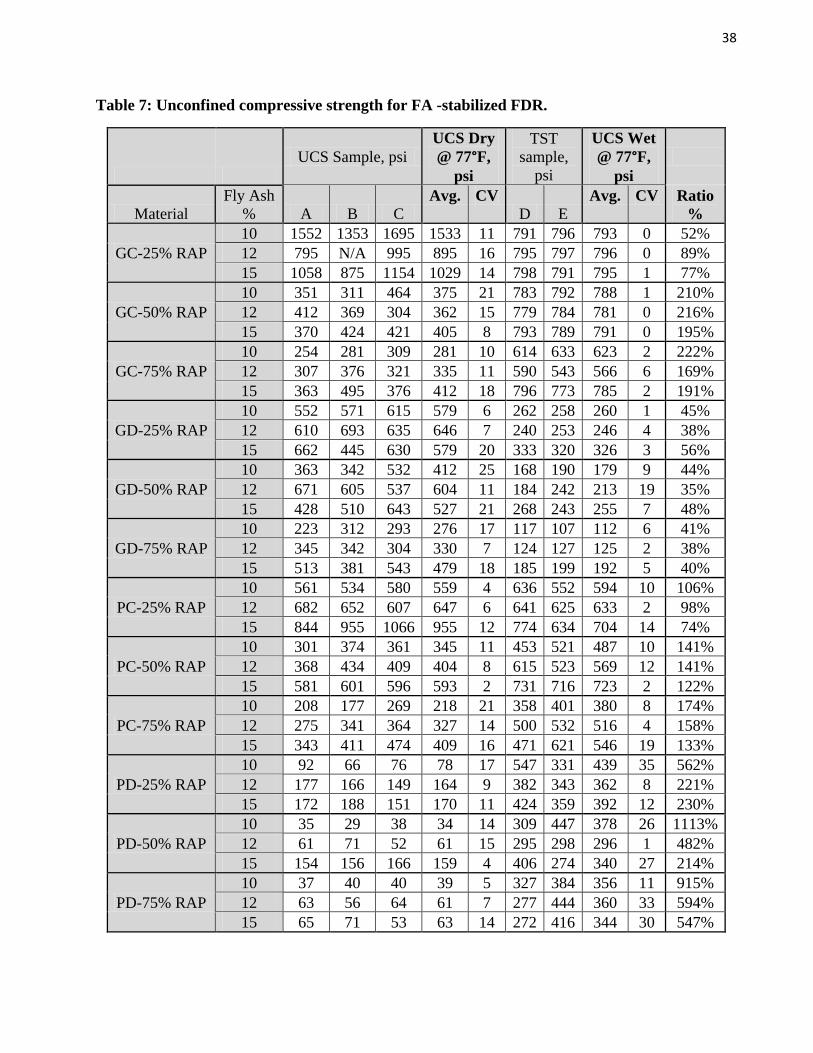
3.2.2 Unconfined Compressive Strength The UCS test results are summarized in Tables 6 and 7 for the PC- and FA -stabilized FDR, respectively. The “Ratio” column in Tables 6 & 7 represents the ratio of the compressive strength of the TST samples that were soaked for 14 days over the compressive strength of the unconditioned samples. The ratios are over 100% in most cases because the samples continued to hydrate during the TST time of 14 days. The majority of the CV’s are below 20%, indicating low variability of the UCS test for the PC- and FA -stabilized FDR. The general trend of the PC -stabilized data indicates a strong positive relationship between compressive strength and PC content. In the case of FA -stabilized FDR, the relationship between UCS and FA content is inconsistent. In addition, the data show that there is an optimum FA content for each type of FDR material.
37
Table 6: Unconfined compressive strength for PC -stabilized FDR.
UCS Sample, psi UCS Dry @ 77ºF,
psi
TST Sample, psi
UCS Wet @ 77ºF,
psi
Material Cement
% A B C Avg. CV
D E Avg. CV Ratio
%
GC-25% RAP 3 680 174 178 344 84 427 351 389 14 113% 5 306 262 280 282 8 603 675 639 8 226% 7 249 244 278 257 7 788 788 788 0 306%
GC-50% RAP 3 123 153 138 138 11 342 370 356 6 259% 5 323 229 374 309 24 401 504 452 16 147% 7 341 415 466 407 15 788 716 752 7 185%
GC-75% RAP 3 173 205 177 185 10 278 284 281 2 152% 5 223 213 274 237 14 449 482 466 5 197% 7 460 385 382 409 11 515 462 489 8 120%
GD-25% RAP 3 301 371 385 352 13 673 499 586 21 166% 5 581 534 550 555 4 1011 1082 1046 5 189% 7 1082 698 963 915 21 1504 1536 1520 1 166%
GD-50% RAP 3 222 232 237 230 3 434 443 438 1 190% 5 462 403 375 413 11 632 630 631 0 153% 7 1066 1066 1146 1093 4 1162 1042 1102 8 101%
GD-75% RAP 3 133 173 129 145 17 266 319 293 13 202% 5 200 250 207 219 12 443 453 448 1 205% 7 359 370 393 374 5 543 537 540 1 144%
PC-25% RAP 3 300 308 278 295 5 501 632 567 16 192% 5 606 585 576 589 3 1098 1210 1154 7 196% 7 786 987 786 853 14 1233 1098 1166 8 137%
PC-50% RAP 3 136 151 186 158 16 322 356 339 7 215% 5 445 380 312 379 18 566 762 664 21 175% 7 525 619 602 582 9 1050 1090 1070 3 184%
PC-75% RAP 3 193 144 130 156 21 384 265 325 26 208% 5 257 281 231 256 10 346 388 367 8 143% 7 510 455 596 520 14 531 604 567 9 109%
PD-25% RAP 3 468 425 469 454 6 1257 1154 1206 6 266% 5 708 939 731 793 16 1281 1377 1329 5 168% 7 1035 971 725 910 18 1544 1353 1448 9 159%
PD-50% RAP 3 478 368 416 421 13 725 692 709 3 168% 5 648 607 728 661 9 697 747 722 5 109% 7 736 665 787 730 8 1130 1027 1078 7 148%
PD-75% RAP 3 260 261 242 254 4 443 335 389 20 153% 5 411 461 355 409 13 618 530 574 11 140% 7 612 614 650 625 3 655 634 645 2 103%
38
Table 7: Unconfined compressive strength for FA -stabilized FDR.
UCS Sample, psi
UCS Dry @ 77°F,
psi
TST sample,
psi
UCS Wet @ 77°F,
psi
Material Fly Ash
% A B C Avg. CV
D E Avg. CV Ratio
%
GC-25% RAP 10 1552 1353 1695 1533 11 791 796 793 0 52% 12 795 N/A 995 895 16 795 797 796 0 89% 15 1058 875 1154 1029 14 798 791 795 1 77%
GC-50% RAP 10 351 311 464 375 21 783 792 788 1 210% 12 412 369 304 362 15 779 784 781 0 216% 15 370 424 421 405 8 793 789 791 0 195%
GC-75% RAP 10 254 281 309 281 10 614 633 623 2 222% 12 307 376 321 335 11 590 543 566 6 169% 15 363 495 376 412 18 796 773 785 2 191%
GD-25% RAP 10 552 571 615 579 6 262 258 260 1 45% 12 610 693 635 646 7 240 253 246 4 38% 15 662 445 630 579 20 333 320 326 3 56%
GD-50% RAP 10 363 342 532 412 25 168 190 179 9 44% 12 671 605 537 604 11 184 242 213 19 35% 15 428 510 643 527 21 268 243 255 7 48%
GD-75% RAP 10 223 312 293 276 17 117 107 112 6 41% 12 345 342 304 330 7 124 127 125 2 38% 15 513 381 543 479 18 185 199 192 5 40%
PC-25% RAP 10 561 534 580 559 4 636 552 594 10 106% 12 682 652 607 647 6 641 625 633 2 98% 15 844 955 1066 955 12 774 634 704 14 74%
PC-50% RAP 10 301 374 361 345 11 453 521 487 10 141% 12 368 434 409 404 8 615 523 569 12 141% 15 581 601 596 593 2 731 716 723 2 122%
PC-75% RAP 10 208 177 269 218 21 358 401 380 8 174% 12 275 341 364 327 14 500 532 516 4 158% 15 343 411 474 409 16 471 621 546 19 133%
PD-25% RAP 10 92 66 76 78 17 547 331 439 35 562% 12 177 166 149 164 9 382 343 362 8 221% 15 172 188 151 170 11 424 359 392 12 230%
PD-50% RAP 10 35 29 38 34 14 309 447 378 26 1113% 12 61 71 52 61 15 295 298 296 1 482% 15 154 156 166 159 4 406 274 340 27 214%
PD-75% RAP 10 37 40 40 39 5 327 384 356 11 915% 12 63 56 64 61 7 277 444 360 33 594% 15 65 71 53 63 14 272 416 344 30 547%

39
3.2.3 Moisture Sensitivity As discussed earlier, the moisture sensitivity of the PC- and FA -stabilized FDR were evaluated using both the TST and Wire Brush Tests. However, the TST was conducted on all combinations of factors while the Wire Brush Test was only conducted on the selected optimum designs that were selected based on the compressive strength properties of the mixtures.
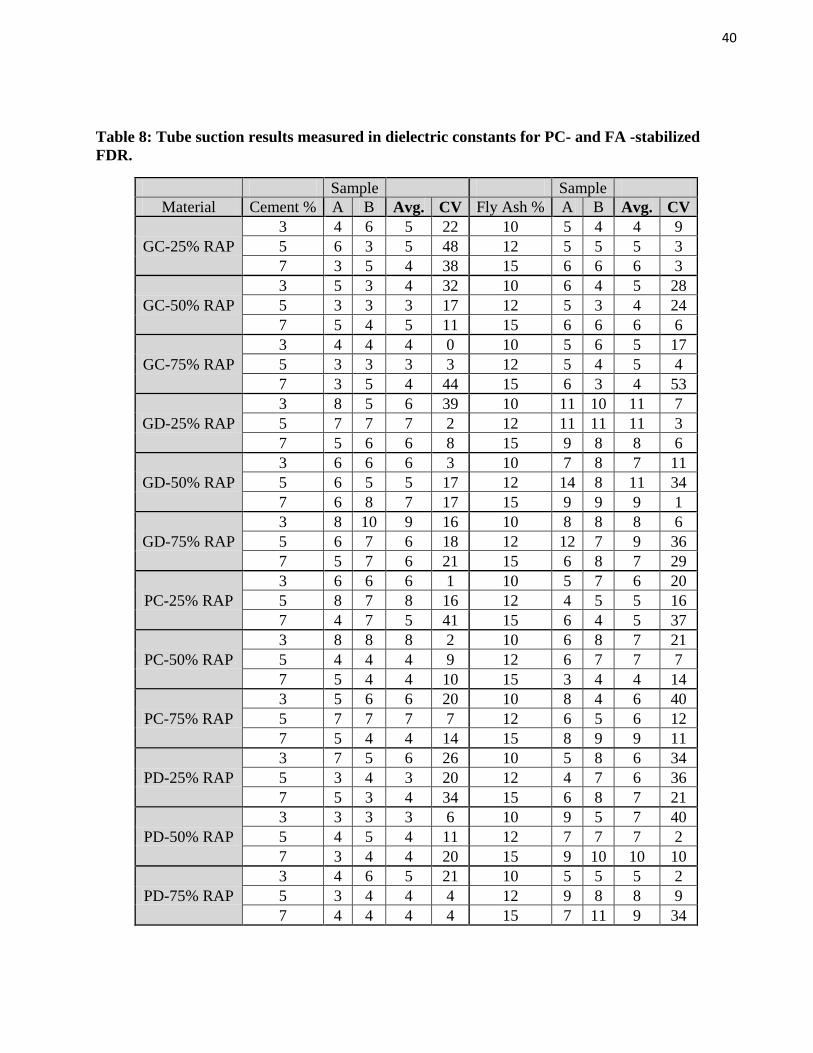
Earlier studies at the Texas Transportation Institute (TTI) on the TST showed a dielectric constant below 10 indicates good resistance to moisture damage as stated in the Texas DOT TST protocol dated 12/31/05. The data in Table 8 indicate the great majority of the PC- and FA -stabilized FDR materials exhibit TST values well below the threshold of 10.
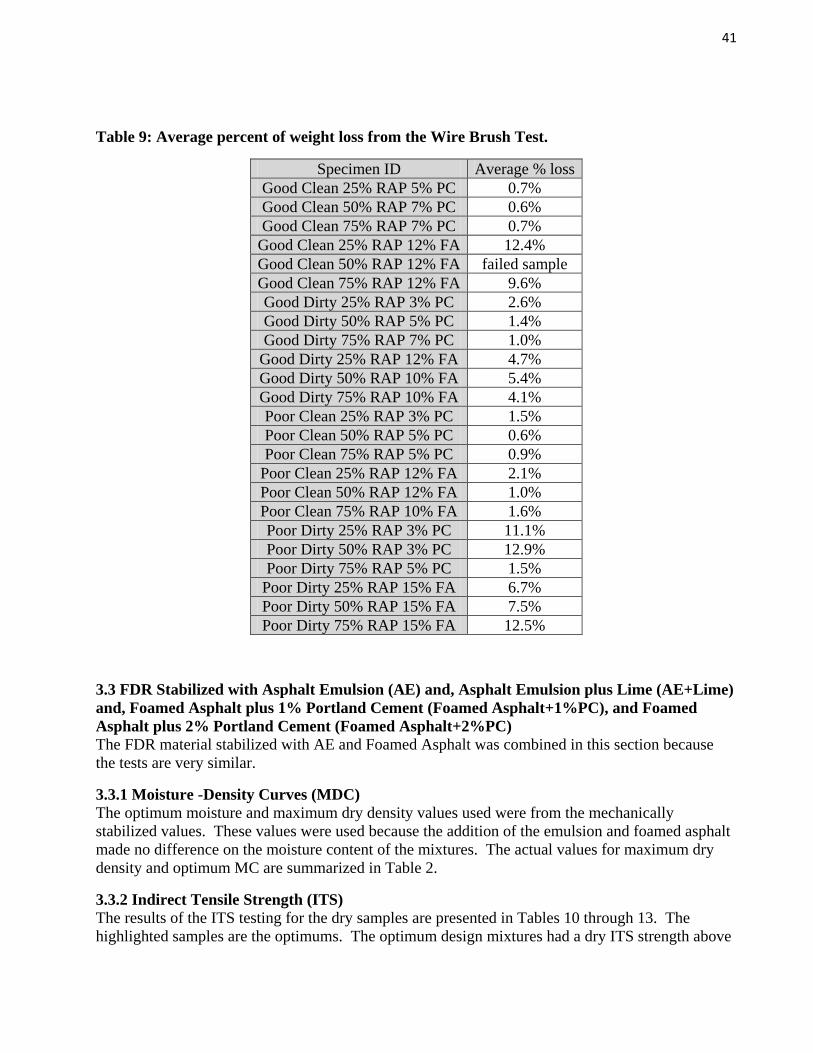
The Wire Brush Tests were then conducted on the optimum design samples. Table 9 summarizes the average percent weight loss after 12 cycles. The full data set is shown in Appendix E. The weight loss data show that poor dirty materials stabilized with either PC or FA suffered the highest weight loss.
The relationships between weight loss and number of cycles indicate that the weight loss for most materials would level-off after the 6th cycle. This indicates that the full 12 cycles may not be needed to fully describe the moisture sensitivity of FDR materials stabilized with PC and FA and a shorter test which consists of just six cycles may be adequate.
40
Table 8: Tube suction results measured in dielectric constants for PC- and FA -stabilized FDR.
Sample Sample Material Cement % A B Avg. CV Fly Ash % A B Avg. CV
GC-25% RAP 3 4 6 5 22 10 5 4 4 9 5 6 3 5 48 12 5 5 5 3 7 3 5 4 38 15 6 6 6 3
GC-50% RAP 3 5 3 4 32 10 6 4 5 28 5 3 3 3 17 12 5 3 4 24 7 5 4 5 11 15 6 6 6 6
GC-75% RAP 3 4 4 4 0 10 5 6 5 17 5 3 3 3 3 12 5 4 5 4 7 3 5 4 44 15 6 3 4 53
GD-25% RAP 3 8 5 6 39 10 11 10 11 7 5 7 7 7 2 12 11 11 11 3 7 5 6 6 8 15 9 8 8 6
GD-50% RAP 3 6 6 6 3 10 7 8 7 11 5 6 5 5 17 12 14 8 11 34 7 6 8 7 17 15 9 9 9 1
GD-75% RAP 3 8 10 9 16 10 8 8 8 6 5 6 7 6 18 12 12 7 9 36 7 5 7 6 21 15 6 8 7 29
PC-25% RAP 3 6 6 6 1 10 5 7 6 20 5 8 7 8 16 12 4 5 5 16 7 4 7 5 41 15 6 4 5 37
PC-50% RAP 3 8 8 8 2 10 6 8 7 21 5 4 4 4 9 12 6 7 7 7 7 5 4 4 10 15 3 4 4 14
PC-75% RAP 3 5 6 6 20 10 8 4 6 40 5 7 7 7 7 12 6 5 6 12 7 5 4 4 14 15 8 9 9 11
PD-25% RAP 3 7 5 6 26 10 5 8 6 34 5 3 4 3 20 12 4 7 6 36 7 5 3 4 34 15 6 8 7 21
PD-50% RAP 3 3 3 3 6 10 9 5 7 40 5 4 5 4 11 12 7 7 7 2 7 3 4 4 20 15 9 10 10 10
PD-75% RAP 3 4 6 5 21 10 5 5 5 2 5 3 4 4 4 12 9 8 8 9 7 4 4 4 4 15 7 11 9 34
41
Table 9: Average percent of weight loss from the Wire Brush Test.
Specimen ID Average % loss Good Clean 25% RAP 5% PC 0.7% Good Clean 50% RAP 7% PC 0.6% Good Clean 75% RAP 7% PC 0.7%
Good Clean 25% RAP 12% FA 12.4% Good Clean 50% RAP 12% FA failed sample Good Clean 75% RAP 12% FA 9.6% Good Dirty 25% RAP 3% PC 2.6% Good Dirty 50% RAP 5% PC 1.4% Good Dirty 75% RAP 7% PC 1.0%
Good Dirty 25% RAP 12% FA 4.7% Good Dirty 50% RAP 10% FA 5.4% Good Dirty 75% RAP 10% FA 4.1% Poor Clean 25% RAP 3% PC 1.5% Poor Clean 50% RAP 5% PC 0.6% Poor Clean 75% RAP 5% PC 0.9%
Poor Clean 25% RAP 12% FA 2.1% Poor Clean 50% RAP 12% FA 1.0% Poor Clean 75% RAP 10% FA 1.6% Poor Dirty 25% RAP 3% PC 11.1% Poor Dirty 50% RAP 3% PC 12.9% Poor Dirty 75% RAP 5% PC 1.5%
Poor Dirty 25% RAP 15% FA 6.7% Poor Dirty 50% RAP 15% FA 7.5% Poor Dirty 75% RAP 15% FA 12.5%
3.3 FDR Stabilized with Asphalt Emulsion (AE) and, Asphalt Emulsion plus Lime (AE+Lime) and, Foamed Asphalt plus 1% Portland Cement (Foamed Asphalt+1%PC), and Foamed Asphalt plus 2% Portland Cement (Foamed Asphalt+2%PC) The FDR material stabilized with AE and Foamed Asphalt was combined in this section because the tests are very similar.
3.3.1 Moisture -Density Curves (MDC) The optimum moisture and maximum dry density values used were from the mechanically stabilized values. These values were used because the addition of the emulsion and foamed asphalt made no difference on the moisture content of the mixtures. The actual values for maximum dry density and optimum MC are summarized in Table 2.
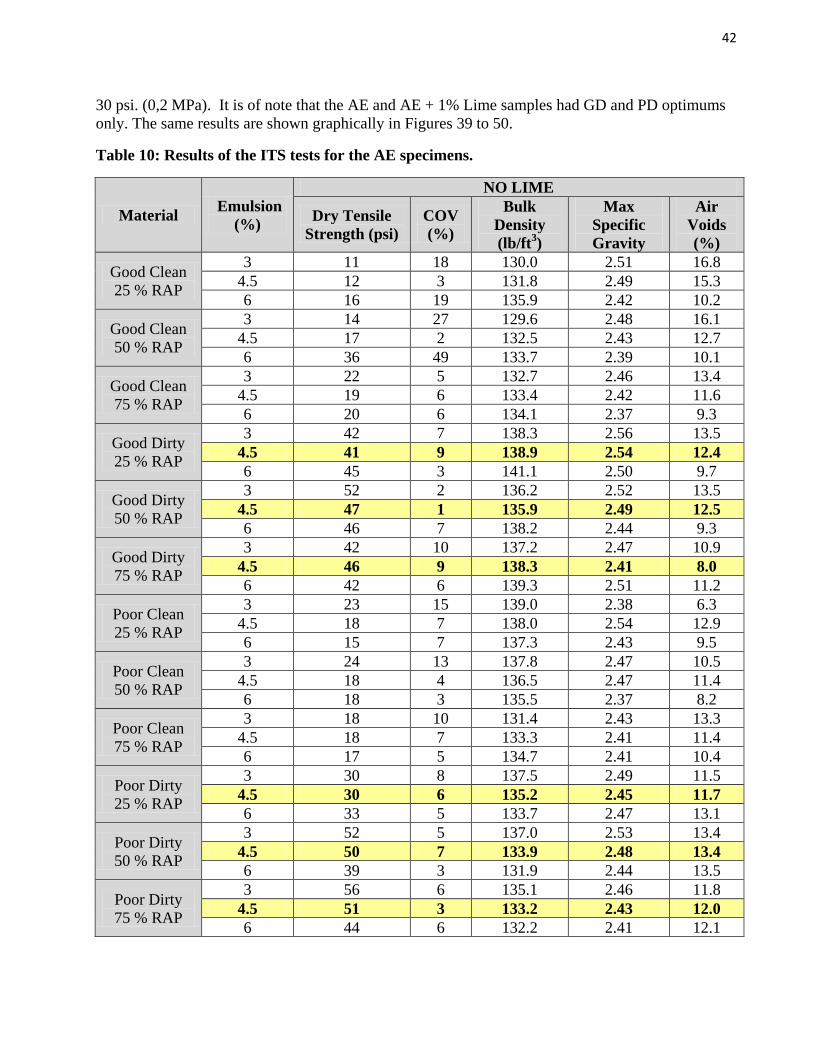
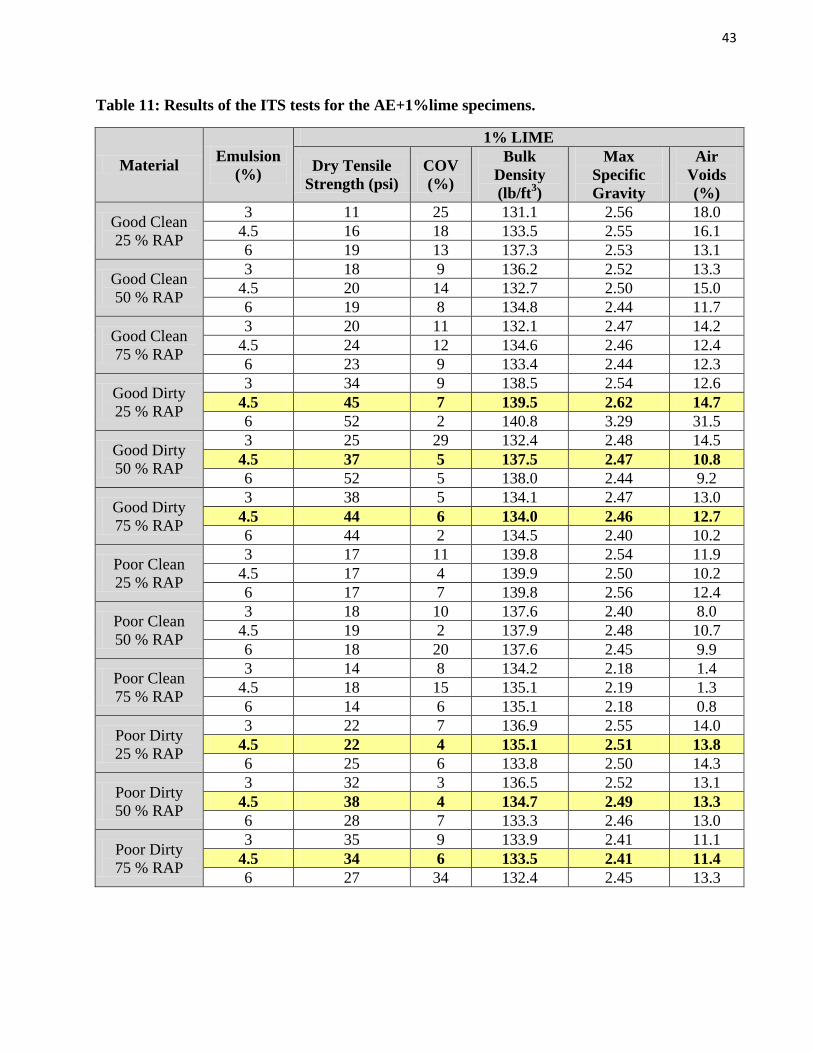
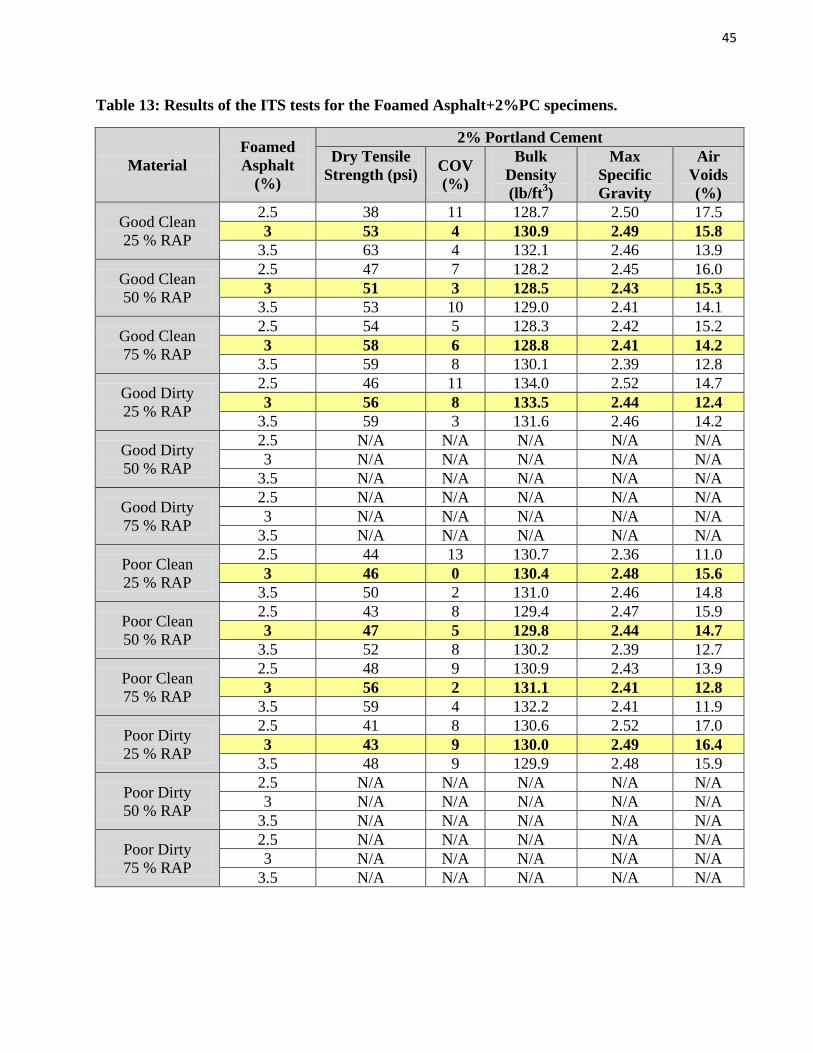
3.3.2 Indirect Tensile Strength (ITS) The results of the ITS testing for the dry samples are presented in Tables 10 through 13. The highlighted samples are the optimums. The optimum design mixtures had a dry ITS strength above
42
30 psi. (0,2 MPa). It is of note that the AE and AE + 1% Lime samples had GD and PD optimums only. The same results are shown graphically in Figures 39 to 50.
Table 10: Results of the ITS tests for the AE specimens.
Material Emulsion (%)
NO LIME
Dry Tensile Strength (psi)
COV (%)
Bulk Density (lb/ft3)
Max Specific Gravity
Air Voids (%)
Good Clean 25 % RAP
3 11 18 130.0 2.51 16.8 4.5 12 3 131.8 2.49 15.3 6 16 19 135.9 2.42 10.2
Good Clean 50 % RAP
3 14 27 129.6 2.48 16.1 4.5 17 2 132.5 2.43 12.7 6 36 49 133.7 2.39 10.1
Good Clean 75 % RAP
3 22 5 132.7 2.46 13.4 4.5 19 6 133.4 2.42 11.6 6 20 6 134.1 2.37 9.3
Good Dirty 25 % RAP
3 42 7 138.3 2.56 13.5 4.5 41 9 138.9 2.54 12.4 6 45 3 141.1 2.50 9.7
Good Dirty 50 % RAP
3 52 2 136.2 2.52 13.5 4.5 47 1 135.9 2.49 12.5 6 46 7 138.2 2.44 9.3
Good Dirty 75 % RAP
3 42 10 137.2 2.47 10.9 4.5 46 9 138.3 2.41 8.0 6 42 6 139.3 2.51 11.2
Poor Clean 25 % RAP
3 23 15 139.0 2.38 6.3 4.5 18 7 138.0 2.54 12.9 6 15 7 137.3 2.43 9.5
Poor Clean 50 % RAP
3 24 13 137.8 2.47 10.5 4.5 18 4 136.5 2.47 11.4 6 18 3 135.5 2.37 8.2
Poor Clean 75 % RAP
3 18 10 131.4 2.43 13.3 4.5 18 7 133.3 2.41 11.4 6 17 5 134.7 2.41 10.4
Poor Dirty 25 % RAP
3 30 8 137.5 2.49 11.5 4.5 30 6 135.2 2.45 11.7 6 33 5 133.7 2.47 13.1
Poor Dirty 50 % RAP
3 52 5 137.0 2.53 13.4 4.5 50 7 133.9 2.48 13.4 6 39 3 131.9 2.44 13.5
Poor Dirty 75 % RAP
3 56 6 135.1 2.46 11.8 4.5 51 3 133.2 2.43 12.0 6 44 6 132.2 2.41 12.1
43
Table 11: Results of the ITS tests for the AE+1%lime specimens.
Material Emulsion (%)
1% LIME
Dry Tensile Strength (psi)
COV (%)
Bulk Density (lb/ft3)
Max Specific Gravity
Air Voids (%)
Good Clean 25 % RAP
3 11 25 131.1 2.56 18.0 4.5 16 18 133.5 2.55 16.1 6 19 13 137.3 2.53 13.1
Good Clean 50 % RAP
3 18 9 136.2 2.52 13.3 4.5 20 14 132.7 2.50 15.0 6 19 8 134.8 2.44 11.7
Good Clean 75 % RAP
3 20 11 132.1 2.47 14.2 4.5 24 12 134.6 2.46 12.4 6 23 9 133.4 2.44 12.3
Good Dirty 25 % RAP
3 34 9 138.5 2.54 12.6 4.5 45 7 139.5 2.62 14.7 6 52 2 140.8 3.29 31.5
Good Dirty 50 % RAP
3 25 29 132.4 2.48 14.5 4.5 37 5 137.5 2.47 10.8 6 52 5 138.0 2.44 9.2
Good Dirty 75 % RAP
3 38 5 134.1 2.47 13.0 4.5 44 6 134.0 2.46 12.7 6 44 2 134.5 2.40 10.2
Poor Clean 25 % RAP
3 17 11 139.8 2.54 11.9 4.5 17 4 139.9 2.50 10.2 6 17 7 139.8 2.56 12.4
Poor Clean 50 % RAP
3 18 10 137.6 2.40 8.0 4.5 19 2 137.9 2.48 10.7 6 18 20 137.6 2.45 9.9
Poor Clean 75 % RAP
3 14 8 134.2 2.18 1.4 4.5 18 15 135.1 2.19 1.3 6 14 6 135.1 2.18 0.8
Poor Dirty 25 % RAP
3 22 7 136.9 2.55 14.0 4.5 22 4 135.1 2.51 13.8 6 25 6 133.8 2.50 14.3
Poor Dirty 50 % RAP
3 32 3 136.5 2.52 13.1 4.5 38 4 134.7 2.49 13.3 6 28 7 133.3 2.46 13.0
Poor Dirty 75 % RAP
3 35 9 133.9 2.41 11.1 4.5 34 6 133.5 2.41 11.4 6 27 34 132.4 2.45 13.3

44
Table 12: Results of the ITS tests for the Foamed Asphalt+1%PC specimens.
Material Foamed Asphalt
(%)
1% Portland Cement Dry Tensile
Strength (psi) COV (%)
Bulk Density (lb/ft3)
Max Specific Gravity
Air Voids (%)
Good Clean 25 % RAP
2.5 19 9 123.7 2.44 18.9 3 28 14 125.3 2.50 19.8
3.5 33 5 125.4 2.46 18.2
Good Clean 50 % RAP
2.5 30 3 125.3 2.27 11.6 3 32 2 125.0 2.25 11.0
3.5 30 11 124.7 2.45 18.3
Good Clean 75 % RAP
2.5 28 9 123.6 2.45 19.1 3 34 10 124.5 2.36 15.6
3.5 39 6 125.5 2.41 16.6
Good Dirty 25 % RAP
2.5 33 12 129.5 2.51 17.4 3 38 6 129.6 2.50 16.8
3.5 45 6 130.2 2.46 15.2
Good Dirty 50 % RAP
2.5 41 6 127.4 2.45 16.7 3 44 4 127.7 2.46 16.8
3.5 44 3 129.2 2.41 14.0
Good Dirty 75 % RAP
2.5 41 9 127.8 2.36 13.1 3 46 5 128.6 2.33 11.7
3.5 51 6 128.2 2.40 14.3
Poor Clean 25 % RAP
2.5 44 3 132.8 2.74 22.4 3 45 5 133.5 2.34 8.7
3.5 54 4 133.9 2.59 17.2
Poor Clean 50 % RAP
2.5 44 2 132.5 2.47 13.9 3 49 9 133.0 2.29 7.1
3.5 53 4 131.0 2.42 13.4
Poor Clean 75 % RAP
2.5 43 3 131.9 2.35 10.2 3 48 6 132.7 2.30 7.6
3.5 48 5 131.4 2.41 12.6
Poor Dirty 25 % RAP
2.5 41 9 133.8 2.50 14.4 3 43 3 133.5 2.46 13.0
3.5 34 9 132.9 2.51 15.1
Poor Dirty 50 % RAP
2.5 43 5 132.2 2.45 13.5 3 48 5 132.6 2.36 9.9
3.5 47 11 132.4 2.45 13.4
Poor Dirty 75 % RAP
2.5 53 6 132.8 2.42 11.9 3 55 2 129.9 2.20 5.4
3.5 53 4 131.5 2.39 11.8
45
Table 13: Results of the ITS tests for the Foamed Asphalt+2%PC specimens.
Material Foamed Asphalt
(%)
2% Portland Cement Dry Tensile
Strength (psi) COV (%)
Bulk Density (lb/ft3)
Max Specific Gravity
Air Voids (%)
Good Clean 25 % RAP
2.5 38 11 128.7 2.50 17.5 3 53 4 130.9 2.49 15.8
3.5 63 4 132.1 2.46 13.9
Good Clean 50 % RAP
2.5 47 7 128.2 2.45 16.0 3 51 3 128.5 2.43 15.3
3.5 53 10 129.0 2.41 14.1
Good Clean 75 % RAP
2.5 54 5 128.3 2.42 15.2 3 58 6 128.8 2.41 14.2
3.5 59 8 130.1 2.39 12.8
Good Dirty 25 % RAP
2.5 46 11 134.0 2.52 14.7 3 56 8 133.5 2.44 12.4
3.5 59 3 131.6 2.46 14.2
Good Dirty 50 % RAP
2.5 N/A N/A N/A N/A N/A 3 N/A N/A N/A N/A N/A
3.5 N/A N/A N/A N/A N/A
Good Dirty 75 % RAP
2.5 N/A N/A N/A N/A N/A 3 N/A N/A N/A N/A N/A
3.5 N/A N/A N/A N/A N/A
Poor Clean 25 % RAP
2.5 44 13 130.7 2.36 11.0 3 46 0 130.4 2.48 15.6
3.5 50 2 131.0 2.46 14.8
Poor Clean 50 % RAP
2.5 43 8 129.4 2.47 15.9 3 47 5 129.8 2.44 14.7
3.5 52 8 130.2 2.39 12.7
Poor Clean 75 % RAP
2.5 48 9 130.9 2.43 13.9 3 56 2 131.1 2.41 12.8
3.5 59 4 132.2 2.41 11.9
Poor Dirty 25 % RAP
2.5 41 8 130.6 2.52 17.0 3 43 9 130.0 2.49 16.4
3.5 48 9 129.9 2.48 15.9
Poor Dirty 50 % RAP
2.5 N/A N/A N/A N/A N/A 3 N/A N/A N/A N/A N/A
3.5 N/A N/A N/A N/A N/A
Poor Dirty 75 % RAP
2.5 N/A N/A N/A N/A N/A 3 N/A N/A N/A N/A N/A
3.5 N/A N/A N/A N/A N/A
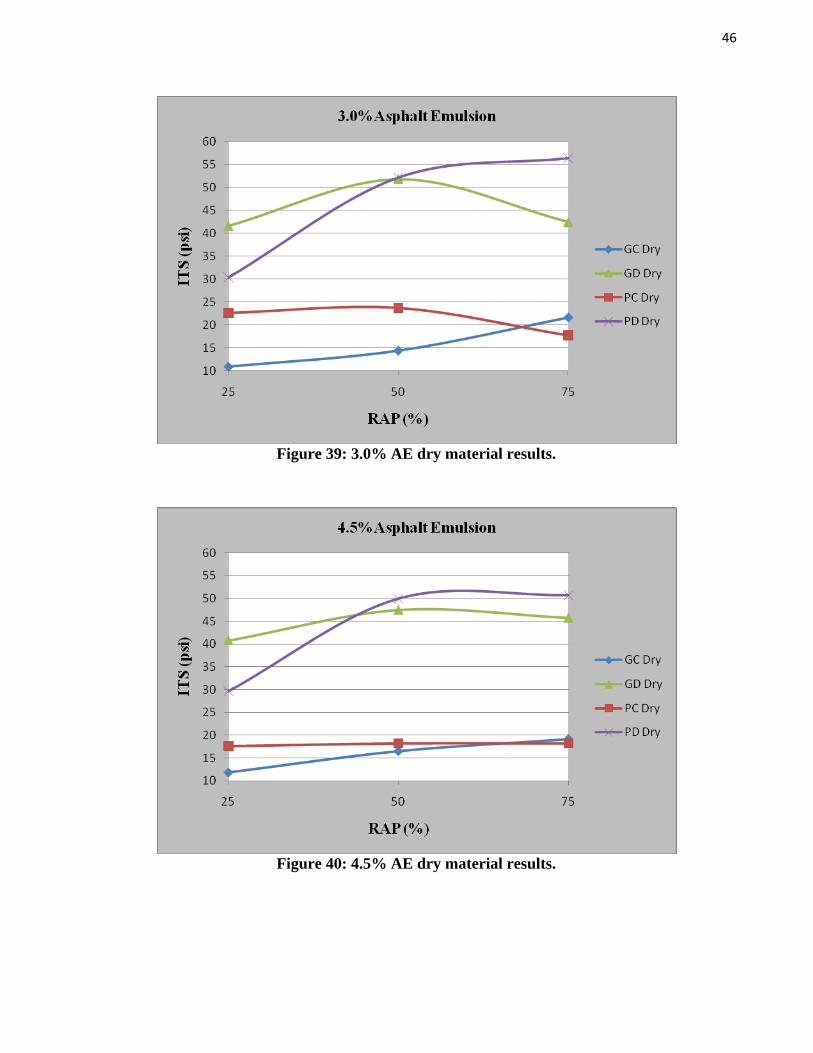
46
Figure 39: 3.0% AE dry material results.
Figure 40: 4.5% AE dry material results.
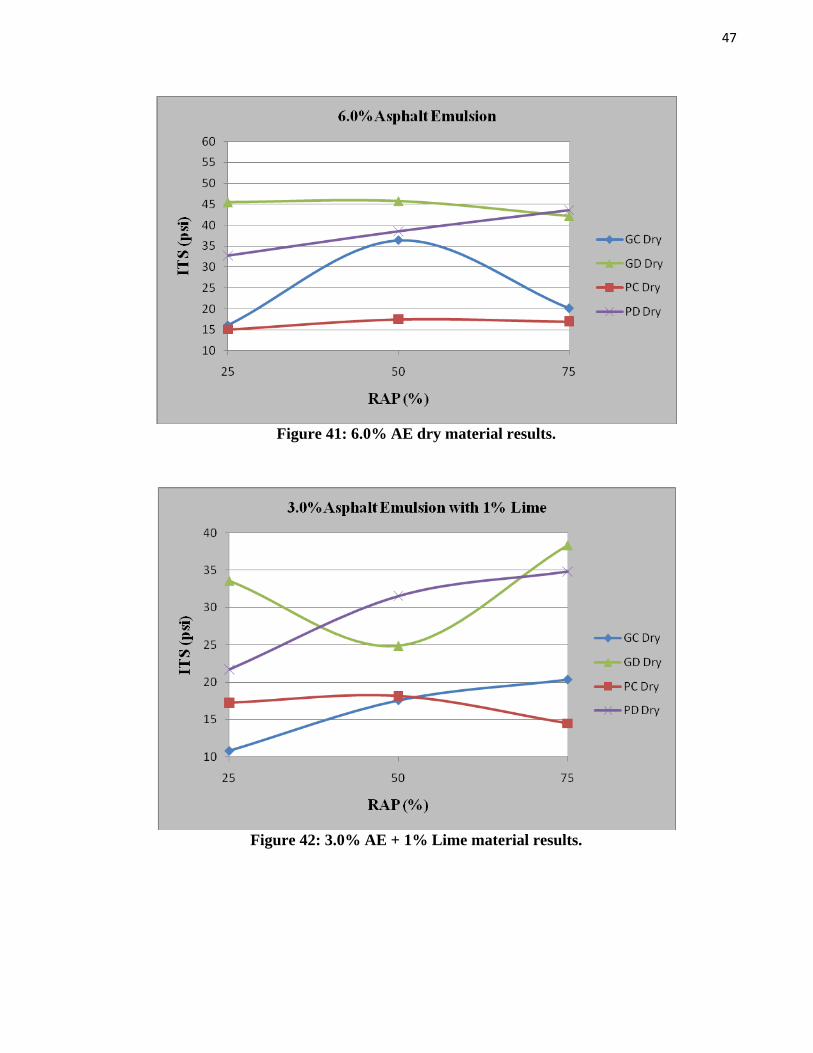
47
Figure 41: 6.0% AE dry material results.
Figure 42: 3.0% AE + 1% Lime material results.
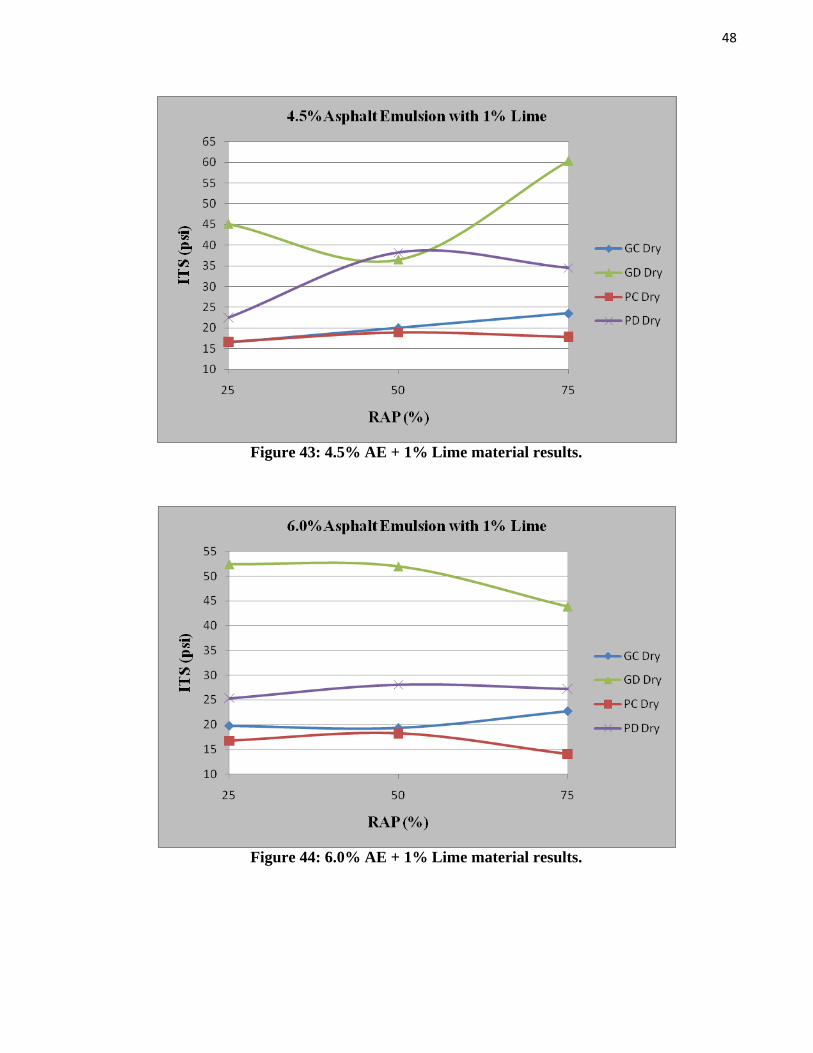
48
Figure 43: 4.5% AE + 1% Lime material results.
Figure 44: 6.0% AE + 1% Lime material results.
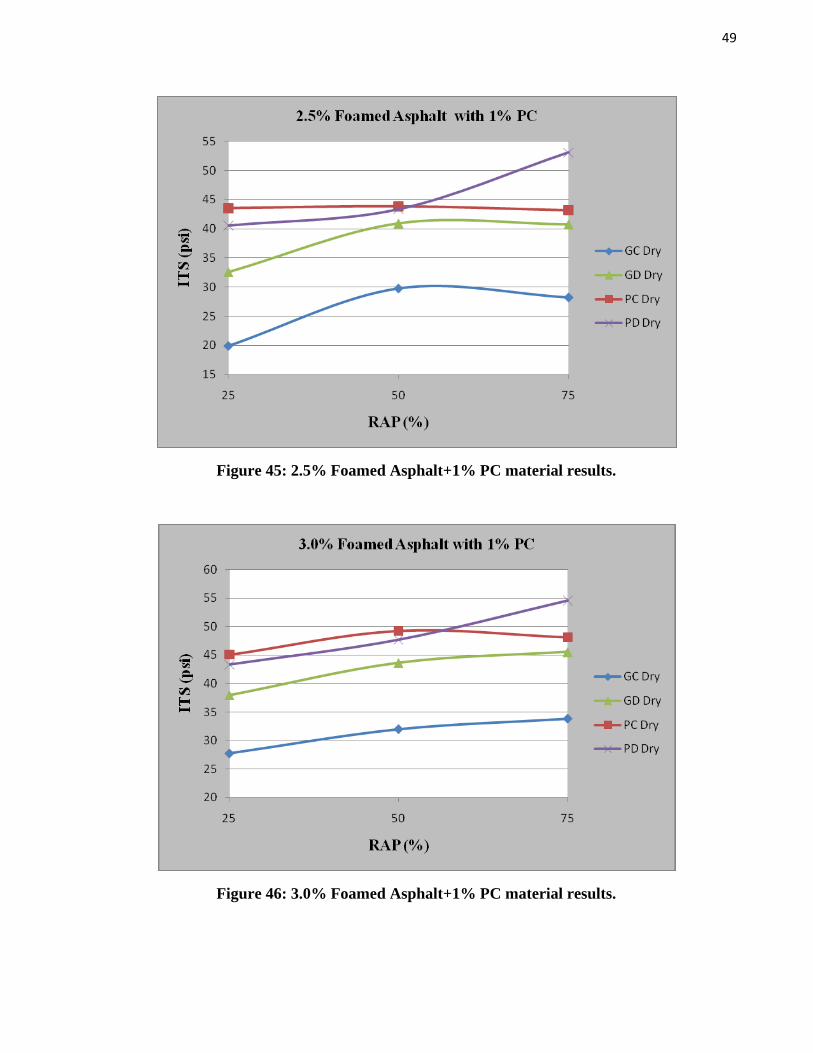
49
Figure 45: 2.5% Foamed Asphalt+1% PC material results.
Figure 46: 3.0% Foamed Asphalt+1% PC material results.

50
Figure 47: 3.5% Foamed Asphalt +1% PC material results.
Figure 48: 2.5% Foamed Asphalt +2% PC material results.
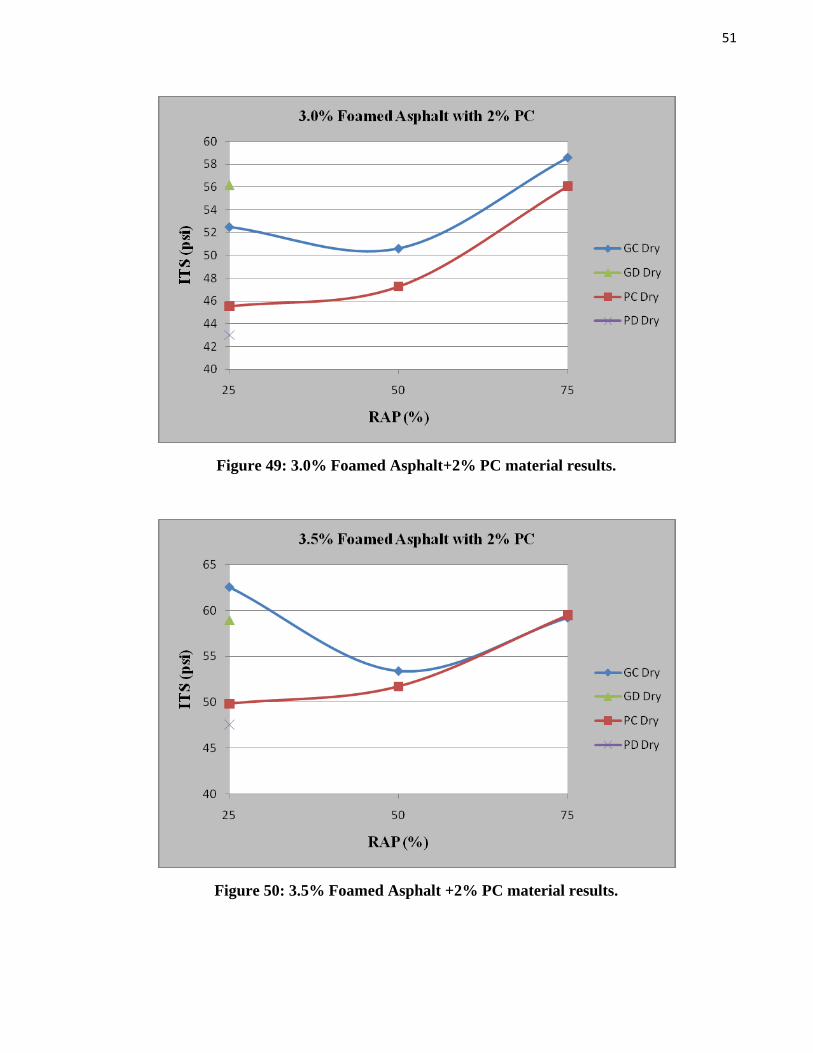
51
Figure 49: 3.0% Foamed Asphalt+2% PC material results.
Figure 50: 3.5% Foamed Asphalt +2% PC material results.
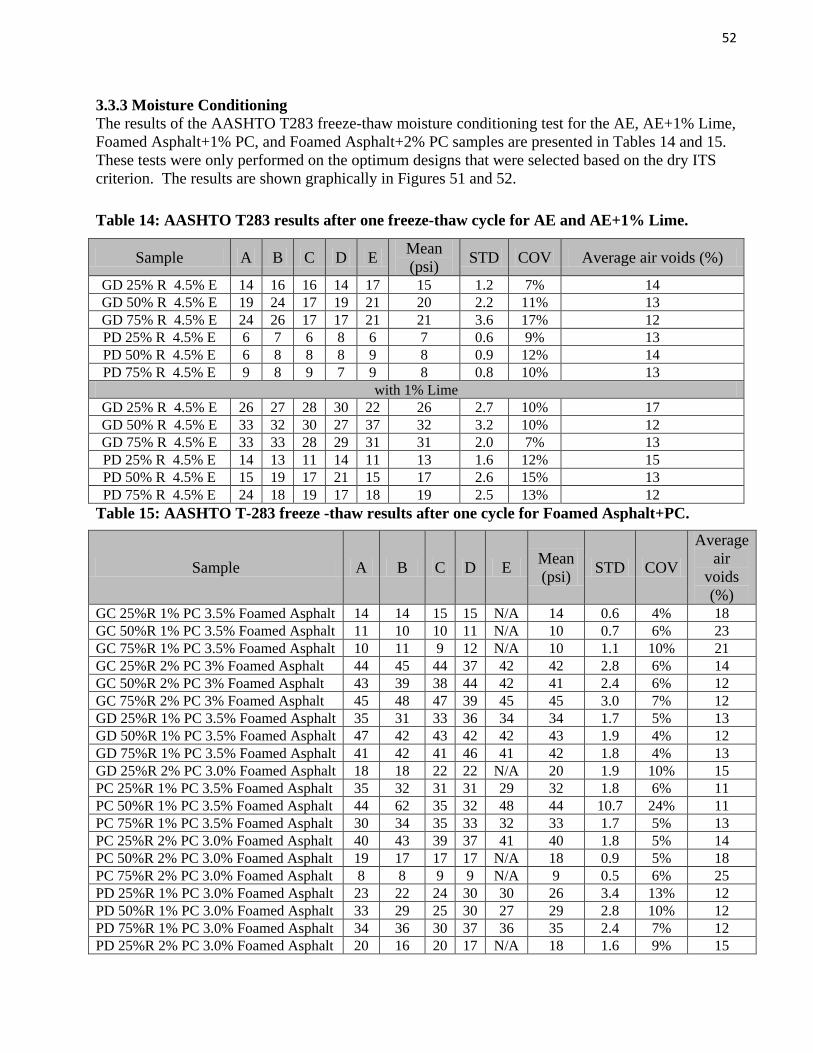
52
3.3.3 Moisture Conditioning The results of the AASHTO T283 freeze-thaw moisture conditioning test for the AE, AE+1% Lime, Foamed Asphalt+1% PC, and Foamed Asphalt+2% PC samples are presented in Tables 14 and 15. These tests were only performed on the optimum designs that were selected based on the dry ITS criterion. The results are shown graphically in Figures 51 and 52.
Table 14: AASHTO T283 results after one freeze-thaw cycle for AE and AE+1% Lime.
Table 15: AASHTO T-283 freeze -thaw results after one cycle for Foamed Asphalt+PC.
Sample A B C D E Mean (psi) STD COV
Average air
voids (%)
GC 25%R 1% PC 3.5% Foamed Asphalt 14 14 15 15 N/A 14 0.6 4% 18 GC 50%R 1% PC 3.5% Foamed Asphalt 11 10 10 11 N/A 10 0.7 6% 23 GC 75%R 1% PC 3.5% Foamed Asphalt 10 11 9 12 N/A 10 1.1 10% 21 GC 25%R 2% PC 3% Foamed Asphalt 44 45 44 37 42 42 2.8 6% 14 GC 50%R 2% PC 3% Foamed Asphalt 43 39 38 44 42 41 2.4 6% 12 GC 75%R 2% PC 3% Foamed Asphalt 45 48 47 39 45 45 3.0 7% 12 GD 25%R 1% PC 3.5% Foamed Asphalt 35 31 33 36 34 34 1.7 5% 13 GD 50%R 1% PC 3.5% Foamed Asphalt 47 42 43 42 42 43 1.9 4% 12 GD 75%R 1% PC 3.5% Foamed Asphalt 41 42 41 46 41 42 1.8 4% 13 GD 25%R 2% PC 3.0% Foamed Asphalt 18 18 22 22 N/A 20 1.9 10% 15 PC 25%R 1% PC 3.5% Foamed Asphalt 35 32 31 31 29 32 1.8 6% 11 PC 50%R 1% PC 3.5% Foamed Asphalt 44 62 35 32 48 44 10.7 24% 11 PC 75%R 1% PC 3.5% Foamed Asphalt 30 34 35 33 32 33 1.7 5% 13 PC 25%R 2% PC 3.0% Foamed Asphalt 40 43 39 37 41 40 1.8 5% 14 PC 50%R 2% PC 3.0% Foamed Asphalt 19 17 17 17 N/A 18 0.9 5% 18 PC 75%R 2% PC 3.0% Foamed Asphalt 8 8 9 9 N/A 9 0.5 6% 25 PD 25%R 1% PC 3.0% Foamed Asphalt 23 22 24 30 30 26 3.4 13% 12 PD 50%R 1% PC 3.0% Foamed Asphalt 33 29 25 30 27 29 2.8 10% 12 PD 75%R 1% PC 3.0% Foamed Asphalt 34 36 30 37 36 35 2.4 7% 12 PD 25%R 2% PC 3.0% Foamed Asphalt 20 16 20 17 N/A 18 1.6 9% 15
Sample A B C D E Mean (psi) STD COV Average air voids (%)
GD 25% R 4.5% E 14 16 16 14 17 15 1.2 7% 14 GD 50% R 4.5% E 19 24 17 19 21 20 2.2 11% 13 GD 75% R 4.5% E 24 26 17 17 21 21 3.6 17% 12 PD 25% R 4.5% E 6 7 6 8 6 7 0.6 9% 13 PD 50% R 4.5% E 6 8 8 8 9 8 0.9 12% 14 PD 75% R 4.5% E 9 8 9 7 9 8 0.8 10% 13
with 1% Lime GD 25% R 4.5% E 26 27 28 30 22 26 2.7 10% 17 GD 50% R 4.5% E 33 32 30 27 37 32 3.2 10% 12 GD 75% R 4.5% E 33 33 28 29 31 31 2.0 7% 13 PD 25% R 4.5% E 14 13 11 14 11 13 1.6 12% 15 PD 50% R 4.5% E 15 19 17 21 15 17 2.6 15% 13 PD 75% R 4.5% E 24 18 19 17 18 19 2.5 13% 12

53
Figure 51: AASHTO T283 Freeze-thaw AE one cycle results.
Figure 52: AASHTO T283 Freeze-thaw Foamed Asphalt + PC one cycle results.
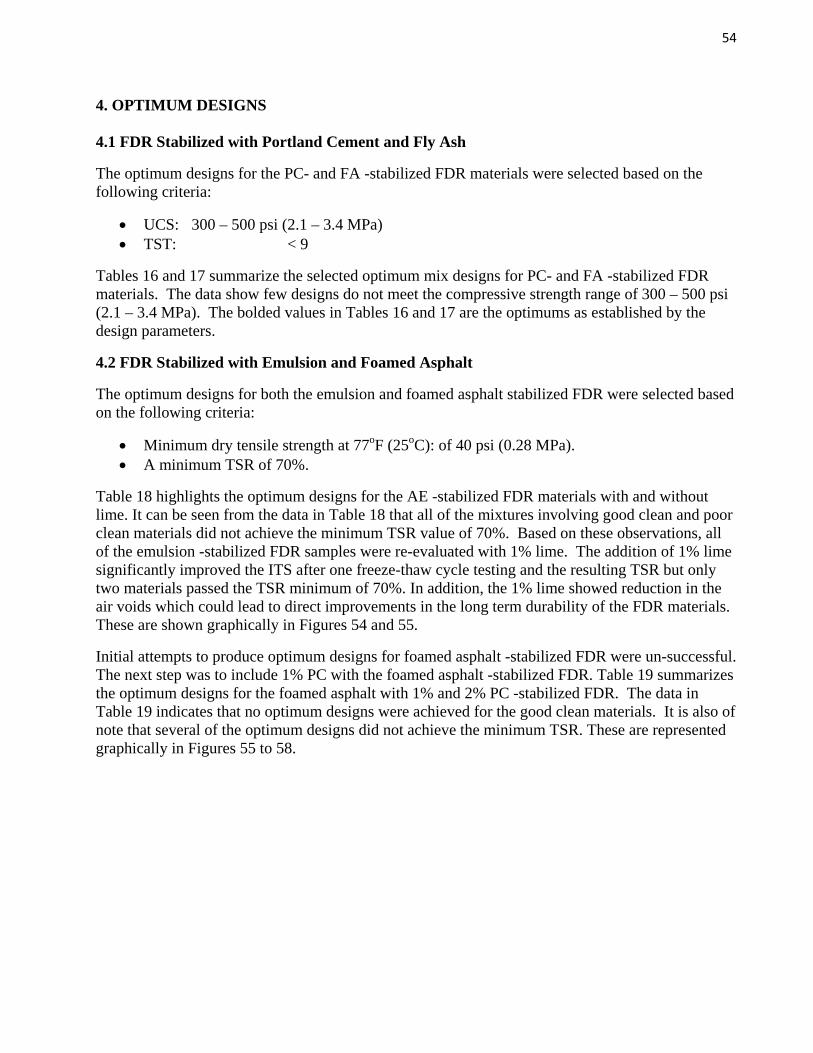
54
4. OPTIMUM DESIGNS 4.1 FDR Stabilized with Portland Cement and Fly Ash
The optimum designs for the PC- and FA -stabilized FDR materials were selected based on the following criteria:
• UCS: 300 – 500 psi (2.1 – 3.4 MPa) • TST: < 9
Tables 16 and 17 summarize the selected optimum mix designs for PC- and FA -stabilized FDR materials. The data show few designs do not meet the compressive strength range of 300 – 500 psi (2.1 – 3.4 MPa). The bolded values in Tables 16 and 17 are the optimums as established by the design parameters.
4.2 FDR Stabilized with Emulsion and Foamed Asphalt
The optimum designs for both the emulsion and foamed asphalt stabilized FDR were selected based on the following criteria:
• Minimum dry tensile strength at 77oF (25oC): of 40 psi (0.28 MPa). • A minimum TSR of 70%.
Table 18 highlights the optimum designs for the AE -stabilized FDR materials with and without lime. It can be seen from the data in Table 18 that all of the mixtures involving good clean and poor clean materials did not achieve the minimum TSR value of 70%. Based on these observations, all of the emulsion -stabilized FDR samples were re-evaluated with 1% lime. The addition of 1% lime significantly improved the ITS after one freeze-thaw cycle testing and the resulting TSR but only two materials passed the TSR minimum of 70%. In addition, the 1% lime showed reduction in the air voids which could lead to direct improvements in the long term durability of the FDR materials. These are shown graphically in Figures 54 and 55.
Initial attempts to produce optimum designs for foamed asphalt -stabilized FDR were un-successful. The next step was to include 1% PC with the foamed asphalt -stabilized FDR. Table 19 summarizes the optimum designs for the foamed asphalt with 1% and 2% PC -stabilized FDR. The data in Table 19 indicates that no optimum designs were achieved for the good clean materials. It is also of note that several of the optimum designs did not achieve the minimum TSR. These are represented graphically in Figures 55 to 58.
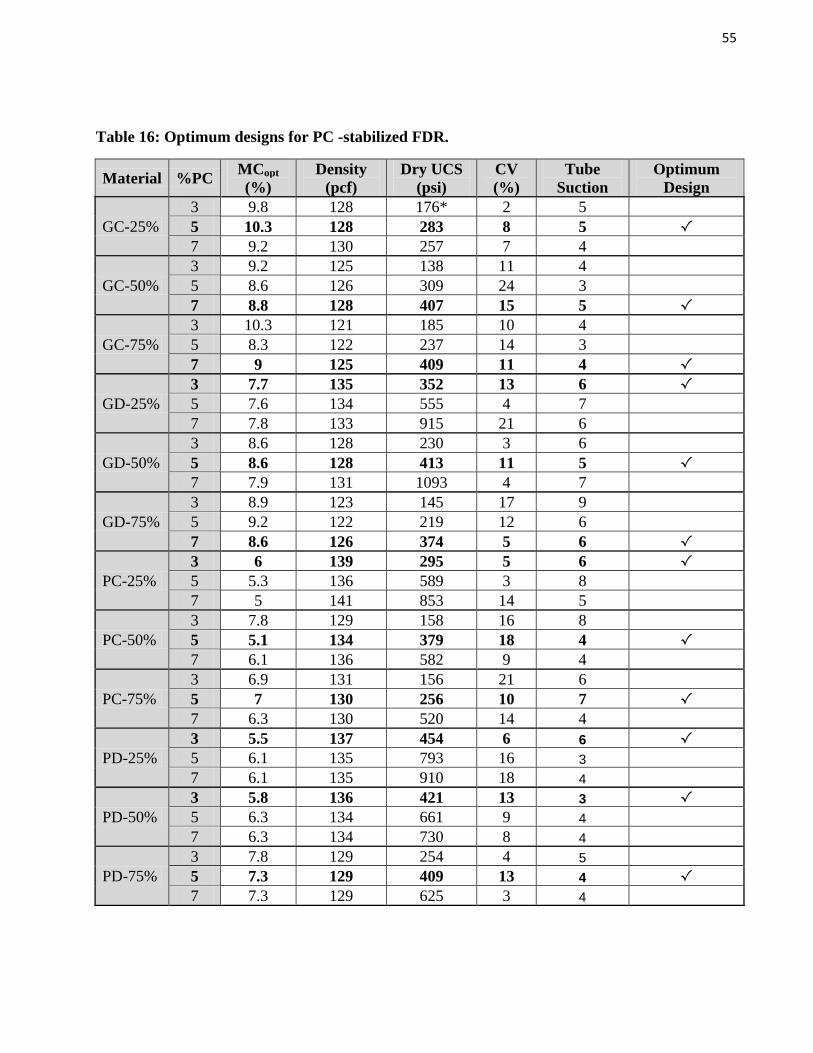
55
Table 16: Optimum designs for PC -stabilized FDR.
Material %PC MCopt (%)
Density (pcf)
Dry UCS (psi)
CV (%)
Tube Suction
Optimum Design
GC-25% 3 9.8 128 176* 2 5 5 10.3 128 283 8 5 √ 7 9.2 130 257 7 4
GC-50% 3 9.2 125 138 11 4 5 8.6 126 309 24 3 7 8.8 128 407 15 5 √
GC-75% 3 10.3 121 185 10 4 5 8.3 122 237 14 3 7 9 125 409 11 4 √
GD-25% 3 7.7 135 352 13 6 √ 5 7.6 134 555 4 7 7 7.8 133 915 21 6
GD-50% 3 8.6 128 230 3 6 5 8.6 128 413 11 5 √ 7 7.9 131 1093 4 7
GD-75% 3 8.9 123 145 17 9 5 9.2 122 219 12 6 7 8.6 126 374 5 6 √
PC-25% 3 6 139 295 5 6 √ 5 5.3 136 589 3 8 7 5 141 853 14 5
PC-50% 3 7.8 129 158 16 8 5 5.1 134 379 18 4 √ 7 6.1 136 582 9 4
PC-75% 3 6.9 131 156 21 6 5 7 130 256 10 7 √ 7 6.3 130 520 14 4
PD-25% 3 5.5 137 454 6 6 √ 5 6.1 135 793 16 3 7 6.1 135 910 18 4
PD-50% 3 5.8 136 421 13 3 √ 5 6.3 134 661 9 4 7 6.3 134 730 8 4
PD-75% 3 7.8 129 254 4 5 5 7.3 129 409 13 4 √ 7 7.3 129 625 3 4
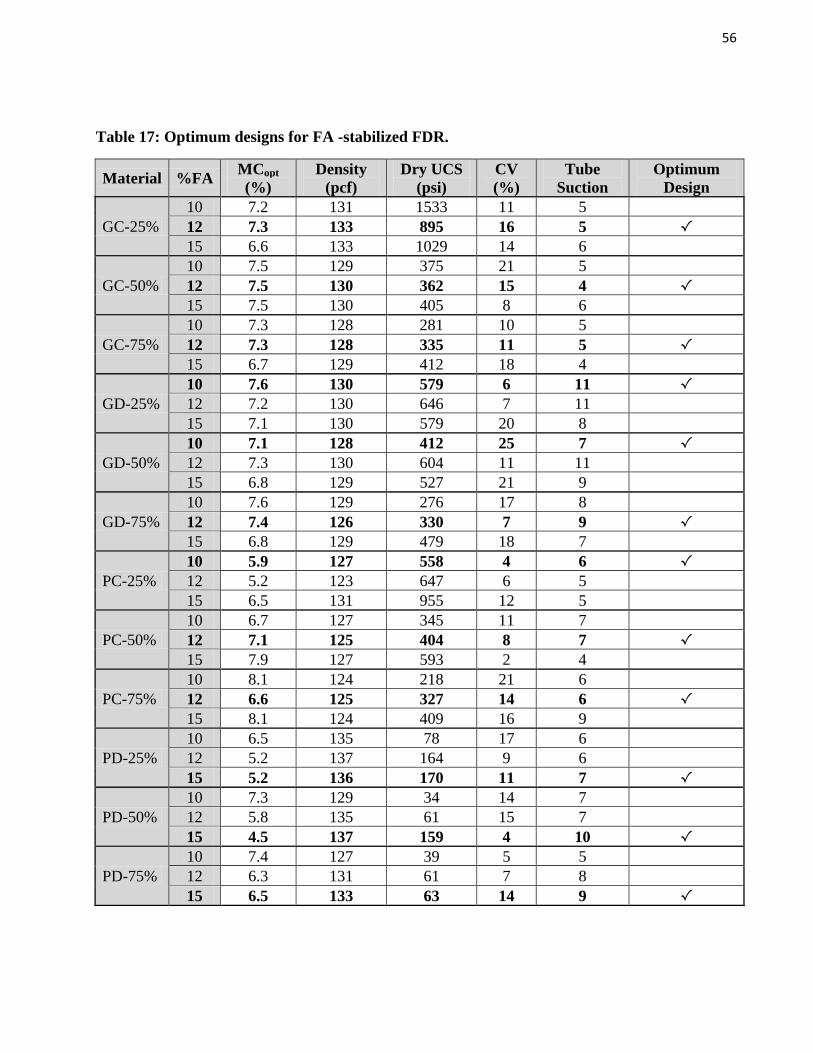
56
Table 17: Optimum designs for FA -stabilized FDR.
Material %FA MCopt (%)
Density (pcf)
Dry UCS (psi)
CV (%)
Tube Suction
Optimum Design
GC-25% 10 7.2 131 1533 11 5 12 7.3 133 895 16 5 √ 15 6.6 133 1029 14 6
GC-50% 10 7.5 129 375 21 5 12 7.5 130 362 15 4 √ 15 7.5 130 405 8 6
GC-75% 10 7.3 128 281 10 5 12 7.3 128 335 11 5 √ 15 6.7 129 412 18 4
GD-25% 10 7.6 130 579 6 11 √ 12 7.2 130 646 7 11 15 7.1 130 579 20 8
GD-50% 10 7.1 128 412 25 7 √ 12 7.3 130 604 11 11 15 6.8 129 527 21 9
GD-75% 10 7.6 129 276 17 8 12 7.4 126 330 7 9 √ 15 6.8 129 479 18 7
PC-25% 10 5.9 127 558 4 6 √ 12 5.2 123 647 6 5 15 6.5 131 955 12 5
PC-50% 10 6.7 127 345 11 7 12 7.1 125 404 8 7 √ 15 7.9 127 593 2 4
PC-75% 10 8.1 124 218 21 6 12 6.6 125 327 14 6 √ 15 8.1 124 409 16 9
PD-25% 10 6.5 135 78 17 6 12 5.2 137 164 9 6 15 5.2 136 170 11 7 √
PD-50% 10 7.3 129 34 14 7 12 5.8 135 61 15 7 15 4.5 137 159 4 10 √
PD-75% 10 7.4 127 39 5 5 12 6.3 131 61 7 8 15 6.5 133 63 14 9 √

57
Table 18: Optimum designs for AE- and AE+1%Lime-stabilized FDR.
Asphalt Emulsion
Material ITS dry ITS dry +1% Lime
ITS after Freeze-Thaw
ITS after Freeze- Thaw +1% Lime TSR TSR
+1%Lime GD-25% 41 45 15 26 38% 59% GD-50% 47 37 20 32 43% 86% GD-75% 46 44 21 31 45% 70% PD-25% 30 22 7 13 22% 57% PD-50% 50 38 8 17 15% 45% PD-75% 51 34 8 19 16% 57%
Figure 53: Good dirty AE and AE+1% Lime material results.
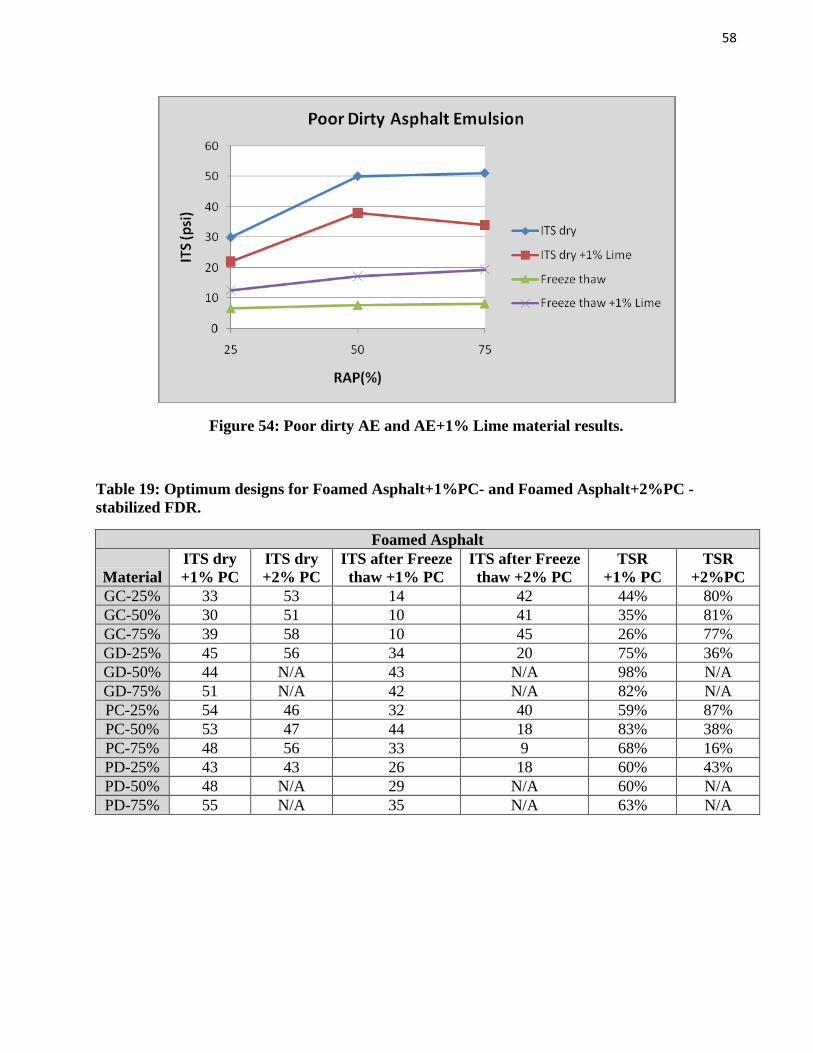
58
Figure 54: Poor dirty AE and AE+1% Lime material results.
Table 19: Optimum designs for Foamed Asphalt+1%PC- and Foamed Asphalt+2%PC -stabilized FDR.
Foamed Asphalt
Material ITS dry +1% PC
ITS dry +2% PC
ITS after Freeze thaw +1% PC
ITS after Freeze thaw +2% PC
TSR +1% PC
TSR +2%PC
GC-25% 33 53 14 42 44% 80% GC-50% 30 51 10 41 35% 81% GC-75% 39 58 10 45 26% 77% GD-25% 45 56 34 20 75% 36% GD-50% 44 N/A 43 N/A 98% N/A GD-75% 51 N/A 42 N/A 82% N/A PC-25% 54 46 32 40 59% 87% PC-50% 53 47 44 18 83% 38% PC-75% 48 56 33 9 68% 16% PD-25% 43 43 26 18 60% 43% PD-50% 48 N/A 29 N/A 60% N/A PD-75% 55 N/A 35 N/A 63% N/A
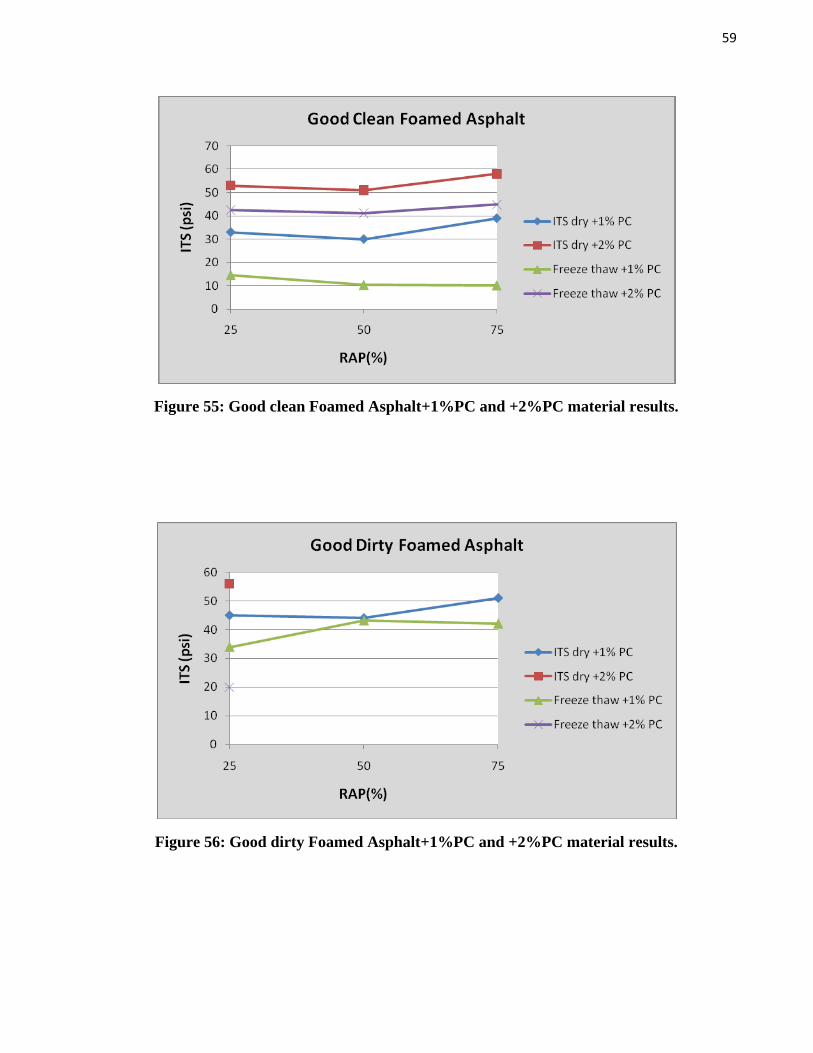
59
Figure 55: Good clean Foamed Asphalt+1%PC and +2%PC material results.
Figure 56: Good dirty Foamed Asphalt+1%PC and +2%PC material results.
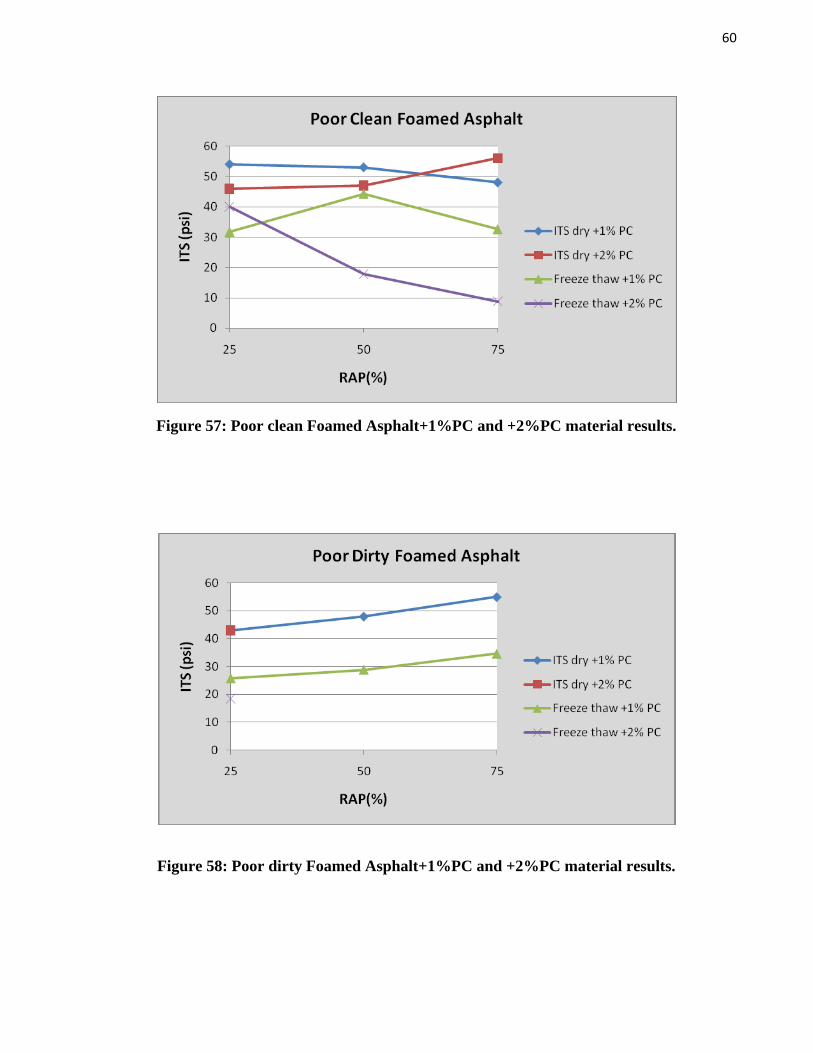
60
Figure 57: Poor clean Foamed Asphalt+1%PC and +2%PC material results.
Figure 58: Poor dirty Foamed Asphalt+1%PC and +2%PC material results.

61
5. SUMMARY AND RECOMMENDATIONS The objective of this task is to develop a mix design procedure for FDR. Due to the large variations among the various types of FDR stabilizers, a separate mix design method was developed for each type of FDR. The following represents a summary of the processes that were used in the mix design for each FDR type.
5.1 Unstabilized FDR The following steps were used in the mix design for unstabilized FDR:
• Moisture-Density Curve: the modified Proctor test (ASTM D1557) was used to establish the moisture-density relationship for each combination of the unstabilized FDR. The optimum MC and maximum dry density values were identified from the developed Moisture Density Curves. The GC gradation was more difficult to control than the other materials due to its low fines content. No modifications were necessary for the ASTM D1557 when used with the unstabilized FDR with various levels of RAP.
• Strength Parameter: the MR as described in AASHTO T307 and the CBR as described in
ASTM D1883 were used to measure the strength properties of the unstabilized FDR with various levels of RAP. The correlations between the MR and CBR values were very weak which led to the recommendation to use the MR as the strength property for the unstabilized FDR. No modifications were necessary for AASHTO T307 and ASTM D1883 when used with the unstabilized FDR with various levels of RAP.
• Table 4 summarizes the overall properties of the unstabilized FDR mixtures that were evaluated in this research. No mix design criteria were necessary for the unstabilized FDR. The MR properties of the various mixtures seem to be reasonable for a base course layer in a flexible pavement.
5.2 FDR Stabilized with PC and FA
The following steps were used in the mix design for FDR stabilized with PC and FA:
• Moisture Density Curve: the same Moisture Density Curves that were developed for the unstabilized FDR were also used for the FDR stabilized with PC and FA. In other words, the same optimum MC and maximum dry density values for each combination of unstabilized FDR and RAP materials were used for the FDR stabilized with PC and FA at the similar RAP contents.
• Strength Parameter: UCS as specified in ASTM D1633 was used to measure the strength
properties of the FDR stabilized with PC and FA. The UCS samples were fabricated following ASTM D1633 and ASTM C593 for FDR stabilized with PC and FA, respectively. No modifications were necessary for ASTM D1633 and C593 standards when used with the FDR stabilized with PC and FA with various levels of RAP. The degree of variability of the measured compressive strength based on three replicate samples was acceptable.
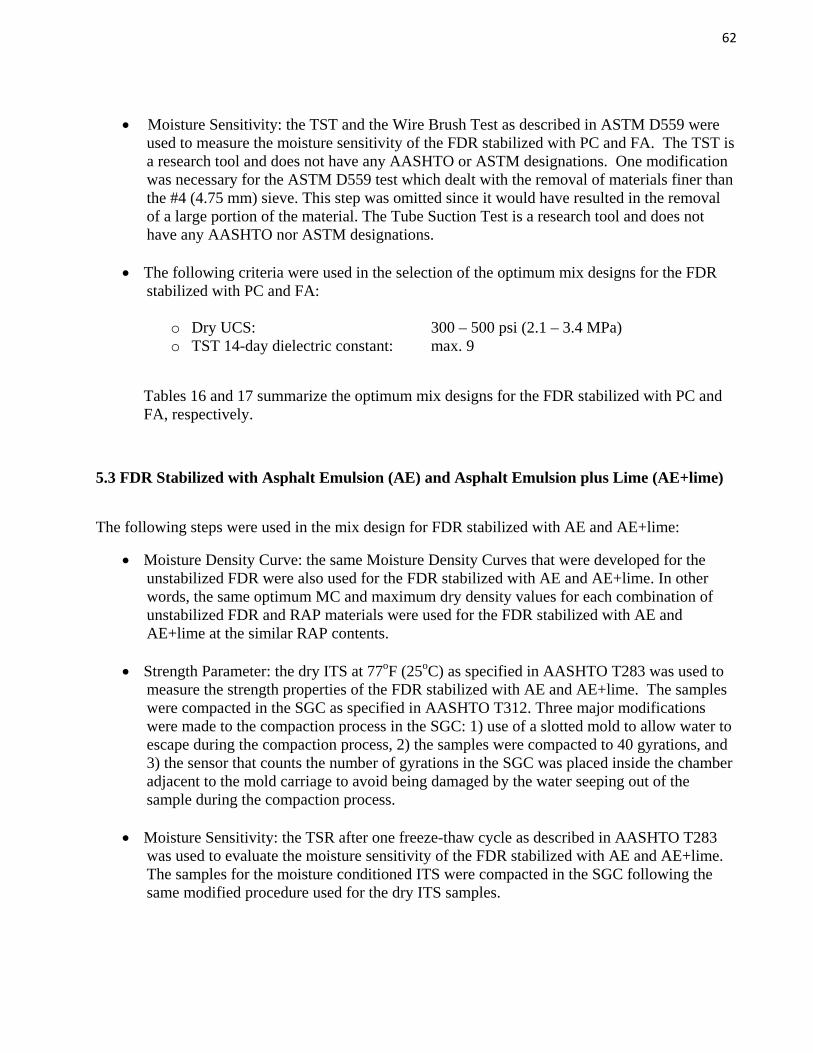
62
• Moisture Sensitivity: the TST and the Wire Brush Test as described in ASTM D559 were
used to measure the moisture sensitivity of the FDR stabilized with PC and FA. The TST is a research tool and does not have any AASHTO or ASTM designations. One modification was necessary for the ASTM D559 test which dealt with the removal of materials finer than the #4 (4.75 mm) sieve. This step was omitted since it would have resulted in the removal of a large portion of the material. The Tube Suction Test is a research tool and does not have any AASHTO nor ASTM designations.
• The following criteria were used in the selection of the optimum mix designs for the FDR stabilized with PC and FA:
o Dry UCS: 300 – 500 psi (2.1 – 3.4 MPa) o TST 14-day dielectric constant: max. 9
Tables 16 and 17 summarize the optimum mix designs for the FDR stabilized with PC and FA, respectively.
5.3 FDR Stabilized with Asphalt Emulsion (AE) and Asphalt Emulsion plus Lime (AE+lime)
The following steps were used in the mix design for FDR stabilized with AE and AE+lime:
• Moisture Density Curve: the same Moisture Density Curves that were developed for the unstabilized FDR were also used for the FDR stabilized with AE and AE+lime. In other words, the same optimum MC and maximum dry density values for each combination of unstabilized FDR and RAP materials were used for the FDR stabilized with AE and AE+lime at the similar RAP contents.
• Strength Parameter: the dry ITS at 77oF (25oC) as specified in AASHTO T283 was used to
measure the strength properties of the FDR stabilized with AE and AE+lime. The samples were compacted in the SGC as specified in AASHTO T312. Three major modifications were made to the compaction process in the SGC: 1) use of a slotted mold to allow water to escape during the compaction process, 2) the samples were compacted to 40 gyrations, and 3) the sensor that counts the number of gyrations in the SGC was placed inside the chamber adjacent to the mold carriage to avoid being damaged by the water seeping out of the sample during the compaction process.
• Moisture Sensitivity: the TSR after one freeze-thaw cycle as described in AASHTO T283 was used to evaluate the moisture sensitivity of the FDR stabilized with AE and AE+lime. The samples for the moisture conditioned ITS were compacted in the SGC following the same modified procedure used for the dry ITS samples.

63
• The following criteria were used in the selection of the optimum mix designs for the FDR stabilized with AE and AE+lime:
o Dry ITS at 77oF (25oC): min. 30 psi (0.2 MPa) o TSR at 77oF (25oC): 70%
Tables 18 and 19 summarize the optimum mix designs for the FDR stabilized with AE and AE+lime, respectively.
5.4 FDR Stabilized with Foamed Asphalt plus Portland Cement (PC)
The following steps were used in the mix design for FDR stabilized with foamed asphalt + PC:
• Moisture Density Curve: the same Moisture Density Curves that were developed for the unstabilized FDR were also used for the FDR stabilized with foamed asphalt + PC. In other words, the same optimum MC and maximum dry density values for each combination of unstabilized FDR and RAP materials were used for the FDR stabilized with foamed asphalt + PC at the similar RAP contents.
• Strength Parameter: the dry ITS at 77oF (25oC) as specified in AASHTO T283 was used to
measure the strength properties of the FDR stabilized with foamed asphalt + PC. The samples were compacted in the SGC as specified in AASHTO T312. Three major modifications were made to the compaction process in the SGC: 1) use of a slotted mold to allow water to escape during the compaction process, 2) the samples were compacted to 40 gyrations, and 3) the sensor that counts the number of gyrations in the SGC was placed inside the chamber adjacent to the mold carriage to avoid being damaged by the water seeping out of the sample during the compaction process.
• Moisture Sensitivity: the TSR after one freeze-thaw cycle as described in AASHTO T283 was used to evaluate the moisture sensitivity of the FDR stabilized with foamed asphalt + PC. The samples for the moisture conditioned ITS were compacted in the SGC following the same modified procedure used for the dry ITS samples.
• The following criteria were used in the selection of the optimum mix designs for the FDR stabilized with foamed asphalt + PC:
o Dry ITS at 77oF (25oC): min. 30 psi (0.2 MPa) o TSR at 77oF (25oC): 70%
Tables 20 and 21 summarize the optimum mix designs for the FDR stabilized with foamed asphalt + 1 % PC and foamed asphalt + 2 % PC, respectively.

64
6. REFERENCES
1. Barbu, Bogdan and Tom Scullion; “Repeatability and Reproducibility Study for Tube Suction Test”, FHWA, Report No. FHWA/TX-06/5-4114-01-1, January, 2006.
2. InstroTek, Inc.; “CoreLok Operator’s Guide”, July, 2003. 3. Pine Instrument Company; “Gyratory Compactor Operation Manual”, June, 1999. 4. Wirtgen America Company; “Foamed Bitumen Mix Design Procedure Using the Wirtgen
WLB 10”.
7. ACKNOWLEDGEMENTS The authors are grateful for the technical and financial supports provided by the Federal Highway Administration. The technical program monitor is Jason Harrington, Office of Pavement Technology. The following individuals have served as the Project Technical Panel members and provided valuable comments, suggestions, and review. Their contributions are greatly appreciated.
Randy Battey, Mississippi DOT Todd Casey, Base Construction Co. (ARRA) John Epps, Granite Construction, Inc. Joe Feller, SDDOT Gary Goff, FHWA ND Division David Gress, Univ. of New Hampshire Gregory Halsted, PCA (ARRA) Brett Hestdalen, FHWA SD Division John Huffman, Terex Roadbuilding (ARRA) Tim Kowalski, Wirtgen America David Lee, Univ. of Iowa Chuck Luedders, FHWA Direct Federal Lands Ken Skorseth, SDSU Ken Swedeen, Dakota Asphalt Pavement Association Todd Thomas, SemMaterials (ARRA) Mike Voth, Central Federal Lands Division, FHWA

65
Appendix A
Moisture -Density Curves
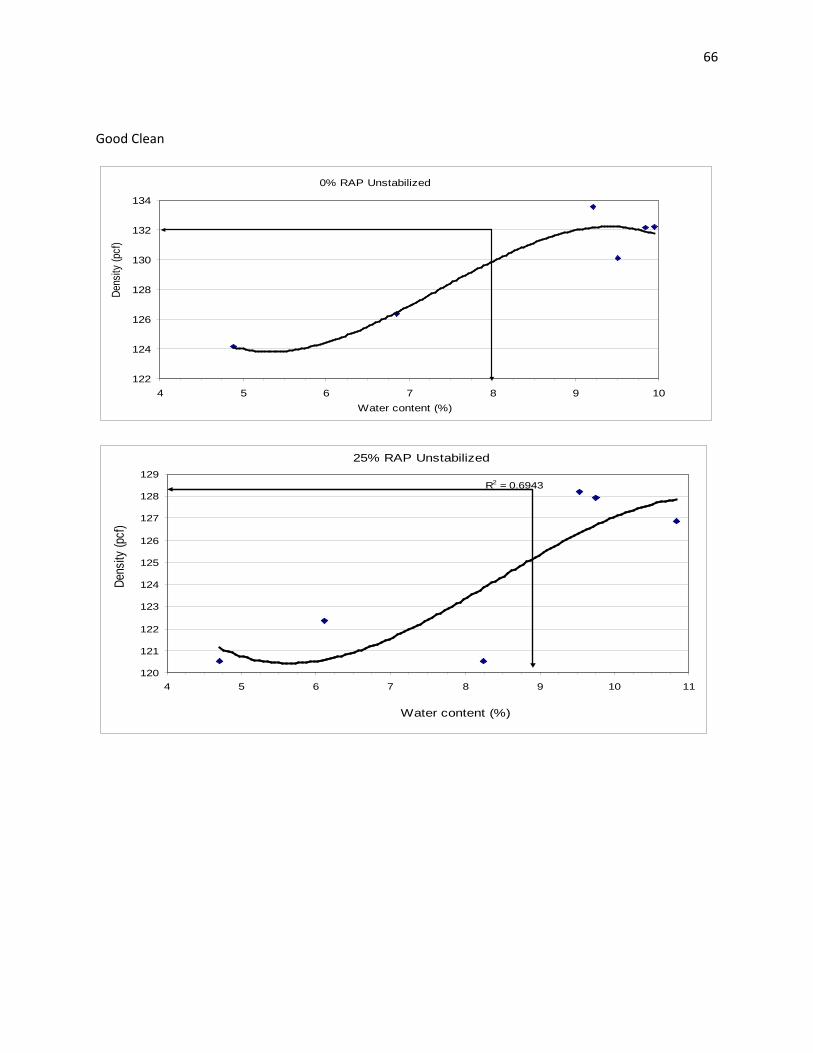
66
Good Clean
122
124
126
128
130
132
134
4 5 6 7 8 9 10
Dens
ity (p
cf)
Water content (%)
0% RAP Unstabilized
R2 = 0.6943
120
121
122
123
124
125
126
127
128
129
4 5 6 7 8 9 10 11
Dens
ity (p
cf)
Water content (%)
25% RAP Unstabilized
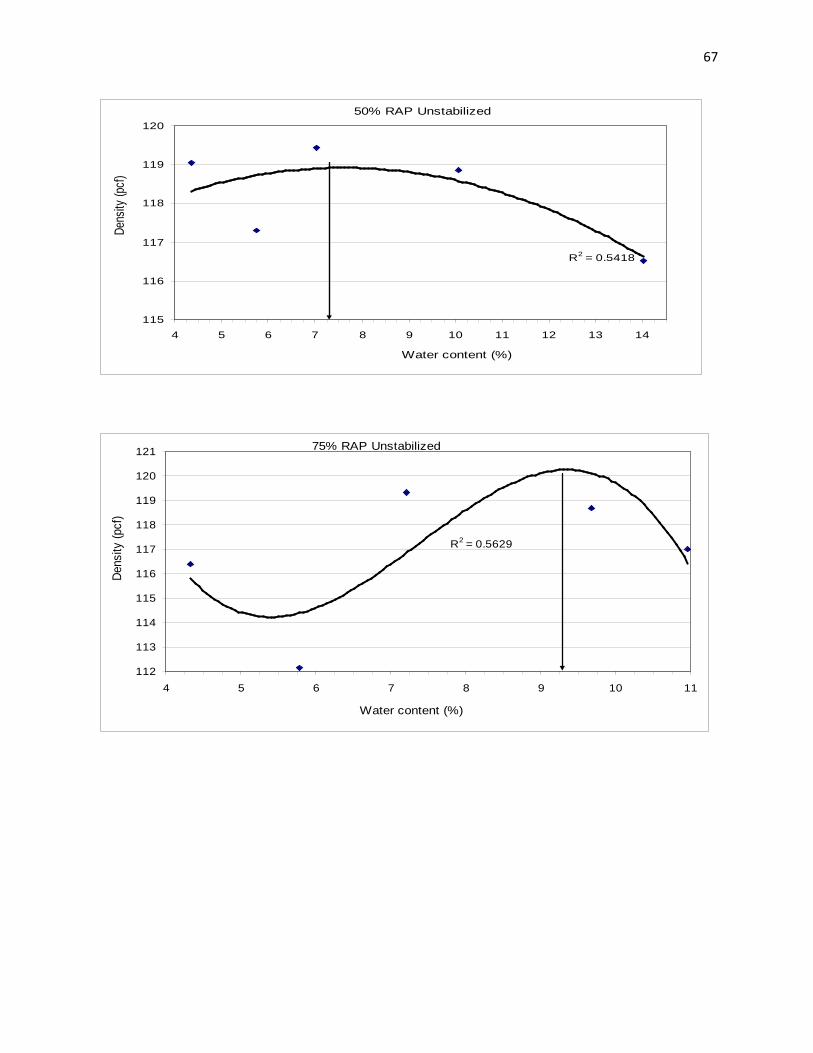
67
R2 = 0.5418
115
116
117
118
119
120
4 5 6 7 8 9 10 11 12 13 14
Dens
ity (p
cf)
Water content (%)
50% RAP Unstabilized
R2 = 0.5629
112
113
114
115
116
117
118
119
120
121
4 5 6 7 8 9 10 11
Dens
ity (p
cf)
Water content (%)
75% RAP Unstabilized
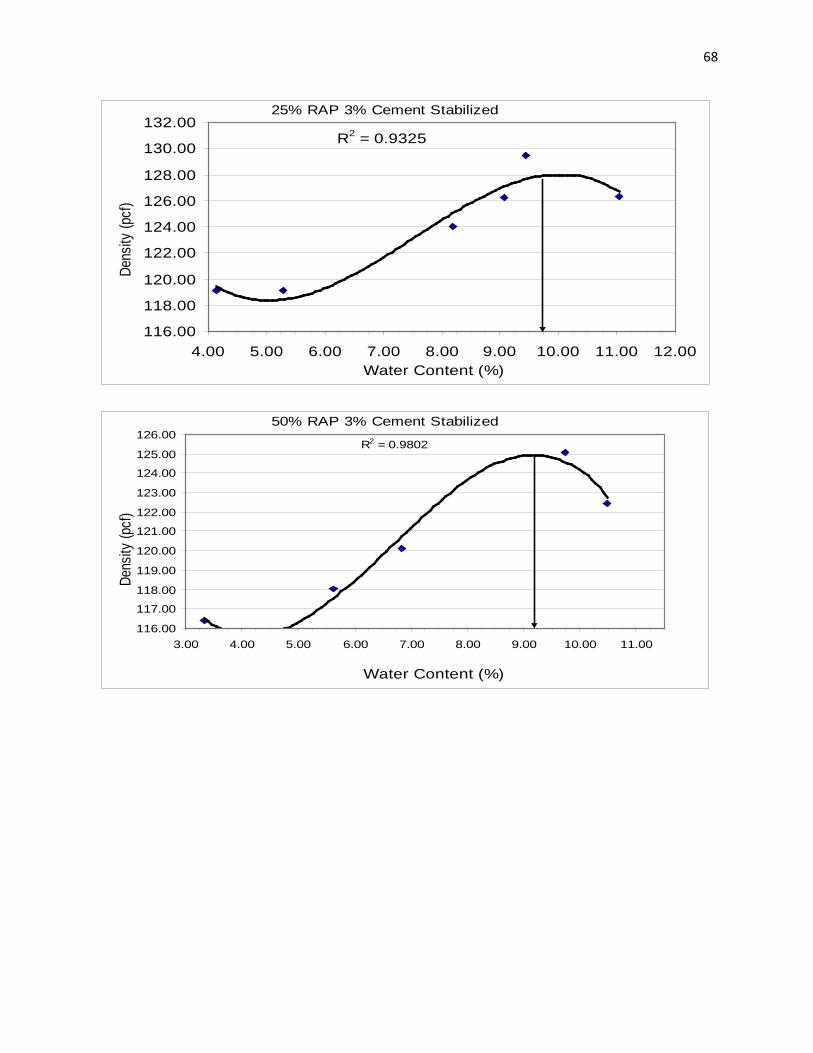
68
R2 = 0.9325
116.00
118.00
120.00
122.00
124.00
126.00
128.00
130.00
132.00
4.00 5.00 6.00 7.00 8.00 9.00 10.00 11.00 12.00
Dens
ity (p
cf)
25% RAP 3% Cement Stabilized
Water Content (%)
R2 = 0.9802
116.00
117.00
118.00
119.00
120.00
121.00
122.00
123.00
124.00
125.00
126.00
3.00 4.00 5.00 6.00 7.00 8.00 9.00 10.00 11.00
Dens
ity (p
cf)
50% RAP 3% Cement Stabilized
Water Content (%)

69
R2 = 0.9123
114
115
116
117
118
119
120
121
122
123
3 4 5 6 7 8 9 10 11 12
Dens
ity (p
cf)
75% RAP 3% Cement Stabilized
Water Content (%)
R2 = 0.6016
121122
123124125
126127128
129130
3 4 5 6 7 8 9 10 11
Dens
ity (p
cf)
25% RAP 5% Cement Stabilized
Water Content (%)

70
R2 = 0.9956
119
120
121
122
123
124
125
126
3 4 5 6 7 8 9 10 11
Dens
ity (p
cf)
50% RAP 5% Cement Stabilized
Water Content (%)
R2 = 0.6825
118119119120120121121122122123123124
2 3 4 5 6 7 8 9 10 11 12
Dens
ity (p
cf)
75% RAP 5% Cement Stabilized
Water Content (%)

71
R2 = 0.9729
121
122
123
124
125
126
127
128
129
130
131
4 5 6 7 8 9 10 11 12
Dens
ity (p
cf)
25% RAP 7% Cement Stabilized
Water Content (%)
R2 = 0.7541
117
119
121
123
125
127
129
131
3 4 5 6 7 8 9 10 11
Dens
ity (p
cf)
50% RAP 7% Cement Stabilized
Water Content (%)

72
R2 = 0.8485
118
119
120
121
122
123
124
125
126
3 4 5 6 7 8 9 10 11
Dens
ity (p
cf)
75% RAP 7% Cement Stabilized
Water Content (%)
R2 = 0.6815
123
125
127
129
131
133
135
4 5 6 7 8 9 10 11
Dens
ity (p
cf)
25% RAP 10% Fly Ash Stabilized
Water Content (%)

73
R2 = 0.7656
114
116
118
120
122
124
126
128
130
3 4 5 6 7 8 9 10 11
Dens
ity (p
cf)
50% RAP 10% Fly Ash Stabilized
Water Content (%)
R2 = 0.9172
113
115
117
119
121
123
125
127
129
3 4 5 6 7 8 9 10 11 12
Dens
ity (p
cf)
75% RAP 10% Fly Ash Stabilized
Water Content (%)
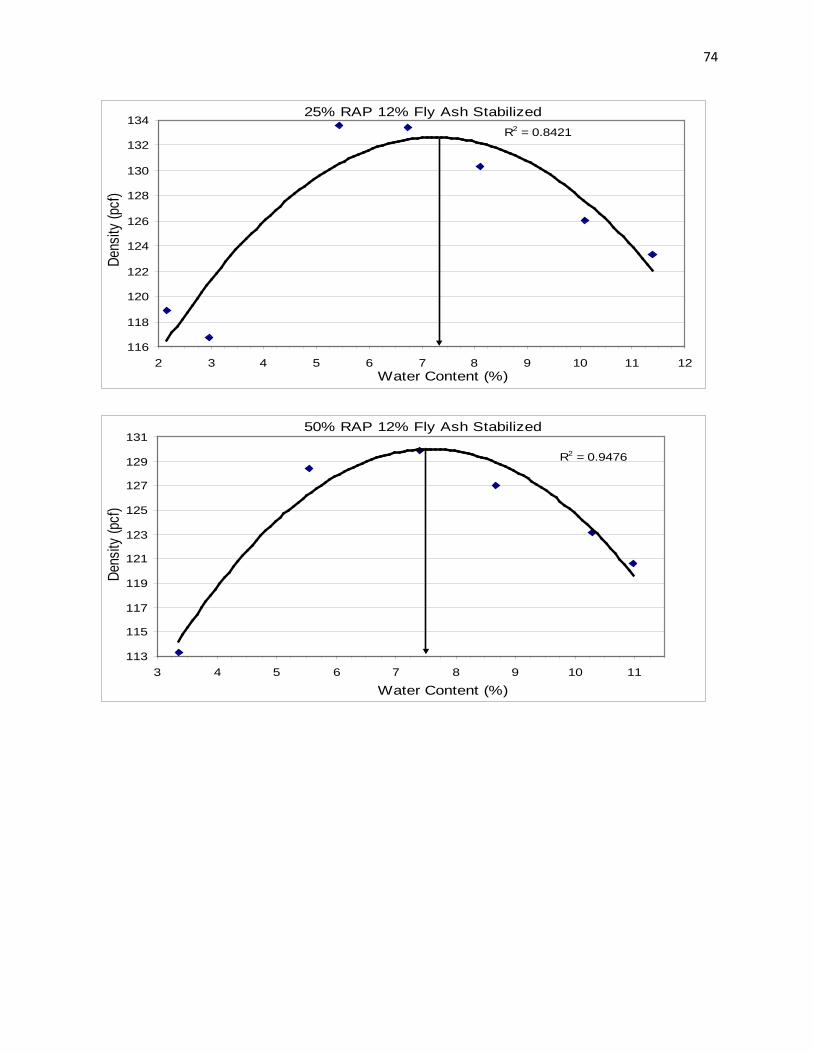
74
R2 = 0.8421
116
118
120
122
124
126
128
130
132
134
2 3 4 5 6 7 8 9 10 11 12
Dens
ity (p
cf)
25% RAP 12% Fly Ash Stabilized
Water Content (%)
R2 = 0.9476
113
115
117
119
121
123
125
127
129
131
3 4 5 6 7 8 9 10 11
Dens
ity (p
cf)
50% RAP 12% Fly Ash Stabilized
Water Content (%)
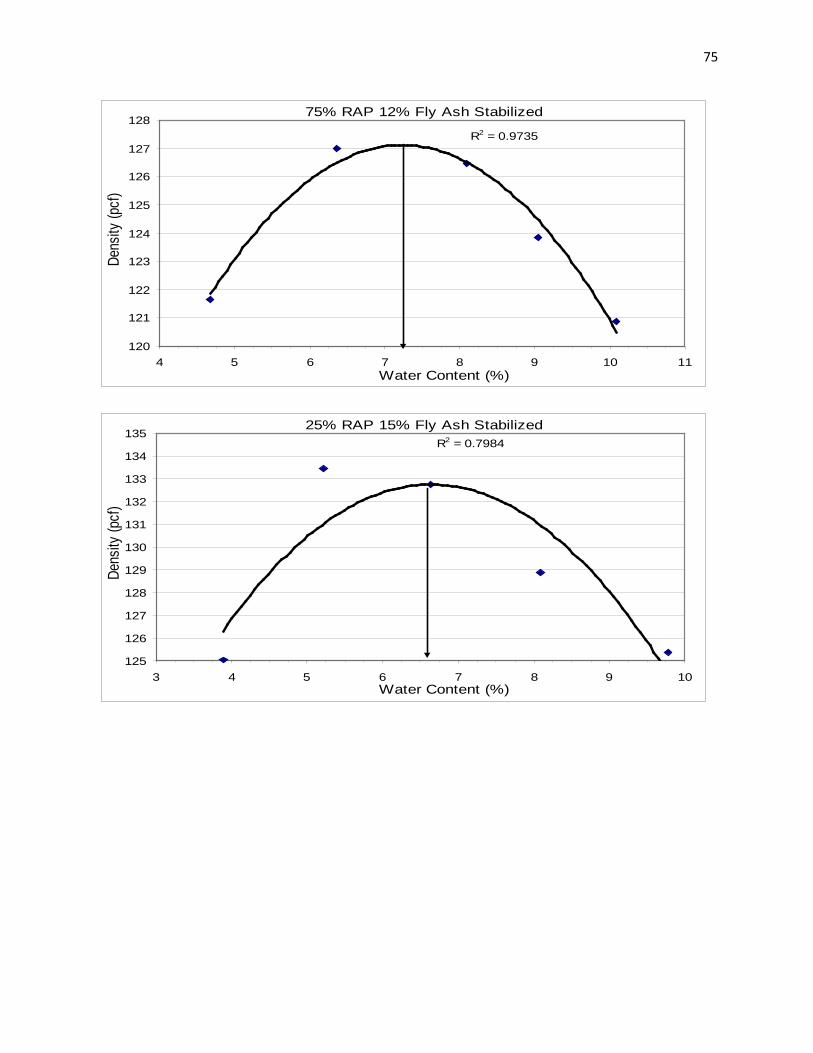
75
R2 = 0.9735
120
121
122
123
124
125
126
127
128
4 5 6 7 8 9 10 11
Dens
ity (p
cf)
75% RAP 12% Fly Ash Stabilized
Water Content (%)
R2 = 0.7984
125
126
127
128
129
130
131
132
133
134
135
3 4 5 6 7 8 9 10
Dens
ity (p
cf)
25% RAP 15% Fly Ash Stabilized
Water Content (%)
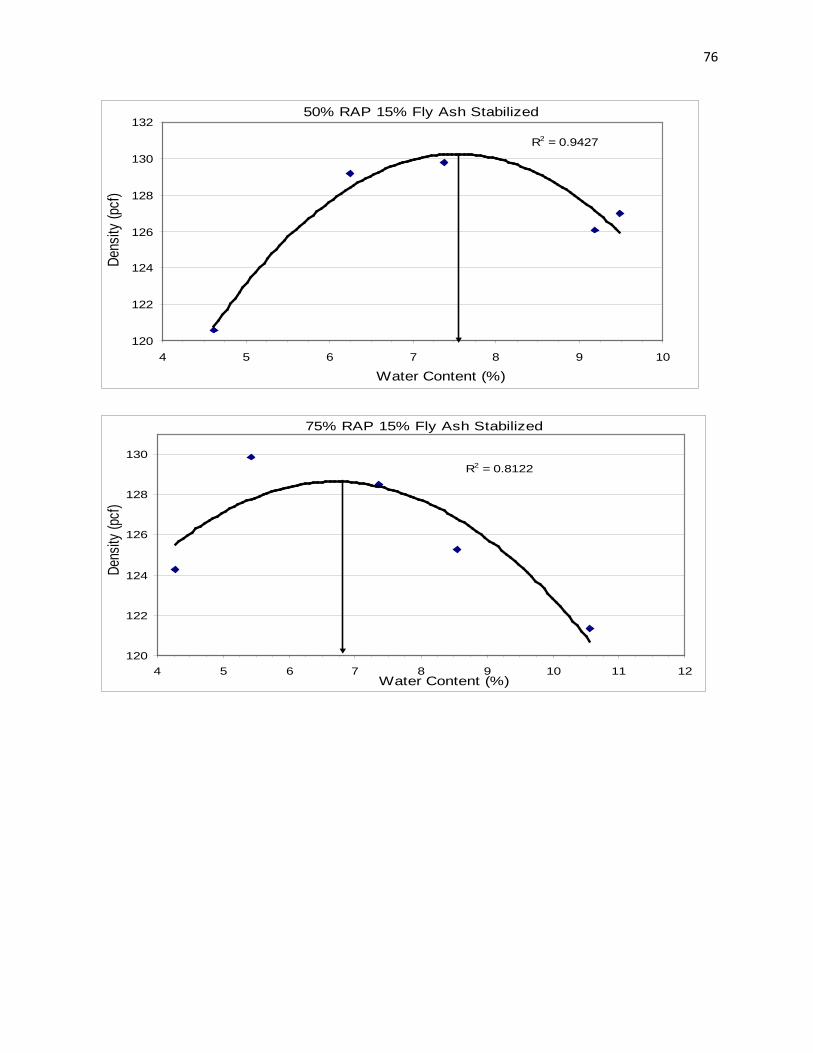
76
R2 = 0.9427
120
122
124
126
128
130
132
4 5 6 7 8 9 10
Dens
ity (p
cf)
50% RAP 15% Fly Ash Stabilized
Water Content (%)
R2 = 0.8122
120
122
124
126
128
130
4 5 6 7 8 9 10 11 12
Dens
ity (p
cf)
75% RAP 15% Fly Ash Stabilized
Water Content (%)

77
Good Dirty
R2 = 0.8111
130
131
132
133
134
135
136
137
5 6 7 8 9 10 11
Dens
ity (p
cf)
0% RAP Unstabilized
Water Content (%)
R2 = 0.9685
125
126
127
128
129
130
131
132
133
134
5 6 7 8 9 10 11
Dens
ity (p
cf)
25% RAP Unstabilized
Water Content (%)

78
R2 = 0.9007
120
121
122
123
124
125
126
127
128
129
130
3 4 5 6 7 8 9 10 11
Dens
ity (p
cf)
50% RAP Unstabilized
Water Content (%)
R2 = 0.7845
116
117
118
119
120
121
4 5 6 7 8 9 10 11 12 13
Dens
ity (p
cf)
75% RAP Unstabilized
Water Content (%)
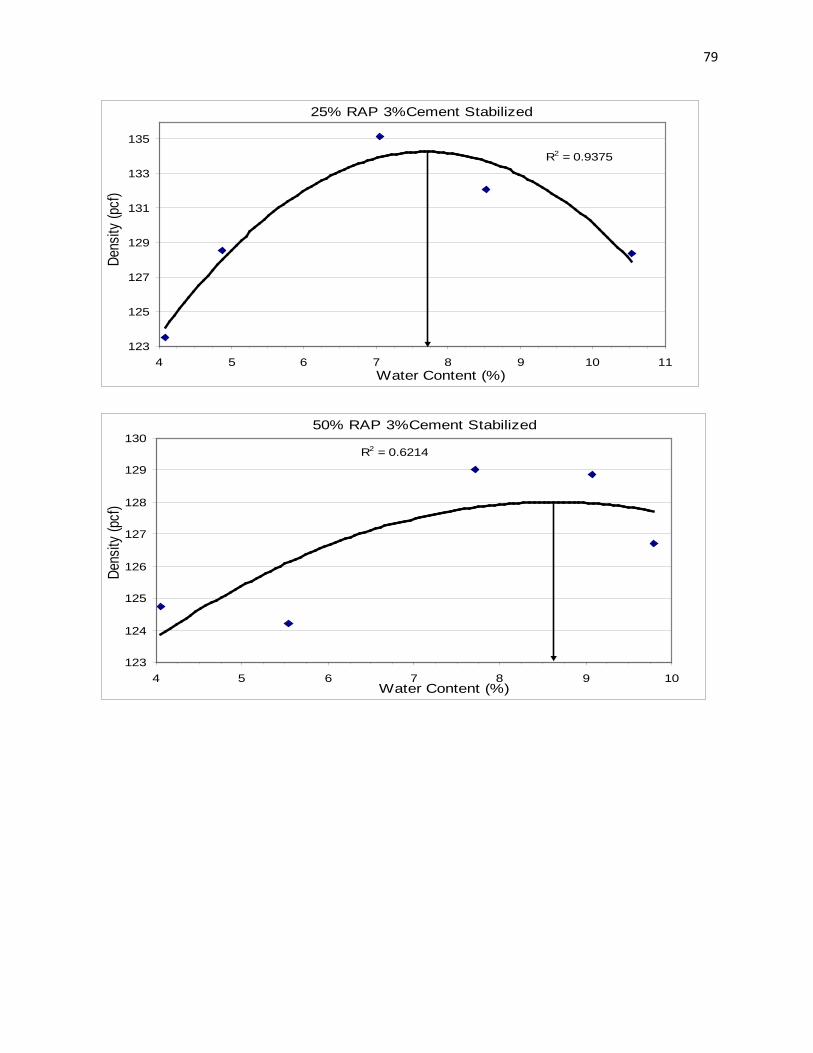
79
R2 = 0.9375
123
125
127
129
131
133
135
4 5 6 7 8 9 10 11
Dens
ity (p
cf)
25% RAP 3%Cement Stabilized
Water Content (%)
R2 = 0.6214
123
124
125
126
127
128
129
130
4 5 6 7 8 9 10
Dens
ity (p
cf)
50% RAP 3%Cement Stabilized
Water Content (%)
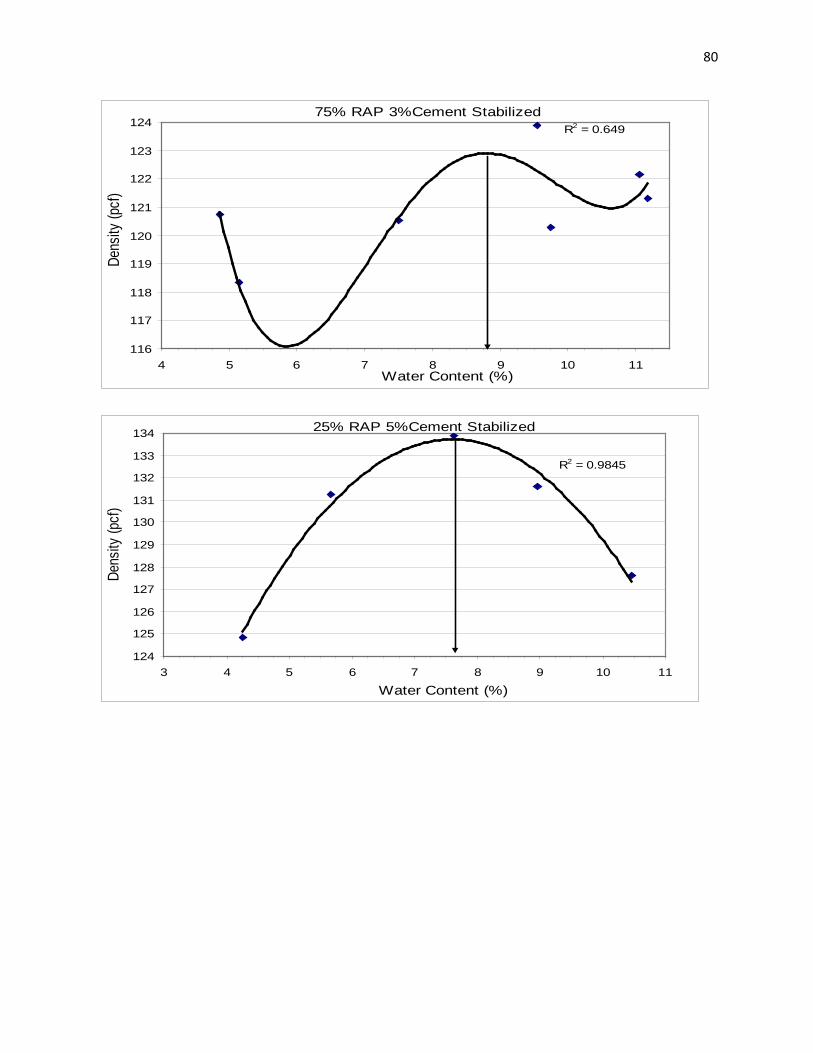
80
R2 = 0.649
116
117
118
119
120
121
122
123
124
4 5 6 7 8 9 10 11
Dens
ity (p
cf)
75% RAP 3%Cement Stabilized
Water Content (%)
R2 = 0.9845
124
125
126
127
128
129
130
131
132
133
134
3 4 5 6 7 8 9 10 11
Dens
ity (p
cf)
25% RAP 5%Cement Stabilized
Water Content (%)
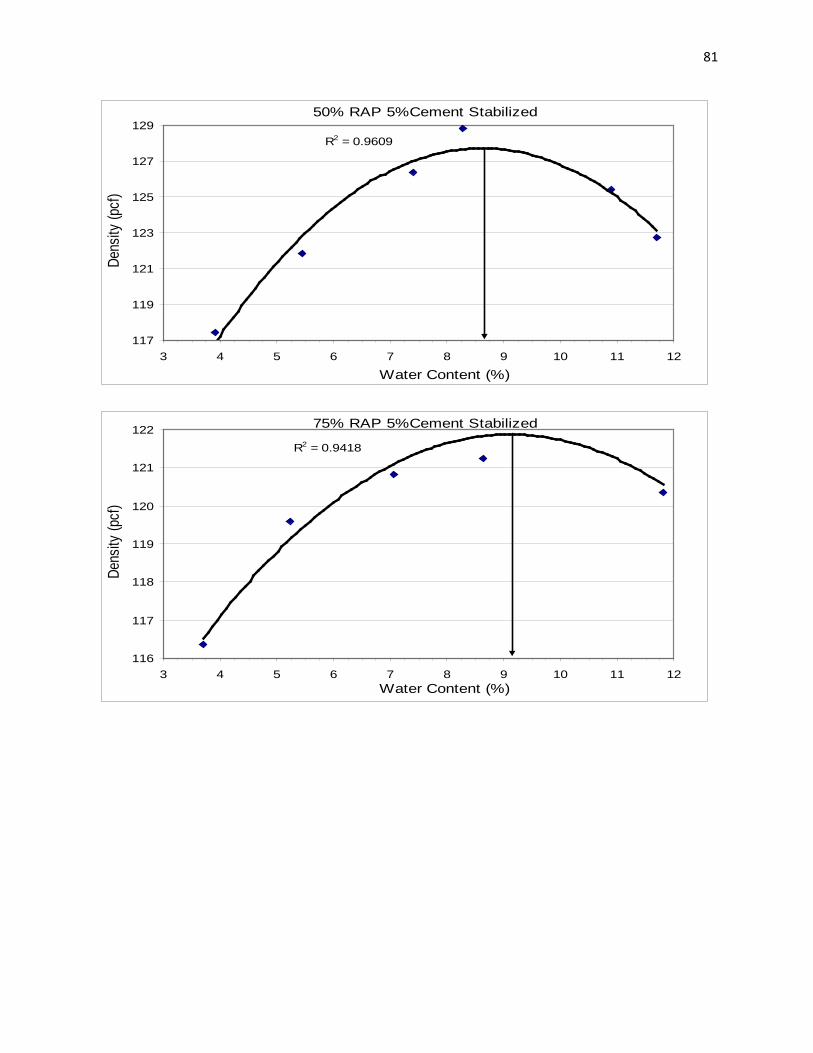
81
R2 = 0.9609
117
119
121
123
125
127
129
3 4 5 6 7 8 9 10 11 12
Dens
ity (p
cf)
50% RAP 5%Cement Stabilized
Water Content (%)
R2 = 0.9418
116
117
118
119
120
121
122
3 4 5 6 7 8 9 10 11 12
Dens
ity (p
cf)
75% RAP 5%Cement Stabilized
Water Content (%)
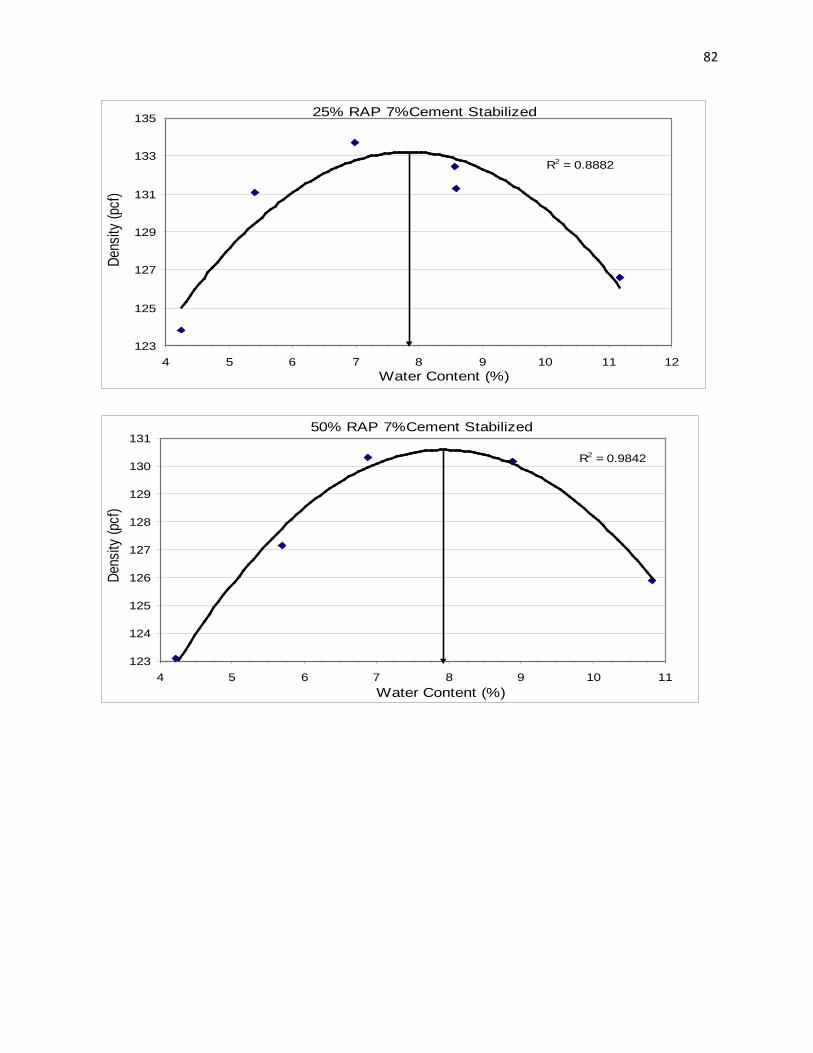
82
R2 = 0.8882
123
125
127
129
131
133
135
4 5 6 7 8 9 10 11 12
Dens
ity (p
cf)
25% RAP 7%Cement Stabilized
Water Content (%)
R2 = 0.9842
123
124
125
126
127
128
129
130
131
4 5 6 7 8 9 10 11
Dens
ity (p
cf)
50% RAP 7%Cement Stabilized
Water Content (%)
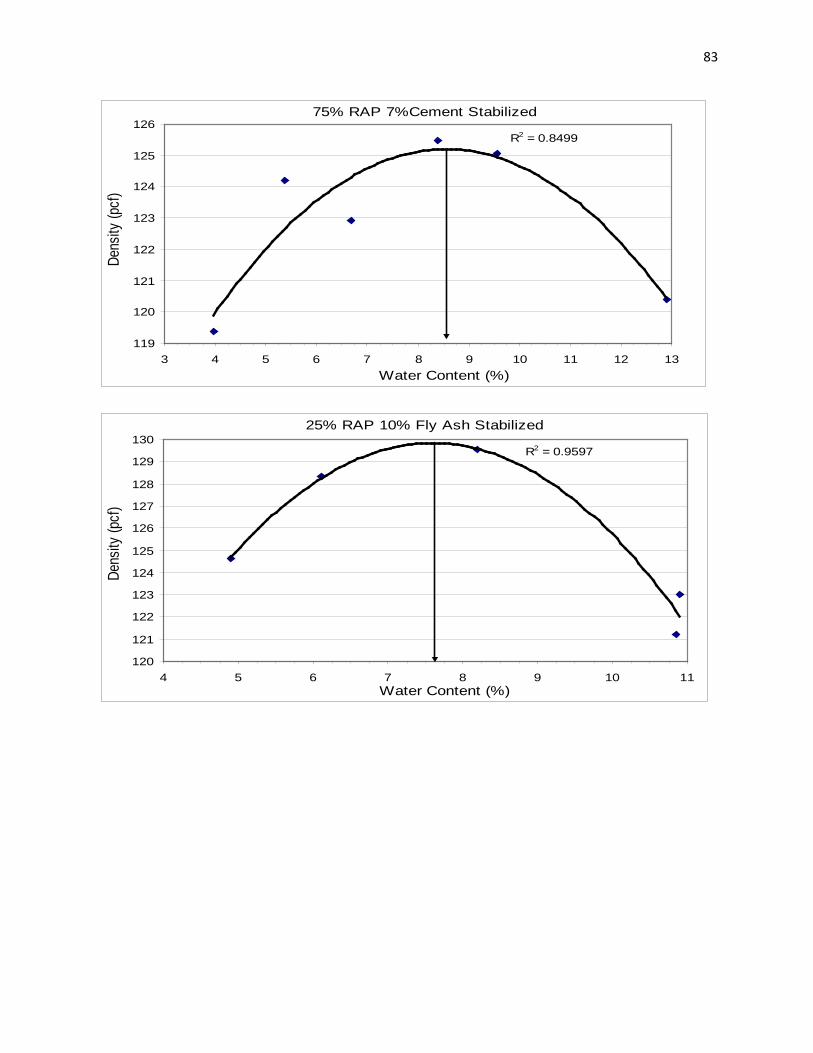
83
R2 = 0.8499
119
120
121
122
123
124
125
126
3 4 5 6 7 8 9 10 11 12 13
Dens
ity (p
cf)
75% RAP 7%Cement Stabilized
Water Content (%)
R2 = 0.9597
120
121
122
123
124
125
126
127
128
129
130
4 5 6 7 8 9 10 11
Dens
ity (p
cf)
25% RAP 10% Fly Ash Stabilized
Water Content (%)

84
R2 = 0.7455
118
120
122
124
126
128
130
2 4 6 8 10 12
Dens
ity (p
cf)
50% RAP 10% Fly Ash Stabilized
Water Content (%)
R2 = 0.9607
116
118
120
122
124
126
128
130
3 4 5 6 7 8 9 10 11 12
Dens
ity (p
cf)
75% RAP 10% Fly Ash Stabilized
Water Content (%)

85
R2 = 0.8102
122
124
126
128
130
132
134
3 4 5 6 7 8 9 10 11 12
Dens
ity (p
cf)
25% RAP 12% Fly Ash Stabilized
Water Content (%)
R2 = 0.9653
121
122
123
124
125
126
127
128
129
130
131
4 5 6 7 8 9 10
Dens
ity (p
cf)
50% RAP 12% Fly Ash Stabilized
Water Content (%)
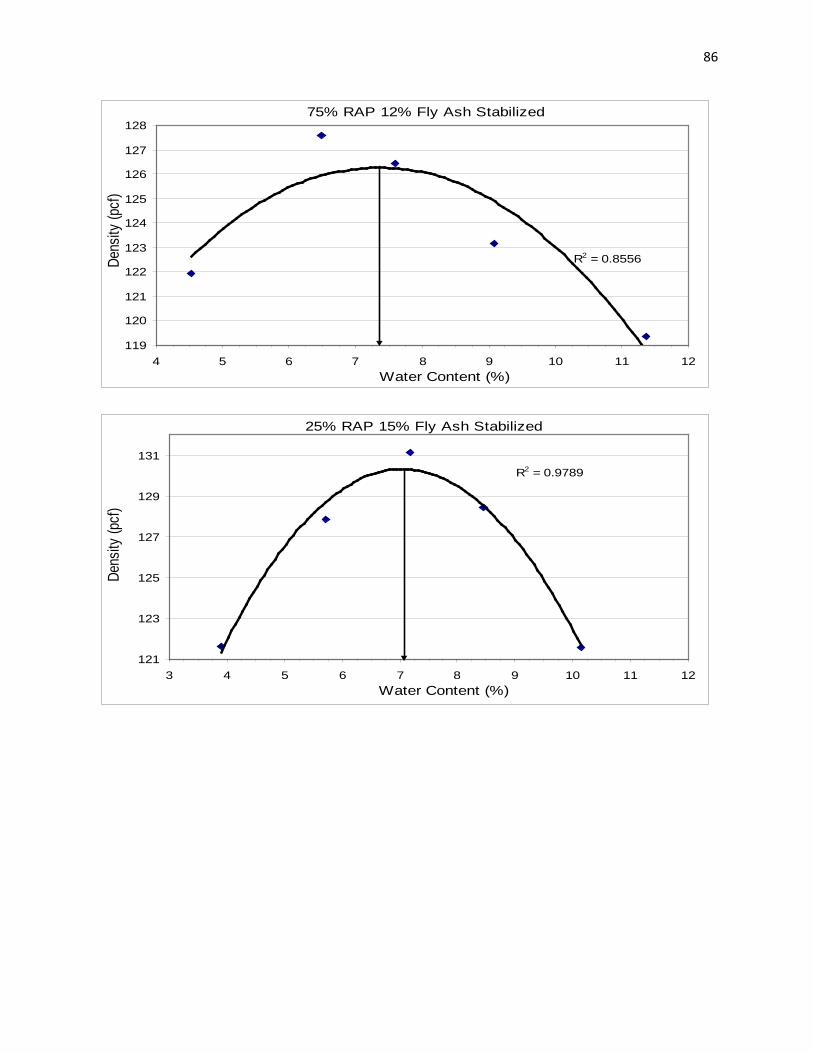
86
R2 = 0.8556
119
120
121
122
123
124
125
126
127
128
4 5 6 7 8 9 10 11 12
Dens
ity (p
cf)
75% RAP 12% Fly Ash Stabilized
Water Content (%)
R2 = 0.9789
121
123
125
127
129
131
3 4 5 6 7 8 9 10 11 12
Dens
ity (p
cf)
25% RAP 15% Fly Ash Stabilized
Water Content (%)

87
R2 = 0.8836
120
121
122
123
124
125
126
127
128
129
130
4 5 6 7 8 9 10 11
Dens
ity (p
cf)
50% RAP 15% Fly Ash Stabilized
Water Content (%)
R2 = 0.9724
120
121
122
123
124
125
126
127
128
129
4 5 6 7 8 9 10
Dens
ity (p
cf)
75% RAP 15% Fly Ash Stabilized
Water Content (%)
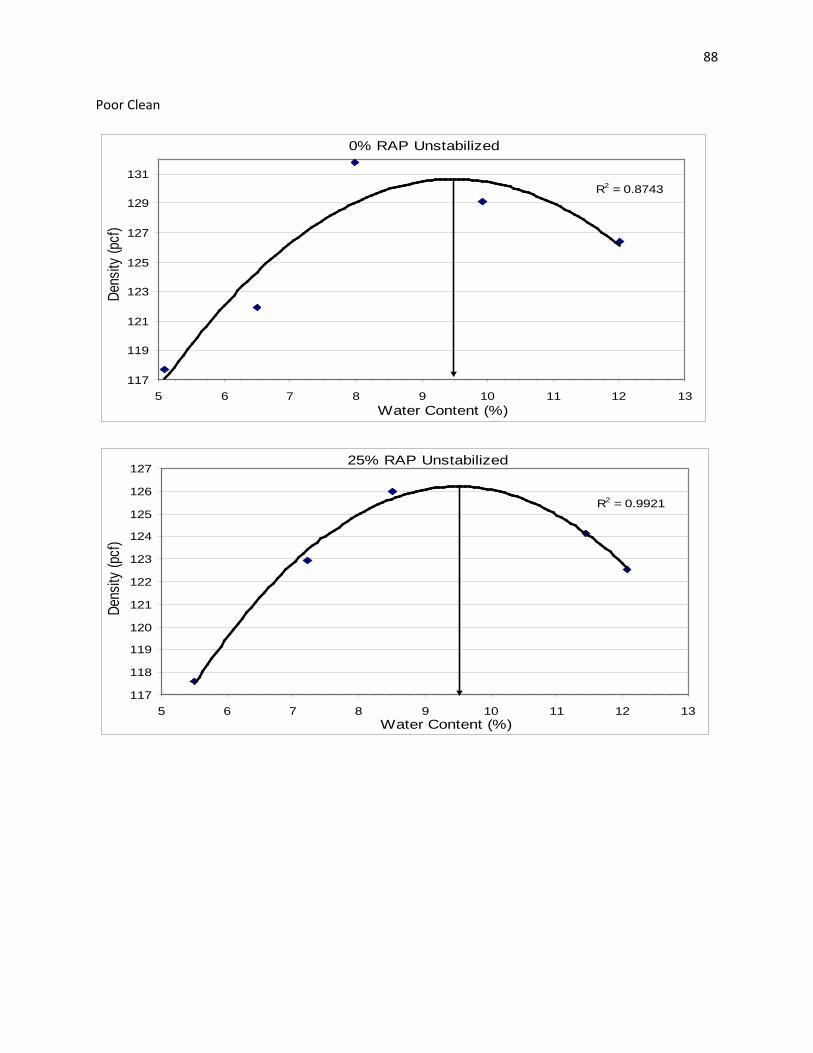
88
Poor Clean
R2 = 0.8743
117
119
121
123
125
127
129
131
5 6 7 8 9 10 11 12 13
Dens
ity (p
cf)
0% RAP Unstabilized
Water Content (%)
R2 = 0.9921
117
118
119
120
121
122
123
124
125
126
127
5 6 7 8 9 10 11 12 13
Dens
ity (p
cf)
25% RAP Unstabilized
Water Content (%)

89
R2 = 0.9222
117
118
119
120
121
122
123
4 5 6 7 8 9 10 11 12
Dens
ity (p
cf)
50% RAP Unstabilized
Water Content (%)
R2 = 0.5515
111
112
113
114
115
116
117
4 5 6 7 8 9 10 11 12 13 14
Dens
ity (p
cf)
75% RAP Unstabilized
Water Content (%)

90
R2 = 0.8469
125
126
127
128
129
130
131
132
133
134
4 5 6 7 8 9 10 11 12
Dens
ity (p
cf)
25% RAP 3% Cement Stabilized
Water Content (%)
R2 = 0.9554
121
122
123
124
125
126
127
6 7 8 9 10 11 12 13
Dens
ity (p
cf)
50% RAP 3% Cement Stabilized
Water Content (%)

91
R2 = 0.9569
119
121
123
125
127
129
131
4 5 6 7 8 9 10 11 12 13
Dens
ity (p
cf)
75% RAP 3% Cement Stabilized
Water Content (%)
R2 = 0.7312
122
124
126
128
130
132
134
4 5 6 7 8 9 10 11 12 13
Dens
ity (p
cf)
25% RAP 5% Cement Stabilized
Water Content (%)
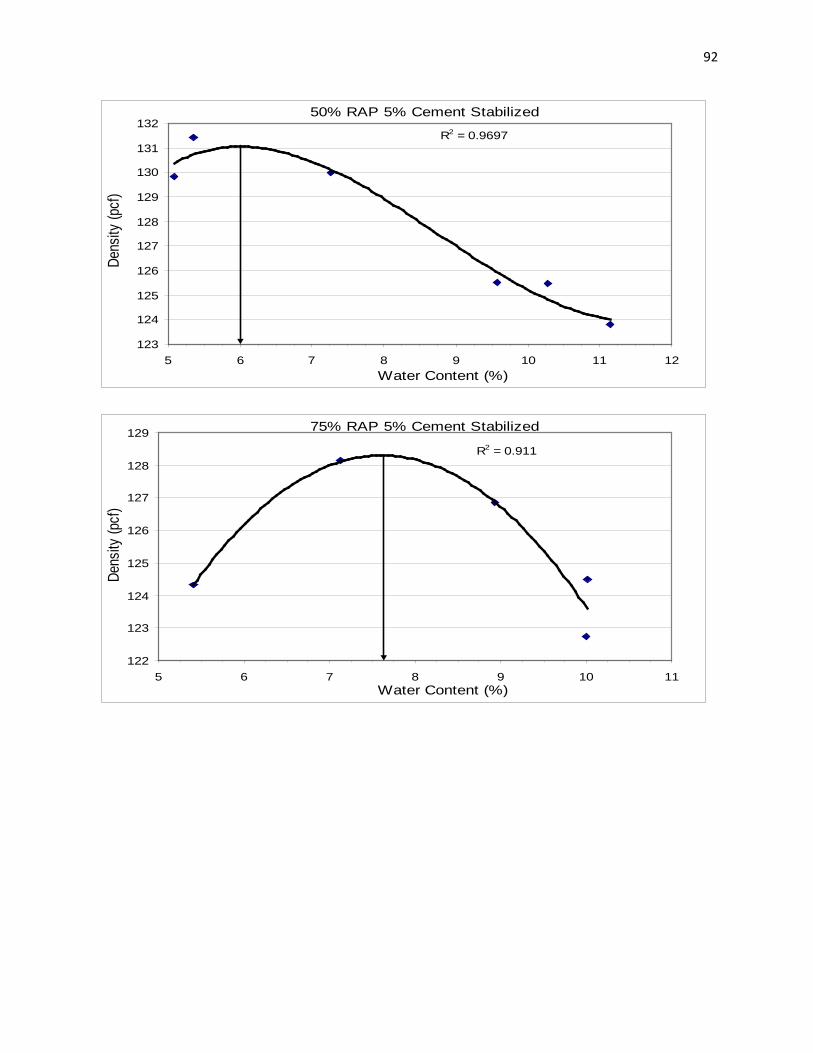
92
R2 = 0.9697
123
124
125
126
127
128
129
130
131
132
5 6 7 8 9 10 11 12
Dens
ity (p
cf)
50% RAP 5% Cement Stabilized
Water Content (%)
R2 = 0.911
122
123
124
125
126
127
128
129
5 6 7 8 9 10 11
Dens
ity (p
cf)
75% RAP 5% Cement Stabilized
Water Content (%)
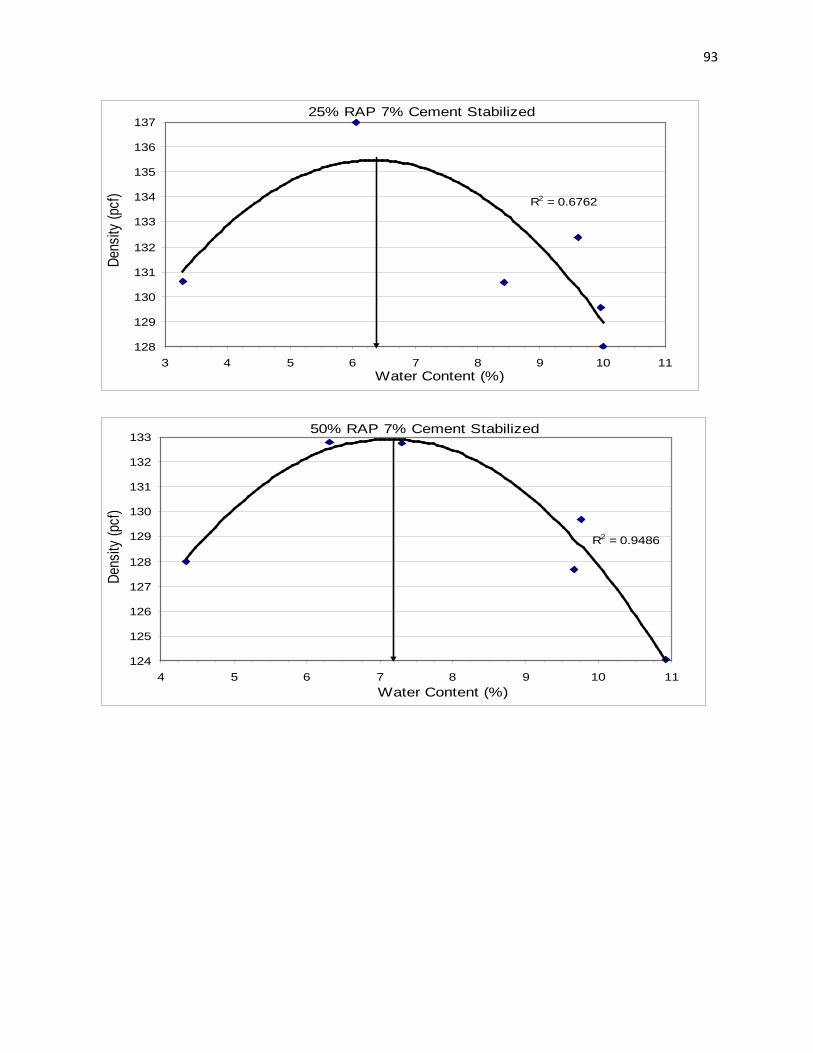
93
R2 = 0.6762
128
129
130
131
132
133
134
135
136
137
3 4 5 6 7 8 9 10 11
Dens
ity (p
cf)
25% RAP 7% Cement Stabilized
Water Content (%)
R2 = 0.9486
124
125
126
127
128
129
130
131
132
133
4 5 6 7 8 9 10 11
Dens
ity (p
cf)
50% RAP 7% Cement Stabilized
Water Content (%)
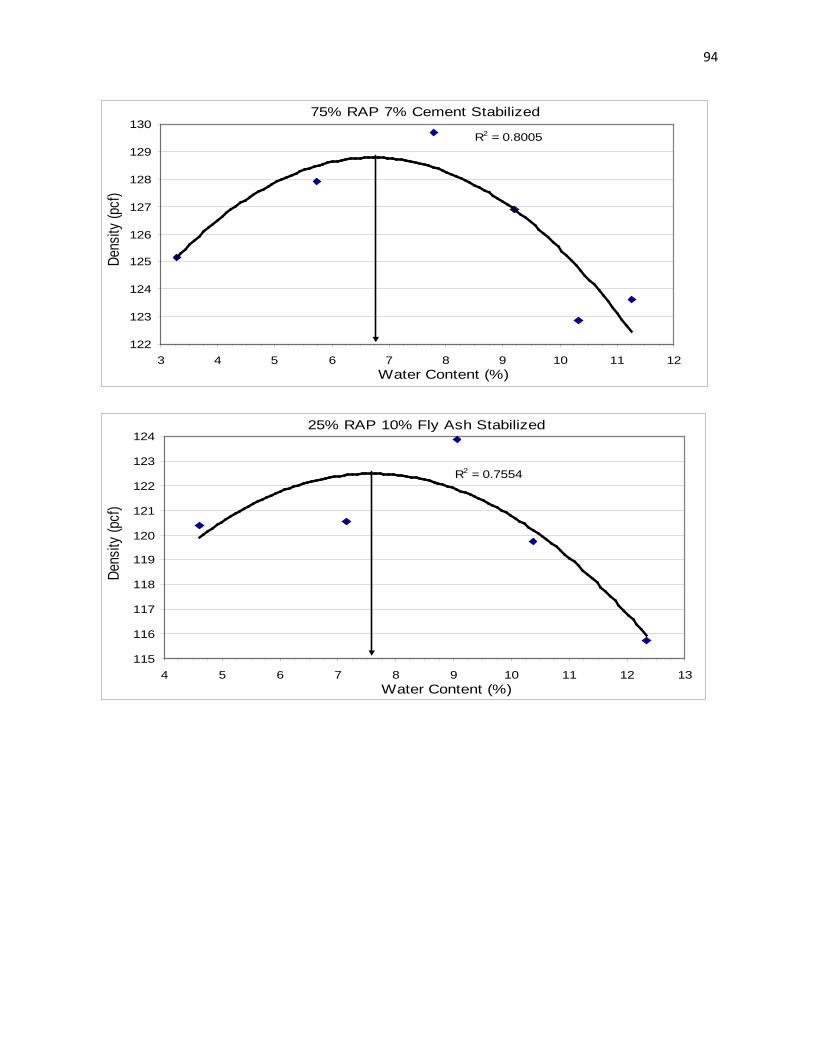
94
R2 = 0.8005
122
123
124
125
126
127
128
129
130
3 4 5 6 7 8 9 10 11 12
Dens
ity (p
cf)
75% RAP 7% Cement Stabilized
Water Content (%)
R2 = 0.7554
115
116
117
118
119
120
121
122
123
124
4 5 6 7 8 9 10 11 12 13
Dens
ity (p
cf)
25% RAP 10% Fly Ash Stabilized
Water Content (%)

95
R2 = 0.9815
114
115
116
117
118
119
120
121
122
123
124
4 5 6 7 8 9 10 11 12
Dens
ity (p
cf)
50% RAP 10% Fly Ash Stabilized
Water Content (%)
R2 = 0.935
114
115
116
117
118
119
120
121
122
123
124
5 6 7 8 9 10 11 12
Dens
ity (p
cf)
75% RAP 10% Fly Ash Stabilized
Water Content (%)
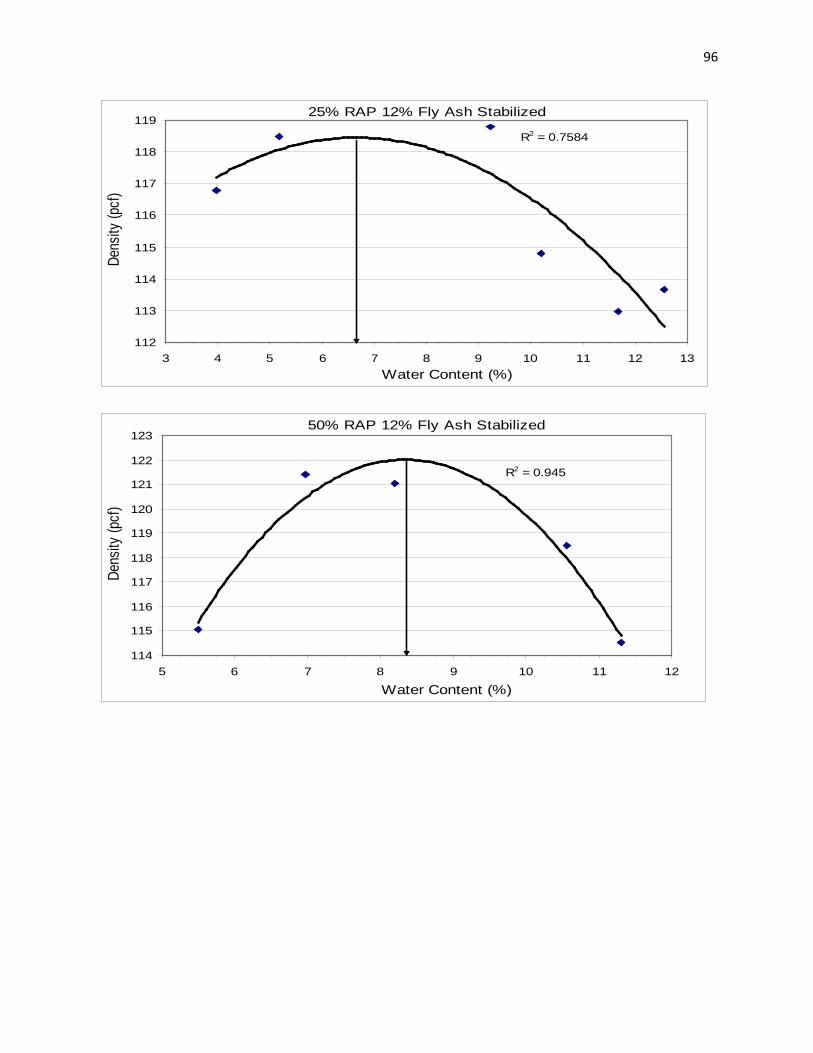
96
R2 = 0.7584
112
113
114
115
116
117
118
119
3 4 5 6 7 8 9 10 11 12 13
Dens
ity (p
cf)
25% RAP 12% Fly Ash Stabilized
Water Content (%)
R2 = 0.945
114
115
116
117
118
119
120
121
122
123
5 6 7 8 9 10 11 12
Dens
ity (p
cf)
50% RAP 12% Fly Ash Stabilized
Water Content (%)
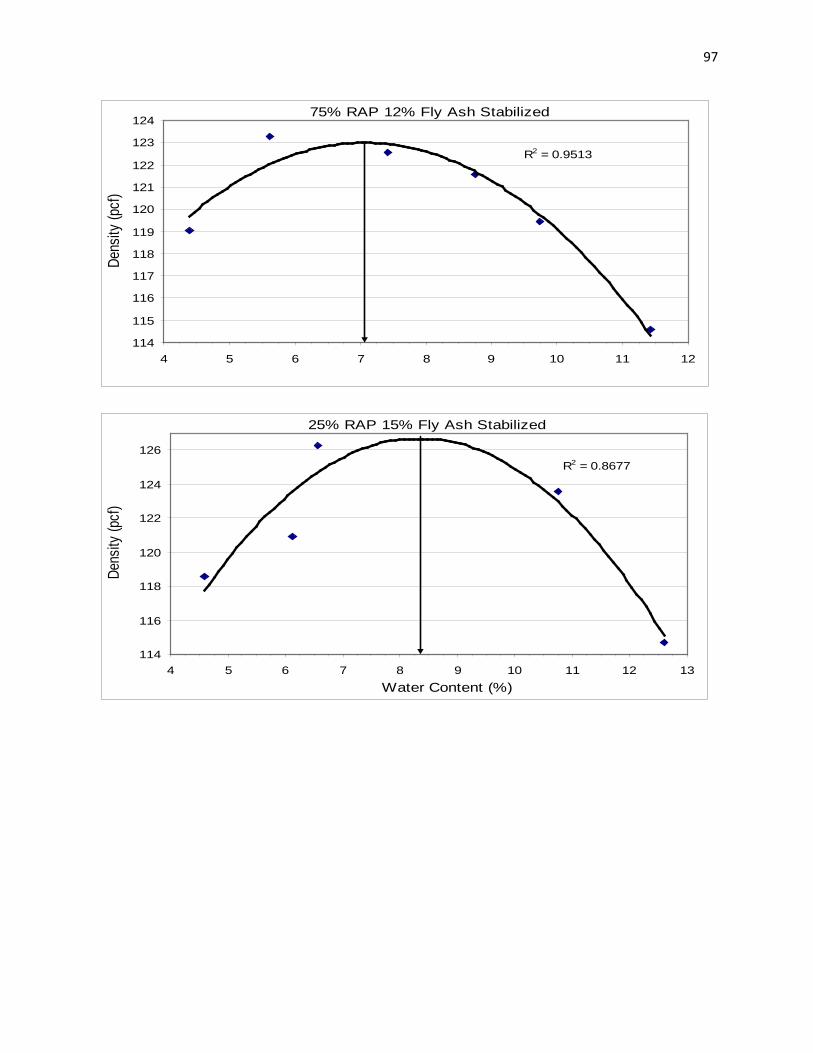
97
R2 = 0.9513
114
115
116
117
118
119
120
121
122
123
124
4 5 6 7 8 9 10 11 12
Dens
ity (p
cf)
75% RAP 12% Fly Ash Stabilized
R2 = 0.8677
114
116
118
120
122
124
126
4 5 6 7 8 9 10 11 12 13
Dens
ity (p
cf)
25% RAP 15% Fly Ash Stabilized
Water Content (%)
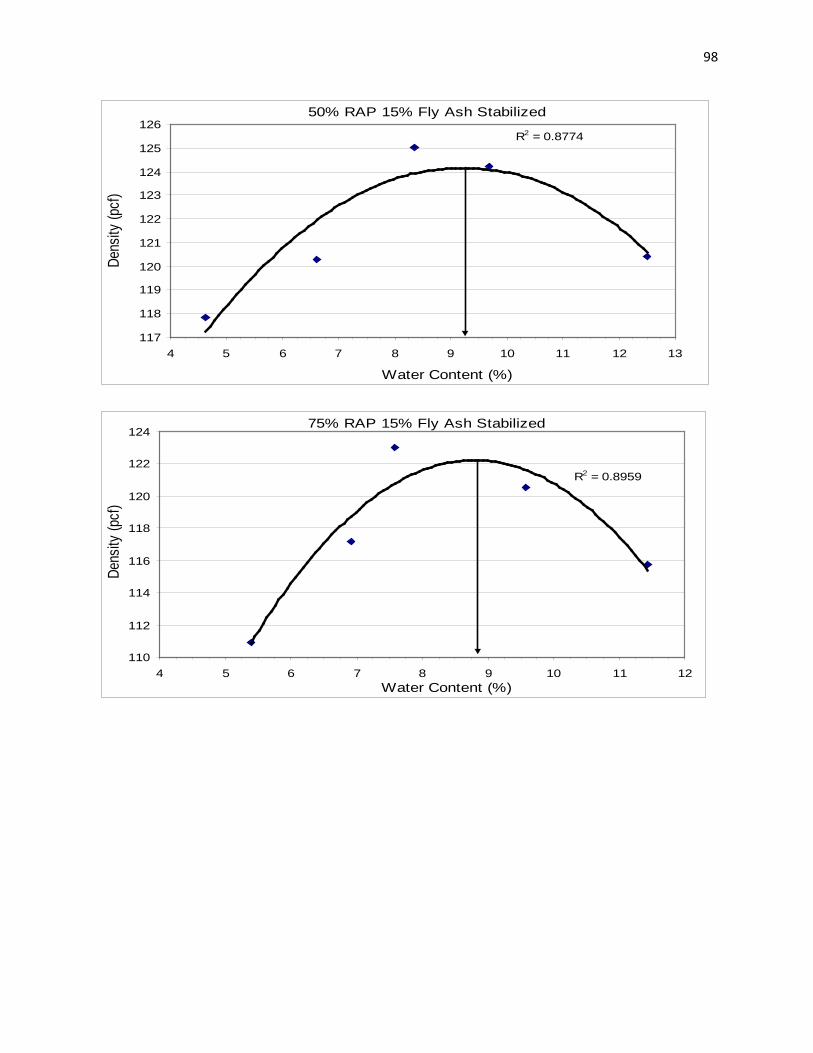
98
R2 = 0.8774
117
118
119
120
121
122
123
124
125
126
4 5 6 7 8 9 10 11 12 13
Dens
ity (p
cf)
50% RAP 15% Fly Ash Stabilized
Water Content (%)
R2 = 0.8959
110
112
114
116
118
120
122
124
4 5 6 7 8 9 10 11 12
Dens
ity (p
cf)
75% RAP 15% Fly Ash Stabilized
Water Content (%)
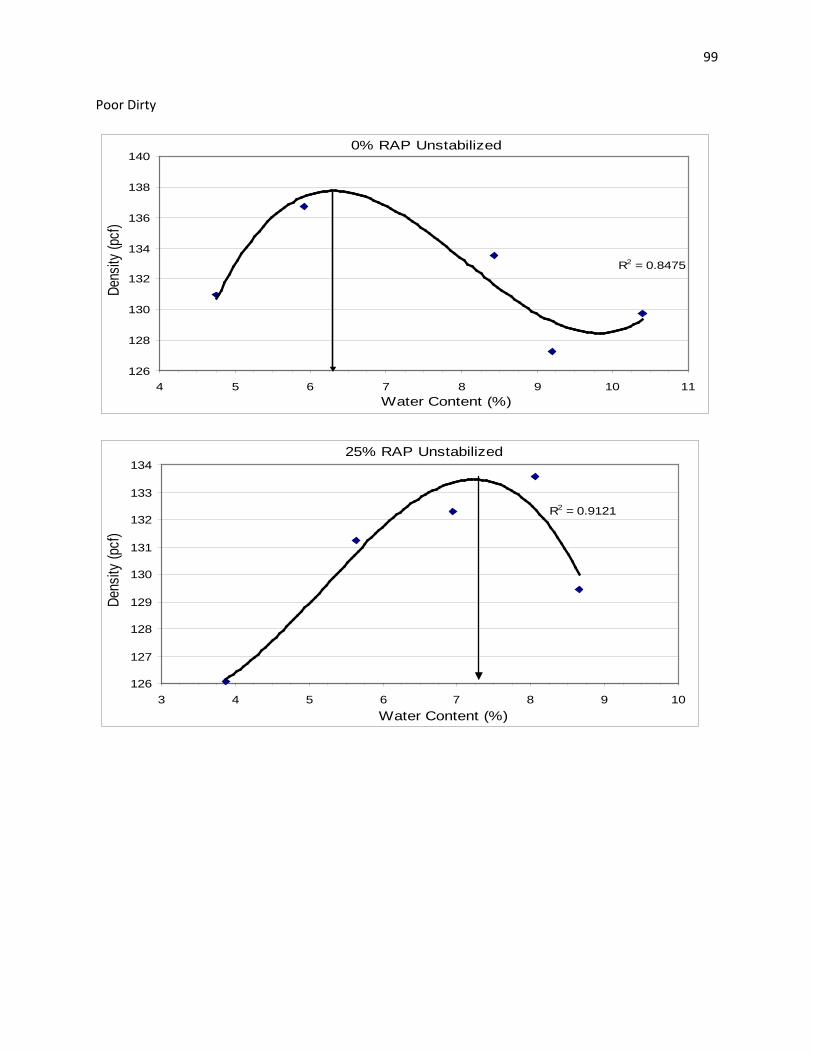
99
Poor Dirty
R2 = 0.8475
126
128
130
132
134
136
138
140
4 5 6 7 8 9 10 11
Dens
ity (p
cf)
0% RAP Unstabilized
Water Content (%)
R2 = 0.9121
126
127
128
129
130
131
132
133
134
3 4 5 6 7 8 9 10
Dens
ity (p
cf)
25% RAP Unstabilized
Water Content (%)
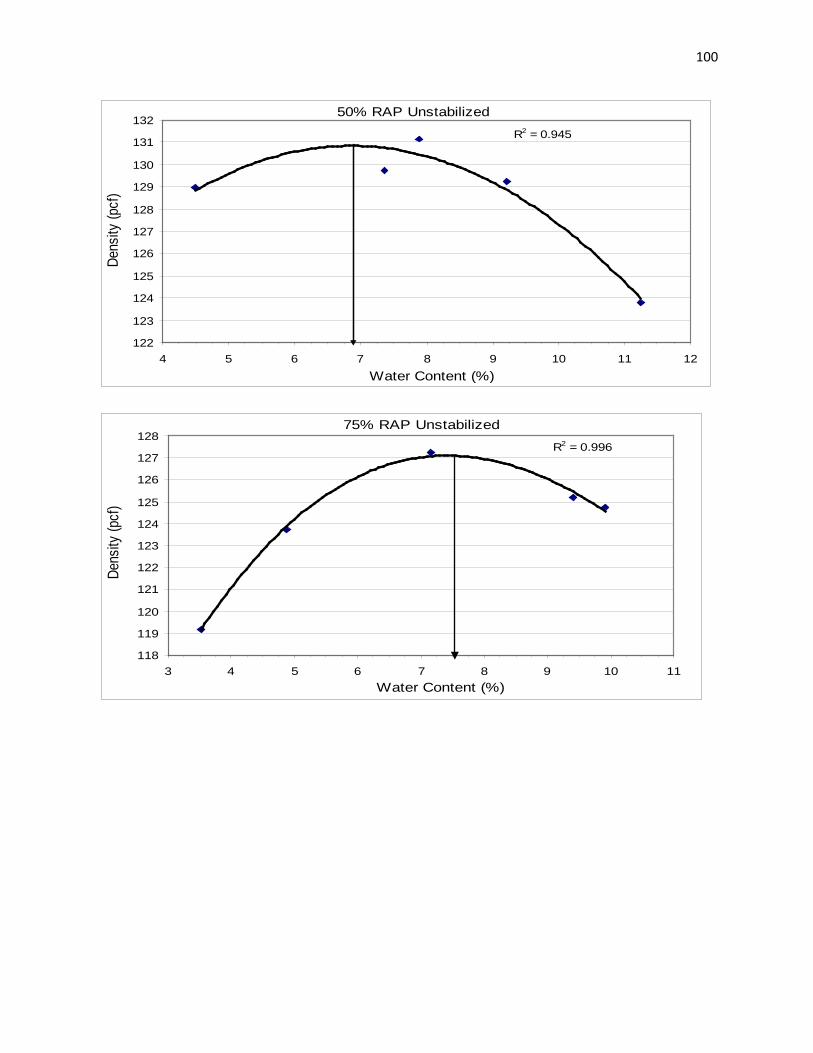
100
R2 = 0.945
122
123
124
125
126
127
128
129
130
131
132
4 5 6 7 8 9 10 11 12
Dens
ity (p
cf)
50% RAP Unstabilized
Water Content (%)
R2 = 0.996
118
119
120
121
122
123
124
125
126
127
128
3 4 5 6 7 8 9 10 11
Dens
ity (p
cf)
75% RAP Unstabilized
Water Content (%)
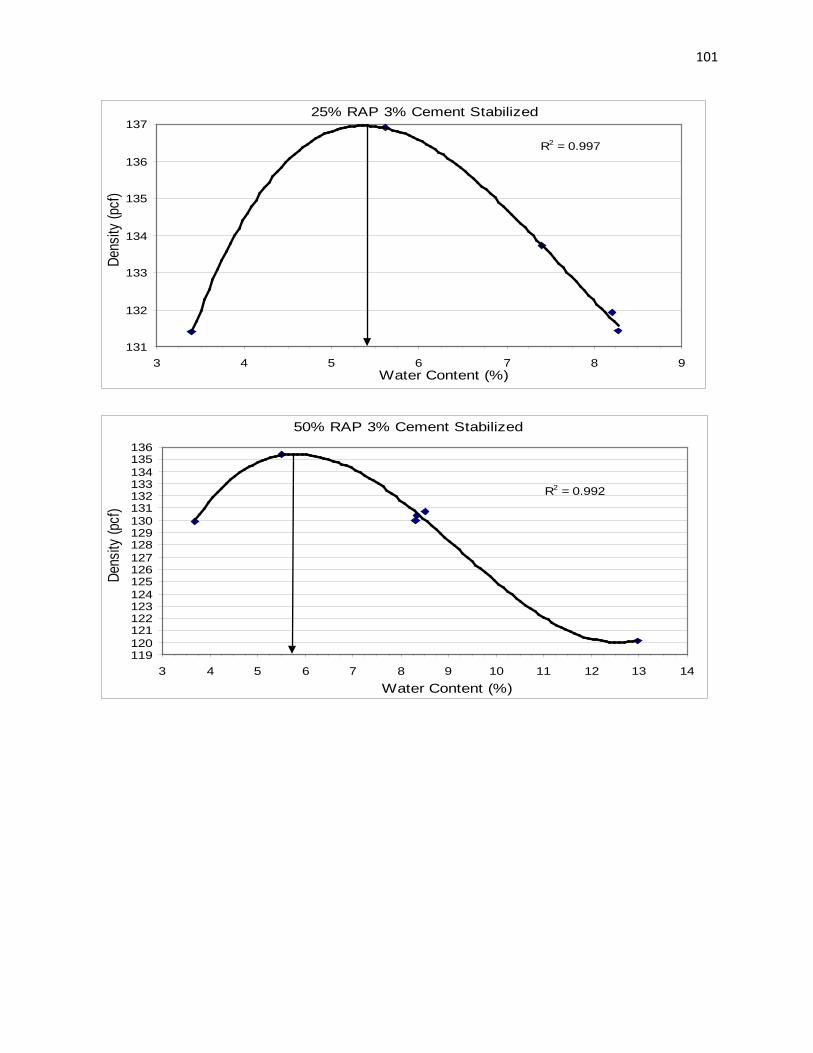
101
R2 = 0.997
131
132
133
134
135
136
137
3 4 5 6 7 8 9
Dens
ity (p
cf)
25% RAP 3% Cement Stabilized
Water Content (%)
R2 = 0.992
119120121122123124125126127128129130131132133134135136
3 4 5 6 7 8 9 10 11 12 13 14
Dens
ity (p
cf)
50% RAP 3% Cement Stabilized
Water Content (%)
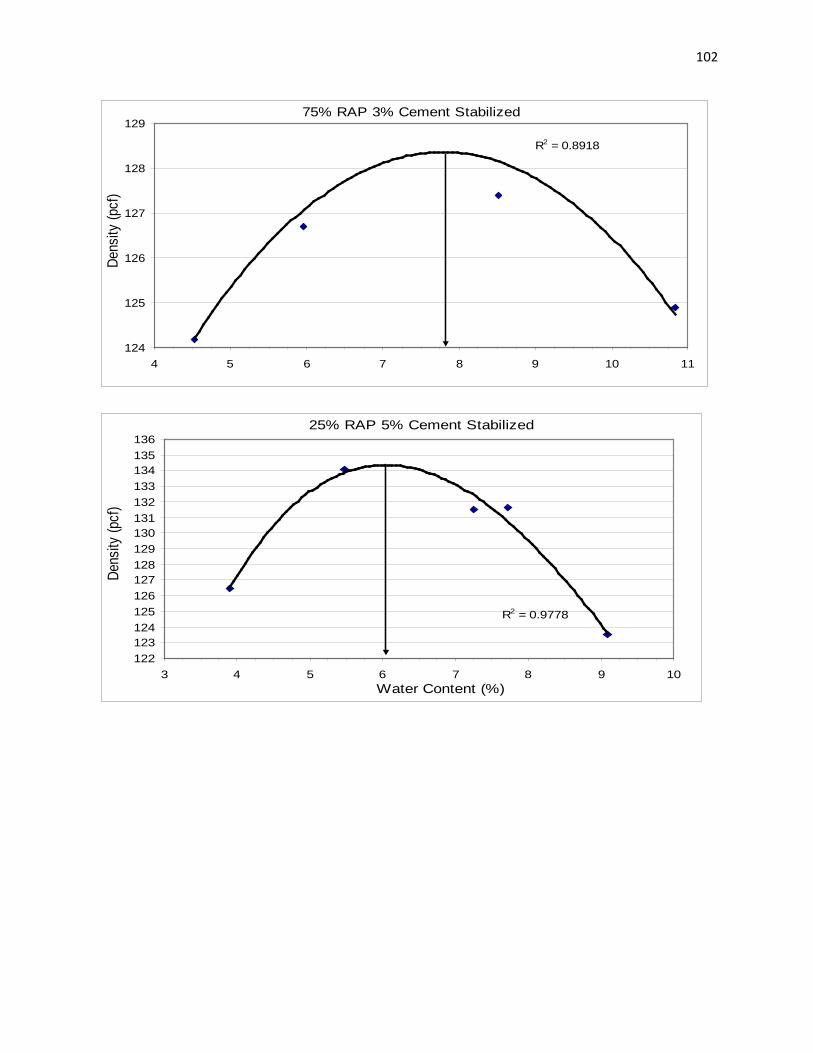
102
R2 = 0.8918
124
125
126
127
128
129
4 5 6 7 8 9 10 11
Dens
ity (p
cf)
75% RAP 3% Cement Stabilized
R2 = 0.9778
122123124125126127128129130131132133134135136
3 4 5 6 7 8 9 10
Dens
ity (p
cf)
25% RAP 5% Cement Stabilized
Water Content (%)
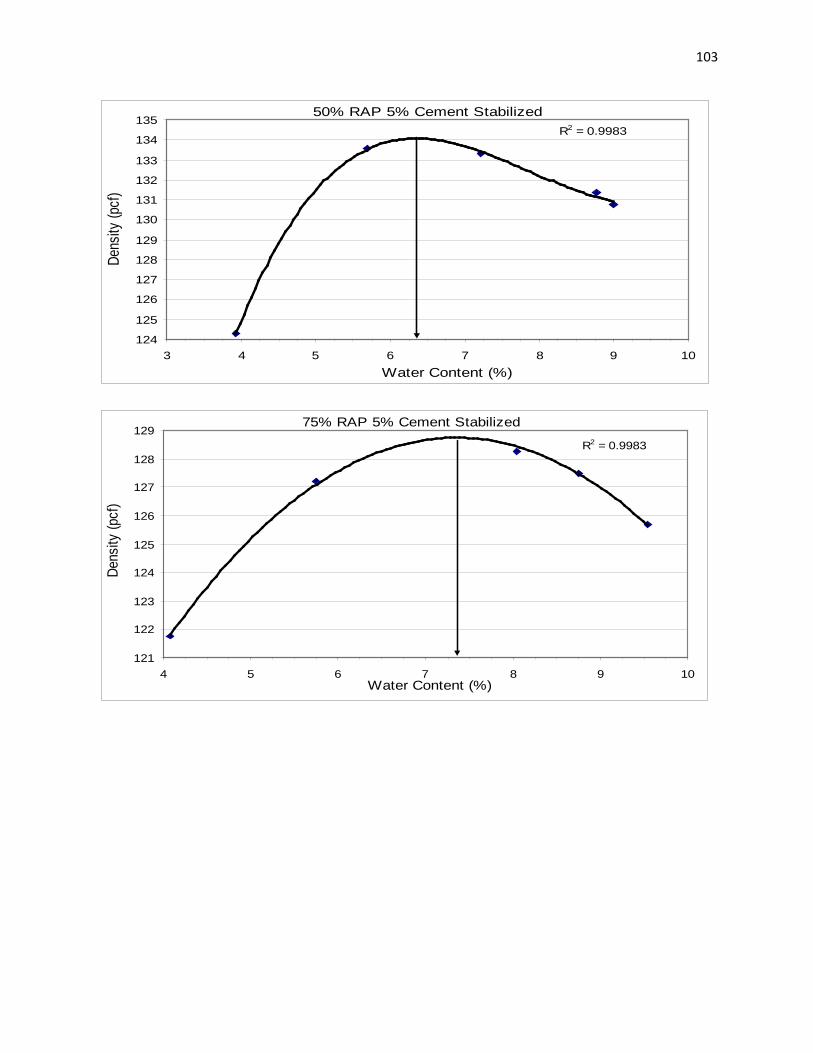
103
R2 = 0.9983
124
125
126
127
128
129
130
131
132
133
134
135
3 4 5 6 7 8 9 10
Dens
ity (p
cf)
50% RAP 5% Cement Stabilized
Water Content (%)
R2 = 0.9983
121
122
123
124
125
126
127
128
129
4 5 6 7 8 9 10
Dens
ity (p
cf)
75% RAP 5% Cement Stabilized
Water Content (%)
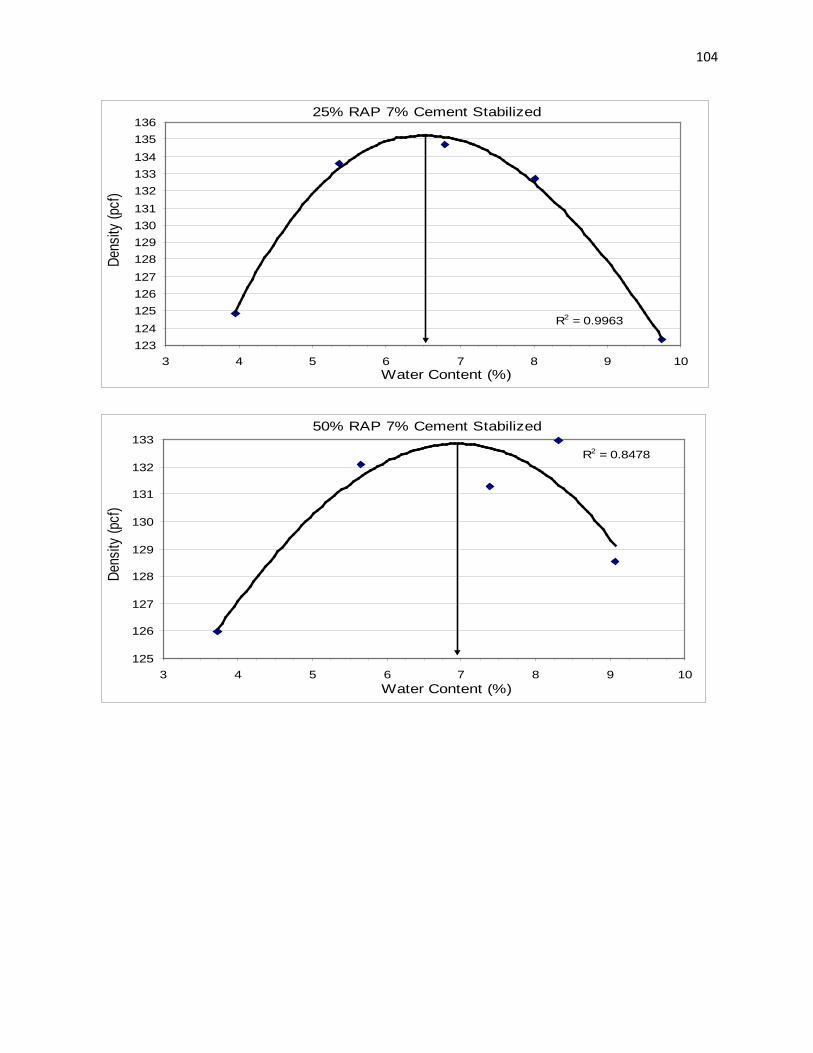
104
R2 = 0.9963
123124125126127128129130131132133134135136
3 4 5 6 7 8 9 10
Dens
ity (p
cf)
25% RAP 7% Cement Stabilized
Water Content (%)
R2 = 0.8478
125
126
127
128
129
130
131
132
133
3 4 5 6 7 8 9 10
Dens
ity (p
cf)
50% RAP 7% Cement Stabilized
Water Content (%)
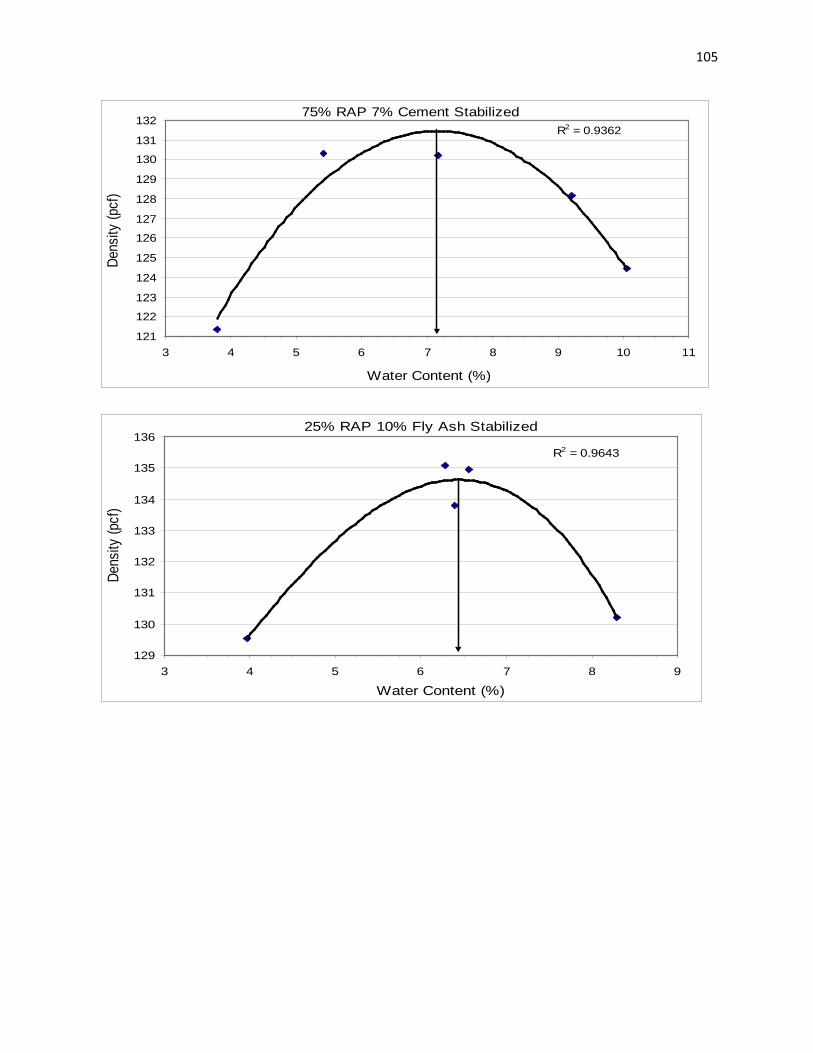
105
R2 = 0.9362
121
122
123
124
125
126
127
128
129
130
131
132
3 4 5 6 7 8 9 10 11
Dens
ity (p
cf)
75% RAP 7% Cement Stabilized
Water Content (%)
R2 = 0.9643
129
130
131
132
133
134
135
136
3 4 5 6 7 8 9
Dens
ity (p
cf)
25% RAP 10% Fly Ash Stabilized
Water Content (%)
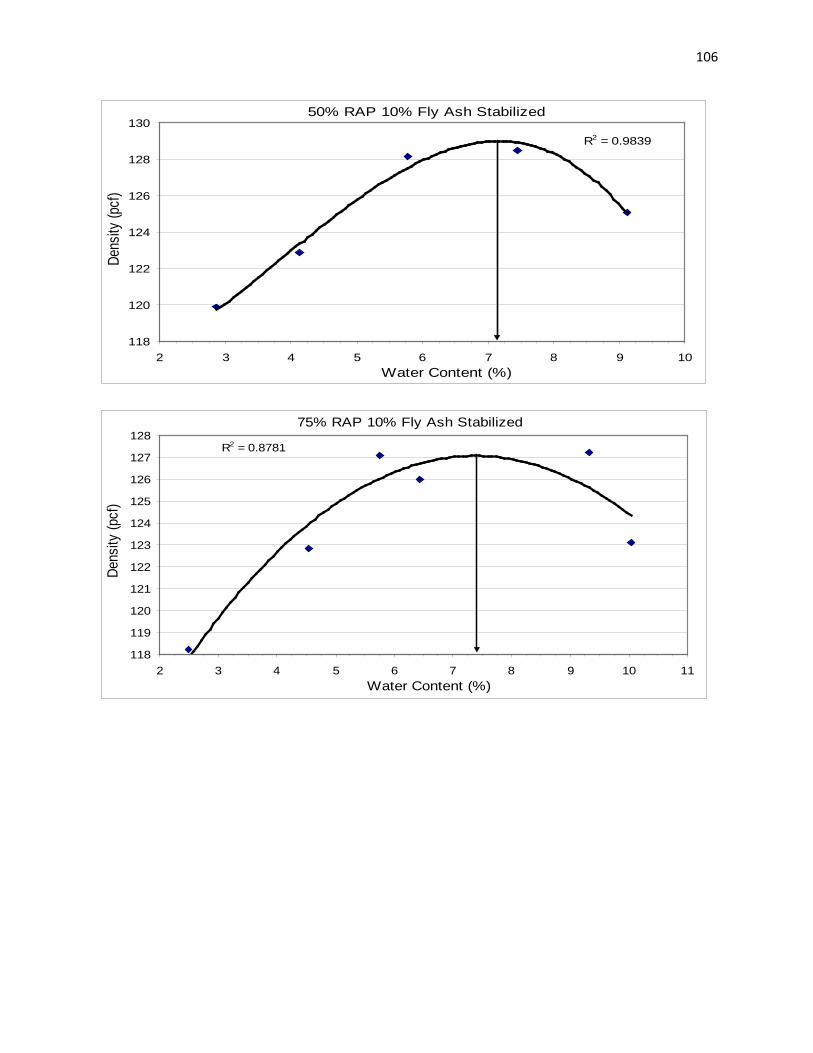
106
R2 = 0.9839
118
120
122
124
126
128
130
2 3 4 5 6 7 8 9 10
Dens
ity (p
cf)
50% RAP 10% Fly Ash Stabilized
Water Content (%)
R2 = 0.8781
118
119
120
121
122
123
124
125
126
127
128
2 3 4 5 6 7 8 9 10 11
Dens
ity (p
cf)
75% RAP 10% Fly Ash Stabilized
Water Content (%)
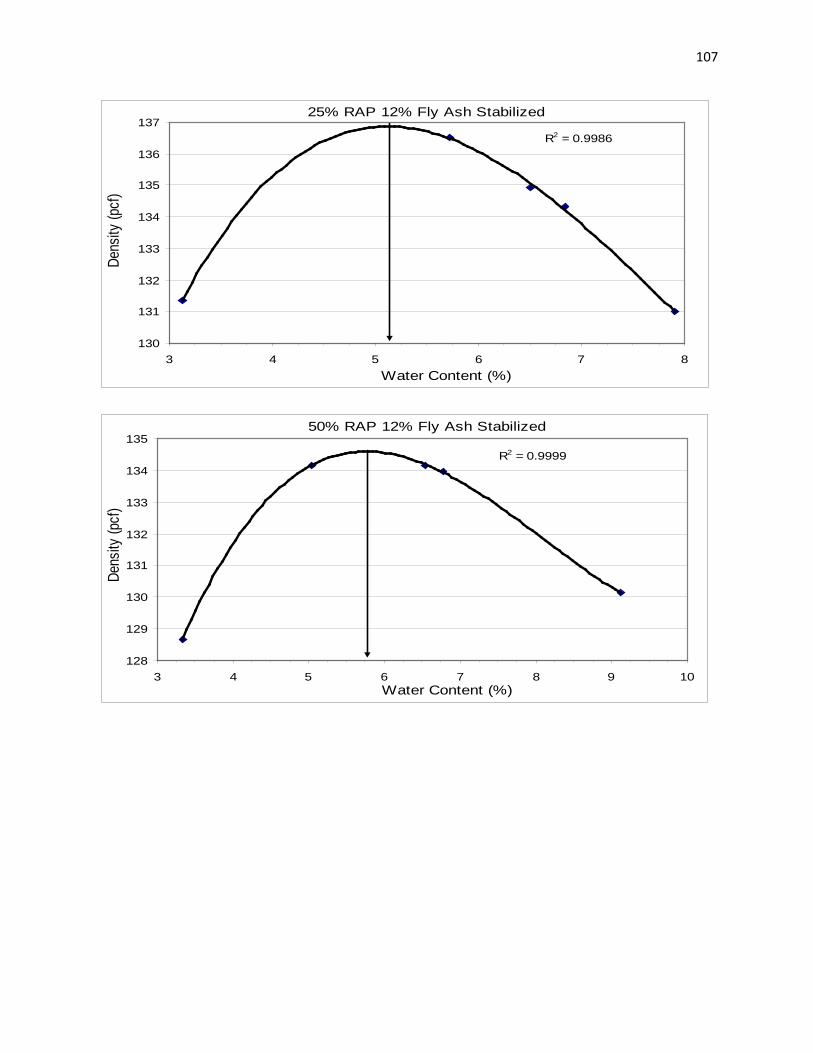
107
R2 = 0.9986
130
131
132
133
134
135
136
137
3 4 5 6 7 8
Dens
ity (p
cf)
25% RAP 12% Fly Ash Stabilized
Water Content (%)
R2 = 0.9999
128
129
130
131
132
133
134
135
3 4 5 6 7 8 9 10
Dens
ity (p
cf)
50% RAP 12% Fly Ash Stabilized
Water Content (%)
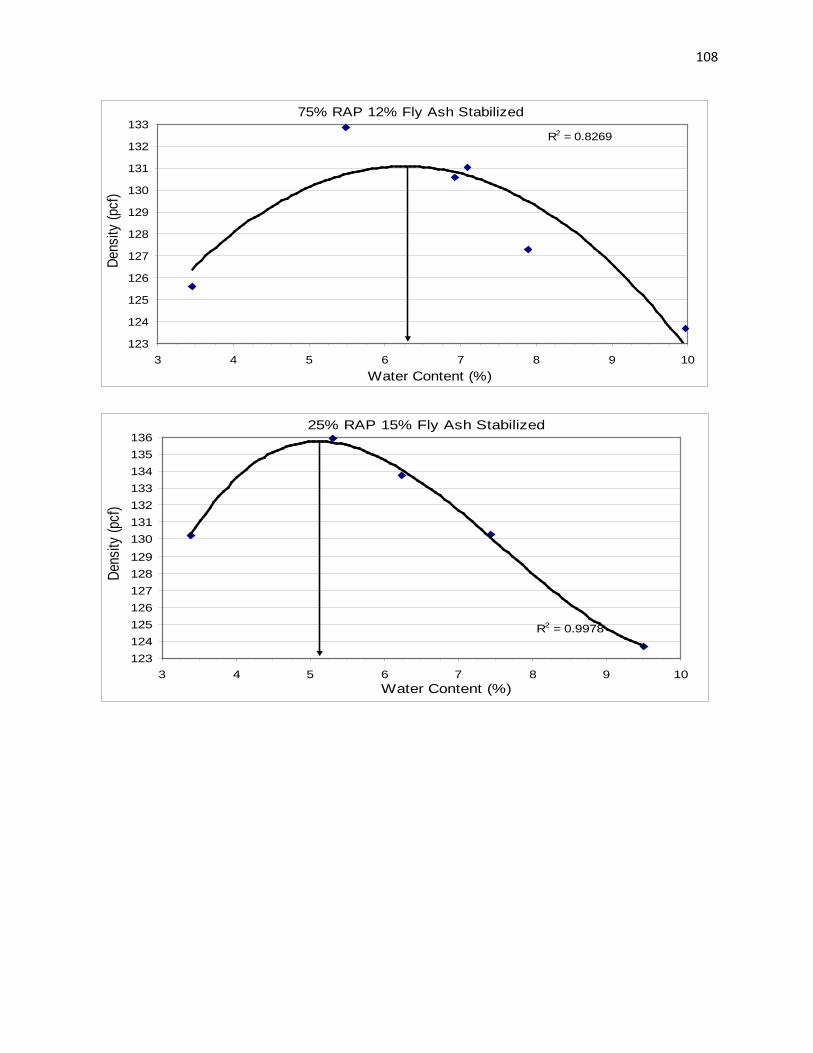
108
R2 = 0.8269
123
124
125
126
127
128
129
130
131
132
133
3 4 5 6 7 8 9 10
Dens
ity (p
cf)
75% RAP 12% Fly Ash Stabilized
Water Content (%)
R2 = 0.9978
123124125126127128129130131132133134135136
3 4 5 6 7 8 9 10
Dens
ity (p
cf)
25% RAP 15% Fly Ash Stabilized
Water Content (%)
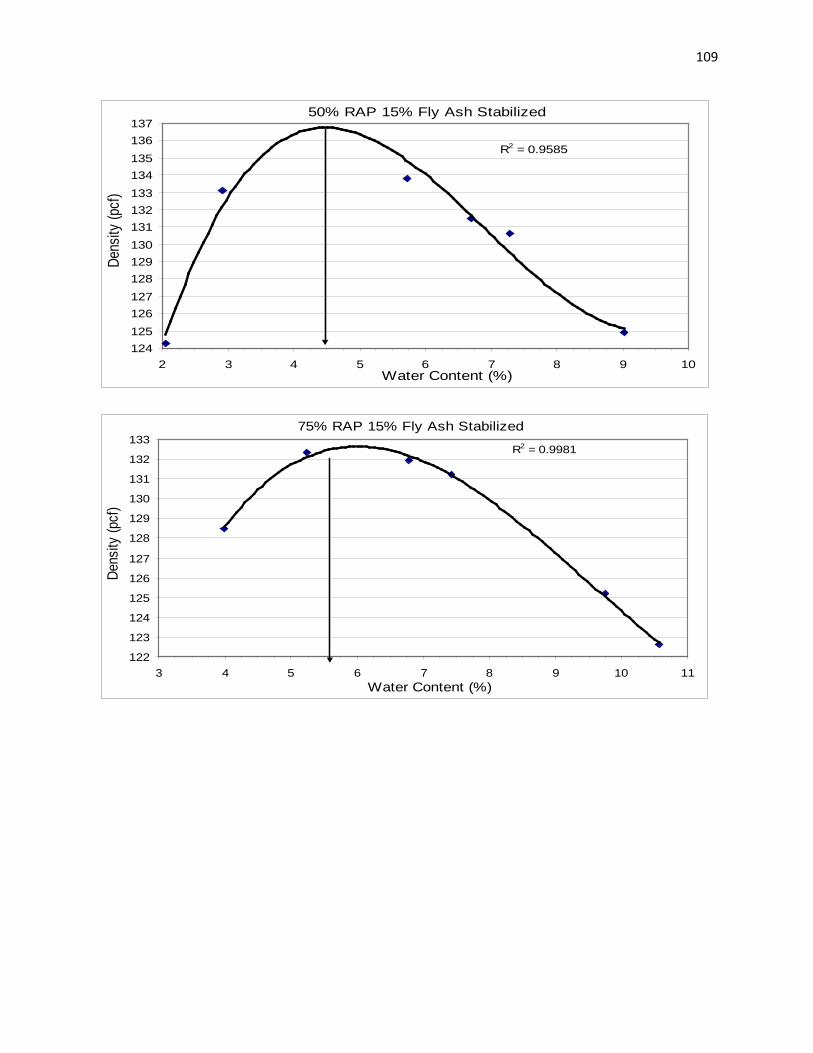
109
R2 = 0.9585
124125126127128129130131132133134135136137
2 3 4 5 6 7 8 9 10
Dens
ity (p
cf)
50% RAP 15% Fly Ash Stabilized
Water Content (%)
R2 = 0.9981
122
123
124
125
126
127
128
129
130
131
132
133
3 4 5 6 7 8 9 10 11
Dens
ity (p
cf)
75% RAP 15% Fly Ash Stabilized
Water Content (%)
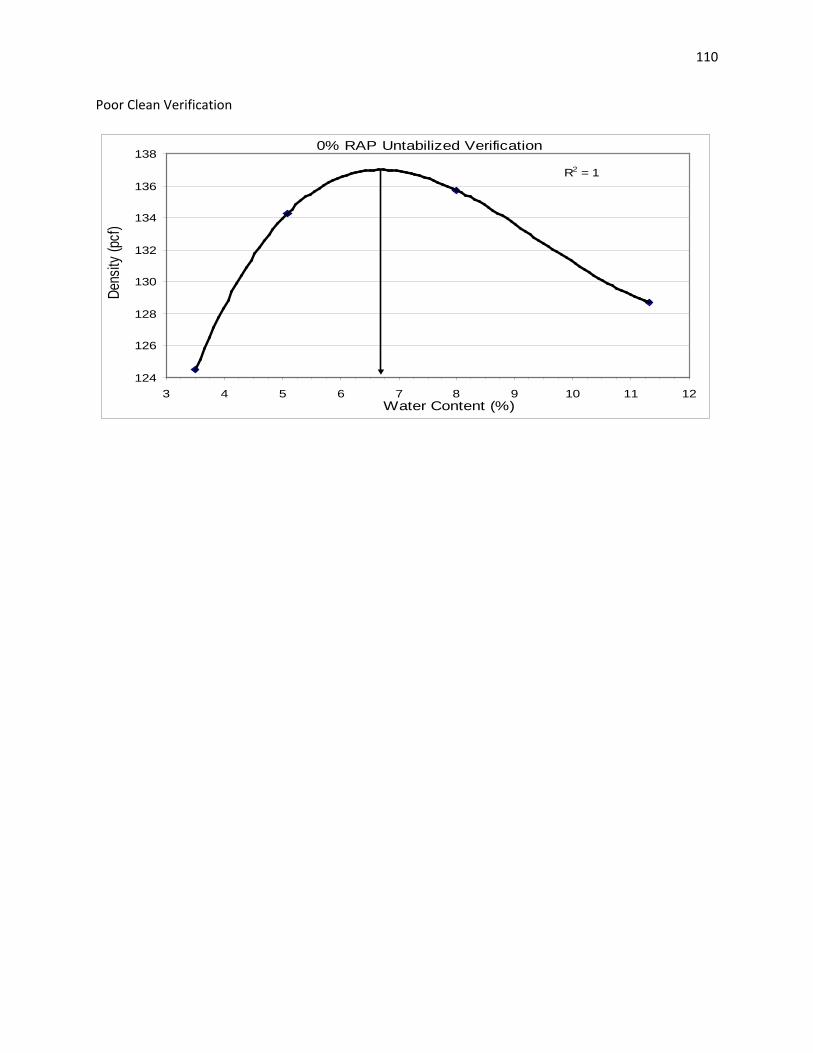
110
Poor Clean Verification
R2 = 1
124
126
128
130
132
134
136
138
3 4 5 6 7 8 9 10 11 12
Dens
ity (p
cf)
0% RAP Untabilized Verification
Water Content (%)

111
Appendix B
Optimum moisture content and maximum dry density
Optimum moisture and density with the shifts for pile changes in the poor clean material. The highlighted values are the old ones before the pile problems.
GOOD SOURCE - CLEAN GRADATION
Percentage of RAP
Unstabilized
Stabilized Cement Fly Ash 3% 5% 7% 10% 12% 15%
75% MC (%) = 9.30 10.25 8.25 9.00 7.28 7.25 6.67
ρ (lb/ft^3) = 120.20 120.90 122.25 124.80 128.00 127.20 129.00
50% MC (%) = 7.70 9.20 8.60 8.75 7.50 7.50 7.52
ρ (lb/ft^3) = 118.90 125.00 125.50 128.00 129.00 130.00 130.30
25% MC (%) = 9.00 9.75 10.30 9.20 7.20 7.30 6.60
ρ (lb/ft^3) = 128.00 128.00 127.50 129.50 131.40 133.00 132.80
0% MC (%) = 8.25
ρ (lb/ft^3) = 132.50 GOOD SOURCE - DIRTY GRADATION
Percentage of RAP
Unstabilized
Stabilized Cement Fly Ash 3% 5% 7% 10% 12% 15%
75% MC (%) = 9.80 8.85 9.20 8.60 7.60 7.35 6.80
ρ (lb/ft^3) = 119.75 122.80 121.80 125.50 128.50 126.30 128.50
50% MC (%) = 7.90 8.60 8.60 7.90 7.10 7.30 6.80
ρ (lb/ft^3) = 128.00 128.00 128.00 130.60 128.00 129.50 128.90
25% MC (%) = 8.10 7.70 7.60 7.80 7.60 7.20 7.10
ρ (lb/ft^3) = 132.50 134.50 133.60 133.10 129.90 130.20 130.00
0% MC (%) = 7.25
ρ (lb/ft^3) = 135.30

112
POOR SOURCE - CLEAN GRADATION
Percentage of RAP
Unstabilized
Stabilized Cement Fly Ash 3% 5% 7% 10% 12% 15%
75% MC (%) = 9.49 6.85 7.04 6.25 8.06 6.58 8.11
ρ (lb/ft^3) = 116.63 131.11 130.00 130.40 123.52 124.53 123.82
50% MC (%) = 7.72 7.76 5.12 6.05 6.65 7.08 7.89
ρ (lb/ft^3) = 126.06 129.04 134.26 136.31 127.09 125.04 127.29
25% MC (%) = 7.40 6.04 5.26 4.99 5.92 5.22 6.47
ρ (lb/ft^3) = 131.02 138.38 136.41 140.56 127.08 122.93 131.23
0% MC (%) = 6.70
ρ (lb/ft^3) = 137.00 POOR SOURCE - DIRTY GRADATION
Percentage of RAP
Unstabilized
Stabilized Cement Fly Ash 3% 5% 7% 10% 12% 15%
75% MC (%) = 7.40 7.75 7.30 7.20 7.35 6.25 6.50
ρ (lb/ft^3) = 127.00 128.50 128.70 131.50 127.10 131.20 132.60
50% MC (%) = 7.00 5.80 6.30 7.00 7.25 5.80 4.50
ρ (lb/ft^3) = 131.00 135.50 134.00 132.90 129.00 134.80 136.80
25% MC (%) = 7.25 5.50 6.10 6.50 6.50 5.20 5.15
ρ (lb/ft^3) = 133.50 137.00 134.50 135.30 134.60 137.00 135.80
0% MC (%) = 6.25
ρ (lb/ft^3) = 137.50
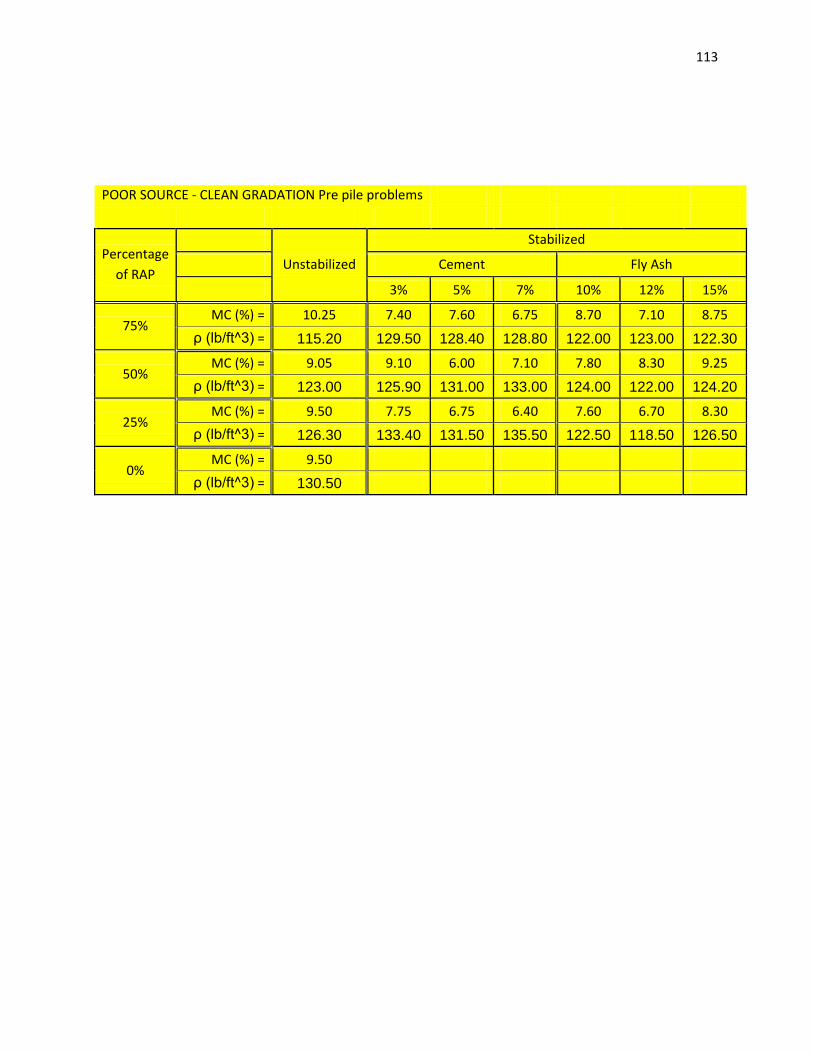
113
POOR SOURCE - CLEAN GRADATION Pre pile problems
Percentage of RAP
Unstabilized
Stabilized Cement Fly Ash 3% 5% 7% 10% 12% 15%
75% MC (%) = 10.25 7.40 7.60 6.75 8.70 7.10 8.75
ρ (lb/ft^3) = 115.20 129.50 128.40 128.80 122.00 123.00 122.30
50% MC (%) = 9.05 9.10 6.00 7.10 7.80 8.30 9.25
ρ (lb/ft^3) = 123.00 125.90 131.00 133.00 124.00 122.00 124.20
25% MC (%) = 9.50 7.75 6.75 6.40 7.60 6.70 8.30
ρ (lb/ft^3) = 126.30 133.40 131.50 135.50 122.50 118.50 126.50
0% MC (%) = 9.50
ρ (lb/ft^3) = 130.50

114
Appendix C
Unconfined compressive strength soaked and un-soaked cement.
UCS Sample UCS Dry @ 77ºF, psi
Tube Suction Sample
UCS Wet @ 77ºF, psi
Material Cement % A B C Avg. CV D E Avg. CV Ratio %
GC 25% RAP
3 680 174 178 344 84 427 351 389 14 113% 5 306 262 280 282 8 603 675 639 8 226% 7 249 244 278 257 7 788 788 788 0 306%
GC 50% RAP
3 123 153 138 138 11 342 370 356 6 259% 5 323 229 374 309 24 401 504 452 16 147% 7 341 415 466 407 15 788 716 752 7 185%
GC 75% RAP
3 173 205 177 185 10 278 284 281 2 152% 5 223 213 274 237 14 449 482 466 5 197% 7 460 385 382 409 11 515 462 489 8 120%
GD 25% RAP
3 301 371 385 352 13 673 499 586 21 166% 5 581 534 550 555 4 1011 1082 1046 5 189% 7 1082 698 963 915 21 1504 1536 1520 1 166%
GD 50% RAP
3 222 232 237 230 3 434 443 438 1 190% 5 462 403 375 413 11 632 630 631 0 153% 7 1066 1066 1146 1093 4 1162 1042 1102 8 101%
GD 75% RAP
3 133 173 129 145 17 266 319 293 13 202% 5 200 250 207 219 12 443 453 448 1 205% 7 359 370 393 374 5 543 537 540 1 144%
PC 25% RAP 3 300 308 278 295 5 501 632 567 16 192% 5 606 585 576 589 3 1098 1210 1154 7 196% 7 786 987 786 853 14 1233 1098 1166 8 137%
PC 50% RAP 3 136 151 186 158 16 322 356 339 7 215% 5 445 380 312 379 18 566 762 664 21 175% 7 525 619 602 582 9 1050 1090 1070 3 184%
PC 75% RAP 3 193 144 130 156 21 384 265 325 26 208% 5 257 281 231 256 10 346 388 367 8 143% 7 510 455 596 520 14 531 604 567 9 109%
PD 25% RAP 3 468 425 469 454 6 1257 1154 1206 6 266% 5 708 939 731 793 16 1281 1377 1329 5 168% 7 1035 971 725 910 18 1544 1353 1448 9 159%
PD 50% RAP 3 478 368 416 421 13 725 692 709 3 168% 5 648 607 728 661 9 697 747 722 5 109% 7 736 665 787 730 8 1130 1027 1078 7 148%
PD 75% RAP 3 260 261 242 254 4 443 335 389 20 153% 5 411 461 355 409 13 618 530 574 11 140% 7 612 614 650 625 3 655 634 645 2 103%

115
Unconfined compressive strength soaked and un-soaked fly ash.
UCS Sample UCS Dry @ 77ºF, psi
Tube Suction Sample
UCS Wet @ 77ºF, psi
Material Fly Ash %
A B C Avg. CV D E Avg. CV Ratio %
GC 25% RAP
10 1552 1353 1695 1533 11 791 796 793 0 52%
12 795 N/A 995 895 16 795 797 796 0 89%
15 1058 875 1154 1029 14 798 791 795 1 77%
GC 50% RAP
10 351 311 464 375 21 783 792 788 1 210%
12 412 369 304 362 15 779 784 781 0 216%
15 370 424 421 405 8 793 789 791 0 195%
GC 75% RAP
10 254 281 309 281 10 614 633 623 2 222%
12 307 376 321 335 11 590 543 566 6 169%
15 363 495 376 412 18 796 773 785 2 191%
GD 25% RAP
10 552 571 615 579 6 262 258 260 1 45%
12 610 693 635 646 7 240 253 246 4 38%
15 662 445 630 579 20 333 320 326 3 56%
GD 50% RAP
10 363 342 532 412 25 168 190 179 9 44%
12 671 605 537 604 11 184 242 213 19 35%
15 428 510 643 527 21 268 243 255 7 48%
GD 75% RAP
10 223 312 293 276 17 117 107 112 6 41%
12 345 342 304 330 7 124 127 125 2 38%
15 513 381 543 479 18 185 199 192 5 40%
PC 25% RAP
10 561 534 580 559 4 636 552 594 10 106%
12 682 652 607 647 6 641 625 633 2 98%
15 844 955 1066 955 12 774 634 704 14 74%
PC 50% RAP
10 301 374 361 345 11 453 521 487 10 141%
12 368 434 409 404 8 615 523 569 12 141%
15 581 601 596 593 2 731 716 723 2 122%
PC 75% RAP
10 208 177 269 218 21 358 401 380 8 174%
12 275 341 364 327 14 500 532 516 4 158%
15 343 411 474 409 16 471 621 546 19 133%

116
PD 25% RAP
10 92 66 76 78 17 547 331 439 35 562%
12 177 166 149 164 9 382 343 362 8 221%
15 172 188 151 170 11 424 359 392 12 230%
PD 50% RAP
10 35 29 38 34 14 309 447 378 26 1113%
12 61 71 52 61 15 295 298 296 1 482%
15 154 156 166 159 4 406 274 340 27 214%
PD 75% RAP
10 37 40 40 39 5 327 384 356 11 915%
12 63 56 64 61 7 277 444 360 33 594%
15 65 71 53 63 14 272 416 344 30 547%

117
Moisture sensitivity for cement and fly ash dielectric constants.
Tube Suction Sample
Tube Suction Sample
Material Cement % A B Avg. CV
Fly Ash % A B Avg. CV
GC 25% RAP
3 4.48 6.14 5.31 22.11 10 4.77 4.20 4.49 9.04 5 6.14 3.01 4.57 48.45 12 4.97 5.19 5.08 3.16 7 2.98 5.15 4.06 37.70 15 6.03 5.75 5.89 3.28
GC 50% RAP
3 4.84 3.07 3.95 31.72 10 5.75 3.87 4.81 27.66 5 3.27 2.55 2.91 17.33 12 4.81 3.44 4.13 23.53 7 4.93 4.23 4.58 10.91 15 5.81 6.34 6.08 6.13
GC 75% RAP
3 3.79 3.77 3.78 0.37 10 4.68 5.92 5.30 16.54 5 2.93 2.81 2.87 2.96 12 4.72 4.45 4.58 4.22 7 2.65 5.05 3.85 43.96 15 5.96 2.71 4.33 53.09
GD 25% RAP
3 8.07 4.57 6.32 39.14 10 11.07 10.04 10.56 6.92 5 6.71 6.87 6.79 1.60 12 10.87 11.28 11.08 2.60 7 5.34 5.94 5.64 7.52 15 8.52 7.83 8.18 5.94
GD 50% RAP
3 5.58 5.83 5.71 3.14 10 6.50 7.60 7.05 11.03 5 5.97 4.67 5.32 17.27 12 13.56 8.35 10.96 33.60 7 6.13 7.77 6.95 16.69 15 9.29 9.17 9.23 0.97
GD 75% RAP
3 8.23 10.39 9.31 16.40 10 7.66 8.36 8.01 6.18 5 5.59 7.19 6.39 17.63 12 11.53 6.83 9.18 36.15 7 5.05 6.80 5.93 20.84 15 5.63 8.49 7.06 28.63
PC 25% RAP
3 6.24 6.19 6.22 0.53 10 5.14 6.81 5.97 19.73 5 8.39 6.68 7.54 16.07 12 4.33 5.39 4.86 15.52 7 3.73 6.77 5.25 40.92 15 6.38 3.71 5.04 37.48
PC 50% RAP
3 7.94 7.77 7.86 1.50 10 6.11 8.23 7.17 20.84 5 4.25 3.72 3.98 9.35 12 6.23 6.86 6.54 6.84 7 4.72 4.11 4.41 9.83 15 3.43 4.21 3.82 14.31
PC 75% RAP
3 4.84 6.45 5.65 20.20 10 7.71 4.28 5.99 40.43 5 6.80 7.46 7.13 6.55 12 6.13 5.18 5.65 11.84 7 4.62 3.81 4.21 13.65 15 7.89 9.17 8.53 10.67
PD 25% RAP
3 6.56 4.52 5.54 26.04 10 4.77 7.75 6.26 33.68 5 2.99 3.97 3.48 19.78 12 4.10 6.90 5.50 36.00 7 4.93 3.01 3.97 34.23 15 5.87 7.89 6.88 20.77
PD 50% RAP
3 3.17 2.93 3.05 5.57 10 9.03 5.04 7.03 40.08 5 3.91 4.57 4.24 11.12 12 6.99 7.21 7.10 2.19 7 3.36 4.45 3.91 19.79 15 9.09 10.49 9.79 10.06
PD 75% RAP
3 4.43 6.01 5.22 21.49 10 4.87 4.99 4.93 1.72 5 3.49 3.69 3.59 4.07 12 8.99 7.95 8.47 8.69 7 3.69 3.51 3.60 3.67 15 6.93 11.41 9.17 34.49
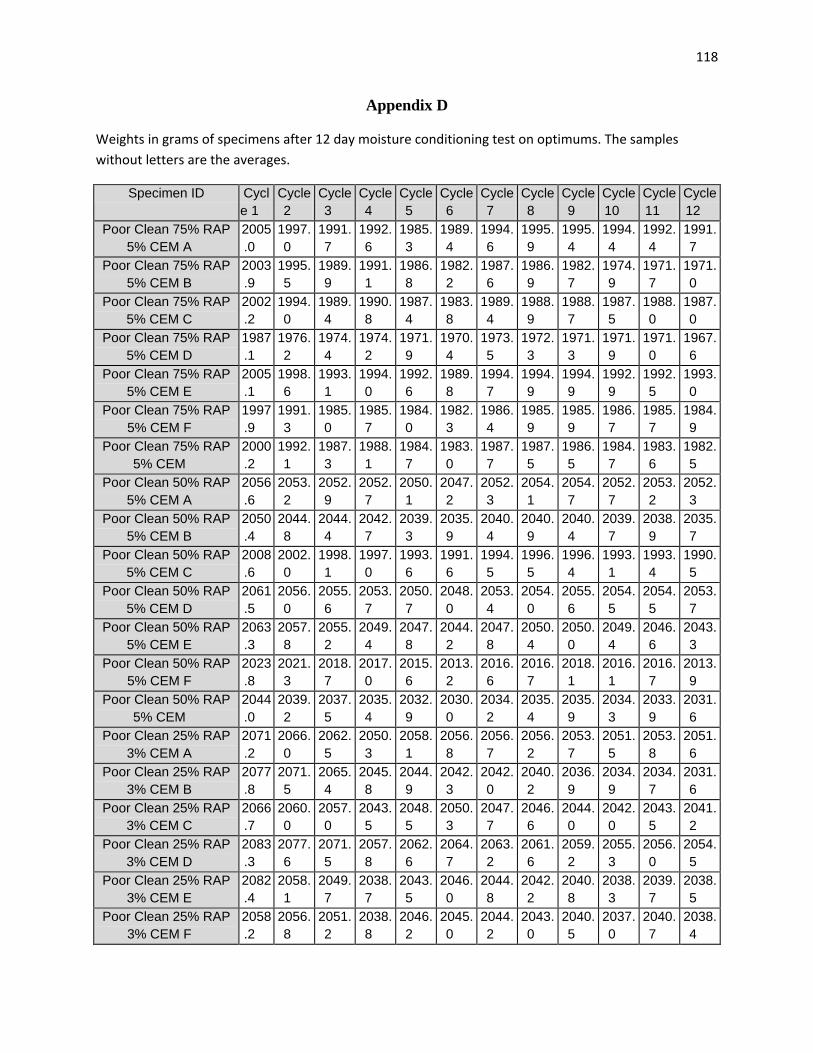
118
Appendix D
Weights in grams of specimens after 12 day moisture conditioning test on optimums. The samples without letters are the averages.
Specimen ID Cycle 1
Cycle 2
Cycle 3
Cycle 4
Cycle 5
Cycle 6
Cycle 7
Cycle 8
Cycle 9
Cycle 10
Cycle 11
Cycle 12
Poor Clean 75% RAP 5% CEM A
2005.0
1997.0
1991.7
1992.6
1985.3
1989.4
1994.6
1995.9
1995.4
1994.4
1992.4
1991.7
Poor Clean 75% RAP 5% CEM B
2003.9
1995.5
1989.9
1991.1
1986.8
1982.2
1987.6
1986.9
1982.7
1974.9
1971.7
1971.0
Poor Clean 75% RAP 5% CEM C
2002.2
1994.0
1989.4
1990.8
1987.4
1983.8
1989.4
1988.9
1988.7
1987.5
1988.0
1987.0
Poor Clean 75% RAP 5% CEM D
1987.1
1976.2
1974.4
1974.2
1971.9
1970.4
1973.5
1972.3
1971.3
1971.9
1971.0
1967.6
Poor Clean 75% RAP 5% CEM E
2005.1
1998.6
1993.1
1994.0
1992.6
1989.8
1994.7
1994.9
1994.9
1992.9
1992.5
1993.0
Poor Clean 75% RAP 5% CEM F
1997.9
1991.3
1985.0
1985.7
1984.0
1982.3
1986.4
1985.9
1985.9
1986.7
1985.7
1984.9
Poor Clean 75% RAP 5% CEM
2000.2
1992.1
1987.3
1988.1
1984.7
1983.0
1987.7
1987.5
1986.5
1984.7
1983.6
1982.5
Poor Clean 50% RAP 5% CEM A
2056.6
2053.2
2052.9
2052.7
2050.1
2047.2
2052.3
2054.1
2054.7
2052.7
2053.2
2052.3
Poor Clean 50% RAP 5% CEM B
2050.4
2044.8
2044.4
2042.7
2039.3
2035.9
2040.4
2040.9
2040.4
2039.7
2038.9
2035.7
Poor Clean 50% RAP 5% CEM C
2008.6
2002.0
1998.1
1997.0
1993.6
1991.6
1994.5
1996.5
1996.4
1993.1
1993.4
1990.5
Poor Clean 50% RAP 5% CEM D
2061.5
2056.0
2055.6
2053.7
2050.7
2048.0
2053.4
2054.0
2055.6
2054.5
2054.5
2053.7
Poor Clean 50% RAP 5% CEM E
2063.3
2057.8
2055.2
2049.4
2047.8
2044.2
2047.8
2050.4
2050.0
2049.4
2046.6
2043.3
Poor Clean 50% RAP 5% CEM F
2023.8
2021.3
2018.7
2017.0
2015.6
2013.2
2016.6
2016.7
2018.1
2016.1
2016.7
2013.9
Poor Clean 50% RAP 5% CEM
2044.0
2039.2
2037.5
2035.4
2032.9
2030.0
2034.2
2035.4
2035.9
2034.3
2033.9
2031.6
Poor Clean 25% RAP 3% CEM A
2071.2
2066.0
2062.5
2050.3
2058.1
2056.8
2056.7
2056.2
2053.7
2051.5
2053.8
2051.6
Poor Clean 25% RAP 3% CEM B
2077.8
2071.5
2065.4
2045.8
2044.9
2042.3
2042.0
2040.2
2036.9
2034.9
2034.7
2031.6
Poor Clean 25% RAP 3% CEM C
2066.7
2060.0
2057.0
2043.5
2048.5
2050.3
2047.7
2046.6
2044.0
2042.0
2043.5
2041.2
Poor Clean 25% RAP 3% CEM D
2083.3
2077.6
2071.5
2057.8
2062.6
2064.7
2063.2
2061.6
2059.2
2055.3
2056.0
2054.5
Poor Clean 25% RAP 3% CEM E
2082.4
2058.1
2049.7
2038.7
2043.5
2046.0
2044.8
2042.2
2040.8
2038.3
2039.7
2038.5
Poor Clean 25% RAP 3% CEM F
2058.2
2056.8
2051.2
2038.8
2046.2
2045.0
2044.2
2043.0
2040.5
2037.0
2040.7
2038.4
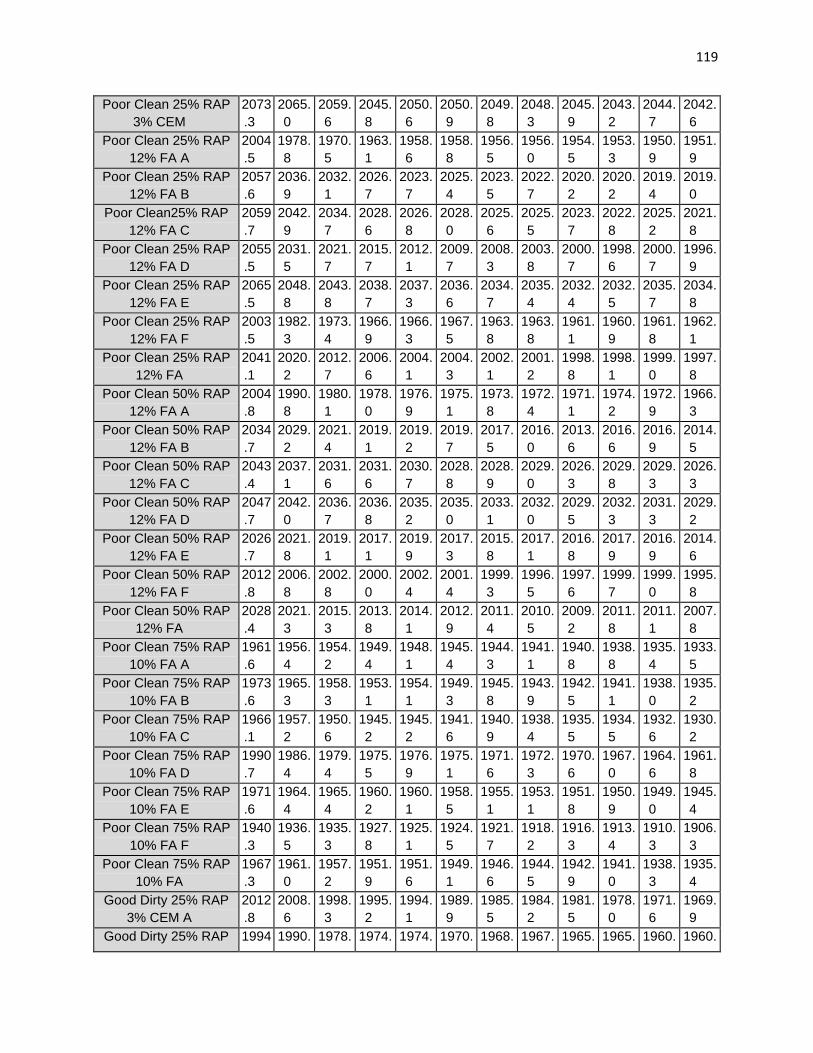
119
Poor Clean 25% RAP 3% CEM
2073.3
2065.0
2059.6
2045.8
2050.6
2050.9
2049.8
2048.3
2045.9
2043.2
2044.7
2042.6
Poor Clean 25% RAP 12% FA A
2004.5
1978.8
1970.5
1963.1
1958.6
1958.8
1956.5
1956.0
1954.5
1953.3
1950.9
1951.9
Poor Clean 25% RAP 12% FA B
2057.6
2036.9
2032.1
2026.7
2023.7
2025.4
2023.5
2022.7
2020.2
2020.2
2019.4
2019.0
Poor Clean25% RAP 12% FA C
2059.7
2042.9
2034.7
2028.6
2026.8
2028.0
2025.6
2025.5
2023.7
2022.8
2025.2
2021.8
Poor Clean 25% RAP 12% FA D
2055.5
2031.5
2021.7
2015.7
2012.1
2009.7
2008.3
2003.8
2000.7
1998.6
2000.7
1996.9
Poor Clean 25% RAP 12% FA E
2065.5
2048.8
2043.8
2038.7
2037.3
2036.6
2034.7
2035.4
2032.4
2032.5
2035.7
2034.8
Poor Clean 25% RAP 12% FA F
2003.5
1982.3
1973.4
1966.9
1966.3
1967.5
1963.8
1963.8
1961.1
1960.9
1961.8
1962.1
Poor Clean 25% RAP 12% FA
2041.1
2020.2
2012.7
2006.6
2004.1
2004.3
2002.1
2001.2
1998.8
1998.1
1999.0
1997.8
Poor Clean 50% RAP 12% FA A
2004.8
1990.8
1980.1
1978.0
1976.9
1975.1
1973.8
1972.4
1971.1
1974.2
1972.9
1966.3
Poor Clean 50% RAP 12% FA B
2034.7
2029.2
2021.4
2019.1
2019.2
2019.7
2017.5
2016.0
2013.6
2016.6
2016.9
2014.5
Poor Clean 50% RAP 12% FA C
2043.4
2037.1
2031.6
2031.6
2030.7
2028.8
2028.9
2029.0
2026.3
2029.8
2029.3
2026.3
Poor Clean 50% RAP 12% FA D
2047.7
2042.0
2036.7
2036.8
2035.2
2035.0
2033.1
2032.0
2029.5
2032.3
2031.3
2029.2
Poor Clean 50% RAP 12% FA E
2026.7
2021.8
2019.1
2017.1
2019.9
2017.3
2015.8
2017.1
2016.8
2017.9
2016.9
2014.6
Poor Clean 50% RAP 12% FA F
2012.8
2006.8
2002.8
2000.0
2002.4
2001.4
1999.3
1996.5
1997.6
1999.7
1999.0
1995.8
Poor Clean 50% RAP 12% FA
2028.4
2021.3
2015.3
2013.8
2014.1
2012.9
2011.4
2010.5
2009.2
2011.8
2011.1
2007.8
Poor Clean 75% RAP 10% FA A
1961.6
1956.4
1954.2
1949.4
1948.1
1945.4
1944.3
1941.1
1940.8
1938.8
1935.4
1933.5
Poor Clean 75% RAP 10% FA B
1973.6
1965.3
1958.3
1953.1
1954.1
1949.3
1945.8
1943.9
1942.5
1941.1
1938.0
1935.2
Poor Clean 75% RAP 10% FA C
1966.1
1957.2
1950.6
1945.2
1945.2
1941.6
1940.9
1938.4
1935.5
1934.5
1932.6
1930.2
Poor Clean 75% RAP 10% FA D
1990.7
1986.4
1979.4
1975.5
1976.9
1975.1
1971.6
1972.3
1970.6
1967.0
1964.6
1961.8
Poor Clean 75% RAP 10% FA E
1971.6
1964.4
1965.4
1960.2
1960.1
1958.5
1955.1
1953.1
1951.8
1950.9
1949.0
1945.4
Poor Clean 75% RAP 10% FA F
1940.3
1936.5
1935.3
1927.8
1925.1
1924.5
1921.7
1918.2
1916.3
1913.4
1910.3
1906.3
Poor Clean 75% RAP 10% FA
1967.3
1961.0
1957.2
1951.9
1951.6
1949.1
1946.6
1944.5
1942.9
1941.0
1938.3
1935.4
Good Dirty 25% RAP 3% CEM A
2012.8
2008.6
1998.3
1995.2
1994.1
1989.9
1985.5
1984.2
1981.5
1978.0
1971.6
1969.9
Good Dirty 25% RAP 1994 1990. 1978. 1974. 1974. 1970. 1968. 1967. 1965. 1965. 1960. 1960.

120
3% CEM B .8 7 5 5 5 9 3 7 9 5 7 3
Good Dirty 25% RAP 3% CEM C
1972.1
1969.7
1961.2
1957.9
1957.1
1952.2
1949.7
1947.3
1945.0
1942.0
1936.7
1934.7
Good Dirty 25% RAP 3% CEM D
1962.7
1958.7
1954.9
1952.9
1953.3
1950.7
1948.8
1947.1
1945.5
1945.2
1942.1
1940.3
Good Dirty 25% RAP 3% CEM E
2006.2
1998.3
1983.6
1973.9
1968.9
1963.1
1955.5
1947.7
1942.7
1934.0
1920.3
1915.9
Good Dirty 25% RAP 3% CEM F
1997.8
1989.1
1978.2
1971.3
1965.9
1957.5
1950.8
1944.8
1940.0
1934.7
1924.7
1917.5
Good Dirty 25% RAP 3% CEM
1991.1
1985.9
1975.8
1971.0
1969.0
1964.1
1959.8
1956.5
1953.4
1949.9
1942.7
1939.8
Good Dirty 50% RAP 5% CEM A
2146.0
2133.4
2127.7
2129.6
2126.5
2133.4
2125.6
2135.3
2129.2
2125.5
2131.2
2137.0
Good Dirty 50% RAP 5% CEM B
2134.6
2121.3
2116.3
2121.9
2117.6
2120.5
2113.1
2118.6
2115.7
2115.0
2118.4
2125.2
Good Dirty 50% RAP 5% CEM C
2148.5
2135.6
2131.2
2133.5
2130.2
2137.1
2129.3
2140.5
2131.9
2127.8
2133.6
2137.2
Good Dirty 50% RAP 5% CEM D
2115.6
2098.9
2093.0
2095.3
2089.7
2092.6
2087.3
2089.4
2082.4
2079.5
2081.5
2084.8
Good Dirty 50% RAP 5% CEM E
2089.4
2064.8
2051.5
2048.0
2044.2
2034.7
2025.6
2021.7
2016.2
2009.0
2004.7
2003.5
Good Dirty 50% RAP 5% CEM F
2078.5
2063.5
2054.6
2053.8
2050.3
2052.8
2046.9
2049.9
2044.1
2038.3
2041.2
2041.8
Good Dirty 50% RAP 5% CEM
2118.8
2102.9
2095.7
2097.0
2093.1
2095.2
2088.0
2092.6
2086.6
2082.5
2085.1
2088.3
Good Dirty 75% RAP 7% CEM A
2055.1
2043.5
2042.7
2038.2
2041.3
2038.4
2042.2
2039.7
2036.6
2037.8
2040.3
2037.1
Good Dirty 75% RAP 7% CEM B
2039.2
2025.8
2024.0
2020.4
2021.1
2017.2
2017.9
2015.3
2014.0
2014.0
2015.7
2010.0
Good Dirty 75% RAP 7% CEM C
2027.9
2015.5
2014.5
2010.8
2012.9
2008.7
2012.4
2009.6
2007.8
2009.9
2013.9
2009.4
Good Dirty 75% RAP 7% CEM D
2029.3
2018.3
2017.3
2014.2
2014.6
2011.8
2013.5
2009.9
2009.3
2009.2
2013.3
2013.2
Good Dirty 75% RAP 7% CEM E
2039.8
2029.3
2028.1
2022.7
2027.6
2021.5
2027.1
2023.7
2020.2
2022.1
2026.2
2022.4
Good Dirty 75% RAP 7% CEM F
2019.9
2008.2
2007.4
2002.6
2007.1
2002.8
2005.9
2003.4
2000.5
2002.5
2004.5
2002.1
Good Dirty 75% RAP 7% CEM
2035.2
2023.4
2022.3
2018.2
2020.8
2016.7
2019.8
2016.9
2014.7
2015.9
2019.0
2015.7
Good Dirty 75% RAP 10% FA A
1814.9
1792.6
1785.2
1776.2
1773.8
1770.6
1766.7
1751.2
1749.9
1740.0
1736.2
1735.8
Good Dirty 75% RAP 10% FA B
1844.0
1822.8
1816.2
1807.5
1804.7
1799.2
1794.9
1792.9
1795.0
1789.7
1786.2
1785.8
Good Dirty 75% RAP 10% FA C
1862.2
1835.4
1823.6
1810.6
1810.4
1803.4
1799.2
1798.7
1799.1
1792.7
1791.3
1790.4
Good Dirty 75% RAP 10% FA D
1839.0
1818.5
1810.2
1800.9
1800.2
1796.2
1792.3
1791.5
1788.0
1784.1
1782.7
1782.4
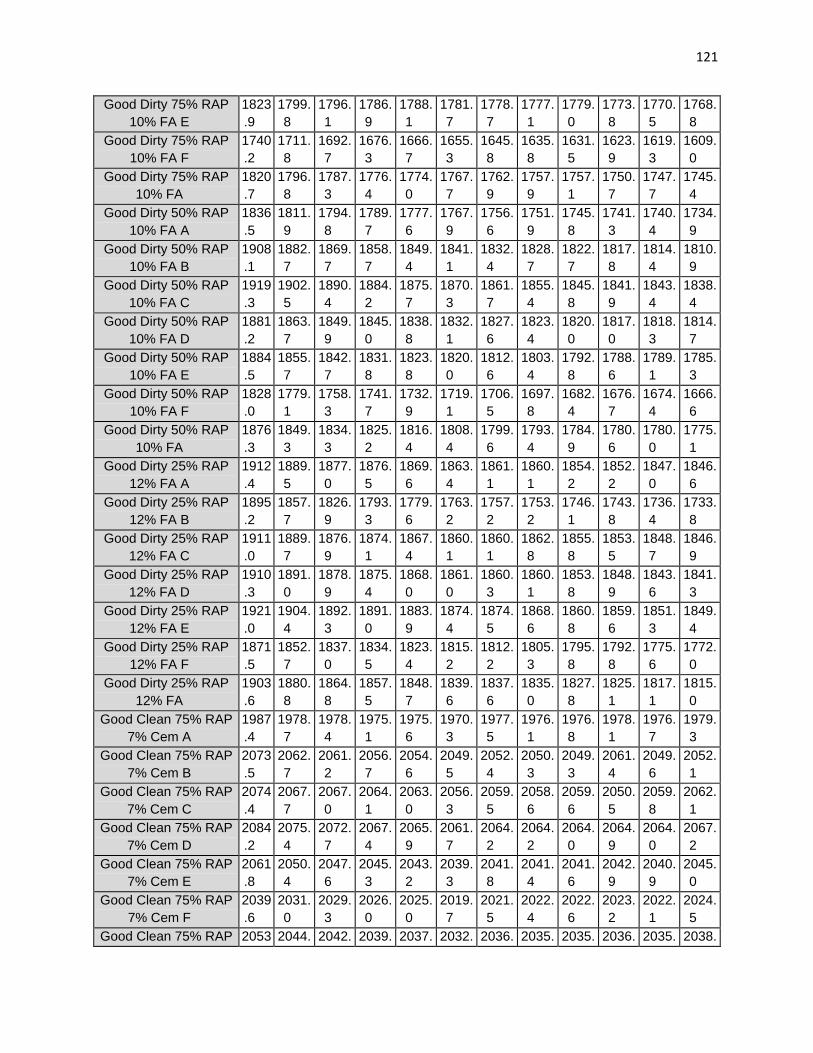
121
Good Dirty 75% RAP 10% FA E
1823.9
1799.8
1796.1
1786.9
1788.1
1781.7
1778.7
1777.1
1779.0
1773.8
1770.5
1768.8
Good Dirty 75% RAP 10% FA F
1740.2
1711.8
1692.7
1676.3
1666.7
1655.3
1645.8
1635.8
1631.5
1623.9
1619.3
1609.0
Good Dirty 75% RAP 10% FA
1820.7
1796.8
1787.3
1776.4
1774.0
1767.7
1762.9
1757.9
1757.1
1750.7
1747.7
1745.4
Good Dirty 50% RAP 10% FA A
1836.5
1811.9
1794.8
1789.7
1777.6
1767.9
1756.6
1751.9
1745.8
1741.3
1740.4
1734.9
Good Dirty 50% RAP 10% FA B
1908.1
1882.7
1869.7
1858.7
1849.4
1841.1
1832.4
1828.7
1822.7
1817.8
1814.4
1810.9
Good Dirty 50% RAP 10% FA C
1919.3
1902.5
1890.4
1884.2
1875.7
1870.3
1861.7
1855.4
1845.8
1841.9
1843.4
1838.4
Good Dirty 50% RAP 10% FA D
1881.2
1863.7
1849.9
1845.0
1838.8
1832.1
1827.6
1823.4
1820.0
1817.0
1818.3
1814.7
Good Dirty 50% RAP 10% FA E
1884.5
1855.7
1842.7
1831.8
1823.8
1820.0
1812.6
1803.4
1792.8
1788.6
1789.1
1785.3
Good Dirty 50% RAP 10% FA F
1828.0
1779.1
1758.3
1741.7
1732.9
1719.1
1706.5
1697.8
1682.4
1676.7
1674.4
1666.6
Good Dirty 50% RAP 10% FA
1876.3
1849.3
1834.3
1825.2
1816.4
1808.4
1799.6
1793.4
1784.9
1780.6
1780.0
1775.1
Good Dirty 25% RAP 12% FA A
1912.4
1889.5
1877.0
1876.5
1869.6
1863.4
1861.1
1860.1
1854.2
1852.2
1847.0
1846.6
Good Dirty 25% RAP 12% FA B
1895.2
1857.7
1826.9
1793.3
1779.6
1763.2
1757.2
1753.2
1746.1
1743.8
1736.4
1733.8
Good Dirty 25% RAP 12% FA C
1911.0
1889.7
1876.9
1874.1
1867.4
1860.1
1860.1
1862.8
1855.8
1853.5
1848.7
1846.9
Good Dirty 25% RAP 12% FA D
1910.3
1891.0
1878.9
1875.4
1868.0
1861.0
1860.3
1860.1
1853.8
1848.9
1843.6
1841.3
Good Dirty 25% RAP 12% FA E
1921.0
1904.4
1892.3
1891.0
1883.9
1874.4
1874.5
1868.6
1860.8
1859.6
1851.3
1849.4
Good Dirty 25% RAP 12% FA F
1871.5
1852.7
1837.0
1834.5
1823.4
1815.2
1812.2
1805.3
1795.8
1792.8
1775.6
1772.0
Good Dirty 25% RAP 12% FA
1903.6
1880.8
1864.8
1857.5
1848.7
1839.6
1837.6
1835.0
1827.8
1825.1
1817.1
1815.0
Good Clean 75% RAP 7% Cem A
1987.4
1978.7
1978.4
1975.1
1975.6
1970.3
1977.5
1976.1
1976.8
1978.1
1976.7
1979.3
Good Clean 75% RAP 7% Cem B
2073.5
2062.7
2061.2
2056.7
2054.6
2049.5
2052.4
2050.3
2049.3
2061.4
2049.6
2052.1
Good Clean 75% RAP 7% Cem C
2074.4
2067.7
2067.0
2064.1
2063.0
2056.3
2059.5
2058.6
2059.6
2050.5
2059.8
2062.1
Good Clean 75% RAP 7% Cem D
2084.2
2075.4
2072.7
2067.4
2065.9
2061.7
2064.2
2064.2
2064.0
2064.9
2064.0
2067.2
Good Clean 75% RAP 7% Cem E
2061.8
2050.4
2047.6
2045.3
2043.2
2039.3
2041.8
2041.4
2041.6
2042.9
2040.9
2045.0
Good Clean 75% RAP 7% Cem F
2039.6
2031.0
2029.3
2026.0
2025.0
2019.7
2021.5
2022.4
2022.6
2023.2
2022.1
2024.5
Good Clean 75% RAP 2053 2044. 2042. 2039. 2037. 2032. 2036. 2035. 2035. 2036. 2035. 2038.
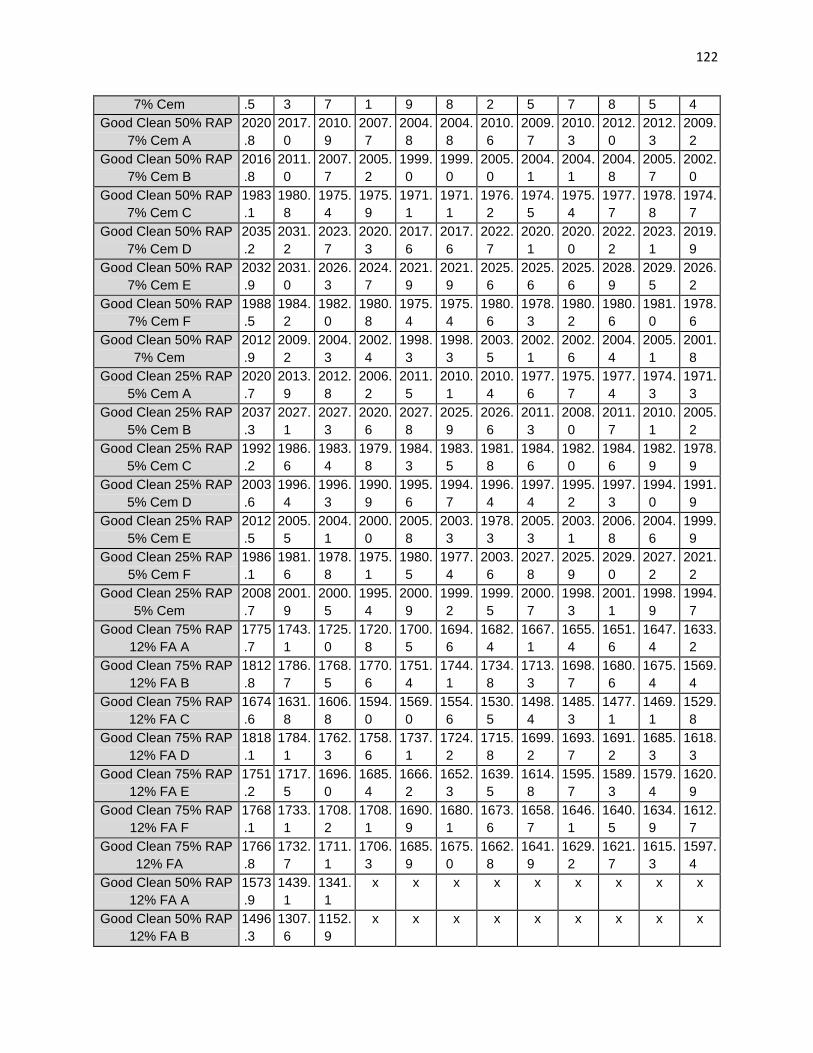
122
7% Cem .5 3 7 1 9 8 2 5 7 8 5 4 Good Clean 50% RAP
7% Cem A 2020.8
2017.0
2010.9
2007.7
2004.8
2004.8
2010.6
2009.7
2010.3
2012.0
2012.3
2009.2
Good Clean 50% RAP 7% Cem B
2016.8
2011.0
2007.7
2005.2
1999.0
1999.0
2005.0
2004.1
2004.1
2004.8
2005.7
2002.0
Good Clean 50% RAP 7% Cem C
1983.1
1980.8
1975.4
1975.9
1971.1
1971.1
1976.2
1974.5
1975.4
1977.7
1978.8
1974.7
Good Clean 50% RAP 7% Cem D
2035.2
2031.2
2023.7
2020.3
2017.6
2017.6
2022.7
2020.1
2020.0
2022.2
2023.1
2019.9
Good Clean 50% RAP 7% Cem E
2032.9
2031.0
2026.3
2024.7
2021.9
2021.9
2025.6
2025.6
2025.6
2028.9
2029.5
2026.2
Good Clean 50% RAP 7% Cem F
1988.5
1984.2
1982.0
1980.8
1975.4
1975.4
1980.6
1978.3
1980.2
1980.6
1981.0
1978.6
Good Clean 50% RAP 7% Cem
2012.9
2009.2
2004.3
2002.4
1998.3
1998.3
2003.5
2002.1
2002.6
2004.4
2005.1
2001.8
Good Clean 25% RAP 5% Cem A
2020.7
2013.9
2012.8
2006.2
2011.5
2010.1
2010.4
1977.6
1975.7
1977.4
1974.3
1971.3
Good Clean 25% RAP 5% Cem B
2037.3
2027.1
2027.3
2020.6
2027.8
2025.9
2026.6
2011.3
2008.0
2011.7
2010.1
2005.2
Good Clean 25% RAP 5% Cem C
1992.2
1986.6
1983.4
1979.8
1984.3
1983.5
1981.8
1984.6
1982.0
1984.6
1982.9
1978.9
Good Clean 25% RAP 5% Cem D
2003.6
1996.4
1996.3
1990.9
1995.6
1994.7
1996.4
1997.4
1995.2
1997.3
1994.0
1991.9
Good Clean 25% RAP 5% Cem E
2012.5
2005.5
2004.1
2000.0
2005.8
2003.3
1978.3
2005.3
2003.1
2006.8
2004.6
1999.9
Good Clean 25% RAP 5% Cem F
1986.1
1981.6
1978.8
1975.1
1980.5
1977.4
2003.6
2027.8
2025.9
2029.0
2027.2
2021.2
Good Clean 25% RAP 5% Cem
2008.7
2001.9
2000.5
1995.4
2000.9
1999.2
1999.5
2000.7
1998.3
2001.1
1998.9
1994.7
Good Clean 75% RAP 12% FA A
1775.7
1743.1
1725.0
1720.8
1700.5
1694.6
1682.4
1667.1
1655.4
1651.6
1647.4
1633.2
Good Clean 75% RAP 12% FA B
1812.8
1786.7
1768.5
1770.6
1751.4
1744.1
1734.8
1713.3
1698.7
1680.6
1675.4
1569.4
Good Clean 75% RAP 12% FA C
1674.6
1631.8
1606.8
1594.0
1569.0
1554.6
1530.5
1498.4
1485.3
1477.1
1469.1
1529.8
Good Clean 75% RAP 12% FA D
1818.1
1784.1
1762.3
1758.6
1737.1
1724.2
1715.8
1699.2
1693.7
1691.2
1685.3
1618.3
Good Clean 75% RAP 12% FA E
1751.2
1717.5
1696.0
1685.4
1666.2
1652.3
1639.5
1614.8
1595.7
1589.3
1579.4
1620.9
Good Clean 75% RAP 12% FA F
1768.1
1733.1
1708.2
1708.1
1690.9
1680.1
1673.6
1658.7
1646.1
1640.5
1634.9
1612.7
Good Clean 75% RAP 12% FA
1766.8
1732.7
1711.1
1706.3
1685.9
1675.0
1662.8
1641.9
1629.2
1621.7
1615.3
1597.4
Good Clean 50% RAP 12% FA A
1573.9
1439.1
1341.1
x x x x x x x x x
Good Clean 50% RAP 12% FA B
1496.3
1307.6
1152.9
x x x x x x x x x
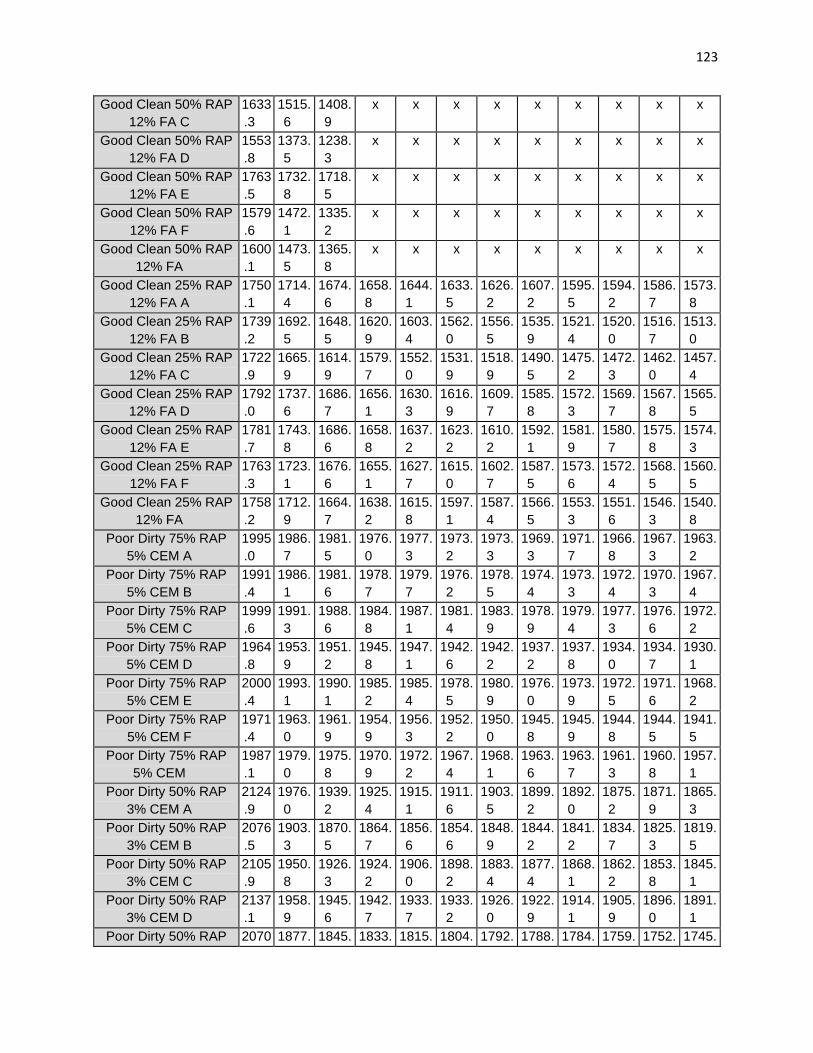
123
Good Clean 50% RAP 12% FA C
1633.3
1515.6
1408.9
x x x x x x x x x
Good Clean 50% RAP 12% FA D
1553.8
1373.5
1238.3
x x x x x x x x x
Good Clean 50% RAP 12% FA E
1763.5
1732.8
1718.5
x x x x x x x x x
Good Clean 50% RAP 12% FA F
1579.6
1472.1
1335.2
x x x x x x x x x
Good Clean 50% RAP 12% FA
1600.1
1473.5
1365.8
x x x x x x x x x
Good Clean 25% RAP 12% FA A
1750.1
1714.4
1674.6
1658.8
1644.1
1633.5
1626.2
1607.2
1595.5
1594.2
1586.7
1573.8
Good Clean 25% RAP 12% FA B
1739.2
1692.5
1648.5
1620.9
1603.4
1562.0
1556.5
1535.9
1521.4
1520.0
1516.7
1513.0
Good Clean 25% RAP 12% FA C
1722.9
1665.9
1614.9
1579.7
1552.0
1531.9
1518.9
1490.5
1475.2
1472.3
1462.0
1457.4
Good Clean 25% RAP 12% FA D
1792.0
1737.6
1686.7
1656.1
1630.3
1616.9
1609.7
1585.8
1572.3
1569.7
1567.8
1565.5
Good Clean 25% RAP 12% FA E
1781.7
1743.8
1686.6
1658.8
1637.2
1623.2
1610.2
1592.1
1581.9
1580.7
1575.8
1574.3
Good Clean 25% RAP 12% FA F
1763.3
1723.1
1676.6
1655.1
1627.7
1615.0
1602.7
1587.5
1573.6
1572.4
1568.5
1560.5
Good Clean 25% RAP 12% FA
1758.2
1712.9
1664.7
1638.2
1615.8
1597.1
1587.4
1566.5
1553.3
1551.6
1546.3
1540.8
Poor Dirty 75% RAP 5% CEM A
1995.0
1986.7
1981.5
1976.0
1977.3
1973.2
1973.3
1969.3
1971.7
1966.8
1967.3
1963.2
Poor Dirty 75% RAP 5% CEM B
1991.4
1986.1
1981.6
1978.7
1979.7
1976.2
1978.5
1974.4
1973.3
1972.4
1970.3
1967.4
Poor Dirty 75% RAP 5% CEM C
1999.6
1991.3
1988.6
1984.8
1987.1
1981.4
1983.9
1978.9
1979.4
1977.3
1976.6
1972.2
Poor Dirty 75% RAP 5% CEM D
1964.8
1953.9
1951.2
1945.8
1947.1
1942.6
1942.2
1937.2
1937.8
1934.0
1934.7
1930.1
Poor Dirty 75% RAP 5% CEM E
2000.4
1993.1
1990.1
1985.2
1985.4
1978.5
1980.9
1976.0
1973.9
1972.5
1971.6
1968.2
Poor Dirty 75% RAP 5% CEM F
1971.4
1963.0
1961.9
1954.9
1956.3
1952.2
1950.0
1945.8
1945.9
1944.8
1944.5
1941.5
Poor Dirty 75% RAP 5% CEM
1987.1
1979.0
1975.8
1970.9
1972.2
1967.4
1968.1
1963.6
1963.7
1961.3
1960.8
1957.1
Poor Dirty 50% RAP 3% CEM A
2124.9
1976.0
1939.2
1925.4
1915.1
1911.6
1903.5
1899.2
1892.0
1875.2
1871.9
1865.3
Poor Dirty 50% RAP 3% CEM B
2076.5
1903.3
1870.5
1864.7
1856.6
1854.6
1848.9
1844.2
1841.2
1834.7
1825.3
1819.5
Poor Dirty 50% RAP 3% CEM C
2105.9
1950.8
1926.3
1924.2
1906.0
1898.2
1883.4
1877.4
1868.1
1862.2
1853.8
1845.1
Poor Dirty 50% RAP 3% CEM D
2137.1
1958.9
1945.6
1942.7
1933.7
1933.2
1926.0
1922.9
1914.1
1905.9
1896.0
1891.1
Poor Dirty 50% RAP 2070 1877. 1845. 1833. 1815. 1804. 1792. 1788. 1784. 1759. 1752. 1745.

124
3% CEM E .9 3 6 2 3 4 2 7 1 1 4 3 Poor Dirty 50% RAP
3% CEM F 2083.5
1895.8
1868.0
1860.0
1848.5
1839.8
1829.7
1826.6
1819.5
1810.1
1806.0
1803.2
Poor Dirty 50% RAP 3% CEM
2099.8
1927.0
1899.2
1891.7
1879.2
1873.6
1864.0
1859.8
1853.2
1841.2
1834.2
1828.3
Poor Dirty 25% RAP 3% CEM A
2125.3
2006.2
2003.1
1993.2
1993.1
1983.8
1973.5
1954.8
1943.9
1933.7
1922.4
1911.4
Poor Dirty 25% RAP 3% CEM B
2076.7
1942.7
1940.1
1925.1
1922.3
1907.1
1901.6
1884.9
1874.1
1861.5
1851.2
1836.5
Poor Dirty 25% RAP 3% CEM C
2103.3
1969.7
1972.0
1952.7
1953.6
1939.7
1927.6
1904.3
1887.0
1872.9
1859.9
1838.9
Poor Dirty 25% RAP 3% CEM D
2103.8
1969.1
1969.0
1954.5
1950.4
1937.6
1926.5
1906.4
1891.7
1880.4
1870.8
1853.0
Poor Dirty 25% RAP 3% CEM E
2121.1
1994.8
1996.1
1979.0
1976.1
1959.4
1949.3
1932.1
1922.3
1904.0
1893.2
1878.2
Poor Dirty 25% RAP 3% CEM F
2106.1
1984.9
1984.8
1973.8
1976.4
1965.9
1956.9
1945.0
1939.7
1927.0
1922.3
1910.8
Poor Dirty 25% RAP 3% CEM
2106.1
1977.9
1977.5
1963.1
1962.0
1948.9
1939.2
1921.3
1909.8
1896.6
1886.6
1871.5
Poor Dirty 75% RAP 15% FA A
1802.2
1718.0
1701.3
1678.1
1662.1
1646.5
1637.0
1625.1
1620.8
1612.8
1608.7
1602.6
Poor Dirty 75% RAP 15% FA B
1734.5
1643.4
1617.4
1586.6
1579.0
1559.7
1539.2
1533.0
1518.9
1510.3
1506.6
1496.9
Poor Dirty 75% RAP 15% FA C
1695.7
1616.0
1580.2
1545.1
1516.8
1494.5
1471.5
1457.9
1447.7
1433.7
1424.8
1406.2
Poor Dirty 75% RAP 15% FA D
1749.2
1670.1
1638.7
1602.8
1578.0
1562.3
1527.5
1507.4
1486.9
1473.1
1463.2
1441.8
Poor Dirty 75% RAP 15% FA E
1797.7
1720.5
1711.2
1695.3
1686.5
1678.6
1669.3
1662.6
1653.3
1642.1
1638.5
1632.7
Poor Dirty 75% RAP 15% FA F
1795.3
1744.6
1731.0
1712.7
1704.3
1693.4
1688.6
1682.9
1679.2
1672.9
1673.7
1668.7
Poor Dirty 75% RAP 15% FA
1762.4
1685.4
1663.3
1636.8
1621.1
1605.8
1588.9
1578.2
1567.8
1557.5
1552.6
1541.5
Poor Dirty 50% RAP 15% FA A
1736.4
1660.7
1634.9
1615.7
1609.7
1595.5
1591.1
1582.5
1582.0
1573.8
1566.0
1559.3
Poor Dirty 50% RAP 15% FA B
1797.0
1750.6
1741.0
1722.6
1714.1
1701.7
1697.7
1687.0
1683.0
1674.7
1663.1
1660.1
Poor Dirty 50% RAP 15% FA C
1786.4
1741.3
1727.3
1712.6
1706.2
1693.6
1688.5
1680.6
1681.0
1674.7
1664.5
1660.3
Poor Dirty 50% RAP 15% FA D
1822.9
1783.2
1770.9
1756.9
1747.3
1734.8
1729.3
1717.5
1714.9
1711.8
1703.0
1698.9
Poor Dirty 50% RAP 15% FA E
1806.1
1769.1
1749.2
1736.3
1728.0
1720.2
1717.6
1709.9
1710.3
1704.7
1695.7
1692.9
Poor Dirty 50% RAP 15% FA F
1736.9
1684.1
1668.8
1655.9
1651.0
1635.4
1636.4
1629.7
1630.3
1623.9
1615.0
1609.6
Poor Dirty 50% RAP 15% FA
1781.0
1731.5
1715.4
1700.0
1692.7
1680.2
1676.8
1667.9
1666.9
1660.6
1651.2
1646.9

125
Poor Dirty 25% RAP 15% FA A
1855.2
1815.7
1805.4
1797.9
1787.5
1782.8
1784.9
1772.6
1775.7
1769.3
1754.0
1750.2
Poor Dirty 25% RAP 15% FA B
1849.1
1793.7
1774.3
1766.5
1763.0
1759.9
1757.3
1747.3
1746.3
1743.0
1720.6
1715.6
Poor Dirty 25% RAP 15% FA C
1781.8
1729.3
1714.2
1705.8
1700.0
1694.7
1694.3
1680.0
1680.0
1677.6
1662.9
1657.3
Poor Dirty 25% RAP 15% FA D
1818.6
1777.0
1764.0
1750.2
1744.1
1737.0
1742.1
1728.6
1730.5
1724.6
1701.9
1692.4
Poor Dirty 25% RAP 15% FA E
1842.1
1812.3
1797.3
1785.6
1779.0
1771.4
1770.6
1761.3
1764.4
1759.4
1744.2
1740.5
Poor Dirty 25% RAP 15% FA F
1801.6
1753.9
1735.9
1726.8
1715.4
1702.7
1687.3
1678.2
1678.4
1674.9
1658.8
1657.1
Poor Dirty 25% RAP 15% FA
1824.7
1780.3
1765.2
1755.5
1748.2
1741.4
1739.4
1728.0
1729.2
1724.8
1707.1
1702.2
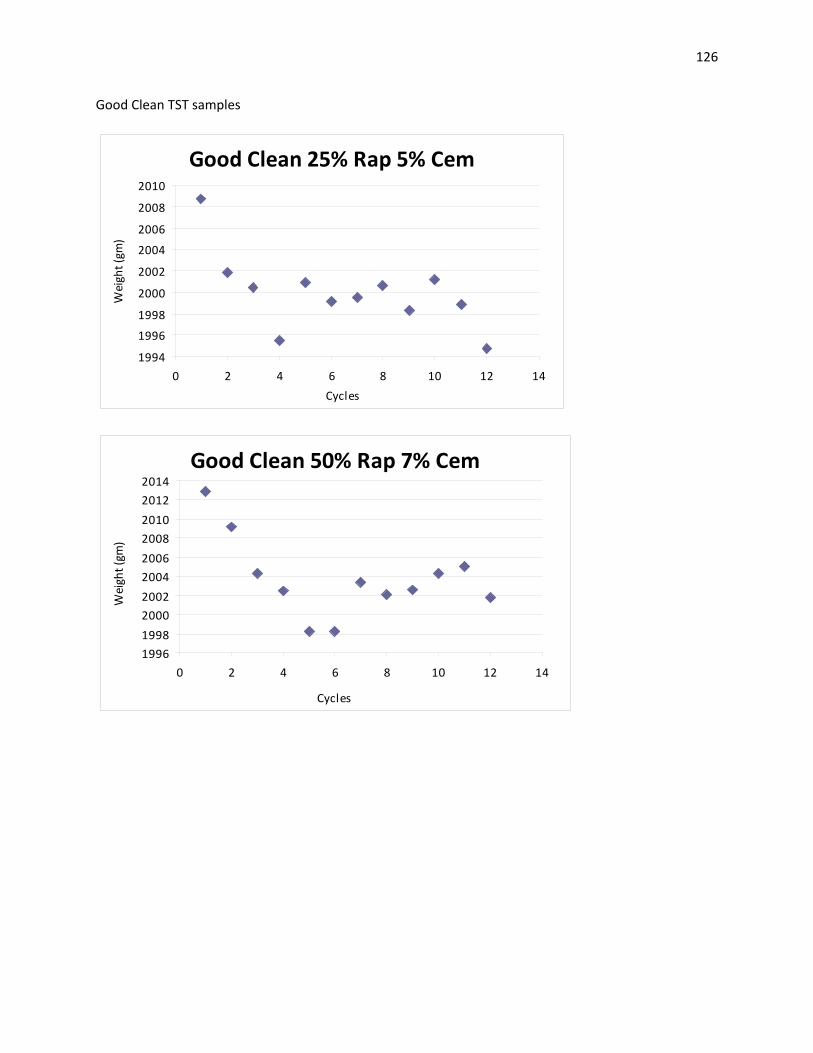
126
Good Clean TST samples
Good Clean 25% Rap 5% Cem
1994
1996
1998
2000
2002
2004
2006
2008
2010
0 2 4 6 8 10 12 14Cycles
Wei
ght (
gm)
Good Clean 50% Rap 7% Cem
1996199820002002200420062008201020122014
0 2 4 6 8 10 12 14
Cycles
Wei
ght (
gm)

127
Good Clean 75% Rap 7% Cem
2030
2035
2040
2045
2050
2055
0 2 4 6 8 10 12 14Cycles
Wei
ght (
gm)
Good Clean 25% Rap 12% FA
1500
1550
1600
1650
1700
1750
1800
0 2 4 6 8 10 12 14Cycles
Wei
ght (
gm)
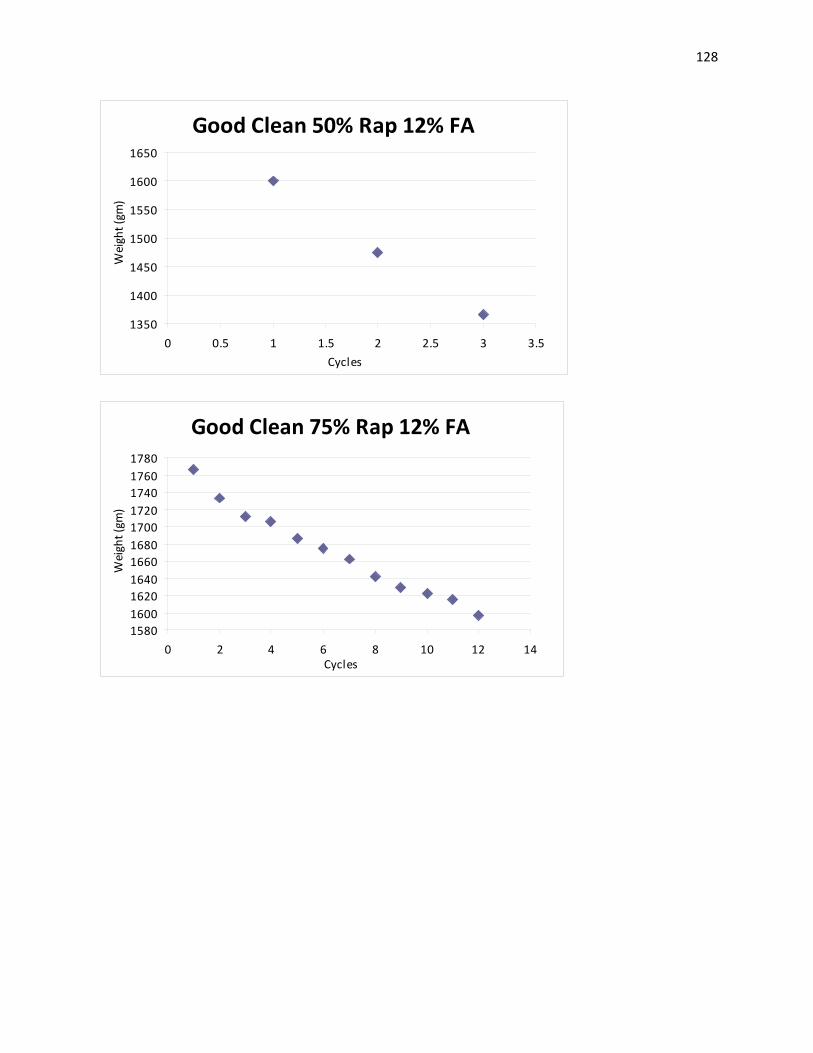
128
Good Clean 50% Rap 12% FA
1350
1400
1450
1500
1550
1600
1650
0 0.5 1 1.5 2 2.5 3 3.5Cycles
Wei
ght (
gm)
Good Clean 75% Rap 12% FA
15801600162016401660168017001720174017601780
0 2 4 6 8 10 12 14Cycles
Wei
ght (
gm)
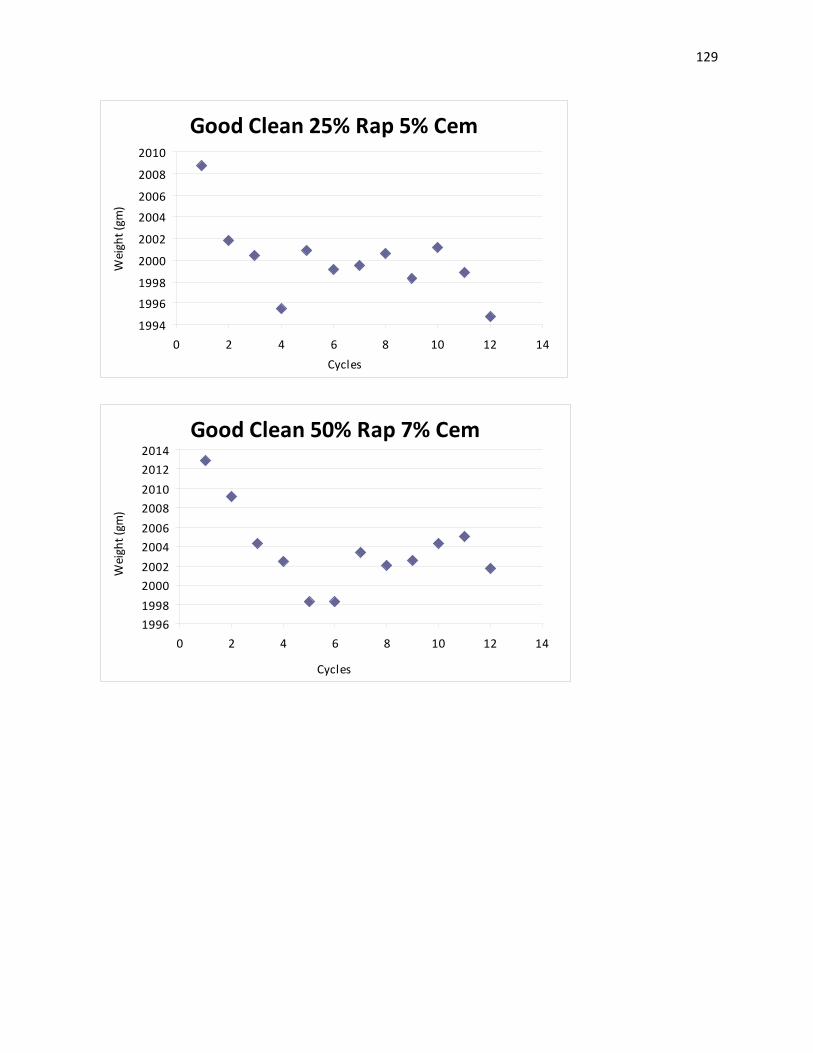
129
Good Clean 25% Rap 5% Cem
1994
1996
1998
2000
2002
2004
2006
2008
2010
0 2 4 6 8 10 12 14Cycles
Wei
ght (
gm)
Good Clean 50% Rap 7% Cem
1996199820002002200420062008201020122014
0 2 4 6 8 10 12 14
Cycles
Wei
ght (
gm)
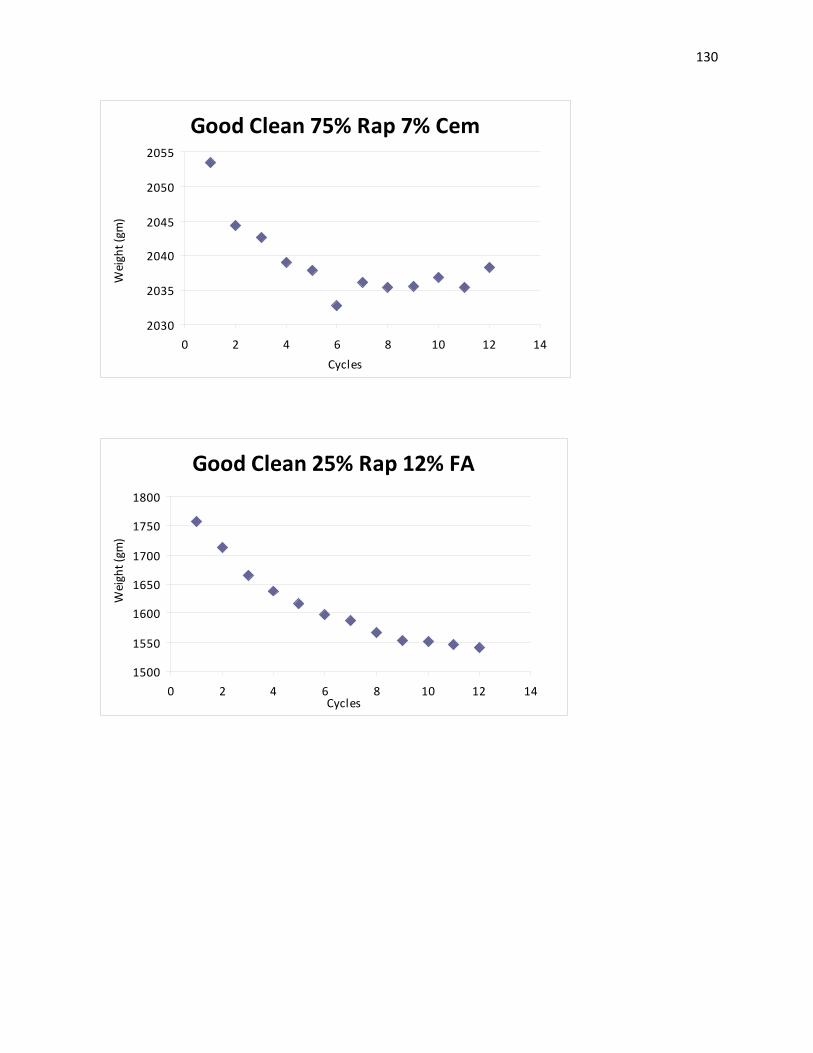
130
Good Clean 75% Rap 7% Cem
2030
2035
2040
2045
2050
2055
0 2 4 6 8 10 12 14Cycles
Wei
ght (
gm)
Good Clean 25% Rap 12% FA
1500
1550
1600
1650
1700
1750
1800
0 2 4 6 8 10 12 14Cycles
Wei
ght (
gm)

131
Good Clean 50% Rap 12% FA
1350
1400
1450
1500
1550
1600
1650
0 0.5 1 1.5 2 2.5 3 3.5Cycles
Wei
ght (
gm)
Good Clean 75% Rap 12% FA
15801600162016401660168017001720174017601780
0 2 4 6 8 10 12 14Cycles
Wei
ght (
gm)
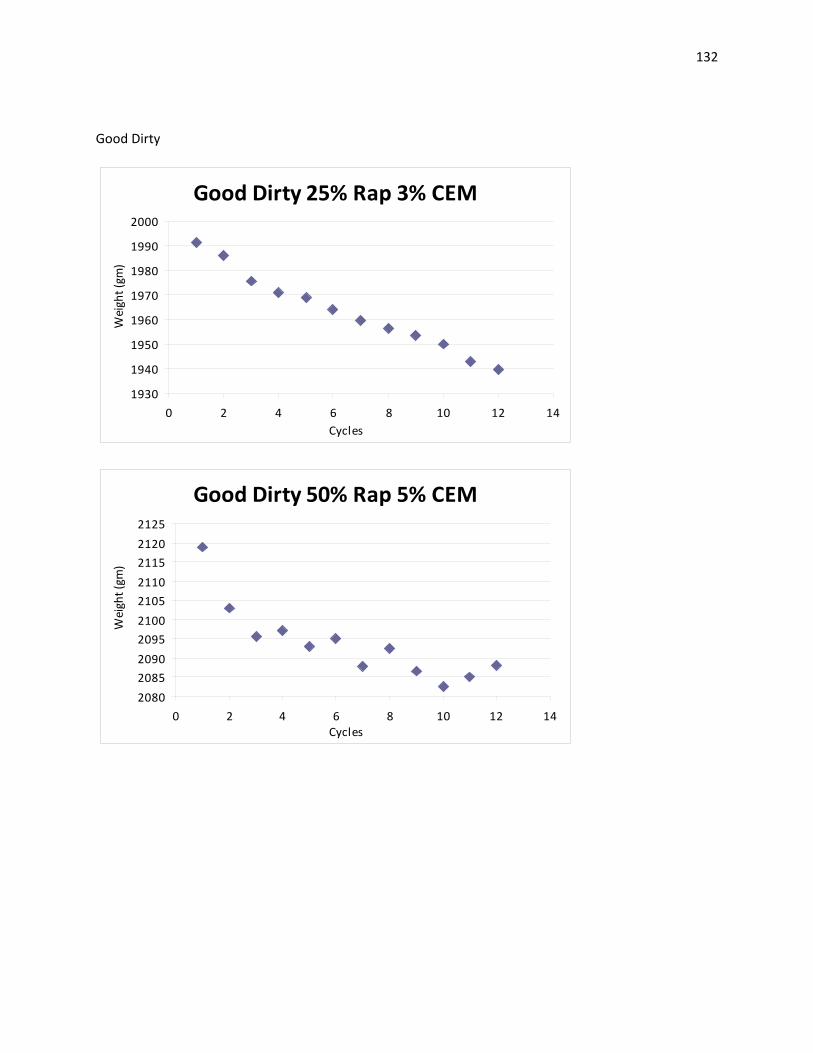
132
Good Dirty
Good Dirty 25% Rap 3% CEM
1930
1940
1950
1960
1970
1980
1990
2000
0 2 4 6 8 10 12 14Cycles
Wei
ght (
gm)
Good Dirty 50% Rap 5% CEM
2080208520902095210021052110211521202125
0 2 4 6 8 10 12 14Cycles
Wei
ght (
gm)

133
Good Dirty 75% Rap 7% CEM
2010
2015
2020
2025
2030
2035
2040
0 2 4 6 8 10 12 14
Cycles
Wei
ght (
gm)
Good Dirty 25% Rap 12% FA
18101820183018401850186018701880189019001910
0 2 4 6 8 10 12 14Cycles
Wei
ght (
gm)
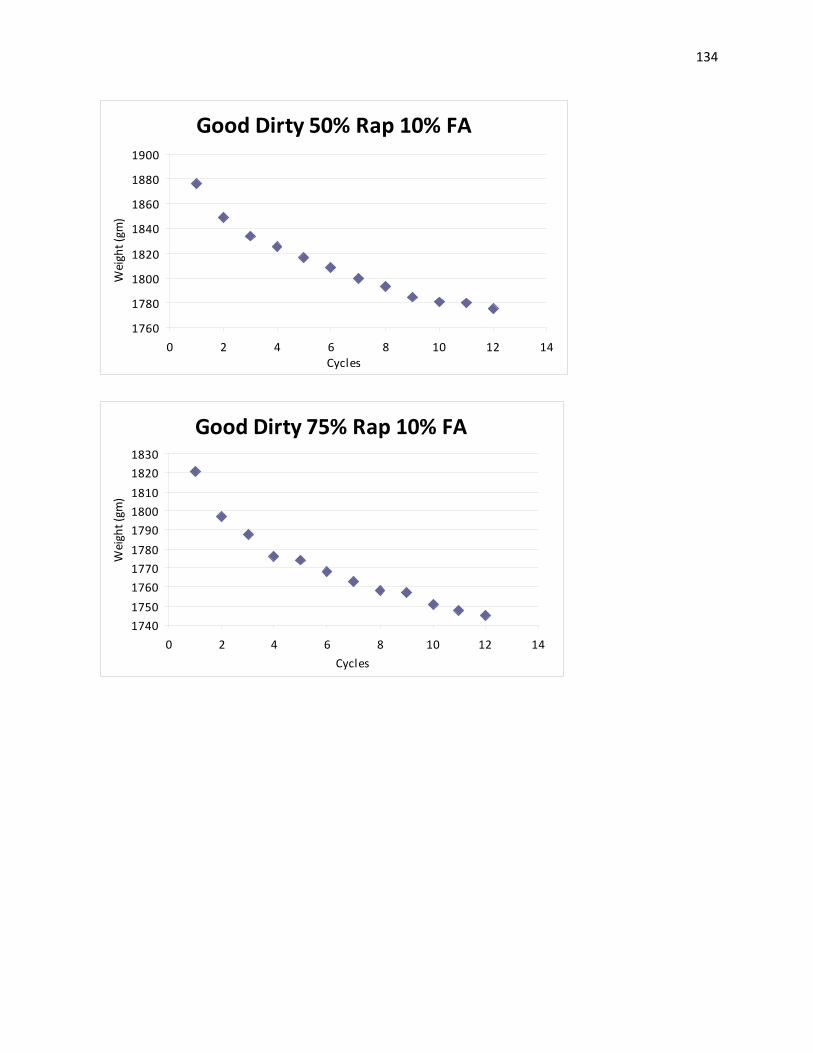
134
Good Dirty 50% Rap 10% FA
1760
1780
1800
1820
1840
1860
1880
1900
0 2 4 6 8 10 12 14Cycles
Wei
ght (
gm)
Good Dirty 75% Rap 10% FA
1740175017601770178017901800181018201830
0 2 4 6 8 10 12 14Cycles
Wei
ght (
gm)

135
Good Dirty 25% Rap 3% CEM
1930
1940
1950
1960
1970
1980
1990
2000
0 2 4 6 8 10 12 14Cycles
Wei
ght (
gm)
Good Dirty 50% Rap 5% CEM
2080208520902095210021052110211521202125
0 2 4 6 8 10 12 14Cycles
Wei
ght (
gm)
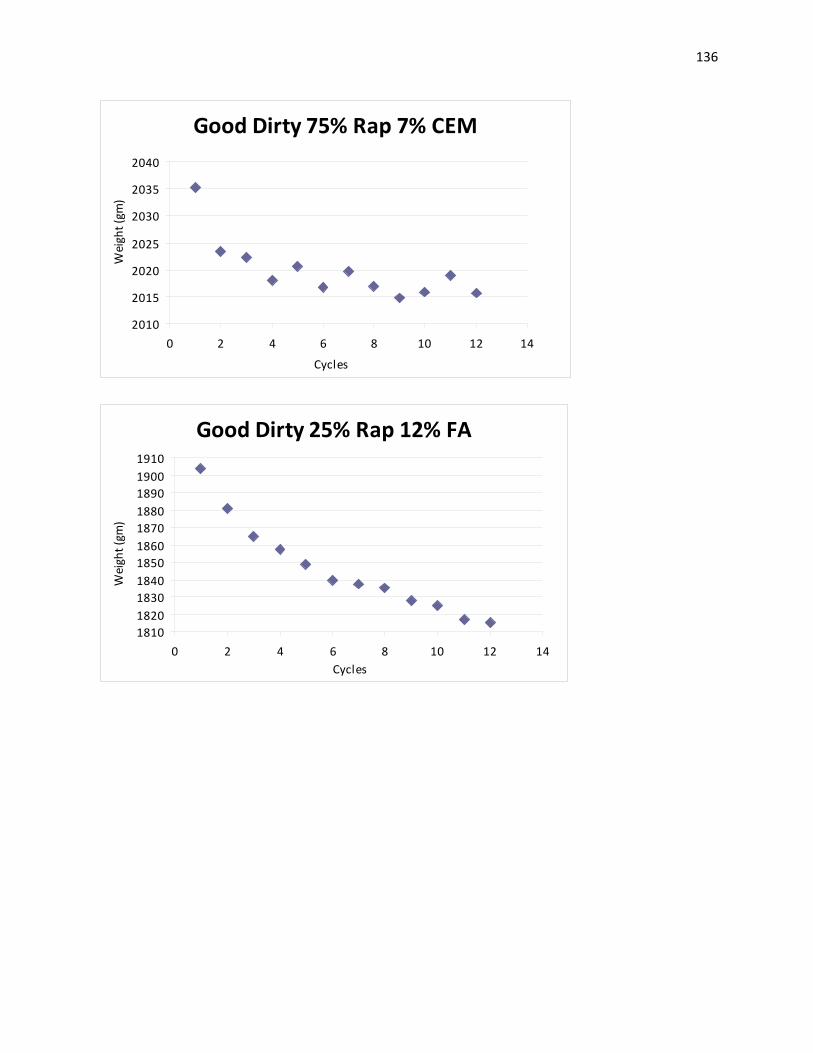
136
Good Dirty 75% Rap 7% CEM
2010
2015
2020
2025
2030
2035
2040
0 2 4 6 8 10 12 14
Cycles
Wei
ght (
gm)
Good Dirty 25% Rap 12% FA
18101820183018401850186018701880189019001910
0 2 4 6 8 10 12 14Cycles
Wei
ght (
gm)

137
Good Dirty 50% Rap 10% FA
1760
1780
1800
1820
1840
1860
1880
1900
0 2 4 6 8 10 12 14Cycles
Wei
ght (
gm)
Good Dirty 75% Rap 10% FA
1740175017601770178017901800181018201830
0 2 4 6 8 10 12 14Cycles
Wei
ght (
gm)
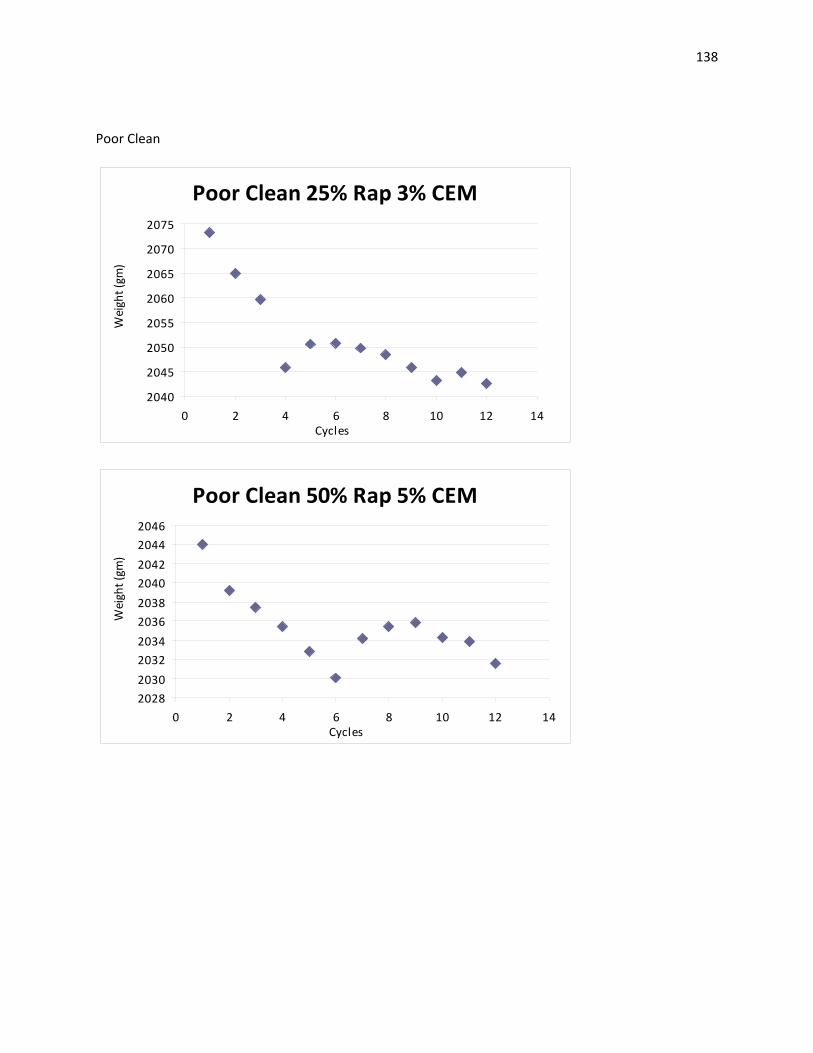
138
Poor Clean
Poor Clean 25% Rap 3% CEM
2040
2045
2050
2055
2060
2065
2070
2075
0 2 4 6 8 10 12 14Cycles
Wei
ght (
gm)
Poor Clean 50% Rap 5% CEM
2028203020322034203620382040204220442046
0 2 4 6 8 10 12 14Cycles
Wei
ght (
gm)

139
Poor Clean 75% Rap 5% CEM
198019821984198619881990199219941996199820002002
0 2 4 6 8 10 12 14Cycles
Wei
ght (
gm)
Poor Clean 75% Rap 10% FA
1930
1935
1940
1945
1950
1955
1960
1965
1970
0 2 4 6 8 10 12 14Cycles
Wei
ght (
gm)

140
Poor Clean 25% Rap 12% FA
19952000200520102015202020252030203520402045
0 2 4 6 8 10 12 14Cycles
Wei
ght (
gm)
Poor Clean 50% Rap 12% FA
2005
2010
2015
2020
2025
2030
0 2 4 6 8 10 12 14
Cycles
Wei
ght (
gm)
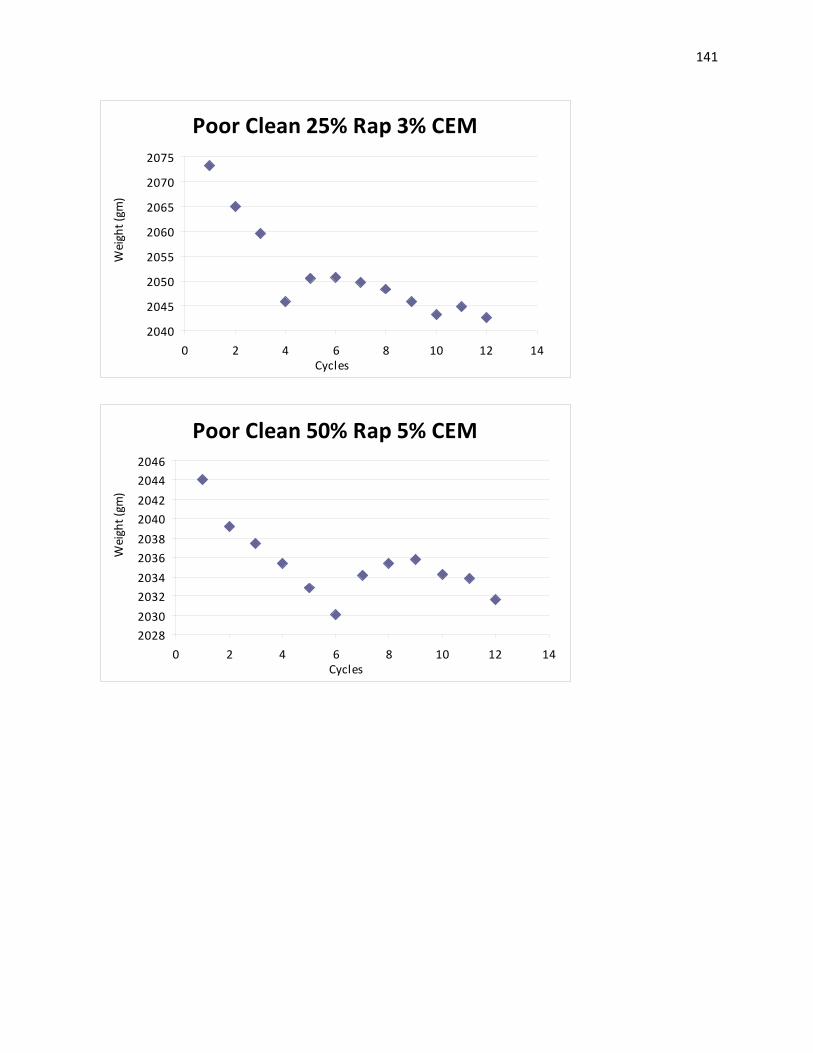
141
Poor Clean 25% Rap 3% CEM
2040
2045
2050
2055
2060
2065
2070
2075
0 2 4 6 8 10 12 14Cycles
Wei
ght (
gm)
Poor Clean 50% Rap 5% CEM
2028203020322034203620382040204220442046
0 2 4 6 8 10 12 14Cycles
Wei
ght (
gm)
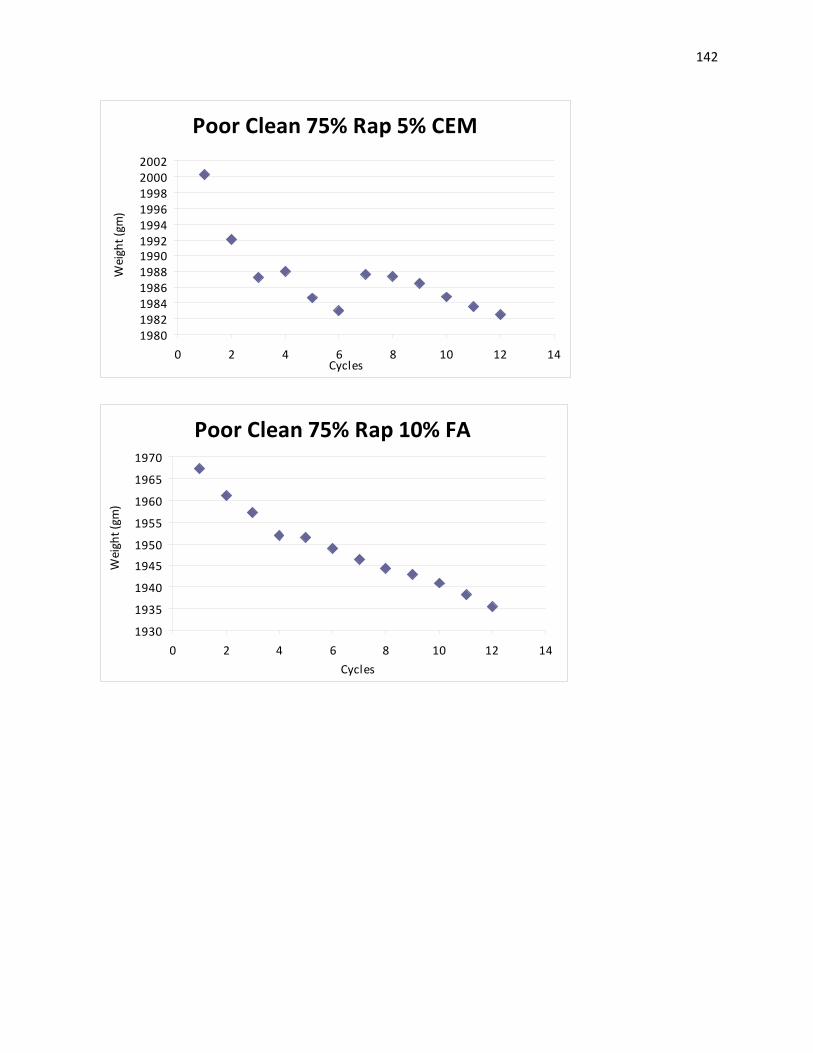
142
Poor Clean 75% Rap 5% CEM
198019821984198619881990199219941996199820002002
0 2 4 6 8 10 12 14Cycles
Wei
ght (
gm)
Poor Clean 75% Rap 10% FA
1930
1935
1940
1945
1950
1955
1960
1965
1970
0 2 4 6 8 10 12 14Cycles
Wei
ght (
gm)

143
Poor Clean 25% Rap 12% FA
19952000200520102015202020252030203520402045
0 2 4 6 8 10 12 14Cycles
Wei
ght (
gm)
Poor Clean 50% Rap 12% FA
2005
2010
2015
2020
2025
2030
0 2 4 6 8 10 12 14
Cycles
Wei
ght (
gm)

144
Poor dirty
Poor Dirty 25% Rap 3% CEM
1850
1900
1950
2000
2050
2100
2150
0 2 4 6 8 10 12 14
Cycles
Wei
ght (
gm)
Poor Dirty 50% Rap 3% CEM
1800
1850
1900
1950
2000
2050
2100
2150
0 2 4 6 8 10 12 14
Cycles
Wei
ght (
gm)

145
Poor Dirty 75% Rap 5% CEM
1955
1960
1965
1970
1975
1980
1985
1990
0 2 4 6 8 10 12 14Cycles
Wei
ght (
gm)
Poor Dirty 25% Rap 15% FA
1680
1700
1720
1740
1760
1780
1800
1820
1840
0 2 4 6 8 10 12 14Cycles
Wei
ght (
gm)
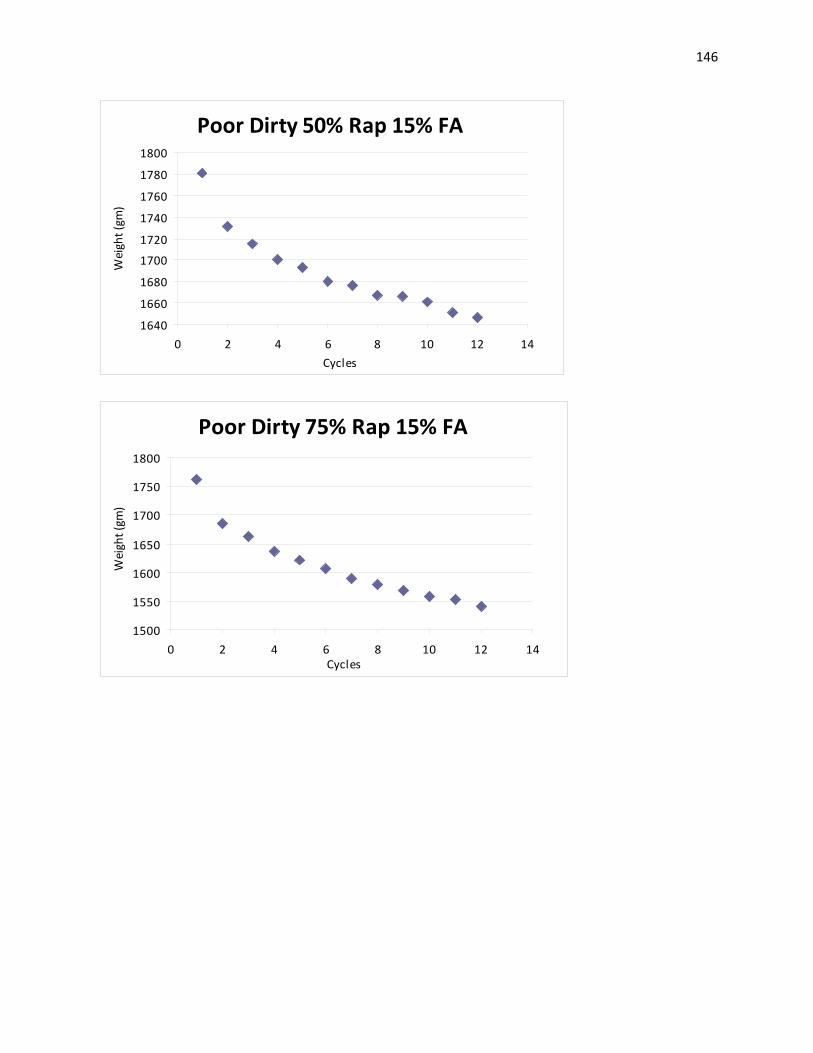
146
Poor Dirty 50% Rap 15% FA
1640
1660
1680
1700
1720
1740
1760
1780
1800
0 2 4 6 8 10 12 14Cycles
Wei
ght (
gm)
Poor Dirty 75% Rap 15% FA
1500
1550
1600
1650
1700
1750
1800
0 2 4 6 8 10 12 14Cycles
Wei
ght (
gm)

147
Poor Dirty 25% Rap 3% CEM
1850
1900
1950
2000
2050
2100
2150
0 2 4 6 8 10 12 14
Cycles
Wei
ght (
gm)
Poor Dirty 50% Rap 3% CEM
1800
1850
1900
1950
2000
2050
2100
2150
0 2 4 6 8 10 12 14
Cycles
Wei
ght (
gm)

148
Poor Dirty 75% Rap 5% CEM
1955
1960
1965
1970
1975
1980
1985
1990
0 2 4 6 8 10 12 14Cycles
Wei
ght (
gm)
Poor Dirty 25% Rap 15% FA
1680
1700
1720
1740
1760
1780
1800
1820
1840
0 2 4 6 8 10 12 14Cycles
Wei
ght (
gm)

149
Poor Dirty 50% Rap 15% FA
1640
1660
1680
1700
1720
1740
1760
1780
1800
0 2 4 6 8 10 12 14Cycles
Wei
ght (
gm)
Poor Dirty 75% Rap 15% FA
1500
1550
1600
1650
1700
1750
1800
0 2 4 6 8 10 12 14Cycles
Wei
ght (
gm)
Related Documents


