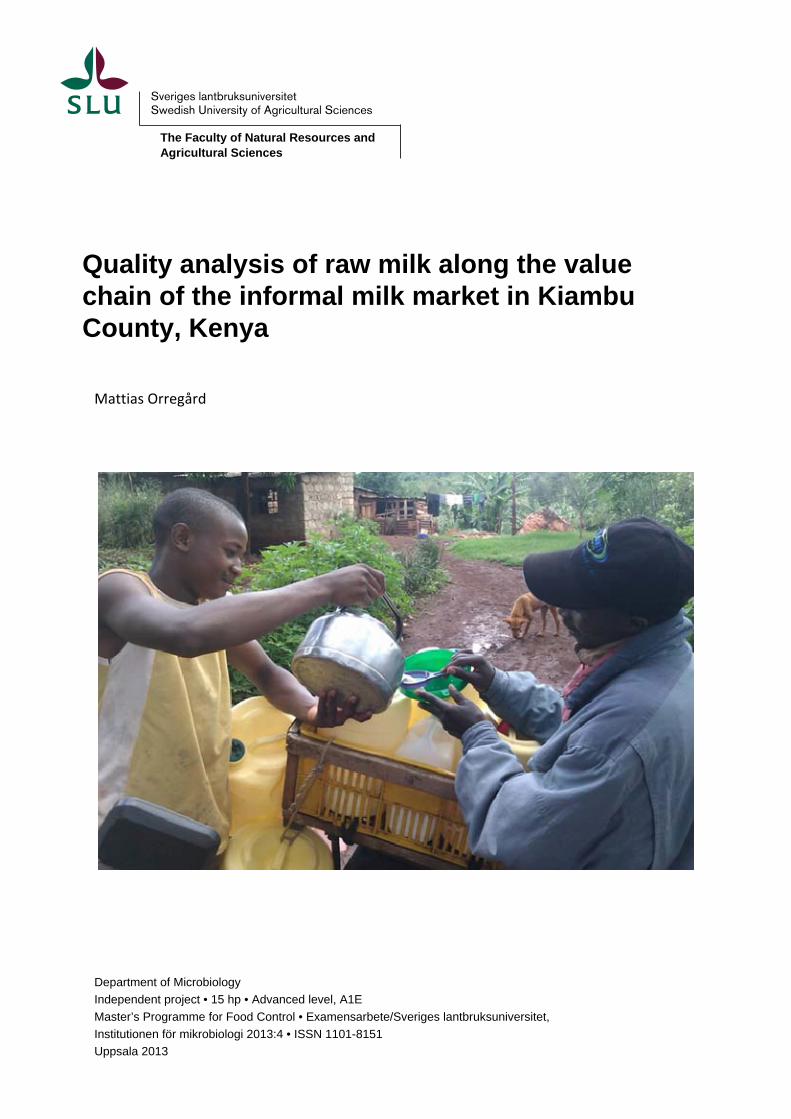
The Faculty of Natural Resources and Agricultural Sciences Quality analysis of raw milk along the value chain of the informal milk market in Kiambu County, Kenya Mattias Orregård Department of Microbiology Independent project • 15 hp • Advanced level, A1E Master’s Programme for Food Control • Examensarbete/Sveriges lantbruksuniversitet, Institutionen för mikrobiologi 2013:4 • ISSN 1101-8151 Uppsala 2013

Welcome message from author
This document is posted to help you gain knowledge. Please leave a comment to let me know what you think about it! Share it to your friends and learn new things together.
Transcript
The Faculty of Natural Resources and Agricultural Sciences
Quality analysis of raw milk along the value chain of the informal milk market in Kiambu County, Kenya
Mattias Orregård
Department of Microbiology
Independent project • 15 hp • Advanced level, A1E
Master’s Programme for Food Control • Examensarbete/Sveriges lantbruksuniversitet,
Institutionen för mikrobiologi 2013:4 • ISSN 1101-8151
Uppsala 2013


Quality analysis of raw milk along the value chain of the informal milk market in Kiambu County, Kenya
Mattias Orregård
Supervisor: Su-lin Hedén
Examiner: Associated professor Stefan Roos
Credits: 10 (15 hp)
Level: Advanced (Master’s thesis)
Course title: Självständigt arbete inom magisterprogrammet för livsmedelstillsyn
Course code: EX0476
Programme/education: Food Control
Place of publication: Uppsala
Year of publication: 2013
Title of series: Examensarbete/Sveriges lantbruksuniversitet, Institutionen för mikrobiologi
No: 2013:4
ISSN: 1101-8151
Online publication: http://stud.epsilon.slu.se
Keywords: Informal market, Kenya, Milk handling, Raw milk, Value chain
Sveriges lantbruksuniversitet
Swedish University of Agricultural Sciences
Faculty of Natural Resources and Agricultural Sciences
Uppsala BioCenter
Department of Microbiology


Abstract Farmers, agents and shops were interviewed to elucidate the postharvest handling practices of raw milk on the informal milk market in Kiambu County, Kenya. Interviews were also conducted to ascertain the knowledge and precautions taken by the farmers to prevent the presence of antibiotic residues in the milk. Raw milk was sampled and analysed to assess the microbial quality and to determine if physical or chemical adulteration, in terms of added water, antibiotic residues and hydrogen peroxide, were present. The farmers knew little about their antibiotic use and many farmers could not remember the last time they used antibiotics, mainly because it was a long time ago but also due to a minimal or lack of interest in how the veterinarian treated the cow. Two of the farmers stated that they used hot water to ensure their personal hygiene while handling milk. The seven remaining farmers declared they did not take any measures to ensure their personal hygiene. All small‐scale agents used plastic jerry cans to hold their milk, while all large‐scale agents used aluminium cans. Microbial results did not differ significantly between small‐ and large‐scale agents (p > 0.05) despite their diverse equipment. Farmers had a significantly longer experience than all other milk handlers along the value chain (p < 0.001). When it comes to milk handling education, 2 of 9 (22%) farmers had received visits from dairy societies for educational purposes while 12 of 17 (71%) agents declared they regularly attend seminars for educational purposes, or had participated in a course to get a certificate in milk handling. Of the shops, 4 of 11 (36%) employees stated they had attended at least one seminar held by the Kenya Dairy Board. Farmers, agents and shops held their milk an average of 5.4, 6.8 and 16 hours, respectively. Cold water immersion was used by 6 of 9 (66%) farmers as a form of preservation. Among the agents only one (6%) practiced partial cold storage whereas the rest stored at ambient temperature. Between the several types of shops, the preservation options were mixed and 7 of 11 (64%) practiced full or partial cold storage. Quality control was present along the whole value chain, although around 55% of the farmers did not implement any type of quality check of their milk. All agents and shops regularly monitored their milk. The microbial counts in farmers’ milk (Staphylococcus aureus, coliforms and total plate count (TPC)) were significantly lower than in milk from the agents (p < 0.001), implying that farmers’ milk was of better microbiological quality. Statistical analysis of TPC and coliform counts showed significant differences (p < 0.001 and p < 0.05, respectively) between farmers and shops’ milk, implying that farmers’ milk was of better quality with regard to microbial counts. The lower counts in farmers’ milk indicated that there was deterioration along the supply chain due to the proliferation of the microorganisms initially present in the milk or/and due to cross contamination. No significant difference in milk quality between other steps in the value chain could be detected. According to the East African Raw cow milk standard 3 of 18 (17%) samples from the farmers’ milk and 59% and 64% of agents and shops’ milk samples, respectively, exceeded the threshold limit of 5.0x10⁴ cfu/mL with regard to coliform counts. Furthermore, 1 of 18 (5%) of farmers and 59% and 45% of agents and shops’ milk samples, respectively, exceeded the threshold limit of 2.0x10⁶ cfu/mL with regard to TPC.

Adulteration was detected in terms of specific gravity in 30% of all the samples along the value chain according to the East Africa Raw cow milk standard. Chemical adulteration was detected in one sample from a large‐scale agent, in the form of hydrogen peroxide. Confirmed detection of antibiotic residues could not be found in any sample. Handling practices clearly indicated that the value chain from farmer to agent is in need of accessing appropriate technology and equipment for safe milk handling. However, virtually all consumers boil purchased raw milk before consumption. Risks of infection from bacterial health hazards are therefore considered to be low. Poverty seems to be the main contributor to the lack of resources. Appropriate innovations, which are cost‐effective and affordable to all market players involved, will be necessary to ensure proper milk handling.
Abbreviations cfu Colony forming units FAO Food and Agriculture Organization of the United Nations GDP Gross Domestic Product KDB Kenya Dairy Board SIDA Swedish International Development Cooperation Agency SDP Smallholder Dairy Project JKUAT Jomo Kenyatta University of Agriculture and Technology
Definitions Large‐scale agent: Large‐scale agents in the present study are defined as milk traders who handled at least 200 litres of raw milk daily, use pickup trucks for transport and aluminium cans to hold the milk. Findings in this study showed that large‐scale agents picked up their milk from both small‐ scale agents and direct from farmers. Small‐scale agent: Small‐scale agents in the present study handled less than 200 litres of raw milk daily, used a motorbike as transport and plastic jerry cans to hold the milk. The definition Small‐scale agents also include hawkers by foot.

Table of contents Abstract
Abbreviations
Definitions
1. Introduction ......................................................................................................................................... 7
1.1 Dairy Industry in Kenya .................................................................................................................. 7
1.2 Formal versus informal market ..................................................................................................... 8
1.3 Value chain .................................................................................................................................... 8
1.4 Microbial risks ............................................................................................................................... 8
1.5 Physical and chemical adulteration ............................................................................................. 10
1.6 Current difficulties ....................................................................................................................... 11
1.7 Aims ............................................................................................................................................. 12
2 Materials and Methods ...................................................................................................................... 12
2.1 Milk sampling and preparation ................................................................................................... 12
2.2 Interviews .................................................................................................................................... 13
2.3 Adulteration ................................................................................................................................. 14
2.3.1 Determination of specific gravity .......................................................................................... 14
2.3.2 Determination of hydrogen peroxide ................................................................................... 14
2.3.3 Determination of antibiotic residues .................................................................................... 14
2.4 Determination of Total Viable Count, coliforms and Staphylococcus aureus ............................. 14
2.5 Statistical analysis ....................................................................................................................... 15
3 Results and Discussion ........................................................................................................................ 15
3.1 Survey of postharvest handling practices .................................................................................... 15
3.1.1 Farmer and antibiotics .......................................................................................................... 15
3.1.2 Handling and storage along the value chain ........................................................................ 17
3.1.3 Quality control checks along the value chain ....................................................................... 19
3.1.4 Experience and education ..................................................................................................... 20
3.1.5 Documentation ..................................................................................................................... 22
3.2 Adulteration ................................................................................................................................. 22
3.2.1 Density .................................................................................................................................. 22
3.2.2 Antibiotic residues and hydrogen peroxide .......................................................................... 23
3.3 Microbial Analyses ........................................................................................................................... 24
3.3.1 Staphylococcus aureus .......................................................................................................... 24

3.3.2 Coliform plate count ............................................................................................................. 25
3.3.3 Total bacteria count .............................................................................................................. 27
4 Conclusions ......................................................................................................................................... 29
5 Acknowledgements ............................................................................................................................ 30
6 References .......................................................................................................................................... 31
7 Appendices ......................................................................................................................................... 34

7
1. Introduction
1.1 Dairy Industry in Kenya Agriculture is the backbone of Kenya’s economy and accounts for about 19% of the GDP; 75% of the labour force is within the agricultural sector (1). The dairy sector itself is very important and accounts for about 4% of the national GDP (2, 3). According to the Kenya Dairy Board (KDB) the total cow milk production in 2010 reached an estimated 4 641 600 tonnes (2). In relation to the estimated output of 2005, production results show an estimated increase of 75%. Officials claim the herd size is about 3.3 million heads of dairy cattle today while the actual size of the national dairy herd is presumably bigger, as an SDP study indicates a great underestimation of the herd size calculated by officials (4). Indications from the SDP study show an estimation of about 6.7 million. During wet season Kenya has a surplus of milk and enough capacity to export due to the high quality and quantity in pastures available for the dairy cattle (5, 6). However, seasonal fluctuations are present and during dry season the milk supply drops to between 50 to 70% of the wet season’s supply. The rain period between April‐June is often associated with peak milk production and during this time with high quantities of milk, prices received by the farmers (Figure 1) tend to fall (7). Although Kenya’s dairy industry is one of the largest and most developed in Africa, it is estimated that Kenya soon will suffer a deficit in milk due to an increasing demand, mostly from Nairobi and other urban markets (8). Figure 1. Milking farmer Smallholders with 2‐3 cows dominate the industry at farm level and they produce, collectively, approx. 80% of Kenya’s milk, although their individual productivity is very low (3, 8). According to an SDP study about 70% of the jobs in the dairy sector are created in the informal market (9). Most of these jobs are direct job opportunities and generally involve self‐employment.

8
1.2 Formal versus informal market
In 1992 the Dairy industry was liberalized and the private sector was able to play a part in milk processing (2). This was the launch of several private actors and the beginning of an increase in the informal sector. Estimations suggest that 55% of all milk produced in Kenya is marketed, the rest, approximately 35% goes to household consumption on the farm and around 10% for calf consumption (3, 10, 11). Of the marketed milk, around 20‐30% is sold on the formal market while the majority, about 70‐80%, is sold on the informal market. A main reason why the informal market dominates is due to consumer preferences and because of the price difference between raw and pasteurized milk (12). Raw milk can be about 20‐50% cheaper than the formal and pasteurized milk on the market. Unprocessed milk is also sold in desired quantities which gives the poor people access since they can buy as little as they can afford. Taste and high buttermilk content are also reasons why customers prefer raw milk (12). A reason for farmers to stay in the informal sector is because it is a cash‐based market and farmers get their money instantly instead of waiting up to a month, as may be the case in the formal market (3). Smallholder farmers are normally dependent on an instant flow of money.
1.3 Value chain Formal and informal markets consist of a wide mix of different actors in each step along the value chain (3). Milk in the formal market is normally transported to chilling and bulking centres and finally to a processing facility. Once milk is processed it is delivered by distributors or agents to a point of sale. In the informal market the milk usually is directly delivered from farmer to consumer by a number of brokers or hawkers (3). Excluding the informal market’s brokers, there are three main groups in the informal value chain: Mobile milk traders; milk bars; and shops and kiosks (9). Mobile milk traders are normally self‐employed and sell around 50‐100 litres of raw milk daily, delivering mostly by bike or public transport (commonly referred to as “matatu” in Kenya). Milk bars sell their milk from fixed premises and often offer their customers a seat. Shops and kiosks in general sell milk together with other household items (9). On the market, larger agents operate with pick‐up trucks collecting from the smaller‐scale bike agents and transport the milk from surplus areas to areas with insufficient availability (3). Active traders in the informal milk chain are the poor, youths and a large percentage of women (8).
1.4 Microbial risks
The composition of several nutrients and other features like high water activity makes milk an outstanding medium for bacterial growth, which become particularly clear in developing countries where the ambient temperature is high and cooling is often not available (13). Milk handling equipment is one of the most significant sources of microbial contamination in milk. If equipment is inadequately cleaned and milk residues are left on wet surfaces it will result in microbial growth, which could contaminate the milk.
9
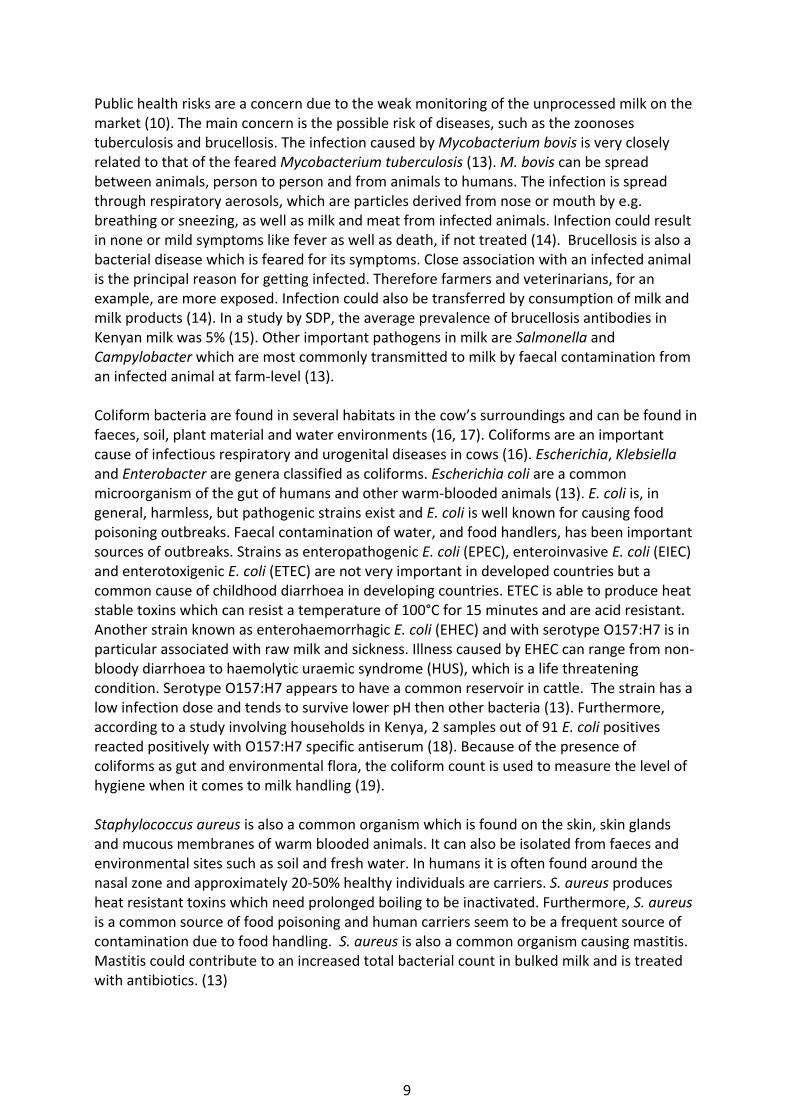
Public health risks are a concern due to the weak monitoring of the unprocessed milk on the market (10). The main concern is the possible risk of diseases, such as the zoonoses tuberculosis and brucellosis. The infection caused by Mycobacterium bovis is very closely related to that of the feared Mycobacterium tuberculosis (13). M. bovis can be spread between animals, person to person and from animals to humans. The infection is spread through respiratory aerosols, which are particles derived from nose or mouth by e.g. breathing or sneezing, as well as milk and meat from infected animals. Infection could result in none or mild symptoms like fever as well as death, if not treated (14). Brucellosis is also a bacterial disease which is feared for its symptoms. Close association with an infected animal is the principal reason for getting infected. Therefore farmers and veterinarians, for an example, are more exposed. Infection could also be transferred by consumption of milk and milk products (14). In a study by SDP, the average prevalence of brucellosis antibodies in Kenyan milk was 5% (15). Other important pathogens in milk are Salmonella and Campylobacter which are most commonly transmitted to milk by faecal contamination from an infected animal at farm‐level (13). Coliform bacteria are found in several habitats in the cow’s surroundings and can be found in faeces, soil, plant material and water environments (16, 17). Coliforms are an important cause of infectious respiratory and urogenital diseases in cows (16). Escherichia, Klebsiella and Enterobacter are genera classified as coliforms. Escherichia coli are a common microorganism of the gut of humans and other warm‐blooded animals (13). E. coli is, in general, harmless, but pathogenic strains exist and E. coli is well known for causing food poisoning outbreaks. Faecal contamination of water, and food handlers, has been important sources of outbreaks. Strains as enteropathogenic E. coli (EPEC), enteroinvasive E. coli (EIEC) and enterotoxigenic E. coli (ETEC) are not very important in developed countries but a common cause of childhood diarrhoea in developing countries. ETEC is able to produce heat stable toxins which can resist a temperature of 100°C for 15 minutes and are acid resistant. Another strain known as enterohaemorrhagic E. coli (EHEC) and with serotype O157:H7 is in particular associated with raw milk and sickness. Illness caused by EHEC can range from non‐bloody diarrhoea to haemolytic uraemic syndrome (HUS), which is a life threatening condition. Serotype O157:H7 appears to have a common reservoir in cattle. The strain has a low infection dose and tends to survive lower pH then other bacteria (13). Furthermore, according to a study involving households in Kenya, 2 samples out of 91 E. coli positives reacted positively with O157:H7 specific antiserum (18). Because of the presence of coliforms as gut and environmental flora, the coliform count is used to measure the level of hygiene when it comes to milk handling (19). Staphylococcus aureus is also a common organism which is found on the skin, skin glands and mucous membranes of warm blooded animals. It can also be isolated from faeces and environmental sites such as soil and fresh water. In humans it is often found around the nasal zone and approximately 20‐50% healthy individuals are carriers. S. aureus produces heat resistant toxins which need prolonged boiling to be inactivated. Furthermore, S. aureus is a common source of food poisoning and human carriers seem to be a frequent source of contamination due to food handling. S. aureus is also a common organism causing mastitis. Mastitis could contribute to an increased total bacterial count in bulked milk and is treated with antibiotics. (13)

10
An SDP study shows that 83% and 63% of the milk samples from Nairobi area and Nakuru urban area had a total bacteria count over 2x10⁶ cfu/ml, respectively, at consumer‐level during wet season (19). A total bacterial count over 2x10⁶ cfu/ml exceeds the third and last grading of the raw milk quality scale, according to the East African Standard’s Raw Cow Milk specification (10). A study on Kenyan households showed that nearly all consumers boil their milk before consumption, which lowers the risks of bacterial health hazards (19). However, another study showed that 4% of the households in Nakuru rural area consumed raw milk in fermented form without prior boiling (18). There is a potential risk with unboiled sour milk, as milk borne pathogens which normally are killed during boiling, may survive the acidity in the soured milk that is supposed to retard the bacteria, and thus, causes a health risk to the consumer (19).
1.5 Physical and chemical adulteration There is a concern regarding drug residues in both the formal and informal milk sector (19). According to an SDP study, antimicrobial residues, such as antibiotic drugs, most likely originate at the farm‐level. When farmers fail to comply with the determined withdrawal periods after an antibiotic treatment, residues will most likely occur in the milk (19). Irresponsible usage of antibiotics in animal husbandry could cause antibiotic resistance in zoonotic pathogens related with diarrheal diseases (20). Other concerns are possible toxicological effects or allergic reactions (21, 22). Antibiotic residues could also cause problems by inhibiting starter culture activity in fermented milk (13). An earlier study of Kenyan smallholders in 2003 showed that farmers had poor or no treatment records for their cows, and also a lack of understanding regarding antibiotic residues in food (21). Furthermore, 13% of the samples from small‐ and large‐scale producer’s bulk milk were Beta‐lactam positive. Results from another study in Kenya conducted in 2005, showed that 6% of the marketed milk samples contained antibiotic residues (19). Among the small‐scale agents (Figure 2), about 9% of the samples Figure 2. Small‐scale agent contained antibiotic residues. Adulteration with water lowers the density of the milk. By adding water, the milk´s microbial quality could be compromised, which could result in a health hazard. According to an SDP study, it is likely that agents in some areas add water to increase the volume to make a larger profit, especially during the dry period when milk supplies are low and prices are high. Results further showed that 10% of the samples from market agents in Nairobi and Kiambu
11
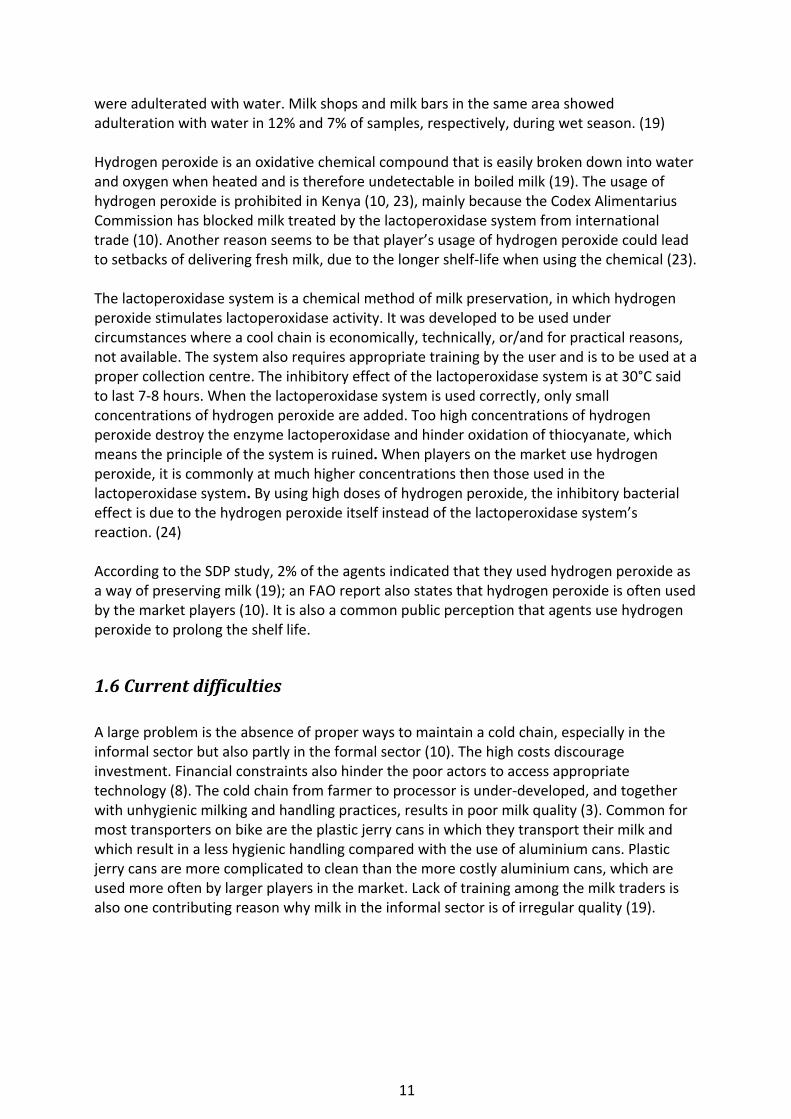
were adulterated with water. Milk shops and milk bars in the same area showed adulteration with water in 12% and 7% of samples, respectively, during wet season. (19) Hydrogen peroxide is an oxidative chemical compound that is easily broken down into water and oxygen when heated and is therefore undetectable in boiled milk (19). The usage of hydrogen peroxide is prohibited in Kenya (10, 23), mainly because the Codex Alimentarius Commission has blocked milk treated by the lactoperoxidase system from international trade (10). Another reason seems to be that player’s usage of hydrogen peroxide could lead to setbacks of delivering fresh milk, due to the longer shelf‐life when using the chemical (23). The lactoperoxidase system is a chemical method of milk preservation, in which hydrogen peroxide stimulates lactoperoxidase activity. It was developed to be used under circumstances where a cool chain is economically, technically, or/and for practical reasons, not available. The system also requires appropriate training by the user and is to be used at a proper collection centre. The inhibitory effect of the lactoperoxidase system is at 30°C said to last 7‐8 hours. When the lactoperoxidase system is used correctly, only small concentrations of hydrogen peroxide are added. Too high concentrations of hydrogen peroxide destroy the enzyme lactoperoxidase and hinder oxidation of thiocyanate, which means the principle of the system is ruined. When players on the market use hydrogen peroxide, it is commonly at much higher concentrations then those used in the lactoperoxidase system. By using high doses of hydrogen peroxide, the inhibitory bacterial effect is due to the hydrogen peroxide itself instead of the lactoperoxidase system’s reaction. (24) According to the SDP study, 2% of the agents indicated that they used hydrogen peroxide as a way of preserving milk (19); an FAO report also states that hydrogen peroxide is often used by the market players (10). It is also a common public perception that agents use hydrogen peroxide to prolong the shelf life.
1.6 Current difficulties A large problem is the absence of proper ways to maintain a cold chain, especially in the informal sector but also partly in the formal sector (10). The high costs discourage investment. Financial constraints also hinder the poor actors to access appropriate technology (8). The cold chain from farmer to processor is under‐developed, and together with unhygienic milking and handling practices, results in poor milk quality (3). Common for most transporters on bike are the plastic jerry cans in which they transport their milk and which result in a less hygienic handling compared with the use of aluminium cans. Plastic jerry cans are more complicated to clean than the more costly aluminium cans, which are used more often by larger players in the market. Lack of training among the milk traders is also one contributing reason why milk in the informal sector is of irregular quality (19).

12
1.7 Aims Food safety needs regularly awareness and monitoring to protect the consumers and maintain public health. The purpose of this study was to monitor the informal marketing path of cow milk from farmer to the consumer, and to examine the quality and safety of the milk along the value chain. The purpose was fulfilled by implementing following objectives:
To elucidate the postharvest handling practices of raw milk in the informal market in Kiambu County.
To ascertain the knowledge and precautions taken by the farmers to prevent the presence of antibiotic residues in the milk.
To analyse the microbial quality of raw milk samples along the value chain.
To determine physical and chemical adulteration by analysing the density and screening for antibiotic residues and hydrogen peroxide
2 Materials and Methods
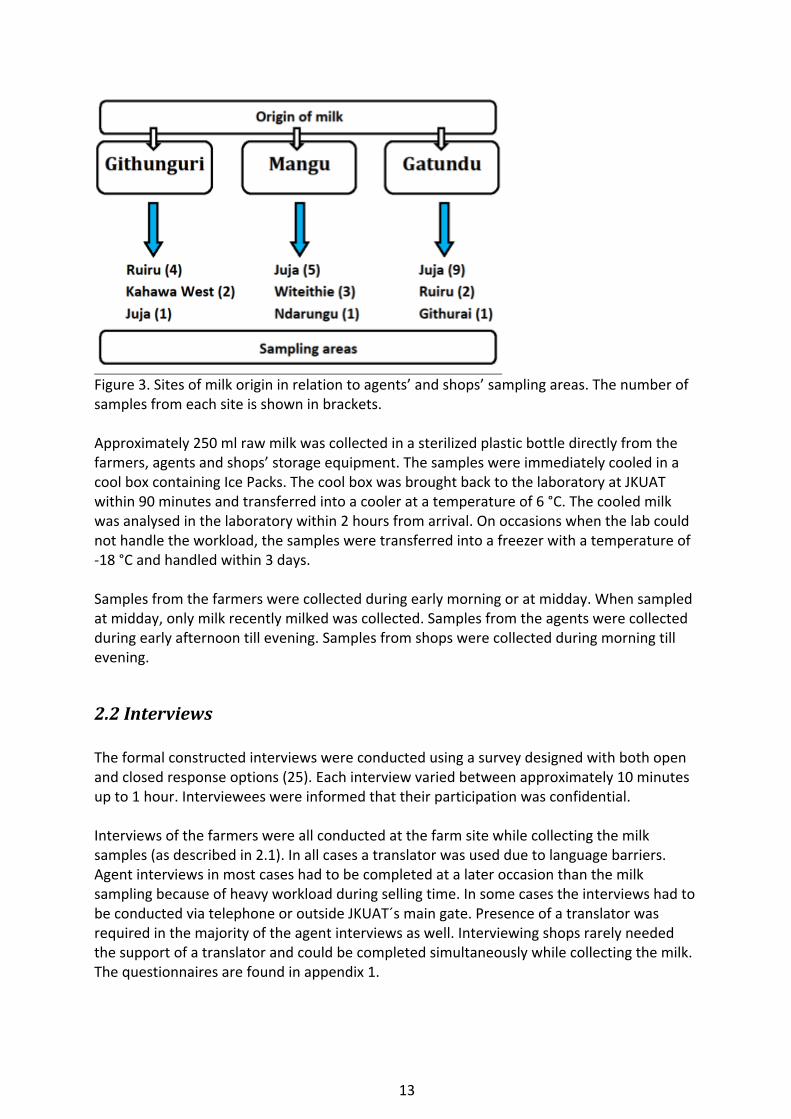
2.1 Milk sampling and preparation A total of 46 samples were collected in Kiambu County from the beginning of May till mid June 2012, that is, during the wet season. The number of samples collected was determined by an estimation of what would be practical during the period of approximately 35 days of sampling. The aim was to collect three samples from each step in the value chain with milk originating from the three regions of origin, namely Gatundu, Githinguri and Mangu. Milk was collected from nine farmers in the three regions of origin; each farm was sampled on two separate occasions. Additional samples were collected from ten small‐scale agents, seven large‐scale agents and eleven different kinds of shops. Samples from agents and shops were randomly collected from areas where the milk from the three regions was sold, and were concentrated in the following sites: Juja, Ruiru, Witeithie, Kahawa West, Githurai and Ndarungu (Figure 3).
13
Figure 3. Sites of milk origin in relation to agents’ and shops’ sampling areas. The number of samples from each site is shown in brackets. Approximately 250 ml raw milk was collected in a sterilized plastic bottle directly from the farmers, agents and shops’ storage equipment. The samples were immediately cooled in a cool box containing Ice Packs. The cool box was brought back to the laboratory at JKUAT within 90 minutes and transferred into a cooler at a temperature of 6 °C. The cooled milk was analysed in the laboratory within 2 hours from arrival. On occasions when the lab could not handle the workload, the samples were transferred into a freezer with a temperature of ‐18 °C and handled within 3 days. Samples from the farmers were collected during early morning or at midday. When sampled at midday, only milk recently milked was collected. Samples from the agents were collected during early afternoon till evening. Samples from shops were collected during morning till evening.
2.2 Interviews The formal constructed interviews were conducted using a survey designed with both open and closed response options (25). Each interview varied between approximately 10 minutes up to 1 hour. Interviewees were informed that their participation was confidential. Interviews of the farmers were all conducted at the farm site while collecting the milk samples (as described in 2.1). In all cases a translator was used due to language barriers. Agent interviews in most cases had to be completed at a later occasion than the milk sampling because of heavy workload during selling time. In some cases the interviews had to be conducted via telephone or outside JKUAT´s main gate. Presence of a translator was required in the majority of the agent interviews as well. Interviewing shops rarely needed the support of a translator and could be completed simultaneously while collecting the milk. The questionnaires are found in appendix 1.

14
2.3 Adulteration 2.3.1 Determination of specific gravity Density in g/ml was determined by using a lactometer at one of JKUAT’s laboratories. The raw milk was poured into a (100 ml) measuring cylinder and a lactometer was dropped in the milk to slowly sink down. Further, the lactometer reading was taken and recorded in Lactometer degree (L°). The temperature during measuring was approximately 20‐22 °C. No corrections were made for possible temperature differences over 20 °C. The reading was then used to calculate the milk density using the following formula: 1+ (lactometer reading/1000).
2.3.2 Determination of hydrogen peroxide Hydrogen peroxide was detected by using peroxide detection strips (Quantofix, Marcherey‐Nagel, Germany). The strips were dipped in the raw milk for one second and after 15 seconds the colour of the strip was compared with the colour scale provided. The colour of the cotton band on the strip would change from white to blue in presence of hydrogen peroxide, and the intensity of the blue colour would be dependent on the amount of hydrogen peroxide present. The higher the concentration, the more intense or deeper colour.
2.3.3 Determination of antibiotic residues Antibiotic residues were determined using an antibiotic test kit. The test is an inhibitor test, called a Hemmistofftest, according to 91/180/EEC. The test indicates the presence of antibiotic residues of beta‐lactams and tetracycline. The test kit consisted of disposable pipettes and small glass bottles containing a media of microorganisms and a dye. Approximately 1 mL milk sample was added to the glass bottle using the provided pipettes. A new pipette was used for each sample. The bottles were incubated in a water bath at 64.5 °C for 2.5 hours. After incubation, the results were read by comparing the media colour with the provided colour description. Negative tests ferment the lactose in milk during the incubation and the lactic acid produced reacts with the dye in the media resulting in a colour change to yellowish‐green. The presence of antibiotics in the milk inhibits the growth of the microorganisms and thus there is no production of lactic acid and therefore no colour change, which means it remains purple.
2.4 Determination of Total Viable Count, coliforms and Staphylococcus aureus The spread plate method was used for enumerating the bacteria. Serial decimal dilutions of raw milk samples were performed in 0.1% buffered peptone water (CM 0509 Oxoid, England). One hundred micro‐litres of the milk sample was spread in duplicate over the dry sterile plates of Nutrient Agar (M001 Himedia, India), Violet‐Red Bile Agar (M049 Himedia, India) and Baird Parker Medium (11705 Fluka, Switzerland) with egg yolk tellurite (FD 046

15
Himedia, India) for TVC, coliforms and S. aureus, respectively. The plates were then covered, inverted and incubated at 35°C for 24‐48 hours according to standard practice at the Food and Agricultural Sciences laboratory, JKUAT. A colony counter was used to count the colonies on the plates and the results were recorded (26). Coliforms were identified as pink colonies on VRBG, and S. aureus colonies on BP as circular, smooth, convex, moist, 2‐3 mm in diameter, grey‐black to jet‐black. Colony counts per ml were calculated using the formula given below. cfu/ml = colony count x dilution factor x 10 (27, 28)
2.5 Statistical analysis For data analysis, Microsoft Excel was used to perform a t‐test to compare different types of sets. The different stages of the value chain: farmers, small‐ and large‐scale agents and shops were the sets evaluated by the t‐test with regard to experience and microbial counts. Parameters used in the test were “one‐tail” and “two sample unequal variance”. Statistical treatment in terms of microbial counts was performed on data from fresh untreated milk only, omitting two samples: one boiled sample from a shop with milk from Mangu; and one sample containing hydrogen peroxide from a large‐scale agent with milk from Githunguri.
3 Results and Discussion
3.1 Survey of postharvest handling practices In appendix 1 the survey questions are presented while the questionnaire answers are found in appendix 2.
3.1.1 Farmer and antibiotics All nine farmers interviewed declared they treated their cows with antibiotics. Frequency of treatment ranged from less than one to three times a year. Two farmers sold their milk during treatment and three stated that they withdrew their milk for 3 days following an antibiotic treatment. The rest could not give a clear answer about when they started to use the milk again, or stated it was sold day after treatment was over. Duration of antibiotic treatments was mostly declared to last for 3 days, but ranged between 1‐7 days. One farmer stated that he did not understand the veterinarian’s English and could therefore not follow eventual instructions regarding treatment. Several farmers also stated that they use milk from treated cows in their own household, or fed their dogs with this milk. According to one farmer, his veterinarian told him to feed their dog with the milk from the
16
cow under antibiotic treatment. In general, the farmers’ knowledge of their antibiotic usage and possible hazards regarding antibiotic residues was very poor. The farmers normally put their trust in the hands of the veterinarian and do not involve themselves in the treatment. However, as antibiotics were easily available in stores, some farmers occasionally treated their animals on their own initiative to cut costs. The poor knowledge of farmers about treatment and antibiotic residues might not be the sole problem contributing to the occurrence of antibiotic residues in Kenyan milk at farm level. Different kinds of “veterinarians” exist on the market, and the education levels might differ significantly as the so‐called Para‐vets only have a 2 year education in animal health (29). Overall, the farmers knew little about their antibiotic use and most of them mentioned de‐worming as the most common treatment, as it was something that usually was done every third month. Yet, de‐worming is not an antibiotic treatment. Many farmers could not remember last time they used antibiotics, mainly because it was a long time ago but also due to a minimal or no interest on how the veterinarian treated the cow. Based on those facts, unclear statements were given, both regarding the frequency of treatment and the equipment used during treatment. Three farmers used separate equipment while milking a treated cow and six farmers could not answer if they used separate equipment or not; one important factor to consider in light of this was the number of cows owned by the farmer, which sometimes was only one. Findings in the present study partly match the earlier study on smallholders which showed a poor understanding of antibiotic residues in milk (21). All farmers should know that hazards exist when it comes to selling milk during antibiotic treatment, and maybe they do – but the problem could be an economic issue. Most poor smallholder farmers operate subsistence farming, not farming as a business (3), which makes it understandable why a farmer is forced to sell the milk. According to Shitandi and Sternesjö (21), the farmers’ most common reason for not discarding milk from recently treated cows was related to limited food supply and poverty. As the origin of antibiotic residues most likely is from farm‐level (19), it is important that actions are taken at farm‐level, involving the veterinarians, to prevent the release of residues on the market. However, rumours exist regarding agents adding antibiotics to the milk to prolong its shelf‐life. The present study found only one suspected positive sample for antibiotics, which came from a large‐scale agent (see 3.2.2). Nevertheless, no other indications of agents adulterating milk with antibiotics could be seen. A majority of the agents had some kind of education (see 3.1.4) regarding milk handling and seemed fairly sympathetic concerning their customers.
17
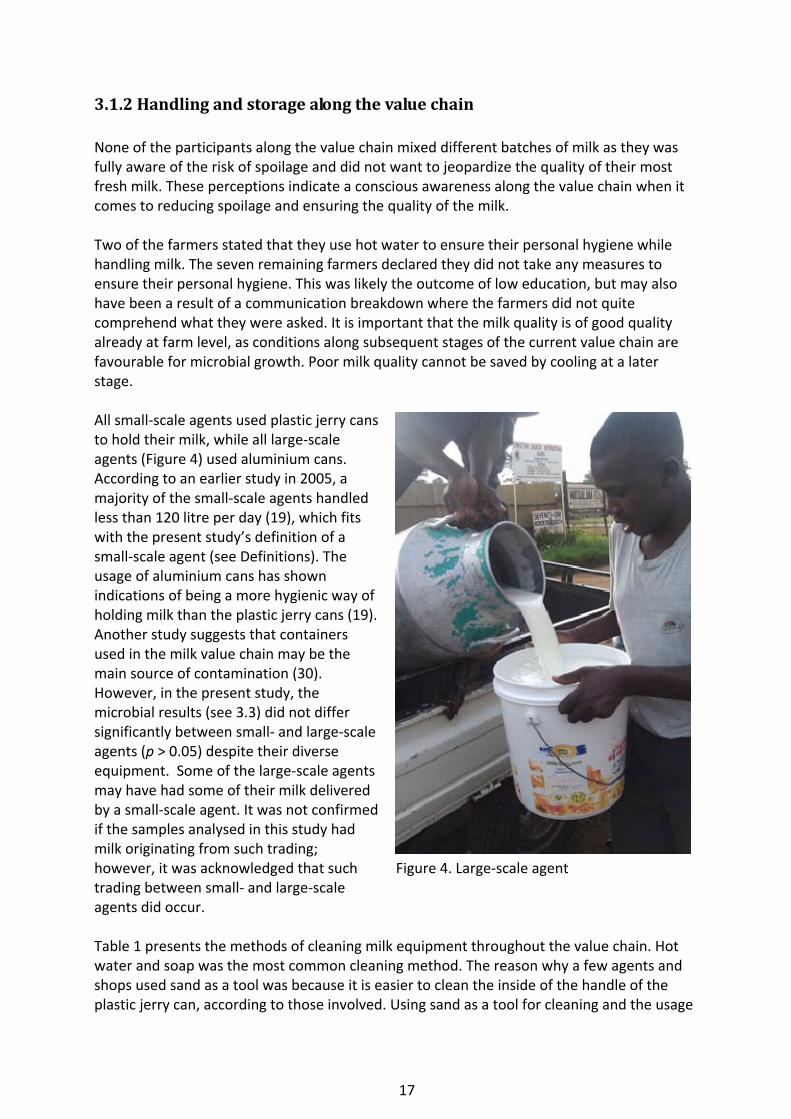
3.1.2 Handling and storage along the value chain None of the participants along the value chain mixed different batches of milk as they was fully aware of the risk of spoilage and did not want to jeopardize the quality of their most fresh milk. These perceptions indicate a conscious awareness along the value chain when it comes to reducing spoilage and ensuring the quality of the milk. Two of the farmers stated that they use hot water to ensure their personal hygiene while handling milk. The seven remaining farmers declared they did not take any measures to ensure their personal hygiene. This was likely the outcome of low education, but may also have been a result of a communication breakdown where the farmers did not quite comprehend what they were asked. It is important that the milk quality is of good quality already at farm level, as conditions along subsequent stages of the current value chain are favourable for microbial growth. Poor milk quality cannot be saved by cooling at a later stage. All small‐scale agents used plastic jerry cans to hold their milk, while all large‐scale agents (Figure 4) used aluminium cans. According to an earlier study in 2005, a majority of the small‐scale agents handled less than 120 litre per day (19), which fits with the present study’s definition of a small‐scale agent (see Definitions). The usage of aluminium cans has shown indications of being a more hygienic way of holding milk than the plastic jerry cans (19). Another study suggests that containers used in the milk value chain may be the main source of contamination (30). However, in the present study, the microbial results (see 3.3) did not differ significantly between small‐ and large‐scale agents (p > 0.05) despite their diverse equipment. Some of the large‐scale agents may have had some of their milk delivered by a small‐scale agent. It was not confirmed if the samples analysed in this study had milk originating from such trading; however, it was acknowledged that such Figure 4. Large‐scale agent trading between small‐ and large‐scale agents did occur. Table 1 presents the methods of cleaning milk equipment throughout the value chain. Hot water and soap was the most common cleaning method. The reason why a few agents and shops used sand as a tool was because it is easier to clean the inside of the handle of the plastic jerry can, according to those involved. Using sand as a tool for cleaning and the usage

18
of plastic jerry cans under the current poor conditions indicated a lack of understanding among those few agents when it comes to hygiene. Sand may likely contain both bacteria and spores, which may contaminate the jerry can instead of cleaning it. An earlier study showed that 89% of the agents used hot water and soap to clean their equipment (19). The earlier study’s results show a more positive trend among the agents compared to the present study, where a majority of 76% also used hot water and soap. The present study’s results may be related to the somewhat positive trend among the majority of the agents regarding education within the milk handling area (see 1.4). The results indicated that the majority of agents had some awareness about milk hygiene. Table 1. Cleaning of milk equipment along the value chain (Number (%))
Cleaning gear Farmer (n=9) Agents (n=17) Shops (n=11)
Hot water and soap 5 (56%) 13 (76%) 8 (73%)
Hot water 2 (22%) 1 (6%) 1 (9%)
Cold water 2 (22%) 0 1 (9%)
Sand as a tool 0 2 (12%) 1 (9%)
Machine wash 0 1 (6%) 0
Table 2 shows the holding periods of the milk in each step along the value chain. A majority of the farmers milked twice, morning and lunch, before they sold it and that is why the average holding period was around 5.5 hours. The morning milk was normally held by the farmer until the second milking was finished after lunch, as the agents picked up two batches at the same time. Different agents picked up their milk at different times, normally early in the morning or after lunch. The agents in the present study only picked up their milk once a day. One reason why shops had a substantially longer holding time was related to the use of cooling equipment to slow bacterial growth and prolong the shelf‐life. The handlers knew by experience and by the usage of several quality control methods (Table 3) how long they could hold the milk before it spoiled. Table 2. Milk holding period along the value chain (hours)
Range Median Average
Farmer 1‐8 4.5 5.4 Agents 5‐10 7.5 6.8 Shops 7‐39 23 16
Cold water immersion was used by 6 of 9 (66%) farmers as a form of preservation. The rest, 33%, kept their milk at ambient temperature. Among the agents only one (6%) practiced partial cold storage whereas the rest stored at ambient temperature. Between the several types of shops, the preservation options were mixed and 7 of 11 (64%) practiced full or partial cold storage. Almost half of the shops, 45%, practiced full cold storage while 64% boiled their left‐over milk to make sour milk or to sell the next morning. Certain milk, delivered around lunch, was boiled in one shop (9%) whereas all milk was boiled in another one. The fact that handlers boiled their milk before overnight storage or for making sour

19
milk (mala) indicated an awareness regarding health hazards. Boiling before fermentation is important due to the possible presence of pathogenic zoonoses in raw milk, and is advocated in several studies (18, 19, 31). An earlier study showed that 47% of the shops (Figure 5), mostly milk bars, cooled their milk while 19% of the traders, majority shops and kiosks, boiled their milk (19). The present study showed that 18 % of the shops boiled all or part of the milk delivered. However, as the present study only included two shops which boiled their milk, the comparison is of less importance. The two studies seemed to match with regard to cooling of milk as almost half of the shops practiced this method of preservation method. The matching results may be related to the number of milk bars involved in the studies, as they normally cool their milk. Normally, milk must be cooled within 2 to 4 hours after milking (3), which none of the milk handlers could manage. Even if the farmers could cool their milk properly, the cold chain would be broken by the agent. However, small quantities of milk could theoretically be cooled within 4 hours if the last batch picked up from the farmers was delivered immediately to a shop using cooling equipment. Whether this had, indeed, occurred in some cases was not confirmed. Figure 5. Milk in shop, cooled Temperature of storage is important since the temperature influences the microbial growth. At tropical temperatures, a bacteria cell with a typical generation time of 20 minutes (time for a microbial population to double in number) will in 7 hours multiply to 2 million cells (19). Seven hours is the average holding time for agents (Table 2) and 2.0x10⁶ cfu/mL is the limit for acceptable milk quality set by East African Standards (10). However, the same cell would only multiply to 32 cells if the temperature were lowered to below 10°C (19). This explains the high microbial counts (see 3.3) in this study, as well as highlighting the importance of a proper cool chain to maintain good milk quality.
3.1.3 Quality control checks along the value chain Quality control was present along the whole value chain, although around 55% of the farmers did not implement any type of quality check of their milk. All agents and shops regularly monitored their milk. Table 3 shows the different types of quality controls performed along the value chain. As seen in Table 3, quality control by the farmers was poor while three types of control methods were used by over 70% of the agents. It seems that agents were more conscious about the milk quality, which could be related to the substantially higher education level (see 3.1.4) along the value chain. A majority of the shops controlled their milk by boiling, which is understandable as it is a simple test as well as the same way customers mostly determine if their milk is spoiled.

20
Table 3. Quality control checks along the value chain (Number, (%))
Quality checks Farmer (n=9) Agent (n=17) Shop (n=11)
Alcohol test 0 13 (76%) 4 (36%)
Boil 2 (22%) 3 (18%) 8 (73%)
Density 0 12 (71%) 5 (45%)
Smell 3 (33%) 13 (76%) 1 (9%)
Nil 5 (55%) 0 0
None of the farmers declared they have had their milk rejected. Among the 65% of agents who had experienced poor milk quality, all stated they had rejected the milk from farmers. A majority, 82%, of the shops declared they had rejected milk with poor quality from agents. Many agents (10 of 17, 59%) confirmed that they have had their milk rejected by their buyer. The reason for the low frequency of milk rejected from the farmers could be related to the microbial counts in farmers’ milk, which were significantly lower than in milk from the agents (p < 0.001), implying that farmers’ milk is of better quality with regard to microbial counts (see 3.3). At agent‐shop level, results seem to match to an extent, as the majority of agents and shops declared that agents’ milk had been rejected. Data on the frequency and quantity of rejected milk, which would have been interesting to know, could unfortunately not be collated in this study. At shop‐level, 9 of 11 (82%) declared they have had their milk rejected by their customers. Milk quality is most often determined by consumers by boiling, and it was the most frequent reason why milk was rejected. When milk spoils, it tends to coagulate and have an abnormal boiling behaviour, which makes the customers complain. At all levels, rejection of milk seemed to occur. This could be seen as an indication of consciousness regarding milk quality and safety on the market. Also, it shows the precarious nature of milk quality under the current conditions.
3.1.4 Experience and education The longest experience was found at the farm level with an average of 24 years (Table 4), to be corroborated with 21 years in an earlier SDP study (19). Farmers have a significantly longer experience than all other parts of the chain (p < 0.001). The result of the present study shows an average experience substantially higher for the small‐scale agents than in the earlier mentioned study, where small‐scale agents had an average experience of 2.5 years. Large‐scale agents have a significantly longer experience than the small‐scale agents (p < 0.05). Why this difference exists could be based on the larger quantities handled that require more experience. It could also depend on well‐established agents who have earned enough to expand their businesses and, thus, have continued in the same business for several years. Furthermore, there was no significant difference between shops and the different types of agents in terms of experience.

21
Table 4. Years of experience along the value chain (years)
Range Median Average
Farmer 6‐50 28 24.3
Small‐Scale Agents 1‐10 5.5 4.0
Large‐Scale Agents 0.5‐15 7.7 7.6
Shops 0.5‐16 8.2 4.9
When it comes to education within the food safety area, 2 of 9 (22%) farmers had received visits from dairy societies for educational purposes. At agent‐level, 12 of 17 (71%) declared they regularly attend seminars held by a dairy society organization like the KDB for educational purposes, or had participated in a course to get a certificate in milk handling. Of the small‐scale agents, 7 of 10 (70%), stated they have received training in the form of seminars – this is an increase compared to the 4% trained mobile traders in an SDP study performed about 10 years ago (19). Although the training between the two studies might be of different quality, the comparison still implies a great improvement in access to and attendance at training events among small‐scale agents during the past 10 years. Of the shops, 4 of 11 (36%) employees stated they had attended at least one seminar held by the KDB. One (9%) employee reported that she had been educated by her father who is a veterinarian, whereas the rest (55%) stated they had no education within the food safety area. It seemed that most of the players who attended seminars, did so regularly, which is a positive trend. Frequency of seminar visits ranged from one to four times per year among the market players with regularly attendance. However, it is important that all players along the value chain are provided the same opportunities to attend seminars for educational purposes. Availability for all, as well as incitements for taking part in the educational seminars provided, should be applied to all informal market players, including the farmers. Although the agents had a higher proportion of education compared to the shops, there was no significant difference in microbial counts between the two groups ((p > 0.05), see 3.3). All agents with milk from Mangu had education in the form of seminars, while other regions just had some of their agents attending to the educational seminars or a course which gave them a certificate for milk handling. Yet, no significant difference occurred in microbial counts between the agents’ milk of different origins. The microbial analysis showed no significant difference between agents with and agents without education. These results imply that lack of education may only be a contributing factor to inappropriate milk handling with regard to microbial hygiene. However, an earlier study showed a significant reduction in unacceptable milk samples after training of agents (19).

22
3.1.5 Documentation Among the farmers, only one (11%) kept records of animal health and treatment, while the rest of the farmers only documented number of litres sold, artificial insemination, or kept no records at all. All farmers guaranteed traceability of their milk, which is understandable as all of the visited farmers had only one or two cows. Among the agents, 76% guaranteed they could trace their milk to its source. Shops (Figure 6) usually receive milk from several agents which makes it hard for them to guarantee full traceability of their milk, as they cannot control the handling by some agents. Among the shops, 4 of 11 (36%) declared they could trace their milk. According to the results, traceability becomes harder to guarantee after each step in the value chain. Figure 6. Milk in shop, not cooled
3.2 Adulteration 3.2.1 Density According to the East Africa Raw cow milk standard, the density of milk at 20°C should be within the range of 1.028‐1.036 g/ml. Indications of adulterations was found at all different levels along the value chain. In total, 67% of the farmers’ samples were within acceptable levels. The low result can be blamed on two farmers who had none of their samples within the acceptable limits. At agent level, small‐ and large‐scale agents had 60% and 86% of their samples within acceptable limits, respectively. At shop level 73% of the samples were within the satisfactory limits. Adulteration with water was spread over the whole value chain and was worst among the small‐scale agents, but did not necessarily mean that agents were the ones who were mixing the milk with water. Also, low density of the milk does not automatically mean it has been adulterated with water, and may for an example be the result of a cow suffering from mastitis (32). An average of 69% of the samples along the value chain was within acceptable limits according to the current East African Raw milk standards. Whereas, using the former Kenyan standard for Unprocessed Whole Milk (KS 05‐10: 1992), a total of 85% of the samples were within the acceptable limits (1.026 – 1.032 g/ml). In an SDP study (19) using the former Unprocessed whole milk standard (acceptable limit 1.026 – 1.032 g/ml), results showed that 10% of the samples on agent level were adulterated, while the present study reported a comparable 27% of its sample adulterated
23
as assessed by the former standard. Adulteration may vary by season and according to the earlier study, areas as Nakuru and Narok showed no cases of adulteration during wet season, while small mobile traders had 27% of their milk adulterated during dry season (19). Density determination by using a lactometer is not always accurate as it is influenced by temperature and fat content (33). A lactometer test is most accurate while combined with a fat test, as it is possible to read indications of milk being skimmed, water being added or to estimate the Solid non‐fat content. Some players add solids such as flour and sugar and remove the butterfat to increase the density (19). With only the lactometer as a tool it is not possible to determine if the milk is adulterated with water or not, as it could be covered with the above options. However, in this study the lactometer was the only tool available and preliminary indications of adulteration could be made. In appendix 3 all density results are presented.
3.2.2 Antibiotic residues and hydrogen peroxide Only one sample, from a large‐scale agent with milk from Githunguri, contained hydrogen peroxide and this sample also showed a positive result for antibiotic residues (beta‐lactams or tetracycline). The concentration of hydrogen peroxide was more than 25 mg/l, according to the colour scale provided. The positive strip showed a dark blue colour, darker than the last scale in the test kit description, which signifies a very high concentration. In an earlier study 2% of the market players indicated they used hydrogen peroxide (19), to be compared with the 2.2% detected in this study. As the antibiotic test is an inhibitor‐test, it is likely that the hydrogen peroxide masks the presence of antibiotic residues. The media provided in the test kit is supposed to ferment lactose in milk during incubation which would result in a colour change of the media (see 2.3.3). The colour did not change during incubation as the hydrogen peroxide likely worked as an inhibitor itself, due to its strong oxidative effect. Therefore, the sample might be a false positive with regards to antibiotics. In any case, the possible presences of antibiotic residues in this study (2.2%) shows an improvement compared with earlier studies showing a higher presence. In an earlier study, 13% of the samples from bulk milk in Kenya were Beta‐lactam positive (21). Furthermore, 6% of the market milk samples contained antibiotic residues in an SDP study (19). Among the small‐scale agents only, about 9% of the samples contained antibiotic residues in the SDP study. Another study showed that 7.1% of the mobile traders’ samples in Kiambu were positive for antimicrobial residues during wet season, while the results during dry season were doubled (34). Yet, including all market players studied in Kiambu, an overall of 1.4% of the samples were positive for antimicrobial residues over the recommended acceptable limit, which is similar to the present study’s result if the possible masked sample is counted as a positive. Including other sampling areas such as Nairobi and Nakuru, the earlier study show an overall of 3.8% of the samples as positive. In a study by Shitandi and Sternesjö (21), 69% of the positive samples were found in milk from smallholder producers. A follow‐up survey was conducted to identify possible

24
contributory factors, and it was found that the farmers had a poor understanding of antibiotic residues in milk. In the present study only small‐scale farmers were involved and results from interviews point to the same problem as they showed a poor understanding regarding antibiotic residues in milk (see 3.1.1).
3.3 Microbial Analyses Statistical analysis was performed on data from fresh untreated milk only, omitting two samples, one boiled sample from a shop with milk from Mangu and one sample containing hydrogen peroxide from an agent with milk from Githunguri. All raw data for microbial analysis are found in appendix 4.
3.3.1 Staphylococcus aureus S. aureus was not detected in three samples, and these were given an arbitrary value of 10 cfu/ml (Figure 7). Such samples included milk from a farmer from Mangu, which may be an indication of good milking practices by this particular farmer, as his milk had relatively lower counts in the rest of the microbial tests also, as compared to the samples from the other farmers. S. aureus was not detected in the sample from a large‐scale agent with milk from Githunguri – hydrogen peroxide had been detected in this sample, and it showed substantially lower microbial counts in all tests as to be seen below. A third sample in which S. aureus was not detected had been declared as boiled milk by a shop.
Figure 7. Staphylococcus aureus along the value chain (NB. Samples in which bacteria were not present above the limit of detection were given a minimum value of 10)

25
Low S. aureus counts observed in some samples from shops could be explained by possible boiling. For example, one of the shops with Mangu milk stated in general that it was boiling certain milk delivered at 1 pm, to prolong the shelf life together with cooling. Yet, this sample that was analysed was not declared to be boiled. However, it is likely that this milk had been boiled at an earlier occasion, as it has substantially lower counts in TPC, coliform and S. aureus in relation to the rest of the groups. Sample from the two shops with milk from Gatundu with counts of 300 and 1000 cfu/mL had also likely been boiled, as the microbial count for S. aureus was lower than most of the farmers’ milk. Furthermore, the two samples also showed low counts in the microbial tests for coliforms and TPC compared to the rest of the samples from the shops. The boiled milk in these cases had likely been re‐contaminated by handlers and their equipment after boiling. Some indications of large‐scale agents boiling their milk were observed during this study. The microbial counts in farmers’ milk (S. aureus, coliforms and total plate count) were significantly lower than in milk from the agents (p < 0.001), implying that farmers’ milk is of better quality with regard to microbial counts. The lower counts in farmers’ milk indicated that there was deterioration along the supply chain due to the proliferation of the microorganisms initially present in the milk or/and due to cross contamination. Considering all the samples, farmers’ and shops’ milk showed no significant differences (p > 0.05). Yet, by omitting the suspected boiled milk from the two shops with milk from Gatundu and one shop from Mangu, the S. aureus counts in the shops’ milk were then significantly higher than in milk from the farmers (p < 0.001). There were no significant differences (p > 0.05) in S. aureus counts between S.S agents and L.S agents, neither was there any difference between agents’ and shops’ milk. Laboratory standard practice did not exactly follow the standard method for S. aureus and coliforms (37 °C) as a temperature of 35 °C was used when incubating the petri dishes. As the temperature is a few degrees lower than standard practice, a small error might exist regarding the microbial counts, yet this was estimated not to be of significance as the milk standards classification grades are broad. According to European law, raw cow’s milk intended for direct consumption without any heat treatment, or raw milk for manufacturing of products without heat treatment has a threshold value of 5.0x10² cfu/mL, which is considered as satisfactory (35). The maximum value of 2.0x10³ cfu/mL is considered unsatisfactory if reached. Only four samples kept the satisfactory value and a total of 12 samples were successful in keeping below the maximum value (Figure 7). The majority of the samples below the maximum value originated from farmers and the rest were samples suspected of being boiled.
3.3.2 Coliform plate count Farmers’ milk had significantly lower coliform counts than agents’ milk (p < 0.001), and milk from shops (p < 0.05), implying that farmers’ milk is of better quality with regard to microbial counts (Figure 8). These differences arose because coliforms were not detected in three samples of farmers’ milk, which might be an indication of good milking practices by the farmers. Yet, only one of those three farmers also showed low counts for S. aureus and TPC, pointing to the importance of having multiple indicators of microbial hygiene. Milk samples

26
from the shops show two outliers which likely are a result of boiled milk (see 3.3.1). One of the outliers in this case is confirmed to be boiled milk originating from Mangu, and this was omitted from the statistical analysis (see 2.5). There was no significant difference (p > 0.05) in coliform counts between S.S. agents and L.S. agents as well as agents and shops. However, by omitting the suspected boiled milk from two shops with milk from Gatundu and one from Mangu, the microbial counts in agents’ milk were significantly lower (p < 0.05) than milk from the shops. This implies that the microbial quality of the milk deteriorated for each step in the value chain. Laboratory standard practice did not exactly follow the standard method for coliforms (see 3.3.1).
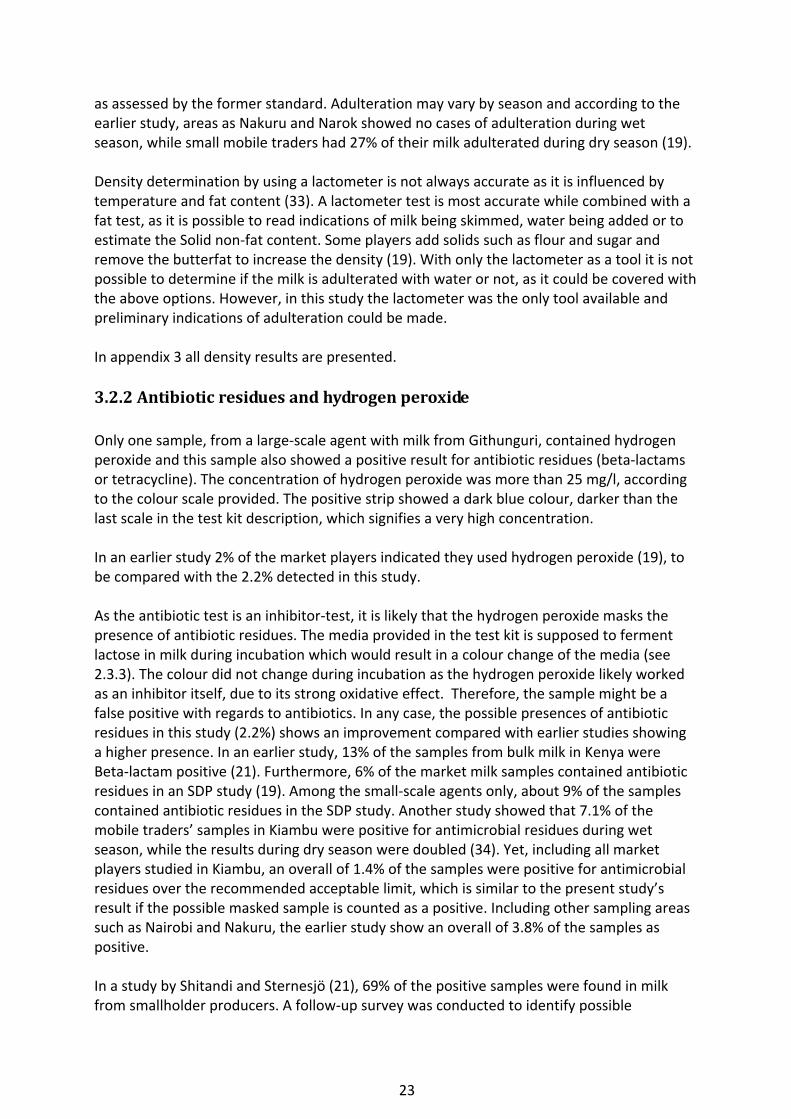
Figure 8. Coliform plate count along the value chain (NB. Samples in which bacteria were not present above the limit of detection were given a minimum value of 10) Farmers’ samples had the lowest incidence of bad quality graded milk in terms of coliform counts, according to standards cited by FAO (Figure 9)(10). Small‐scale agents had 60% of their milk graded as bad quality, to be compared with an earlier SDP study where “small mobile traders” had 70% of their milk exceeding 5.0x10⁴ cfu/mL, during wet season in Kiambu and Nairobi (19). The comparison shows a decrease by 10%, indicating a slight improvement in milk handling by the agents. Nevertheless, 64% of the milk samples from the shops had a coliform count over 5.0x10⁴ cfu/mL, which is a result slightly worse than the earlier SDP study’s outcome in which milk bars and shops/kiosks had 61% and 62% samples, respectively, during wet season exceeding the limit. It should be noted that the present study was also conducted in the wet season, which may explain the high percentage of bad quality samples, as according to the SDP study, milk samples collected during the dry season showed substantially lower counts for all market players in the applicable areas.
27
Figure 9. Coliform plate count (cfu/mL) along the value chain
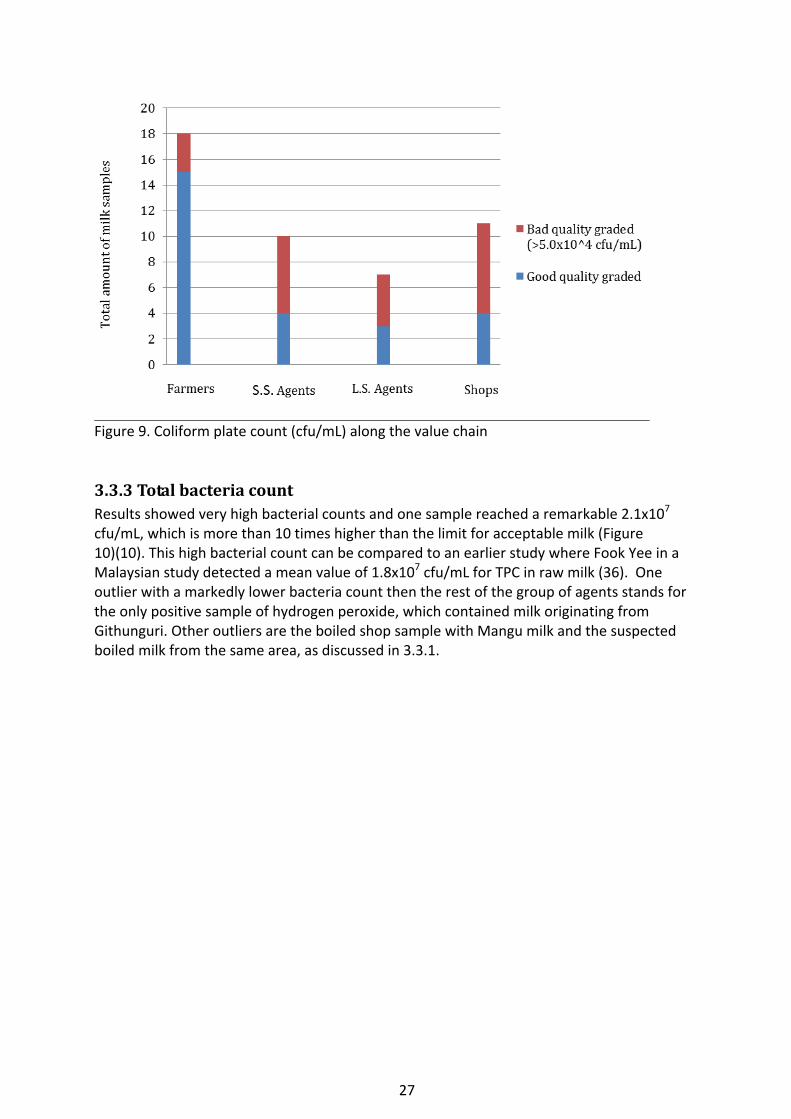
3.3.3 Total bacteria count Results showed very high bacterial counts and one sample reached a remarkable 2.1x10⁷ cfu/mL, which is more than 10 times higher than the limit for acceptable milk (Figure 10)(10). This high bacterial count can be compared to an earlier study where Fook Yee in a Malaysian study detected a mean value of 1.8x10⁷ cfu/mL for TPC in raw milk (36). One outlier with a markedly lower bacteria count then the rest of the group of agents stands for the only positive sample of hydrogen peroxide, which contained milk originating from Githunguri. Other outliers are the boiled shop sample with Mangu milk and the suspected boiled milk from the same area, as discussed in 3.3.1.

28
Figure 10. Total bacteria count along the value chain (NB. Samples in which bacteria were not present above the limit of detection were given a minimum value of 10) There was a significant difference (p < 0.001) between farmers and agents’ milk in terms of total bacterial counts (see 3.3.1). Statistical analysis of TPC results also showed a significant difference (p < 0.001) between farmers and shops’ milk, implying that farmers’ milk was of better quality with regard to microbial counts. Nevertheless, no significant difference (p > 0.05) was found between S.S. agents and L.S. agents. Neither was any significant differences observed between agents and shops in terms of microbial counts. According to an earlier study, milk quality seemed to decline in quality in terms of microbial counts, further up in the value chain (19). However, the present study only showed a significant difference in quality between farmers and the rest of the value chain studied. Yet, by omitting specific samples for analysis (see 3.3.1), quality differences after each step along the whole value chain from farmers to shops could be identified. This somehow supports the findings by the earlier study.
Laboratory standard practice did not exactly follow the standard method for TPC (32 °C for 48 h) as a temperature of 35 °C was used when incubating the petri dishes. As the temperature is a few degrees higher than standard practice, a small error might exist regarding the microbial counts, yet this was estimated not to be of significance as the milk standard’s classification grades are broad.
The Unprocessed Whole Milk Standard’s revised bacteriological grades rate a TPC over 2.0x10⁶ cfu/mL as “Very bad” milk, which is the last and worse grade (10). An alternative standard, the East African Raw cow milk standard, uses three different grades, in which counts over 2.0x10⁶ exceed the third and last grading. This study describes the milk exceeding 2.0x10⁶ as “Unacceptable”.
Farmers had only one sample exceeding 2.0x10⁶ while 70% of the small‐scale agents’ milk were of unacceptable microbial quality (Figure 11). The 70% can be compared to an earlier
29
study, performed during wet season in Kiambu and Nairobi, where 86% of the small mobile traders showed an unacceptable milk quality regarding TPC (19). Furthermore, the same study showed that milk bars and shop/kiosks had 86% and 88% of their milk samples of unacceptable quality, respectively. The present study, also performed during wet season, showed better results with regard to the TPC at all steps in the value chain compared to the earlier study. Although the present study covered a small number of samples, this trend points to an improvement in milk quality along the value chain in the past 12 years.
Figure 11. Total plate count (cfu/mL) along the value chain
4 Conclusions
Milk quality in terms of microbial counts seemed to significantly decrease after send‐off by farmers. The decrease in quality indicated that there was deterioration along the supply chain due to the proliferation of the microorganisms initially present in the milk or/and due to cross contamination. No significant difference in milk quality between other steps in the value chain could be confirmed. The decreases in quality led to a proportion of samples being of ‘unacceptable’ quality according to the current East African Raw Cow milk standards. A number of samples showed substantially lower counts than the rest and were suspected or confirmed being boiled or contained hydrogen peroxide. Indications of significant differences in microbial counts along the whole value chain from farmer to shops could be seen after omitting those specific samples. Microbial analyses indicated a deficiency in quality along the value chain, and a contributing factor seemed to be certain milk handling practices described by farmers, agents and shops in the interviews. Lack of appropriate education/knowledge and appropriate equipment appeared to be two main factors affecting poor milk quality.
Adulteration was detected in terms of specific gravity in 30% of all the samples along the value chain according to the East Africa Raw cow milk standard. Chemical adulteration was detected along the value chain in forms of hydrogen peroxide. Confirmed detection of
30
antibiotic residues could not be found in any sample. However, the lack of understanding about antibiotic residues in milk shown by the farmers during the interviews implied that a possible health risk could occur, as drug residues do not disappear due to boiling. Possible health hazards of zoonoses arising from production of naturally fermented milk in shops seem to be controlled by the shops through boiling. Handling practices clearly indicated that the value chain from farmer to agent is incapable of accessing appropriate technology and equipment for safe milk handling. However, virtually all consumers boil purchased raw milk before consumption. Risks of infection from bacterial health hazards are therefore considered to be low. Poverty seems to be the main contributor for the lack of resources. Appropriate innovations, which are cost‐effective and affordable to all market players involved, will be necessary to maintain proper milk handling.
5 Acknowledgements This study trip to Kenya was funded by the Swedish International Development Cooperation Agency (SIDA) through the Minor Field Studies Programme. Another contributor for my visit was DeLaval through their Travel Scholarship. I want to thank Stefan Bergstrand from DeLaval for his cooperativeness with regard to the application progress. I also would like to acknowledge and extend my deepest gratitude to the following persons who made this great adventure possible for me: Professor Christine Onyango for accepting me as a visitor student and for the support during my time at JKUAT. Dr. Daniel Sila for his support, guidance and for getting me installed at my arrival in Kenya. Dr. Julius Maina for his support and knowledge within the milk area. Some special persons supported me to the extent that without them my work in Kenya would not have been possible to accomplish. Peter Kahenya for his great knowledge, guidance and support in both theoretical as practical matters. Irene Orina and Wahid Abraham for the cheerful company, support on the field and for keeping me safe during my sampling. Paul Karanja for always being available and supporting in all kind of matters. Jannifer Wambugu for her commitment, support and hard work in the lab. Cecilia Muigai for her helping hand to find my last samples. Dr. Agnes Kihurani for her inspiration in form of positive energy which kept me inspired during setbacks in the sampling progress. All staff members and students at JKUAT who supported me and gave me a great time during my stay. All the farmers and milk handlers who volunteered and made this study possible. I have also had a great support from my home university SLU from the early application stage until the very end of my work. Associated professor Stefan Roos for supporting me with application documents and last but not least my magnificent supervisor Su‐lin Hedén, which I am deeply indebted to, for her enormous patience, support and motivation throughout my whole work.

31
6 References
1. www.cia.gov [Internet]. Washington: Central Intelligence Agency, [Updated 2012 October 4; cited 2012 October 30]. Available from: https://www.cia.gov/library/publications/the‐world‐factbook/geos/ke.html
2. www.kdb.co.ke [Internet]. Nairobi: Kenyan Dairy Board, [Updated 2012; cited 2012]. Available from: www.kdb.co.ke
3. TechnoServe Kenya. The Dairy Value Chain in Kenya. East African Development Program; 2008.
4. Smallholder Dairy Project. The Uncertainty of Cattle Numbers in Kenya. Nairobi: Smallholder Dairy Project; 2005. SDP Policy Brief No.10.
5. ILRI. Markets that work: making a living from livestock. International Livestock Institute; 2008. Annual Report 2007.
6. Kenya National Dairy Masterplan. A situational Analysis of the Dairy Sub‐sector. Nairobi: Ministry of Livestock Development; 2010. Volume 1.
7. S. J. Staal, M. Waithaka, L. Njoroge, D.M. Mwangi, D. Njubi and A. Wokabi. Cost of milk production in Kenya: Estimates from Kiambu, Nakuru and Nyandaarua Districts. Nairobi: Smallholder Dairy Project; 2003. SDP Research and Development Report No.1.
8. FY 2011‐2015 Multi‐Year Strategy [Internet]. Feed the Future; 2011. Available from: http://kenya.usaid.gov/sites/default/files/KenyaFTFMulti‐YearStrategy.pdf
9. Smallholder Dairy Project. Employment generation in the Kenya Dairy Industry. Nairobi: Smallholder Dairy Project; 2004. SDP Policy Brief No.2.
10. H.G. Muriuki. Dairy development in Kenya. Rome: Food and Agriculture Organization of the United Nations; 2011.
11. S. Wambugu, L. Kirimi, J. Opiyo. Productivity trends and performance of dairy farming in Kenya. Nairobi: Tegemeo Institute of Agricultural Policy and Development; 2011.
12. Smallholder Dairy Project. The Demand for Dairy Products in Kenya. Nairobi: Smallholder Dairy Project; 2004. SDP Policy Brief No.1.
13. M.R. Adams and M.O Moss. Food Microbiology. Second Edition. Guildford: The Royal Society of Chemistry; 2000.
14. CDC.gov [Internet] Atlanta: Centers for Disease Control and Prevention; 2011. Available from: http://www.cdc.gov/tb/publications/factsheets/general/mbovis.pdf
32
15. Smallholder Dairy Project. Public Health Issues in Kenyan Milk Markets. Nairobi: Smallholder Dairy Project; 2004. SDP Policy Brief No.4.
16. J. Hogan and K.L. Smith. Coliform Mastitis. Veterinary Research; 2003. 34, p. 507–519.
17. J.C.F. Pantoja, D.J. Reinemann, and P.L. Ruegg. Factors associated with coliform count in unpasteurized bulk milk. Journal of Dairy Science; 2011. 94, p. 2680–2691.
18. S.M. Arimi, E. Koroti, E.K. Kang’ethe, A.O. Omore and J.J. McDermott. Risk of infection with Brucella abortus and Escherichia coli O157:H7 associated with marketing of unpasteurized milk in Kenya. Nairobi: Department of Public Health, Pharmacology and Toxicology, University of Nairobi; 2005.
19. Omore, et. al. Addressing the public health and quality concerns towards marketed milk in Kenya. Nairobi: Smallholder Dairy (R&D) Project; 2005. SDP Research and Development Report 3.
20. W. Witte. Medical consequences of antibiotic use in agriculture: Science; 1998. 279, p. 996‐997.
21. Shitandi and Å. Sternesjö. Factors Contributing to the Occurrence of Antimicrobials Drug Residues in Kenyan Milk. Journal of Food Protection; 2004. Vol. 67, No. 2, p. 399‐402.
22. J. M. Dewdney, L. Maes, J. P. Raynaud, F. Blanc, J. P. Scheid, T. Jackson, S. Lens, and C. Verschueren. Risk assessment of antibiotic residues of beta‐lactams and macrolides in food products with regard to their immune‐allergic potential. Food and Chemical Toxicology; 1991. 29, p. 477‐482.
23. Infonet‐biovision.org [Internet]. Nairobi: The Organic Farmer; 2009. Available from: www.infonetbiovision.org/res/res/files/3137.org_farmer44_reduced.pdf
24. Codexalimentarius.org [Internet]. Guidelines for the Preservation of Raw Milk by the Lactoperoxidase System. Codex Alimentarius; 1991. CAC/GL 13‐1991. Available from: www.codexalimentarius.org/standards/list‐of‐standards/en/
25. R. Patel och B. Davidson. Forskningsmetodikens grunder. Lund: Studentlitteratur; 2011.
26. Official Methods of Analysis of AOAC International. Arlington, USA: AOAC International; 1995. 16th Edition.
27. P.L. Cousins and F. Marlatt. An evaluation of a conductance method for the enumeration of enterobacteriaceae in milk. Journal of Food Protection; 1990. 53, p. 568‐570, 625.

33
28. F.P. Downes, K. Ito. Compendium of methods for the microbiological examination of foods. Washington, DC: American Public Health Association; 2001.
29. Dr. Njonge Francis [Personal message]. June, 2012.
30. B. Bonfoh, et. al. Microbiological quality of cows’ milk taken at different intervals from the udder to the selling point in Bamako (Mali). Food Control; 2003. 14, p. 495–500.
31. Omore, et. al. Assessing and Managing Milk‐borne Health Risks for the Benefit of Consumers in Kenya. Nairobi: Smallholder Dairy (R&D) Project; 2002.
32. N. Sharma, N.K. Singh and M. S. Bhadwal. Relationship of Somatic Cell Count and Mastitis: An Overview. Asian‐Australasian Association of Animal Societies; 2011. Vol. 24, No. 3, p. 429 – 438.
33. J. Draaiyer, B. Dugdill, A. Bennett and J. Mounsey. Resource Book – a practical guide to assist milk producer groups. Rome: Food and Agriculture Organization of the United Nations; 2009.
34. E.K. Kang’ethe, G.O. Aboge, S.M. Arimi, L.W. Kanja, A.O. Omore, J.J. Mcdermott. Investigation of the risk of consuming marketed milk with antimicrobials residues in Kenya. Food Control; 2005. 16, p. 349–355.
35. Official Journal of the European Communities. Council Directive 92/46/EEC of 16 June 1992 – laying down the health rules for the production and placing on the market of raw milk, heat‐treated milk and milk‐based products. No L 268/1.
36. F.Y. Chye, A. Abdullah and M.K. Ayob. Bacteriological quality and safety of raw milk in Malaysia. Food Microbiology; 2004. 21, p. 535–541.

34
7 Appendices
1. Questionnaires
2. Interview answers
3. Density
4. Microbial analyses
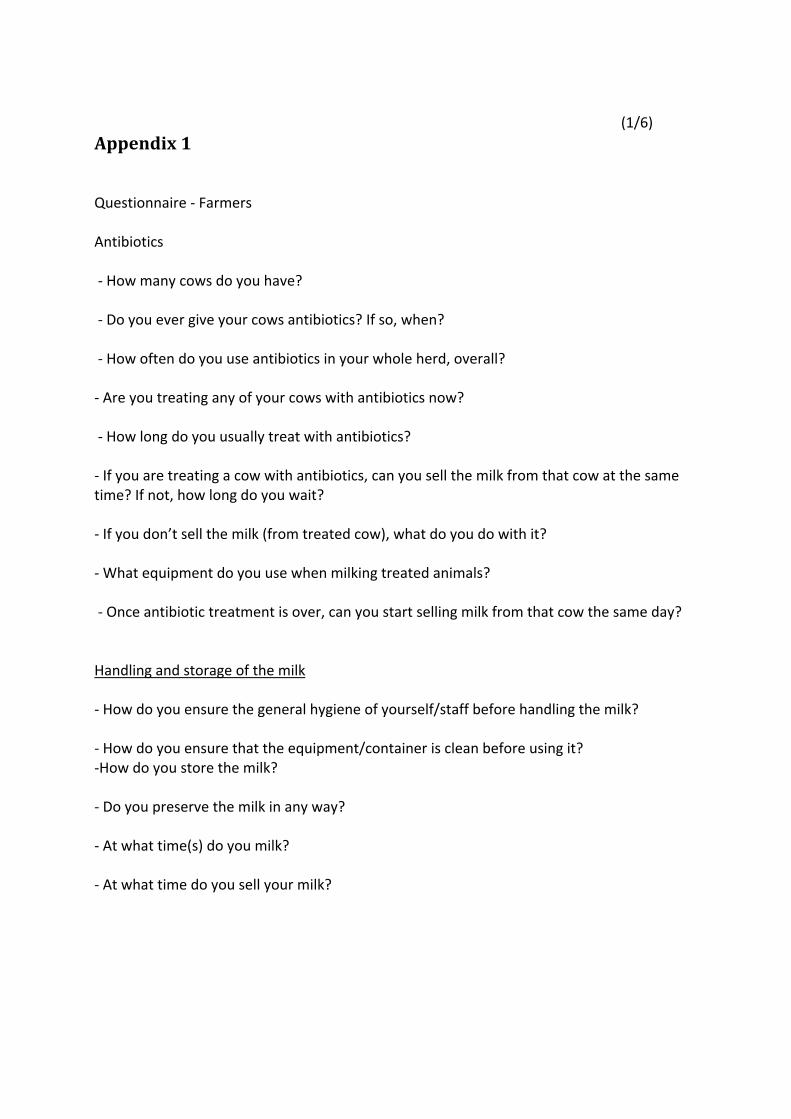
(1/6)
Appendix 1 Questionnaire ‐ Farmers Antibiotics ‐ How many cows do you have? ‐ Do you ever give your cows antibiotics? If so, when? ‐ How often do you use antibiotics in your whole herd, overall? ‐ Are you treating any of your cows with antibiotics now? ‐ How long do you usually treat with antibiotics? ‐ If you are treating a cow with antibiotics, can you sell the milk from that cow at the same time? If not, how long do you wait? ‐ If you don’t sell the milk (from treated cow), what do you do with it? ‐ What equipment do you use when milking treated animals? ‐ Once antibiotic treatment is over, can you start selling milk from that cow the same day? Handling and storage of the milk ‐ How do you ensure the general hygiene of yourself/staff before handling the milk? ‐ How do you ensure that the equipment/container is clean before using it? ‐How do you store the milk? ‐ Do you preserve the milk in any way? ‐ At what time(s) do you milk? ‐ At what time do you sell your milk?

(2/6) Control ‐ Do you have any quality control checks? ‐ What parameters do you monitor? ‐ How do you handle any deviations? ‐ How do you ensure the safety of milk while selling it to the agent? ‐ Have you ever had your milk rejected? ‐ Why did you get it rejected? ‐ What actions did you take to prevent it from recurring? Experience/education ‐ How long have you been working as a farmer? ‐ Do you have any education within the area of food hygiene/safety? Documentation ‐ Do you keep any records on your herd? ‐ Are you able to trace bad milk from its source?

(3/6) Questionnaire – Agents Handling and storage of the milk ‐ How many liters do you handle? ‐ How much do you buy your milk for and how much do you sell it for? ‐ What time do you start picking up your milk? ‐ What time do you finish collecting your milk? ‐ What time do you start selling your milk? ‐ What time do you stop selling your milk? ‐ Do you sell all the milk that you collect? If you don’t sell all the milk, what do you do with the rest? ‐ If you discard unsold milk, what percentage of milk do you discard every week? ‐ How do you decide when it is no longer “okay” to sell that batch of milk? ‐ How do you store the milk? ‐ Do you preserve the milk in any way? ‐ Do you ever mix different batches of milk? (eg. morning‐afternoon) ‐ How do you ensure the general hygiene of yourself before handling the milk? ‐ How do you ensure that the equipment/container is clean before using it? ‐ Do you ever add anything to your milk for some reason?

(4/6) Control ‐ Do you have any quality control checks? ‐ What parameters do you monitor? ‐ How do you handle any deviations? ‐ How do you ensure the safety of milk while selling it to the consumer/customer? ‐ Have you ever had your milk rejected? ‐ Why did you get it rejected? ‐ What actions did you take to prevent it from recurring? Experience/education ‐ How long have you been working as a farmer/agent/seller? ‐ Do you have any education within the area of food hygiene/safety? Documentation ‐ Are you able to trace bad milk from its source?

(5/6) Questionnaire – Shops Handling and storage of the milk ‐ How many liters do you sell per day? ‐ How much do you buy your milk for and how much do you sell it for? ‐ How many different agents deliver milk for you? ‐ What time is the milk delivered? ‐ How long do you hold the milk before it usually gets sold? ‐ Do you sell all the milk delivered? If you don’t sell all the milk, what do you do with the rest? ‐ If you discard unsold milk, what percentage of milk do you discard every week? ‐ How do you decide when it is no longer “okay” to sell that batch of milk? ‐ How do you store the milk? ‐ Do you preserve the milk in any way? ‐ Do you ever mix different batches of milk? (eg. morning‐afternoon) ‐ How do you ensure the general hygiene of yourself /staff before handling the milk? ‐ How do you ensure that the equipment/container is clean before using it? ‐ Do you ever add anything to your milk for some reason?

(6/6)
Control ‐ Do you have any quality control checks? ‐ What parameters do you monitor? ‐ How do you handle any deviations? ‐ How do you ensure the safety of milk while selling it to the customer? ‐ Have you ever had your milk rejected? ‐ Why did you get it rejected? ‐ What actions did you take to prevent it from recurring? Experience/education ‐ How long have you been working as a seller? ‐ Do you have any education within the area of food hygiene/safety? Documentation ‐ Are you able to trace bad milk from its source?

Appendix 2 (1/11) Interview answers, Farmers (DK – did not know; NA – not applicable)
Area of milk origin Githunguri Mangu Gatundu
Farmer 1 (#20)
Farmer 2 (#21)
Farmer 3 (#22)
Farmer1 (#6)
Farmer 2 (#7)
Farmer 3 (#8)
Farmer 1 (#9)
Farmer 2 (#10)
Farmer 3 (#11)
Number of cows 2 1 1 1 2 1 2 2 1
Number of litres 10 10 7 7 14 7 10 12 5
Antibiotics
a) Treatment Yes Yes Yes Yes Yes Yes Yes Yes Yes
b) How many times/year
DK DK DK 3 NA 1 <1 <1 <1
c) Duration (days) 3 DK 1 3 NA 3 3 7 3
d) Selling of milk from treated cow
No No Yes No NA No No No Yes, except treated udder
e) Withdrawal period (days)
DK 0 NA DK 3 3 3 NA NA
f) Equipment when treating
Separate NA Separate Separate NA NA NA NA NA
Handling and storage
a) Personnel Hygiene
Hot water usage
DK DK DK DK Hot water usage
DK DK DK
b) Equipment cleanliness
Hot water, drying
Hot water and soap
Hot water, soap, drying
Hot water Cold water, drying
Cold water Hot water and soap
Hot water and soap
Hot water and soap
c) Preservation NA Cold water immersion
Cold floor Cold water immersion
Cold water immersion
Cold water immersion
No Cold water immersion
Cold water immersion
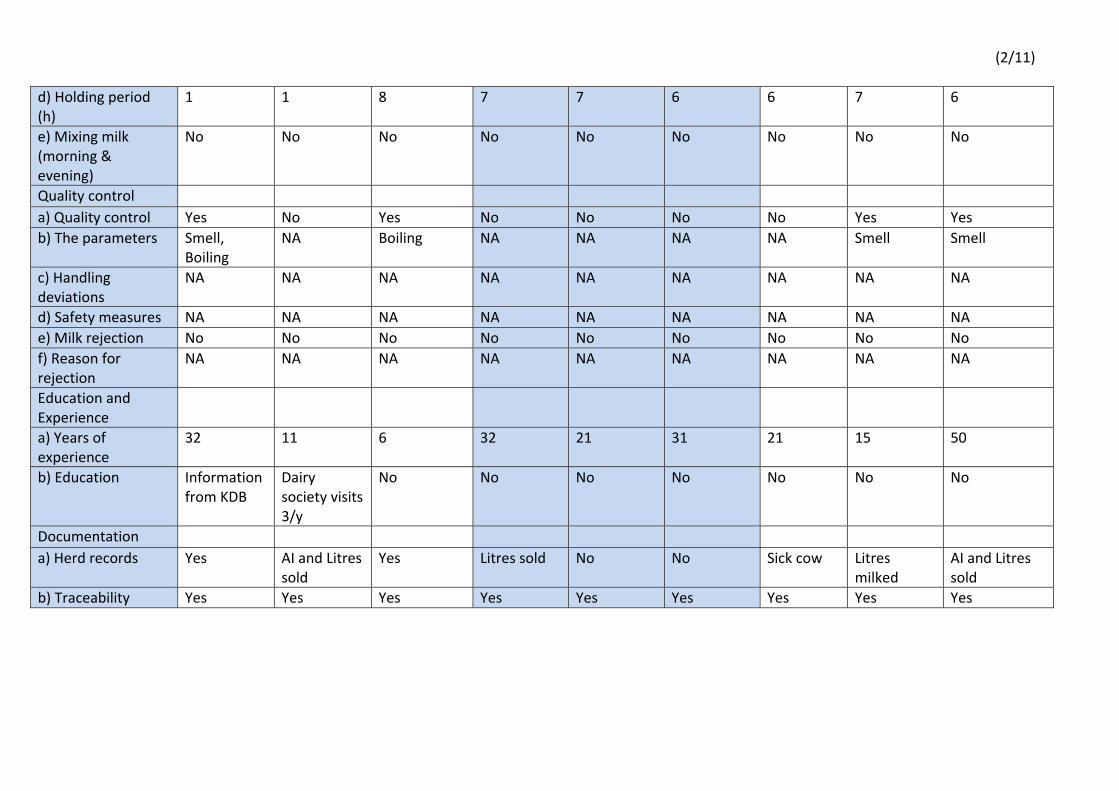
(2/11)
d) Holding period (h)
1 1 8 7 7 6 6 7 6
e) Mixing milk (morning & evening)
No No No No No No No No No
Quality control
a) Quality control Yes No Yes No No No No Yes Yes
b) The parameters Smell, Boiling
NA Boiling NA NA NA NA Smell Smell
c) Handling deviations
NA NA NA NA NA NA NA NA NA
d) Safety measures NA NA NA NA NA NA NA NA NA
e) Milk rejection No No No No No No No No No
f) Reason for rejection
NA NA NA NA NA NA NA NA NA
Education and Experience
a) Years of experience
32 11 6 32 21 31 21 15 50
b) Education Information from KDB
Dairy society visits 3/y
No No No No No No No
Documentation
a) Herd records Yes AI and Litres sold
Yes Litres sold No No Sick cow Litres milked
AI and Litres sold
b) Traceability Yes Yes Yes Yes Yes Yes Yes Yes Yes

(3/11) Interview questions, Small‐scale agents
Area of milk origin
Githunguri Mangu Gatundu
S.Agent1 S.Agent2 S.Agent1 S.Agent2 S.Agent3 S.Agent4 S.Agent1 S.Agent2 S.Agent3 S.Agent4
Handling and Storage
a) Capacity (litre)
150 80 70 140 40 60 160 75 100 35
b) Buying Price/litre
37 35 30 30 35 32 NA 28 NA 30
c) Selling price/litre
50 45 45 45 45 50 NA 40 NA 45
d) Vehicle NA Motorbike Motorbike Motorbike NA Motorbike Motorbike Motorbike Motorbike NA
e) Cleanliness of equipment
Cold water and soap
Hot water and soap
Hot water and soap
Hot water, dry
Hot water, soap, sand
Hot water and soap
Hot water and soap
Hot water and soap
Hot water, soap, scrubber
hot water, sand
f) Storage temperature
Ambient Ambient Ambient Ambient Ambient Ambient Ambient Ambient Ambient Ambient
g) Equipment Jerry can Jerry can Jerry can Jerry can Jerry can Jerry can Jerry can Jerry can Jerry can Jerry can
h) Preservation
No No No No No Cool, 2 hours between pick and sale
No No No No
i) Holding period (h)
10 5 8 7 6 10 7 6 7 5
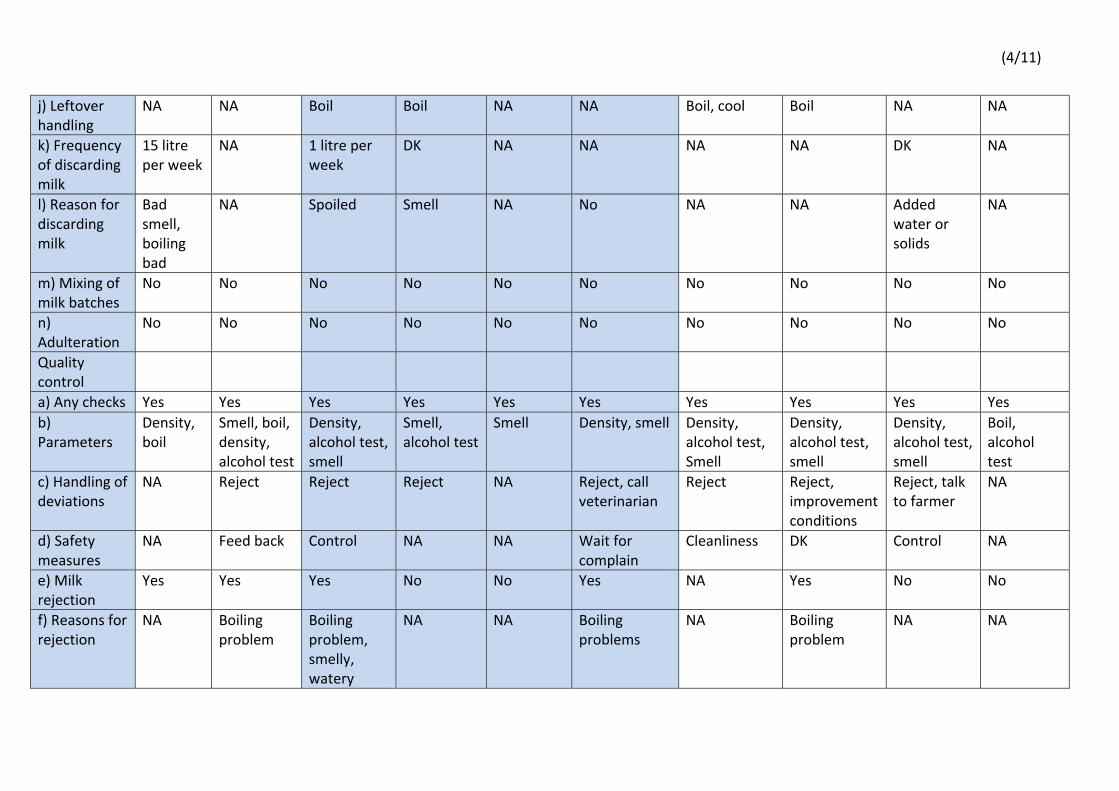
(4/11)
j) Leftover handling
NA NA Boil Boil NA NA Boil, cool Boil NA NA
k) Frequency of discarding milk
15 litre per week
NA 1 litre per week
DK NA NA NA NA DK NA
l) Reason for discarding milk
Bad smell, boiling bad
NA Spoiled Smell NA No NA NA Added water or solids
NA
m) Mixing of milk batches
No No No No No No No No No No
n) Adulteration
No No No No No No No No No No
Quality control
a) Any checks Yes Yes Yes Yes Yes Yes Yes Yes Yes Yes
b) Parameters
Density, boil
Smell, boil, density, alcohol test
Density, alcohol test, smell
Smell, alcohol test
Smell Density, smell Density, alcohol test, Smell
Density, alcohol test, smell
Density, alcohol test, smell
Boil, alcohol test
c) Handling of deviations
NA Reject Reject Reject NA Reject, call veterinarian
Reject Reject, improvement conditions
Reject, talk to farmer
NA
d) Safety measures
NA Feed back Control NA NA Wait for complain
Cleanliness DK Control NA
e) Milk rejection
Yes Yes Yes No No Yes NA Yes No No
f) Reasons for rejection
NA Boiling problem
Boiling problem, smelly, watery
NA NA Boiling problems
NA Boiling problem
NA NA

(5/11)
Experience & Education
a) Years of experience
10 7 2 3 7 4 1 1 1,5 3
b) Education No Seminars 3/y, KDB
Seminars 2/y, KDB
Seminars 1/y, KDB
Seminars 2/y, companies
Seminars 2/y, KDB
No seminar 3/y, KDB
Certificate, Seminars 2/y, KDB
No
Documentation
a) Traceability No Yes Yes Yes Yes Yes No Yes Yes No

(6/11) Interview questions, Large‐scale agents
Area of milk origin Githunguri Mangu Gatundo
L.Agent1 L.Agent2 L.Agent3 L.Agent1 L.Agent2 L.Agent1 L.Agent2
Handling and Storage
a) Capacity (litre) 200 (80) 1200 300 300 200 (150) 800 400
b) Buying Price/litre 35 35 30 30 30 30 30
c) Selling price/litre 50 40 45 50 45 45 45
d) Vehicle NA Pickup Pickup Pickup Pickup Pickup Pickup
e) Cleanliness of equipment
Hot water, soap, steel brush, dry
Machine wash with hot water and soap
Hot water and soap
Hot water and soap
Hot water and soap
Hot water, soap, dry
Hot water, soap
f) Storage temperature
Ambient Ambient Ambient Ambient Ambient Ambient Ambient
g) Equipment Aluminium jug can Aluminium jug can Aluminium jug can
Jerry can, aluminium jug can
Aluminium jug can
Milk can (metal)
Milk can (metal)
h) Preservation No No No No No No No
i) Holding period (h) 6 5 7 7 7 8 5
j) Leftover handling Cool NA Home use NA Home usage NA NA
k) Frequency of discarding milk
DK NA Never NA NA 50 litre per week
DK
l) Reason for discarding milk
Smell, alcohol test NA Smell, density, alcohol test
NA NA Not possible to keep
Spoiled

(7/11)
m) Mixing of milk batches
No No No No No No No
n) Adulteration No No No No No No No
Quality control
a) Any checks Yes Yes Yes Yes Yes Yes Yes
b) Parameters Density, alcohol test, smell
Density, alcohol test Smell, density, alcohol test
Density, alcohol test, smell
Smell, appearance Density, alcohol test, smell, taste
Alcohol test
c) Handling of deviations
NA NA Reject Reject, talk to farmer
Reject Reject NA
d) Safety measures
NA NA Brookside control same farmers
Test if customer complain
Checked by formal market agents
NA NA
e) Milk rejection Yes No Yes Yes Yes Yes NA
f) Reasons for rejection
Boiling problems NA Boiling problem Smell, boiling problem
Boiling problem NA NA
Experience & Education
a) Years of experience
0,5 7 10 4 10 15 7
b) Education Certificate No Seminars 4/y, KDB
Certificate. Seminars 2/y, KDB
Seminars 4/y, KDB Seminars 3/y, KDB No
Documentation
a) Traceability No yes Yes Yes Yes Yes Yes

(8/11) Interview answers, Shops
Milk Shop/milk Bar
Githunguri Mangu Gatundu
Shop1 Shop2 Shop1 Shop2 Shop3 Shop1 Shop2 Shop3 Shop4 Shop5 Shop6
Handling and Storage
a) Capacity (litre)
120 55 23 80 18 10 50 80 150 250 250
b) Delivery (times per day)
2 1 2 3 2 2 2 2 1 2 1
c) Maximum holding period
7 13 7 7 14 13 14 39 24 11 27
d) Buying Price/litre
35 40 39 35 40 43 NA 35 34 40 30
e) Selling price/litre
45 45 50 50 50 50 50 50 50 48 50
f) Hygiene of personnel
NA NA Keep clean around the milk
Medical certificate
Keep clean around the milk
NA NA NA Medical certificate
NA NA
g) Equipment cleanliness
Hot water and soap
Hot water and soap
Hot water, soap, dry
Hot water and soap
Hot water and soap
Hot water, soap, sand
Hot water and soap
Hot water
Hot water and soap
Cold water and soap
Hot water and soap
h) Equipment Plastic bucket
Plastic bucket
Jerry can Plastic bucket
Plastic bucket Jerry can Jerry can Plastic bucket
Plastic bucket
Plastic bucket
Plastic bucket

(9/11)
i) Preservation
Cooling Cooling for 3 hours, boil milk for instant use
Boil milk delivered 13.00 (5 lit.)
Boil all milk
Cooling No No Cooling Cooling Cool morning milk
Cooling. Boil milk next morning. Boil when suffering from power cuts.
j) Handling leftovers
Boil in the morning to make sour milk
Boil in the evening to make sour milk, sell
NA NA Cooling Boil Boil Boil Boil, make yogurt and sour milk
NA Boil. Sometimes sour milk
k) Frequency of discarding milk
NA During hot season, 1,5 lit./month
NA 3L/week NA Never Never 10L/week Never DK 50L/week
l) Reasons for discarding
NA Smell, abnormal alcohol test
NA Can't boil NA NA NA Spoiled smell, taste, boil to see
NA Spoiled. Smell, boil
Smell bad. Boil.
m) Mixing of milk batches
No No No No No No No No No No No
n) Adulteration
No No No No No No No No No No No

(10/11)
Quality control
a) Any checks
Yes Yes Yes Yes Yes Yes Yes Yes Yes Yes Yes
b) Parameters
Alcohol test, smell
Smell, alcohol test
Smell, test boil
Density, alcohol test, smell, test boil
Test boil in the morning
Smell Density, test boil, smell, taste
Density, smell, test boil
Alcohol test, density, test boil
Smell, test boil
Density, smell, test boil.
c) Deviations NA Talk to agent
Return to agent
Return to agent
Return to agent
Return to agent
Return to agent. Next time taste before sale
Return to agent, split the cost with agent.
Return milk to agent. Tell the customer to clean utensils
NA Follow up problem with farmer
d) Safety measures
NA NA NA (DK) Boiling all milk
Cooling, transparent handling
No Self‐use Receiving customer complaints
NA NA NA
e) Milk rejection
No Yes Yes No Yes Yes Yes Yes Yes Yes Yes
f) Reasons for rejection
NA Boiling problem
Boiling problem
NA Boiling problem, abnormal taste
Boiling problem
Boiling problem
Boiling problem
Boiling problem
Boiling problem
Boiling problem

(11/11)
Experience & Education
a) Years of experience
1 1 0,5 0,5 1,5 2 7 1 15 16 8
b) Education No Hygiene course, collage
No Seminars 2 times, KDB
No No Seminars,4 times, KDB
1 seminar in milk production
Education from vet. father.
No Seminars 3/y, KDB
Documentation
a) Traceability No No Yes Yes Sometimes, depends on agent
Sometimes Yes Only group of farmers
Yes No No

(1/1) Appendix 3 Density of milk samples along the value chain
Density (g/ml) Githunguri Mangu Gatundu
Farmers
Farmer 1a 1.032 1.029 1.026
Farmer 1b 1.030 1.029 1.031
Farmer 2a 1.029 1.028 1.021
Farmer 2b 1.028 1.028 1.021
Farmer 3a 1.020 1.028 1.031
Farmer 3b 1.021 1.020 1.030
Small‐scale agents
S.Agent 1 1.026 1.028 1.029
S.Agent 2 1.020 1.026 1.028
S.Agent 3 1.026 1.030
S.Agent 4 1.031 1.028
Large‐scale agents
L.Agent 1 1.029 1.026 1.029
L.Agent 2 1.029 1.028 1.030
L.Agent 3 1.028
Milk Shops
Shop 1 1.028 1.029 1.019
Shop 2 1.029 1.028 1.029
Shop 3 1.027 1.027
Shop 4 1.032
Shop 5 1.028
Shop 6 1.029

(1/1)
Appendix 4 Microbial Analysis Area of origin
Cfu/mL Githunguri Mangu Gatundu
S. aureus E. coli TPC S. aureus E. coli TPC S. aureus E. coli TPC Farmers Farmer 1a 1.0x10⁵ Nil 2.0x10⁵ 3.8x10² 1.6x10⁵ 3.6x10⁵ 1.2x10⁴ 7.0x10³ 6.9x10⁴
Farmer 1b 1.0x10³ 1.0x101 3.6x10³ 5.0x10² 1.0x10⁵ 5.0x10⁵ 3.5x10⁴ 4.0x10³ 3.7x10⁵
Farmer 2a 7.0x10² 2.1x10³ 1.1x10⁴ 7.0x10² 2.6x10² 3.0x10³ 2.9x10³ 9.0x10³ 9.0x10⁵
Farmer 2b 8.0x10³ 3.0x10² 8.0x10⁴ 2.4x10⁴ 3.4x10³ 9.2x10⁴ 1.3x10³ 1.5x10² 8.0x10³
Farmer 3a 7.0x10³ 6.0x10⁴ 2.2x10⁴ Nil 1.9x10² 9.5x10⁴ 5.0x10² 4.0x10³ 1.3x10⁵
Farmer 3b 6.6x10⁴ 5.0x10⁴ 2.2x10⁶ 4.7x10³ 3.6x10³ 3.0x10⁴ 2.2x10⁴ Nil 3.5x10⁴
Small‐scale agents S.Agent 1 1.5x10⁵ 8.6x10⁵ 4.0x10⁶ 9.0x10⁴ 2.6x10⁵ 1.7x10⁶ 4.1x10⁵ 6.4x10⁶ 1.5x10⁷
S.Agent 2 5.5x10³ 2.5x10³ 2.4x10⁶ 1.2x10⁶ 4.4x10⁴ 3.3x10⁶ 6.2x10⁵ 4.3x10⁴ 1.7x10⁶
S.Agent 3 2.1x10⁵ 2.5x10⁵ 2.6x10⁶ 1.5x10⁴ 1.6x10⁵ 6.6x10⁶
S.Agent 4 4.5x10⁴ 4.7x10⁴ 6.6x10⁵ 2.1x10⁵ 1.0x10⁶ 6.4x10⁶
Large‐scale agents L.Agent 1 Nil 1.0x10³ 5.4x10³ 3.1x10⁴ 6.4x10⁶ 2.1x10⁷ 1.6x10⁶ 6.6x10⁵ 5.7x10⁶
L.Agent 2 3.0x10⁴ 4.2x10³ 1.1x10⁶ 1.2x10⁶ 7.4x10⁵ 7.5x10⁶ 2.5x10⁴ 9.0x10³ 9.7x10⁵
L.Agent 3 1.1x10⁵ 1.8x10⁵ 9.6x10⁵ Milk Shops Shop 1 1.4x10⁵ 1.2x10⁶ 1.3x10⁷ Nil Nil Nil 3.0x10² 1.7x10⁴ 4.0x10⁵
Shop 2 2.7x10⁴ 7.7x10⁴ 9.5x10⁵ 1.1x10⁴ Nil 2.0x10⁴ 1.3x10⁵ 2.7x10⁵ 3.9x10⁶
Shop 3 1.4x10⁵ 3.1x10⁵ 4.6x10⁶ 6.7x10⁵ 1.5x10⁶ 1.0x10⁶
Shop 4 1.0x10³ 1.8x10⁴ 4.9x10⁵
Shop 5 4.1x10⁵ 3.8x10⁶ 1.1x10⁷
Shop 6 4.0x10⁶ 1.0x10⁶ 5.6x10⁶
Related Documents