QUALITATIVE EVALUATION OF CFRP-CONCRETE BOND USING NON- DESTRUCTIVE AND DESTRUCTIVE TESTING METHODS by ANKITA LAD Presented to the Faculty of the Graduate School of The University of Texas at Arlington in Partial Fulfillment of the Requirements for the degree of MASTER OF SCIENCE IN STRUCTURES AND APPLIED MECHANICS THE UNIVERSITY OF TEXAS AT ARLINGTON May 2018

Welcome message from author
This document is posted to help you gain knowledge. Please leave a comment to let me know what you think about it! Share it to your friends and learn new things together.
Transcript

QUALITATIVE EVALUATION OF CFRP-CONCRETE BOND USING NON-
DESTRUCTIVE AND DESTRUCTIVE TESTING METHODS
by
ANKITA LAD
Presented to the Faculty of the Graduate School of
The University of Texas at Arlington in Partial Fulfillment
of the Requirements
for the degree of
MASTER OF SCIENCE IN STRUCTURES AND APPLIED MECHANICS
THE UNIVERSITY OF TEXAS AT ARLINGTON
May 2018

Copyright © by Ankita Lad 2018
All Rights Reserved

Acknowledgements
I am thankful to Dr. Nur Yazdani, the chairperson of my committee. He has
taught me more than I could ever give him credit for here. This work would not have
been possible without his advice, guidance and immense support during my
graduate studies at University of Texas at Arlington. I have deep gratitude towards
Dr. Eyosias Beneberu and Dr. Mina Riad for their knowledgeable advice and
assistance throughout this research. My sincere regards to the committee members,
Dr. Shih-Ho Chao and Dr. Raad Azzawi for their precious time.
I am thankful to my father who has been a constant inspiration
in my life and my mother for her support and encouragement.
I am indebted to all those who helped me knowingly and unknowingly to
bring this research to the present form.
April 25, 2018

Abstract
QUALITATIVE EVALUATION OF CFRP-CONCRETE BOND USING NON-
DESTRUCTIVE AND DESCTRUCTIVE TESTING METHODS
Ankita Lad, MS
The University of Texas at Arlington, 2018
Supervising Professor: Nur Yazdani
CFRP (Carbon Fiber Reinforced Polymer) laminates have been used as externally bonded
reinforcements for retrofitting and structural strengthening of concrete structures. The
adequacy of the CFRP bonding highly depends on the bond integrity between the concrete
and CFRP laminates. Considering the reliability of this bonding technique, premature
debonding of laminates from the concrete substrate is a major concern. The bond
performance may be influenced directly by various parameters; some of the parameters
like surface wetness, surface preparation, presence of voids in concrete substrate and
overhead vs on the top installation of CFRP laminate have been discussed in this study.
During the installation of the composite system, the bond can be comprised due to poor
workmanship or unsuitable environmental conditions; improper cure or installation or
surface preparation can cause voids, inclusions, debonds and delamination at the CFRP-
substrate level.
In this study, assessment of the CFRP-concrete bond for beams strengthened in flexure
was carried out. Non-Destructive evaluation methods using Ground Penetrating RADAR,
Ultrasound Tomography, Thermography and Schmidt hammer were applied to detect
possible disbonds between CFRP-Concrete interfaces. Ground Penetration RADAR was
effective in finding the sub-surface defects that affect the bond quality, infrared
thermography and ultrasound tomography could detect both surface and subsurface

delamination. Further, destructive techniques were executed to determine the type of
failure in the CFRP retrofitted beams to correlate it with the quality of the bond. This study
may serve as a valuable reference for optimization and inspection of CFRP-Concrete bond
at the interface, using Non-destructive testing devices for practical applications.

Table of Contents
Acknowledgements ............................................................................................................. 3
Abstract ............................................................................................................................... 4
LIST OF FIGURES .............................................................................................................. 9
LIST OF TABLES .............................................................................................................. 13
Chapter 1 .......................................................................................................................... 14
INTRODUCTION ............................................................................................................... 14
1.1 Background and Research Scope .............................................................................. 14
1.2 Research Objectives ................................................................................................... 15
LITERATURE REVIEW..................................................................................................... 16
2.1 Introduction ................................................................................................................. 16
2.2 Non-Destructive Testing ............................................................................................. 16
2.2.1 Infrared Thermography .................................................................................... 17
2.2.2 Ultrasonic Tomography .................................................................................... 18
2.2.3 Radiographic Imaging ...................................................................................... 19
2.2.4 Rebound Hammer ............................................................................................ 20
2.2.5 Inspection, Evaluation and Acceptance ........................................................... 20
Chapter 3 .......................................................................................................................... 21
MATERIAL AND SAMPLE PREPARATION ..................................................................... 21
3.1 Specimen preparation and description ....................................................................... 21
3.2 Parameter Description ................................................................................................ 23
3.2 Carbon Fiber Reinforced Polymer .............................................................................. 28
3.3 Epoxy .......................................................................................................................... 29
3.4 Linear variable differential transformers (LVDT) ......................................................... 30
Chapter 4 .......................................................................................................................... 32

NON-DESTRUCTIVE EVALUATION AND DISCUSSIONS ............................................. 32
4.1 Ground Penetrating RADAR ....................................................................................... 32
4.1.1 Introduction ...................................................................................................... 32
4.1.2 Evaluation ........................................................................................................ 35
4.1.3 Discussions ...................................................................................................... 38
4.2 Infrared Thermography ............................................................................................... 46
4.2.1 Introduction ...................................................................................................... 47
4.2.2 Evaluation ........................................................................................................ 48
4.2.3 Discussions ...................................................................................................... 49
4.3 Ultrasonic Multichannel Pulse Echo Technology .................................................... 58
4.3.1 Introduction ...................................................................................................... 58
4.3.2 Evaluation ........................................................................................................ 59
Chapter 5 .......................................................................................................................... 70
DESTRUCTIVE TESTS, EVALUATION AND RESULTS ................................................. 70
5.1 Schmidt Rebound Hammer ......................................................................................... 70
5.1.1 Introduction .............................................................................................................. 70
5.1.2 Evaluation ................................................................................................................ 70
5.3.2 Discussions .............................................................................................................. 71
5.2 ASTM Pull off Adhesion Test ...................................................................................... 73
5.2.1 Evaluation ........................................................................................................ 73
5.2.2 Discussions ...................................................................................................... 75
5.3 In-Place Compressive strength ................................................................................... 79
5.4.1 Experimental setup .......................................................................................... 80
5.6.2 Evaluation and Results .................................................................................... 81
5.6.3 Discussions ...................................................................................................... 89
Chapter 6 .......................................................................................................................... 92

CONCLUSIONS AND RECOMMENDATIONS................................................................. 92
6.1 Conclusion .................................................................................................................. 92
6.2 Recommendations ...................................................................................................... 93
References: ....................................................................................................................... 94
Biographical Information ................................................................................................... 98

LIST OF FIGURES
Figure 1 Beam Specimen.................................................................................................. 22
Figure 2 Casting of the beams using ply formwork ........................................................... 22
Figure 3 Application of Epoxy ........................................................................................... 22
Figure 4 Application of CFRP laminate ............................................................................. 23
Figure 5 Artificial voids in Beam 3 ..................................................................................... 24
Figure 6 Artificial voids in Beam 4 ..................................................................................... 25
Figure 7 Artificial voids in Beam 5 ..................................................................................... 25
Figure 8 Artificial voids in Beam 6 ..................................................................................... 25
Figure 9 Foam cubes used to form voids .......................................................................... 26
Figure 10 Overhead application of CFRP ......................................................................... 26
Figure 11 Sand Blasting of Beams ................................................................................... 27
Figure 12 SikaWrap Hex 117C CFRP Laminate .............................................................. 28
Figure 13 Concrete CFRP Laminate Bond ....................................................................... 28
Figure 14 LVDT ................................................................................................................. 31
Figure 15 GPR Test Demonstration .................................................................................. 32
Figure 16 GSSI SIR 30 unit .............................................................................................. 33
Figure 17 Antenna Polarization (GSSI Concrete Handbook,2015) .................................. 34
Figure 18 Configuration of A-Scan (Scheers, Bart. 2001) ................................................ 34
Figure 19 Formation of B-Scan ......................................................................................... 35
Figure 20 B-Scan on Grey scale ....................................................................................... 35
Figure 21 Top view of the sample beam ........................................................................... 36
Figure 22 GPR Scanning Setup ........................................................................................ 36
Figure 23 GPR Scan over a sample beam using a concrete additional layer .................. 37
Figure 24 B-Scan of the side of the sample beam ............................................................ 37

Figure 25 Grey Scale radargram Beam 1 ......................................................................... 39
Figure 26 Gray scale scan for Beam 3, Void size 10mmx10mm ...................................... 39
Figure 27 Filtered scan for Beam 3, Void size 10mmx10mm ........................................... 40
Figure 28 Grey scale scan for beam 4 .............................................................................. 41
Figure 29 Filtered Scan for Beam 4, Void size 20mmx20mm (0.8''x0.8'') ........................ 41
Figure 30 Gray scale scan for Beam 5 ............................................................................. 42
Figure 31 Filtered scan for Beam 5, Void size 20mmx20mm (0.8''x0.8'') ......................... 42
Figure 32 Gray scale scan for Beam 6, Void size 40mmx40mm (1.6''x1.6'') .................... 43
Figure 33 Filtered scan for Beam 6, Void size 40mmx40mm (1.6''x1.6'') ......................... 43
Figure 34 Gray scale scan for Beam 7 ............................................................................. 44
Figure 35 Gray scale scan for Beam 9 ............................................................................. 45
Figure 36 Gray scale scan for Beam 11 ........................................................................... 45
Figure 37 FLIR E 60 Infrared Camera (FLIR Manual 2008) ............................................. 47
Figure 38 Test Setup using IR Camera ............................................................................ 48
Figure 39 Heating the beam using bulb ............................................................................ 48
Figure 40 Capturing mage after heating the beam ........................................................... 49
Figure 41 Thermograph Beam 1 ....................................................................................... 49
Figure 42 Thermograph Beam 2 ....................................................................................... 50
Figure 43 Thermograph Beam 3 ....................................................................................... 50
Figure 44 Thermograph Beam 4 ....................................................................................... 51
Figure 45 Thermograph Beam 5 ....................................................................................... 51
Figure 46 Thermograph Beam 6 ....................................................................................... 52
Figure 47 Thermograph Beam 7 ....................................................................................... 53
Figure 48 Thermograph Beam 8 ....................................................................................... 53
Figure 49 Thermograph Beam 9 ....................................................................................... 54

Figure 50 Thermograph Beam 10 ..................................................................................... 54
Figure 51 Thermograph Beam 11 ..................................................................................... 55
Figure 52 Proposed test using IR, Acceptance criteria & recommended repair as per ACI
440.2R (2017) ............................................................................................................ 57
Figure 53 Pundit 250 Array ............................................................................................... 58
Figure 54 Ultrasonic Scanning Setup ............................................................................... 59
Figure 55 Ultrasonic B-Scan ............................................................................................. 59
Figure 56 Location of the scans on the beam ................................................................... 60
Figure 57 Beam 1 Ultrasonic Tomography ....................................................................... 61
Figure 58 Beam 2 Ultrasonic Tomography ....................................................................... 62
Figure 59 Beam 3 Ultrasonic Tomography ....................................................................... 63
Figure 60 Beam 4 Ultrasonic Tomography ....................................................................... 63
Figure 61 Beam 5 Ultrasonic Tomography ....................................................................... 64
Figure 62 B-Scan of Beam 6 Ultrasonic Tomography ...................................................... 64
Figure 63 Beam 7 Ultrasonic Tomography ....................................................................... 65
Figure 64 Beam 8 Ultrasonic Tomography ....................................................................... 66
Figure 65 Beam 9 Ultrasonic Tomography ....................................................................... 67
Figure 66 Beam 10 Ultrasonic Tomography ..................................................................... 67
Figure 67 Beam 11 Ultrasonic Tomography ..................................................................... 68
Figure 68 Ultrasonic Tomography, Amplitude Vs Time .................................................... 69
Figure 69 Silver Schmidt Hammer (Proceq Operating Manual, 2017) ............................. 70
Figure 70 Schmidt Hammer test ....................................................................................... 71
Figure 71 Rebound Values ............................................................................................... 72
Figure 72 Pull off Test Mechanism ................................................................................... 74
Figure 73 Location of the fixture at A and B points ........................................................... 74

Figure 74 Scoring through the coating .............................................................................. 75
Figure 75 Fixtures attached to the beam samples for pull off test .................................... 75
Figure 76 Pull off adhesion tester ..................................................................................... 76
Figure 77 Modes of Failure (ASTM D7522/D7522M, Standard Test Method for Pull-Off
Strength for CFRP Laminate Systems Bonded to Concrete Substrate, © 2009) ...... 76
Figure 78 Beam 2, ASTM Pull off test Mode G ................................................................. 77
Figure 79 Beam 9, ASTM Pull off test Mode F ................................................................. 78
Figure 80 Beam 11, ASTM Pull off test Mode F ............................................................... 78
Figure 81 Beam 8, ASTM Pull off test Mode C ................................................................. 78
Figure 82 Laboratory test to determine the crushing strength .......................................... 79
Figure 83 Demonstration of Three-point bending test setup ............................................ 80
Figure 84 Sample beam, Test setup ................................................................................. 81
Figure 85 Failure modes of CFRP-Plated beams (Teng J., Chen J., 2007) ..................... 82
Figure 86 Intermediate crack induced interfacial debonding ............................................ 83
Figure 87 Intermediate crack induced interfacial debonding ............................................ 84
Figure 88 CFRP Debonding .............................................................................................. 85
Figure 89 Results from Silver Schmidt Hammer ............................................................... 86
Figure 90 Load vs Displacement Graph for Beam samples ............................................. 87
Figure 91 Load vs Displacement Graph for Beam sample ............................................... 88

LIST OF TABLES
Table 1 Concrete Mix Proportion ...................................................................................... 21
Table 2 Parameters in consideration ................................................................................ 23
Table 3 Sika Standards for SikaWrap 117C ..................................................................... 29
Table 4 Sika manufacturer Standards for Sikadur Hex 300 (www.Sikaconstruction.com)
................................................................................................................................... 29
Table 5 Sika manufacturer Standards for Sikadur 31 (www.Sikaconstruction.com) ........ 30
Table 6 Area Calculations for beams with artificial voids .................................................. 55
Table 7 Area calculations for beams ................................................................................. 56
Table 8 Pull off Adhesion Tensile Strength ....................................................................... 77
Table 9 In-place compressive strength ............................................................................. 79
Table 10 Results of Three-point bending test ................................................................... 83

Chapter 1
INTRODUCTION
1.1 Background and Research Scope
Over the years Carbon Fiber Reinforced Polymer (CFRP) has been used as a
strengthening and repair mechanism for deteriorated concrete structures. Now, it is used
for regular commercial projects by many countries. Studies show that the use of externally
applied CFRP material improves the load carrying capacity, tensile strength, stiffness or
ductility and fatigue behavior of the structure (Teng 2001). CFRP is corrosion resistant,
lightweight and economic compared to traditional strengthening methods (Zhao and Ansari
2004). The efficacy of the CFRP highly depends on the bond integrity between the CFRP
sheets and concrete. Previous research work was done to analyze the effect of interface
bond on the performance of concrete structures. But, there is currently no research work
done to evaluate the integrity or association of CFRP-Concrete bond. Teng (2001) states
that one of the most important failure mode to be considered in CFRP retrofitted structures
is the delamination of CFRP sheets from the concrete surface. Delamination of the bond
between the two could be caused by various factors. Concrete surface preparation is one
of the critical parameter that affect the performance of CFRP strengthened structures. The
surface needs to be roughened to CSP3 profile as stated in ACI 440 (2008) to prevent
adhesion failures. In addition, the concrete surface must be sound, clean, free from surface
defects and dry before the application of CFRP. Wet concrete surface due to rains or water
leakage might result in weak bonding or formation of bubbles, evaporation of this water by
heat may trigger localized debonding. Previous research suggests that the bond
performance in the presence of water degrades with the time of exposure. During
strengthening of bridge girders, the CFRP is normally applied overhead. However, most of

the study conducted on small laboratory specimens involved applying the CFRP from the
top. The overhead application may result in inadequate bonding because of the gravity
effect. The type of epoxy and the number of layers that were used as an adhesive during
the application of CFRP would affect the bond positively or negatively, depending on the
application. The type of CFRP can affect the bond association as every CFRP type has
different thickness and tensile strength.
CFRP being opaque does not allow for visual inspection. The CFRP-Concrete Bond
can be compromised during initial application due to poor workmanship, and/or adverse
environmental conditions. Thus, the bond between the two needs to be examined to ensure
a satisfactory performance of the strengthening scheme. The current study has employed
Non-Destructive and Destructive Evaluation that must be carried out to assess the bond
between the CFRP and concrete substrate.
1.2 Research Objectives
The objective of this research was to evaluate the effect of surface wetness, concrete
surface preparation, overhead versus from the top application of CFRP and presence of
voids on the CFRP-Concrete Bond Strength. The subsequent tasks were carried out to
achieve the goal.
1. Selection of appropriate NDE Methods for Evaluation
2. Selection of appropriate CFRP and Epoxy for the beam strengthening
3. Preparation of samples for each parameter and control group
4. Perform the Non-Destructive and Destructive Methods to assess the bond
5. Compare the performance of the sample beams with control beams,
based on all the experimental data

Chapter 2
LITERATURE REVIEW
2.1 Introduction
Carbon Fiber Reinforced Polymer (CFRP) is used to strengthen the concrete structures.
Numerous experimental and analytical studies show that the performance of the structure
is improved after the retrofitting. The adequacy of the externally bonded CFRP
strengthening mechanism depends on the Concrete CFRP bond association. Defects in
the composite may be due to improper design, fabrication and/or application. In this study,
we will focus on detecting the flaws during the application of CFRP. For the optimum benefit
of use of the technique, a CFRP laminate perfectly bonded to the surface without any
disbonds or air blisters is desired. But, during the installation process at the job site several
reasons can cause bond loss. The bond between the two must be examined in order to
ensure satisfactory performance of the CFRP strengthened structure. Here are the few
valuable researches in the field of Non-destructive testing, that have been carried out to
evaluate the bond between the two.
2.2 Non-Destructive Testing
Non-destructive Testing Methods can be applied to both new and old structures. These
techniques are used for quality control or clarification of uncertainties about the quality of
material or the structural integrity of materials. Sen (2015) stated that the NDT method
selected needs to be able to detect a minimum delamination size. Guidelines on this size
are provided in the ACI Guide Specifications (ACI 440.2R-17). The guidelines mention that
for wet a lay-up installation, defects less than 1300 mm2 are acceptable if the delaminated
area is less than 5% and there are no more than 10 such defects per m2. Delamination
exceeding 16,000 mm2 must be repaired by selective cutting and applying an overlapping

sheet patch. If the delamination area falls between these limits, epoxy injection repairs are
permissible. Previous researchers have used many different techniques to detect the
defects in the bonds. Ekenel and Myers (2011) used thermography, ultrasonic C-scan,
acousto-ultrasonic, impact-echo, microwave, ground penetrating radar, eddy current and
laser shearography to detect the delaminations in the Concrete CFRP bond. For the test,
three RC beams were cast and pre-cracked before applying the CFRP laminates. Artificial
delaminations were made when the epoxy was freshly applied, and the beams were
scanned to detect and image the delaminations. These beams were tested and were found
to have 9% less flexural strength and 6% more deflection than the beams without
delamination. They successfully detected the location and dimension of the defects using
microwave, ultrasonic acousto-ultrasonic and impact echo techniques. Microwave NDE
showed the most promising results by detecting delaminations as small as 100 mm2. For
this study, we have used the following three NDE techniques for the inspection.
2.2.1 Infrared Thermography
Infrared thermographic inspection is a non-contact, full field, fast, accurate and reliable
NDE procedure. It is based on the principle that subsurface anomalies in a material result
in localised temperature difference, due to the thermal insulation of defects. Thermography
senses the emission of thermal radiation from the material surface over time and gives us
the rate of cooling for the material. Taillade et al. (2012) used thermography for the bridge
inspection and CFRP installation located near Besancon in France. A simple setup using
uncooled infrared camera coupled with a hand held thermal excitation device (lamp or an
electric cover) was used. The study found wrapping and gluing defects during the
installation which resulted in debonding. Valluzzi et al. (2009) tried to reveal the artificial
defects created at the concrete-CFRP interface. The experiment was capable to locate the
detachment area and calculate a rough estimate of the defects size on the underside

between Reinforced Concrete (RC) and CFRP. Results obtained on the beams confirmed
that thermography is particularly effective in identifying actual or potential weak or missing
bond areas, mainly construction or execution defects or imperfections. Mabry et al. (2015)
demonstrated the internal defects in multi-layered externally bonded CFRP strengthened
concrete using Pulse Phase Thermography. The use of PPT allows the determination of
the layer at which a defect is present, which further complements the size and location
information. A calibration approach was developed for this application that accurately
located the depth of defects. Infrared thermography has been used to monitor CFRP
strengthened reinforced concrete bridge columns (Jackson et al., 2000), bridge decks
(Halabe et al., 2007), and reinforced concrete beams (Shih et al., 2003). In this study,
infrared thermography was used to trace the disbonds formed due to the parameters in the
CFRP-concrete bond. The method was adequate in determining both surface and sub-
surface flaws remotely.
2.2.2 Ultrasonic Tomography
Ultrasonic tomography is a very effective technique that uses sound waves generated by
transducers travelling through the material to detect the flaws. Analysis of the signals by
the receiving transducer provides information about the media through which the signal
has propagated. Experimental studies were conducted using guided ultrasonic waves for
the damage detection on composite laminates (Su et al., 2006; Lestari and Qiao, 2005;
Kessler et al., 2002; Alleyne and Cawley, 1992). Ribolla et al. (2016) used ultrasonic testing
to assess the quality of bond involving automatic determination of the onset of the signal
which is performed by means of the Akaike Information Criterion along with Finite Element
Analysis. Continuous Ultrasonic Pulse velocity monitoring CFRP-Encased Concrete was
done to carry out damage assessment by Mirmiran et. al. (2001). Ultrasonic pulse velocity

for the assessment of concrete properties by using travel time of longitudinal waves over
a known distance. In this study, the Ultrasonic multi-channel pulse echo technology using
8 channels was used. One channel transmits, and the other seven channels receive the
echoes. Each channel is placed roughly at 1.2 inches (3cm) and transmits in turn. A
complete measurement consists of 28 A-scans. These are used to compute and display a
B-scan in real-time using the Synthetic Aperture Focusing Technique (SAFT). The wave
type generated by the device Pundit PL is a shear wave horizontally polarized.
2.2.3 Radiographic Imaging
A very useful method that can be used to assess internal damage in structures. The
geophysical method works on the generation of pulses from the radar to obtain information
of the scanned surface. It is practiced in engineering and environment surveys. Ground
Penetrating RADAR can be used to collect information about different media, like soil, rock,
structures water and pavements. Details about the micro cracks, delamination, voids, rebar
corrosion, rebar size and depth can be found. Chen and Wimsatt (2010) used 400 MHz
ground-coupled penetrating radar to evaluate the subsurface conditions of roadway
pavements. Yu and Büyüköztürk (2008) studied the debonding detection of Glass Fiber
Reinforced Polymer (GFRP) retrofitted concrete structures using far-field airborne radar
technique, integrating inverse synthetic aperture radar measurements and back projection
algorithm for the condition assessment. Experiment was done to detect the rebar in
GCFRP retrofitted cylinders was done using 8-12 Ghz frequency range.
2.2.4 Rebound Hammer
Schmidt Rebound Hammer is a commonly used NDE technique used for structural health
monitoring. It can determine the hardness and strength of concrete. It can be used over
CFRP, but it is a partially non-destructive technique when used over CFRP, as it damages
the fibers of the polymer. Sanchez and Tarranza (2014) compared the results from rebound
hammer test to the actual compressive strength of concrete. The results from Schmidt
hammer test underestimate the actual compressive strength, thus it cannot be used as a
substitute for the compression test, but it is a reliable device that can be used to assess
the condition of structure.
2.2.5 Inspection, Evaluation and Acceptance
The ACI 440.2R (2017) design guidelines acknowledge the importance of Quality Control
and Quality assurance program. Certain guidelines have been developed for CFRP
manufacturers and installing contractors to ensure the efficacy of the strengthening
technique.
There are no specific guidelines about an ambient temperature during the application,
effect of water (rain) after the application of epoxy (adhesive) and the effect of upward
application of CFRP laminate (bridge girders, slabs, decks) vs the downward application
that is usually employed at the laboratory. It is important to determine the effect of upward
application as the CFRP laminates are mainly applied on the tension side, which would be
at the bottom if loaded on top. In this study, non-destructive evaluation was done to detect
the flaws/defects that could be present in the concrete subsurface or in the concrete-CFRP
bond due to poor installation of the CFRP laminate. In addition, destructive analysis was
done to learn how these parameters affect the strength of CFRP retrofitted structures.

Chapter 3
MATERIAL AND SAMPLE PREPARATION
3.1 Specimen preparation and description
A total of 11 beams with dimensions 92 cm x 20 cm x 20 cm (8’’×8’’×36’’) were casted
using plywood forms. A cardboard of dimension 10 cm x 20 cm (4’’×8’’) was inserted in
each fresh concrete sample to form a notch in the mid-span to ensure a failure in the mid-
span during the bending test. For the casting of beams, ready-mix concrete was used to
make sure that all beams have the same properties. The samples were cured for 28 days
by spraying water to achieve a target 28-day compressive strength of 3 Ksi (20.7 MPa).
The CFRP laminate was applied at an ambient temperature of 60 °F (16 °C) in the absence
of direct light to prevent any undesirable problems with the epoxy. The temperature was
cooled down to prevent the phenomena of outgassing of the concrete, which could
increase the voids under the CFRP.
Table 1 Concrete Mix Proportion
Material kg/m3
Cement 394
Water 186
Coarse aggregate (crushed stone with
maximum aggregate size 19 mm) 987
Fine aggregate (sand) 669

Figure 1 Beam Specimen
Figure 2 Casting of the beams using ply formwork
Figure 3 Application of Epoxy

Figure 4 Application of CFRP laminate
3.2 Parameter Description
With four parameters in consideration, the primary purpose of the experiment is to detect
each parameter using Non-destructive techniques. Two samples for every parameter and
two beams with no parameters, serving as standard or control samples were casted. The
type of CFRP used for the experiment was SIkaWrap 117C and the epoxy used was
Sikadur 300 and Sikdur 31. The surface roughness of CSP3 profile was achieved by sand
blasting the surface of beams before the application of CFRP.
Table 2 Parameters in consideration
Sample Epoxy thickness Parameter
1 Sikadur 300 Control
2 Sikadur 300 Control
3 SIkadur 300 Artificial void size 4 no.10x10 mm2 (0.4.x0.4) inch2
4 Sikadur 300 Artificial void size 4 no 20x20 mm2 (0.8.x0.8) inch2
5 Sikadur 300 Artificial void size 2 no 20x20 mm2 (0.8.x0.8) inch2
6 Sikadur 300 Artificial void size 2 no 40x40 mm2 (1.6.x1.6) inch2
7 Sikadur 300 Surface Wetness

8 Sikadur 300 Surface Wetness
9 Sikadur 300 +
Sikadur 31
Overhead application
10 Sikadur 300 +
Sikadur 31
Overhead application
11 Sikadur 300 No surface preparation
The parameters are described as below.
1. Artificial Voids
To investigate the effect of voids under the CFRP, some predetermined voids were placed
at the surface of the concrete using foam cubes with the exact dimensions of the required
voids. The voids dimensions were selected to represent a decrease in bond area. The
allowable void size according to ACI 440.2R -17 is less than 2in2 each. The void sizes are
chosen in a way that the allowable void area is both spread out and concentrated at one
spot. The efficacy of NDE techniques to find the voids of different sizes and their effect on
the quality of bond is discussed further.
Figure 5 Artificial voids in Beam 3

Figure 6 Artificial voids in Beam 4
Figure 7 Artificial voids in Beam 5
Figure 8 Artificial voids in Beam 6

Figure 9 Foam cubes used to form voids
2. Overhead application of CFRP
For the examination of the effect of surface application on the concrete CFRP bond,
overhead application of CFRP was done on the beams. It induces an effect similar to CFRP
retrofit on existing structures like bridge girders or bent caps. The overhead application of
the CFRP using Sikadur 300 epoxy resulted inadequate bonding. Excessive epoxy pockets
were formed due to the effect of gravity and resulted in formation of bubbles. The CFRP
laminate was then scrapped off the surface and a new laminate was applied using Sikadur
300 and Sikadur 31 Epoxy. The bond was observed to be much better in the latter case
during visual inspection. The combination of two epoxies made the bond much stronger
and eliminated the epoxy bubbles by a considerable amount.
Figure 10 Overhead application of CFRP

3. Surface Wetness
To detect the effect of surface wetness on the CFRP to stimulate the effect of rains, water
was applied on the surface of concrete. The epoxy was then applied on the wet concrete
surface for the application CFRP laminate. Wet concrete surface due to rains or water
leakage might result in weak bonding or formation of bubbles, evaporation of this water by
heat may trigger localized debonding.
4. Concrete Surface Preparation
Concrete surface preparation is one of the critical parameters that affect the performance
of CFRP strengthened structures. As stated in ACI 440 (2008), the surface needs to be
roughened to CSP3 profile to prevent adhesion failures. In addition, the concrete surface
must be sound, clean, free from surface defects and dry before the application of CFRP.
For the experiment, CSP3 surface profile was achieved by sand blasting and some dirt
was planted on the dry surface before the application of CFRP to analyze the effect of dirt
and unclean profile on the bond. This was done to consider cases were sand blasting is
done days or hours prior to CFRP application or poor workmanship. The unclean concrete
surface profile may lead to imperfect bonding.
Figure 11 Sand Blasting of Beams

3.2 Carbon Fiber Reinforced Polymer
The Carbon Fiber Reinforced Polymer is a strong and light fiber reinforced plastic
containing carbon fibers. Several carbon fibers are twisted together to form a yarn, which
can be used by itself or be woven into a fabric. For this research, the CFRP laminate (fabric)
from SikaWrap namely, SikaWrap Hex 117C was used for all the sample beams.
Figure 12 SikaWrap Hex 117C CFRP Laminate
Figure 13 Concrete CFRP Laminate Bond
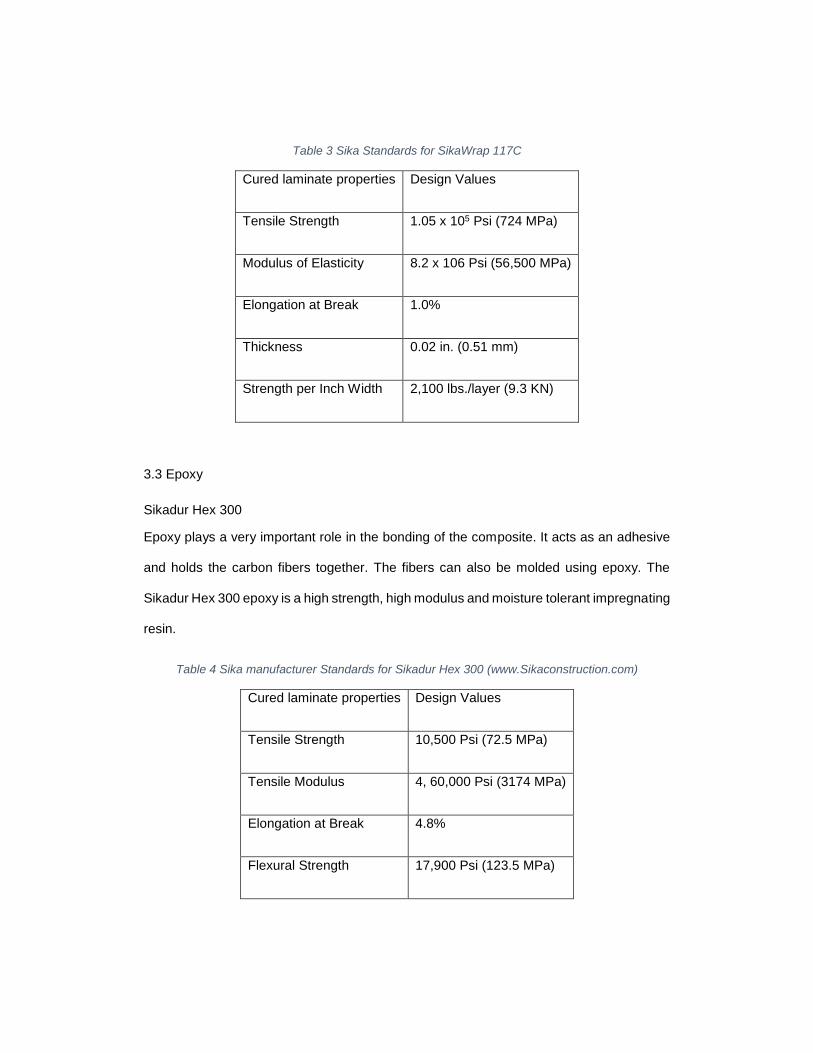
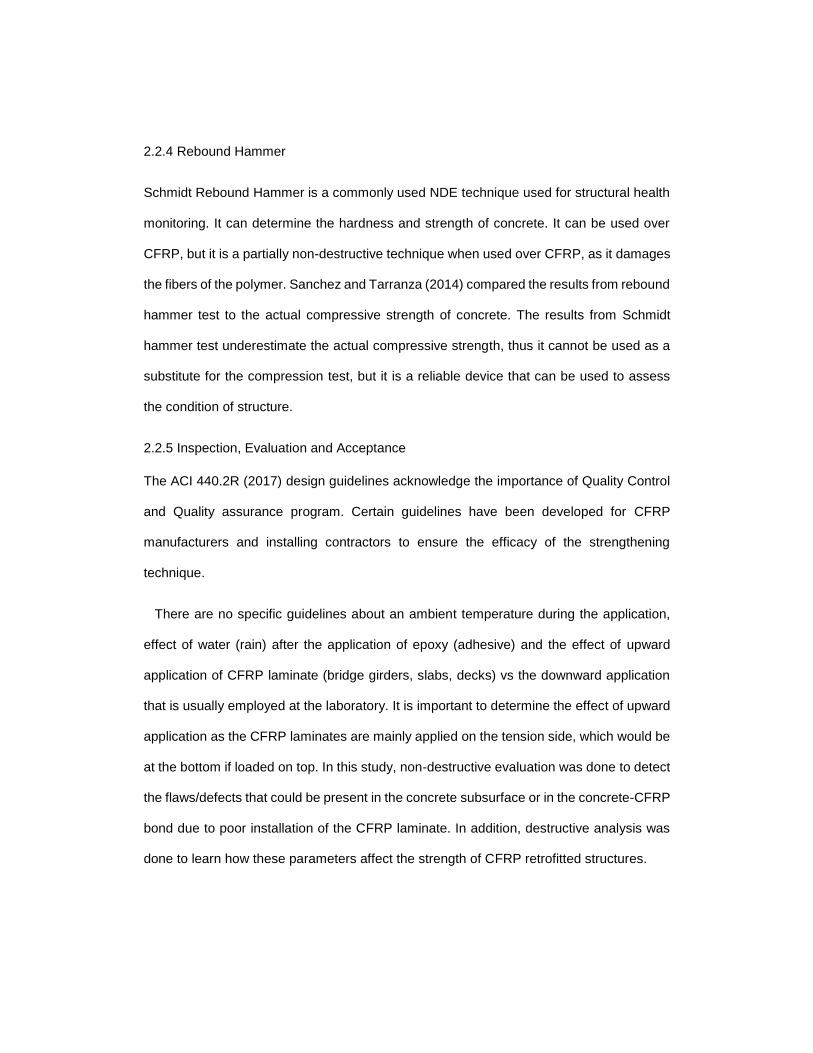
Table 3 Sika Standards for SikaWrap 117C
Cured laminate properties Design Values
Tensile Strength 1.05 x 10⁵ Psi (724 MPa)
Modulus of Elasticity 8.2 x 10⁶ Psi (56,500 MPa)
Elongation at Break 1.0%
Thickness 0.02 in. (0.51 mm)
Strength per Inch Width 2,100 lbs./layer (9.3 KN)
3.3 Epoxy
Sikadur Hex 300
Epoxy plays a very important role in the bonding of the composite. It acts as an adhesive
and holds the carbon fibers together. The fibers can also be molded using epoxy. The
Sikadur Hex 300 epoxy is a high strength, high modulus and moisture tolerant impregnating
resin.
Table 4 Sika manufacturer Standards for Sikadur Hex 300 (www.Sikaconstruction.com)
Cured laminate properties Design Values
Tensile Strength 10,500 Psi (72.5 MPa)
Tensile Modulus 4, 60,000 Psi (3174 MPa)
Elongation at Break 4.8%
Flexural Strength 17,900 Psi (123.5 MPa)

Sikadur 31
To prevent leaking of epoxy from the bottom of the beams, the bottom surface of the beams
was sealed with SikaDur 31, a Hi-Mod gel. Sikadur 31, is a 2-component, 100% solid,
solvent-free, moisture-tolerant, high-modulus, high strength, and structural epoxy paste
adhesive. It conforms to the current ASTM C-881, Types I and IV, Grade-3, Class-B/C and
AASHTO M-235 specifications. It was used for structural bonding of concrete. It is an epoxy
resin adhesive that seals cracks and blends with Sikadur 300 epoxy.
Table 5 Sika manufacturer Standards for Sikadur 31 (www.Sikaconstruction.com)
Density kg/litre 1.5
Shrinkage Negligible
Tensile Strength 2,150 Psi (14.8 MPa)
Flexural Strength 5,300 Psi (36 MPa)
Compressive Strength 10,150-13,050 Psi (70-90 MPa)
Shear Strength 3,050 Psi (21 MPa)
Elastic Modulus 995-1067 Ksi (6867-7358 MPa)
Adhesion to grit blasted steel 2,030 Psi (MPa)
3.4 Linear variable differential transformers (LVDT)
Linear variable differential transformer (LVDT) is a device that has an electrical transformer
that is used to measure the linear vertical displacement or position. The working principle
of LVDT is the conversion of a position or linear displacement with a mechanical reference

set to zero position, to a proportional electrical signal containing phase (for direction) and
amplitude (for distance) information. The technique does not need an electrical contact
with the displaced part, but relies on electromagnetic coupling. Figure 15 (b) shows the
LVDT that was used in this research. The LVDT was clamped to a wooden block which
was then clampled to a concrete block so that it reaches the top of the beam as shown in
figure 15 (a). LVDT was placed on both the sides of the beam and an average of the
diplacements was considered to plot the load displacement graph in chapter 5.
(a)
(b)
Figure 14 LVDT

Chapter 4
NON-DESTRUCTIVE EVALUATION AND DISCUSSIONS
4.1 Ground Penetrating RADAR
4.1.1 Introduction
Ground Penetrating RADAR (GPR) alludes to a wide range of electromagnetic techniques
(RADAR= Radio Detection and Ranging pulses), that are designed primary to locate the
objects of subsurface. The objects (targets) are identified depending on their type and the
material properties. The application of GPR is diverse and can be used to detect various
structural objects (rebars), public utilities like drainage or sewer lines, voids in concrete etc.
Figure 15 GPR Test Demonstration

Figure 16 GSSI SIR 30 unit
The GPR antenna transmits electromagnetic pulses into the ground which is then
reflected from numerous buried objects (targets) across. The objects (targets) are visible
when there is a contrast in the dielectric constant. Dielectric contrast is an indication of the
speed of radar energy when it travels through the material. The speed of radar wave
depends on the permittivity of the material. Dielectric constant is defined by the ratio of
permittivity of the material to the permittivity of free space. For the concrete used in this
study, the value of dielectric constant was 5. After the reflected waves are received by the
GPR antenna, it displays them in real time on screen. The data is saved for interpretation
and processing of the output. The data collection on concrete was done with a ground-
coupled antenna from GSSI SIR 30. For the analysis, the orientation of the antenna was
both normal and cross polarized. Figure 18 shows normal and cross-polarized antenna.
The antenna used in the study was the GSSI (Geophysical Survey System, Inc.) 2.6 GHz
antenna.
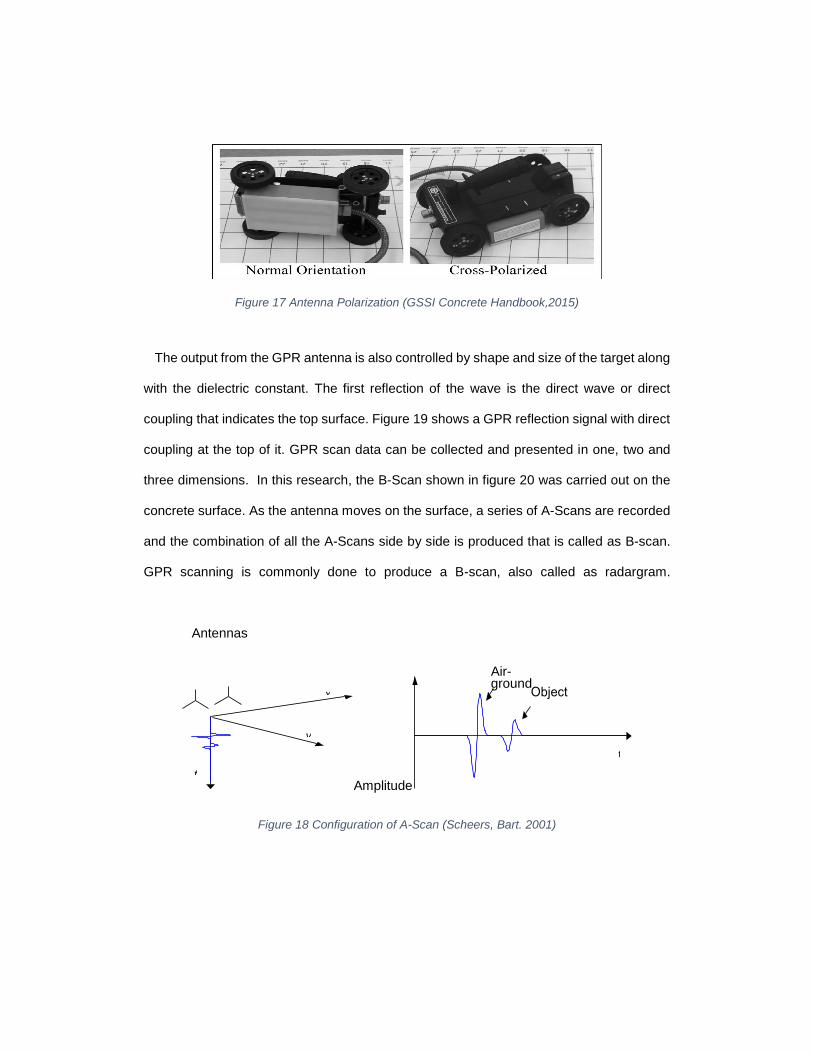
Figure 17 Antenna Polarization (GSSI Concrete Handbook,2015)
The output from the GPR antenna is also controlled by shape and size of the target along
with the dielectric constant. The first reflection of the wave is the direct wave or direct
coupling that indicates the top surface. Figure 19 shows a GPR reflection signal with direct
coupling at the top of it. GPR scan data can be collected and presented in one, two and
three dimensions. In this research, the B-Scan shown in figure 20 was carried out on the
concrete surface. As the antenna moves on the surface, a series of A-Scans are recorded
and the combination of all the A-Scans side by side is produced that is called as B-scan.
GPR scanning is commonly done to produce a B-scan, also called as radargram.
Antennas
Amplitude
Figure 18 Configuration of A-Scan (Scheers, Bart. 2001)
x
y
Air-ground
t

Figure 19 Formation of B-Scan
Figure 20 B-Scan on Grey scale
4.1.2 Evaluation
For every beam sample, the surface was scanned using a hand scanner and a 2.6 GHz
antenna that can scan up to 9-10 inches deep. With normally polarized antenna orientation,
two-line scans were captured as shown in the figure 21. In addition, one-line scan was
recorded with cross polarized orientation along the line S1 as shown in the figure. The
adjacent sides were also scanned using normally polarized hand scanner.
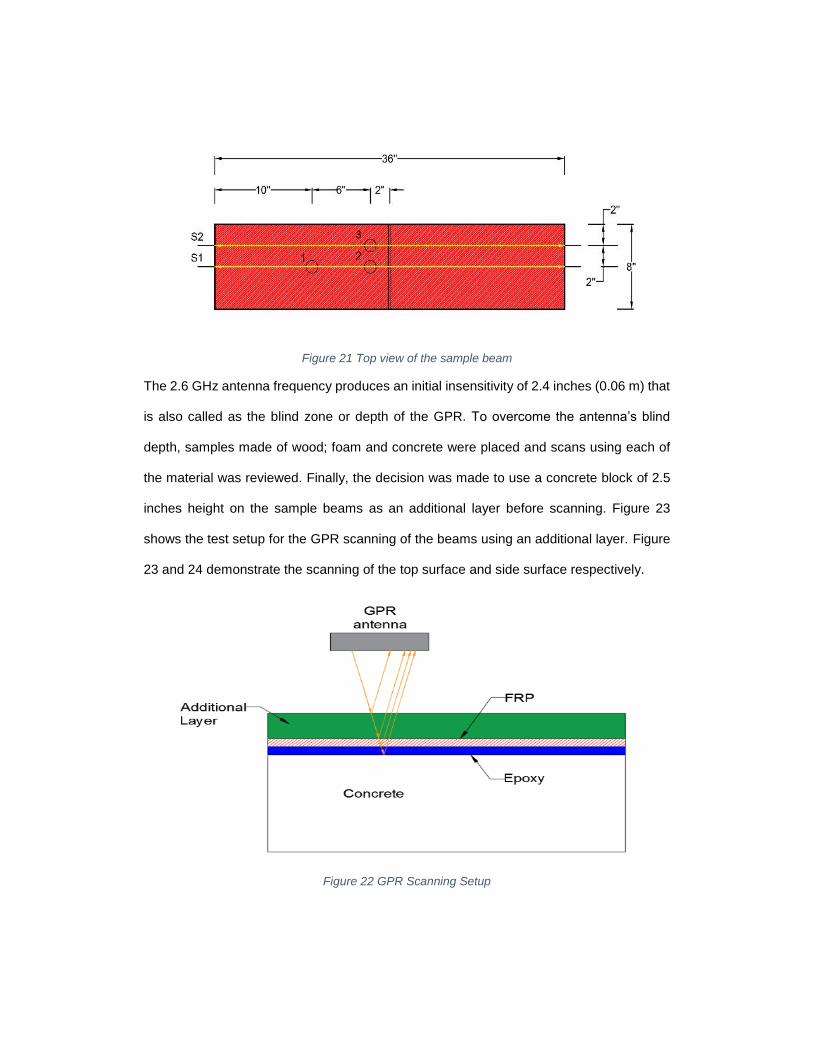
Figure 21 Top view of the sample beam
The 2.6 GHz antenna frequency produces an initial insensitivity of 2.4 inches (0.06 m) that
is also called as the blind zone or depth of the GPR. To overcome the antenna’s blind
depth, samples made of wood; foam and concrete were placed and scans using each of
the material was reviewed. Finally, the decision was made to use a concrete block of 2.5
inches height on the sample beams as an additional layer before scanning. Figure 23
shows the test setup for the GPR scanning of the beams using an additional layer. Figure
23 and 24 demonstrate the scanning of the top surface and side surface respectively.
Figure 22 GPR Scanning Setup

Figure 23 GPR Scan over a sample beam using a concrete additional layer
Figure 24 B-Scan of the side of the sample beam

4.1.3 Discussions
The wave profile, frequency and amplitude of the wave was recorded using the GPR. B-
scans along the length of the beam were done and the length and depth unit was inches.
During the investigation of the parameters, the scans could detect the presence of voids.
Other parameters could not be identified by the GPR. Figure 4-11 a shows a B-Scan of
beam 1 that is the control sample. The graph shows a signinificant change in amplitude
and the radargram shows a horizontally oriented black area, this is the interface of concrete
additional layer and the beam sample. Presence of voids can be seen as a phase inversion
occurs at a concrete-air interface because of the low dielectric of air. A phase inversion is
a flip-flopping of the normal polarity sequence. A concrete-air reflection starts with a
negative (black) peak followed by a positive (white) peak. The parabolas in the radargram
show the presence of air-filled voids, the size of parabola is directly proportional to the size
of voids. The Although, it is not possible to determine the size of void based on the
radargram. No significant change in the amplitude or radargram is visible for the
parameters with surface wetness, upward application of CFRP and improper surface
preparation. Thus, in this study, GPR was effective in detecting the sub-surface defects.
The radargram for beam 1 was uniform on the grey scale and can be seen in figure 25.
Figure 26 shows a small parabola that indicated the presence of voids. The grey scale
scan is flitered in the RADAN-7 software and figure 27 shows the filtered scan. The
parabola can be seen clearly in the filtered scan and is marked with an arrow. The size of
the parabola depends on the size of the voids. For multiple voids, multiple parabolas can
be detected.

Figure 25 Grey Scale radargram Beam 1
Figure 26 Gray scale scan for Beam 3, Void size 10mmx10mm

Figure 27 Filtered scan for Beam 3, Void size 10mmx10mm
Figure 28 shows the gray scale scan for beam 4. The black horizontal region in the scan
along the length of the beam is the CFRP-concrete interface at the additional layer. Two
parabolas can be seen at a depth just after the interface which mark the presence of two
voids. The scan was further filtered as shown in figure 29, for better identification of the
parabolas. A corresponding change in amplitude can be seen but it is difficult to identify if
the change is due to the CFRP-Concrete interface (at the additional layer) or presence of
voids.

Figure 28 Grey scale scan for beam 4
Figure 29 Filtered Scan for Beam 4, Void size 20mmx20mm (0.8''x0.8'')

Figure 30 shows the gray scale scan for beam 5. One parabola can be seen at the
concrete-CFRP interface, which marks the presence of a void. The scan was further filtered
as shown in figure 31, for better view of the parabola.
Figure 30 Gray scale scan for Beam 5
Figure 31 Filtered scan for Beam 5, Void size 20mmx20mm (0.8''x0.8'')

Figure 33 shows the gray scale scan for beam 6. Two parabolas can be seen at the
interface which marks the presence of two voids. The scan was further filtered as
shown in figure 34, for better identification of the parabolas. The parabolas in this
scan were bigger than the other beams, which verifies that the size of the artificially
planted voids is bigger for beam 6.
Figure 32 Gray scale scan for Beam 6, Void size 40mmx40mm (1.6''x1.6'')
Figure 33 Filtered scan for Beam 6, Void size 40mmx40mm (1.6''x1.6'')

Figure 35, 36 and 37 are the scans for beam 7, 9 and 11 respectively. One beam scan for
every parameter is shown, as there will not be any difference in the scans. The grey scale
scans are uniform. This means that there are no sub-surface defects in the beam samples.
The GPR antenna 2.6 Ghz cannot identify the delamination due to presence of dirt, water
or epoxy pockets.
Figure 34 Gray scale scan for Beam 7

Figure 35 Gray scale scan for Beam 9
Figure 36 Gray scale scan for Beam 11

This method was successful in detecting and quantifying the sub-surface defects only. The
GPR is an expensive equipment but it can be used for many years and for multiple projects.
GPR can detect the obvious flaws and voids present in the sub-surface. GPR scanning is
a very slow technique although it can scan a large area in one scan. The major drawback
of using GPR is that it is very difficult to place an additional layer while scanning overhead.
To inspect the CFRP laminates installed on bridge girders, manlift can be used scan the
laminate surface, but it is difficult to attach an additional layer during scanning. If the
scanning is done without an additional layer, voids and defects present near the laminate
surface could be ignored due to the initial insensitivity of the antenna. Another alternative
could be using the 1600 MHz antenna to get high resolution scans. This process is time
consuming and it is not feasible to close the traffic for a long time. The calibration and
evaluation of GPR scans requires highly skilled labor. Although, the scanning can be done
by subsidiaries.

4.2 Infrared Thermography
4.2.1 Introduction
Thermography allows one to make non-contact measurements of an object’s temperature.
An IR camera can convert thermal radiation to a visual image that depicts thermal
variations across an object. Temperature is one of the most common indicators of the
structural health of equipment and components, S. Bagavathiappan et. Al (2013) IR
Camera has wide applications in defect detection like de-bonding, delamination, cracks,
sub-surface and quantification. Infrared thermography can detect heat patterns in the
infrared wave-length spectrum that are not visible to the unaided eye. These heat patterns
can help identify deteriorating components before they fail.
In this study, temperature difference caused due to non-homogeneity of material helped
detect voids, dirt, water, epoxy pockets and delamination. Infrared camera FLIR E60 from
FLIR Thermal imaging was used for the study. This camera can detect the temperature of
an object in the range of 4 ̊ F to 248 ̊ F (-20 ̊C to 120 ̊C) with an accuracy of +/- 2%. The
main components of IR Camera are a lens, a detector in the form of a focal plane array
(FPA), possibly a cooler for the detector, and the electronics and software for processing
and displaying images. The detector type used in the camera is uncooled micro bolometer
with 19,200 pixels.
Figure 37 FLIR E 60 Infrared Camera (FLIR Manual 2008)

4.2.2 Evaluation
The infrared energy emitted from the object is converted to apparent temperature and the
result is displayed as an Infrared Image. To check the bond between concrete and CFRP,
two tests were conducted. For the first test, the surface was heated with a light bulb for
thirty seconds and images were captured before and after heating the beam with the light
bulb. Due to the anomalies and disbonds, a temperature difference was being observed
and was recorded in the form of a thermal image. The figure shown below demonstrates
the setup for the test.
Figure 38 Test Setup using IR Camera
Figure 39 Heating the beam using bulb

Figure 40 Capturing mage after heating the beam
4.2.3 Discussions
The results show the non-homogeneity in the concrete due to voids. The size of voids could
be roughly estimated by looking at the figures. Overall, these tests could determine both
the surface and sub-surface defects, and ultimately helping determine the quality of the
bond. Figure 41 shows the thermograph of beam 1 after heating it with the bulb. The scale
on the right-hand side of the figure shows the color coding for the temperature in ⁰F. The
beam surface looks uniform due to absence of uneven heating throughout the beam
surface. For figure 42, a few bright spots can be seen which indicate a zone of higher
temperature. The corresponding delamination area is calculated in the next section.
Figure 41 Thermograph Beam 1

Figure 42 Thermograph Beam 2
Figure 43 is the thermograph for beam 3, after heating the beam with the bulb. The uneven
heating in the beam is due to the voids. The bright spots seen in the figures are disbonds
due to voids. Similarly, from figures 44, 45 and 46 the voids can be found for the beams
4,5 and 6 respectively From the figures, it is evident that the voids have higher temperature
than the concrete surface.
Figure 43 Thermograph Beam 3
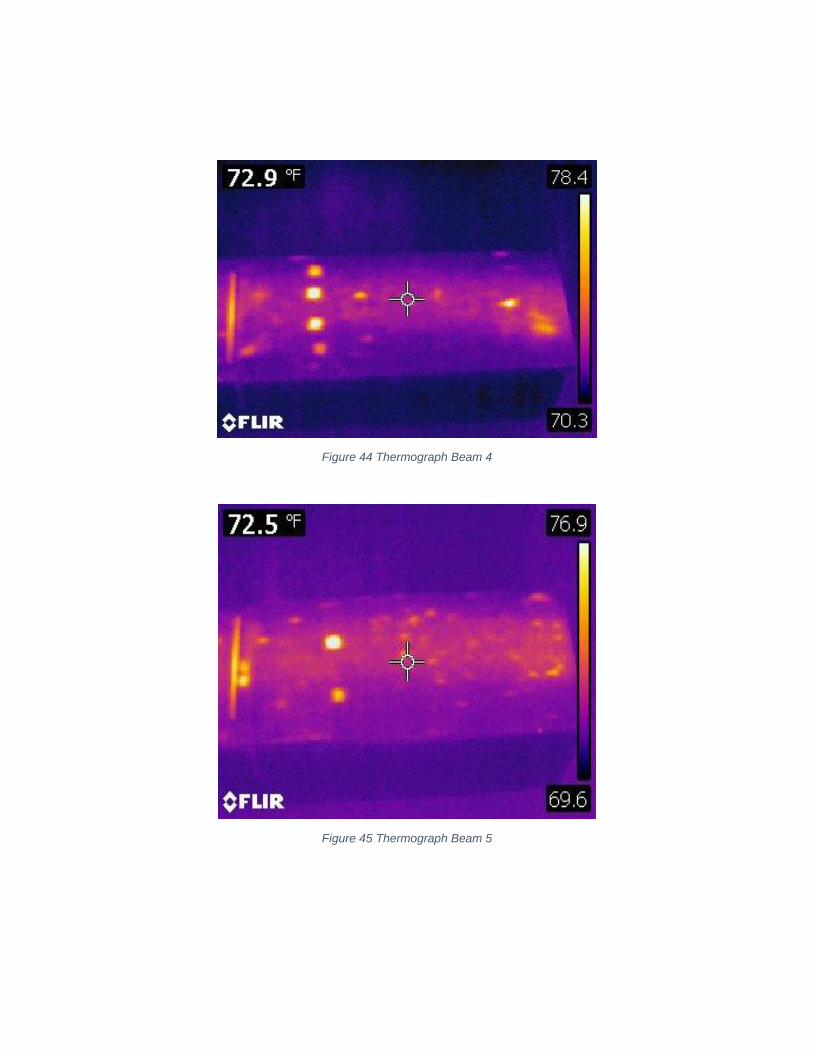
Figure 44 Thermograph Beam 4
Figure 45 Thermograph Beam 5

Figure 46 Thermograph Beam 6
For beam 7 and 8, the presence of water during the application of CFRP causes disbonds.
The bright spots that are visible in the captured figures 47 and 48 are the disbonds. The
area of total delamination is calculated in the next section. By looking at the figures, it can
be said that there is presence of dust or water as some spots in the captured images are
heated unevenly. For beam 9 and 10, the CFRP is applied in overhead, and the
thermographs shown in figure 49 and 50 respectively are captured after heating the beam.
The bright spots visible in the thermograph are the epoxy pockets that were formed due to
the overhead application of the CFRP (gravity effect). The epoxy pockets show highest
temperature as compared to dirt and water. For beam 11, the surface was not cleaned
before applying the CFRP laminate. Figure 51 is the thermograph for beam 11, the bright
spots are the indication of presence of dirt.
Thus, the bright spots due to change in temperature sign imperfect bonding and presence
of delamination.

Figure 47 Thermograph Beam 7
Figure 48 Thermograph Beam 8

Figure 49 Thermograph Beam 9
Figure 50 Thermograph Beam 10

Figure 51 Thermograph Beam 11
The images captured from thermal camera were imported to AutoCAD 17. The images
were scaled and fit into the beam’s actual size. The void area was then calculated using
the area tool for every void that was visible as a bright spot. The area of all the spots was
summed up manually to get the total delamination for every beam. The findings from
AutoCAD are tabulated below and are compared with the actual size of void.
Table 6 Area Calculations for beams with artificial voids
Beam no. Actual area mm2 (in2) Calculated area mm2 (in2)
3 413 (0.64) 510 (0.79)
4 1651 (2.56) 1764 (2.73)
5 826 (1.28) 944 (4.46)
6 3303 (5.12) 3540 (5.48)

For beams with other parameters, area was calculated using the same procedure, but the
actual area of delamination is unknown. The delamination that is visible in the beams is
due to presence of water, dirt and epoxy pockets formed due to gravity effect in upward
application. The results for total area of delamination are tabulated as below.
Table 7 Area calculations for beams
Beam Area mm2 (in2)
1 0 (0)
2 92 (0.15)
7 460 (0.71)
8 515 (0.79)
9 3675 (5.69)
10 3866 (6)
11 1947 (3.01)
After the area calculation, the next steps taken to rectify the bond so that there is no
compromise in the strength. The next steps are taken in action according to the guidelines
stated in the ACI 440 2R, 2017 manual. The following flowchart shows the detailed
procedure of finding the area of delamination and the suggested remedies

Figure 52 Proposed test using IR, Acceptance criteria & recommended repair as per ACI 440.2R (2017)
This method was successful in detecting both surface and sub-surface defects. The defects
were further quantified and compared to the total laminate area to calculate the percentage
of delamination. It is possible to detect the depth of the voids by heating the adjacent side
of the beam, but it was not done in this study. This method is very cost efficient and can be
used on field. The heating time will increase with an increase in the area to the examined.
To inspect the CFRP laminates installed on bridge girders, manlift can be used to heat the
laminate surface. Using the infrared camera, it was possible to detect the delamination for
a large area in a few hours. It is feasible to shut the traffic for a few hours for this Non-
destructive technique. Highly skilled labor is not required for the evaluation on field.
Heat the surface evenly using a heat bulb for 30 seconds and then capture
images of the required area
Small delaminations<2 in2 (1300mm2)
each< 5% laminate area
Ok, Permissible.
Large delaminations>25in2 (16000mm2)
Needs repair, cut the affected sheet and apply
an overlapping sheet patch of equivalent plies
Medium Delamination
<25 in2 (16,000mm2)Repair by resin injection or laminate replacement,
whichever is feasible
Calculate the laminate area and total delamination

4.3 Ultrasonic Multichannel Pulse Echo Technology
4.3.1 Introduction
Ultrasonic multichannel pulse echo technology is a technique that uses ultrasound waves
for creating images. The device used for the study is Pundit 250 array from Proceq. The
device works on an ultrasonic multi-channel pulse echo technology using 8 channels. One
channel transmits, and the other seven channels receive the echoes. Each channel
transmits in turn. The components of the device are a touchscreen, transducer, receiver,
battery and Pundit 250 Array software. The wave type used by the device is a horizontally
polarized shear wave, the nominal transducer frequency is of 50 KHz shear wave and the
Pulse Velocity is 200 V. Figure 53 shows the device and figure 54 shows the application of
the device in this study where T stands for transmitter and R stands for receiver.
Figure 53 Pundit 250 Array

Figure 54 Ultrasonic Scanning Setup
4.3.2 Evaluation
Pundit Array 250 is a spot damage detection device. Six spots on the beam were scanned
to detect the disbonds in the CFRP-concrete bond. The location of the scans is marked as
1,2,3,4,5,6 and is shown in figure 57. The spots were chosen at the center and at the edge
considering subsurface voids, potential wrapping of CFRP at the ends and other
parameters, During the scanning, it must be made sure that all the eight channels touch
the surface and are pressed. The gain can be adjusted according to the desired result and
a gain of 34 dB was used for the scans. SI units were used for the time, depth and scan
distance. The pulse velocity of the material under test i.e. concrete was assumed as 3000
m/s. The type of scan captured is a B-Scan, and it is along the length of the beam.
Figure 55 Ultrasonic B-Scan

Figure 56 Location of the scans on the beam
4.3.3 Discussions
The flaws/defects can be characterized with a change in amplitude is when the ultrasonic
wave travels through the surface. The scan is done along the length of the beam (x-axis)
vs the depth of the beam (y-axis). In this study, SI units were used for length and depth of
the scan. The beam surface is at the top of the scan and the beam bottom is roughly at 0.3
m on the y-axis. The location of the flaw/delamination can be found by checking the
corresponding depth on the y-axis. A significant amplitude change can be observed in the
scan due to presence of dibonds. The following are the scans for the sample beams. The

beams that show presence of voids/delamination are encircled in the scans; circle indicates
presence of disbonds, which could be air filled voids, epoxy pockets, dirt or CFRP wrapping
due to the overhead application. For beams with no surface preparation, significant amount
of dirt is present between the CFRP-concrete bonds. The sample beams had different sizes
and locations of the voids. It was possible to detect the voids but not the exact location or
the size of the void.
Figure 57 and 58 are the snap shots of the ultrasonic tomography results for beam 1 and
2 respectively. No significant change in the amplitude % can be seen for these control
samples.
Figure 57 Beam 1 Ultrasonic Tomography

Figure 58 Beam 2 Ultrasonic Tomography
For beams 3,4,5 and 6 the voids can be detected by the bright spots and are circled in the
images 59,60,61 and 62 respectively. A corresponding change in the amplitude is
recorded.

Figure 59 Beam 3 Ultrasonic Tomography
Figure 60 Beam 4 Ultrasonic Tomography

Figure 61 Beam 5 Ultrasonic Tomography
Figure 62 B-Scan of Beam 6 Ultrasonic Tomography

Figure 63 and 64 are the scans of beams 7 and 8. From the scans and change in amplitude
percentage, the delamination due to presence of water can not be identified.
Figure 63 Beam 7 Ultrasonic Tomography

Figure 64 Beam 8 Ultrasonic Tomography
For the beams 9 and 10 with overhead application of the CFRP laminate, a significant
change in the percentage of the amplitude can be seen in figure 65 and 66 respectively.
The encircled bright spots indicate the presence of epoxy pockets formed due to the gravity
effect. Similarly, for beam 11 the ultrasonic tomograph shown in figure 67 indicates the
presence of dirt. The corresponding change in amplitude is recorded and compared to the
other beam samples.

Figure 65 Beam 9 Ultrasonic Tomography
Figure 66 Beam 10 Ultrasonic Tomography

Figure 67 Beam 11 Ultrasonic Tomography
The graph in figure 68 shows the change in amplitude with respect to time for every beam
sample. A change in amplitude is observed when delamination is detected at 50
milliseconds. The change in amplitude depends on the nature defect. The graph
summarizes the change in amplitude for all the four parameters. The maximum change in
amplitude is observed due at the FRP and Concrete interface (time 50-100 ms). The
location of delamination and interface is the same. Thus, making it difficult to record the
change in amplitude due to the parameters.

Figure 68 Ultrasonic Tomography, Amplitude Vs Time
This method was successful in detecting the sub-surface and surface defects. The
Ultrasonic tomography is a spot detection technique and is not feasible to practice on field
to detect delamination in a large area. The cost of the equipment is less and skilled labor
is not required for the testing. The device can detect the flaws, but it is a very slow and
time-consuming technique. It can used for a small area or in combination with other NDE
techniques.
-4000
-3000
-2000
-1000
0
1000
2000
3000
4000
0 50 100 150 200 250 300 350
Am
plit
ud
e
Time (ms)
Beam 1 Beam 2 Beam 3 Beam 4 Beam 5 Beam 6
Beam 7 Beam 8 Beam 9 Beam 10 Beam 11

Chapter 5
DESTRUCTIVE TESTS, EVALUATION AND RESULTS
5.1 Schmidt Rebound Hammer
5.1.1 Introduction
Schmidt Rebound hammer is a widely used non-destructive testing equipment that is used
for estimation of concrete strength properties, asphalt and rock. Schmidt hammer is a
partial non-destructive or destructive technique when used on CFRP retrofitted beams as
it ruptures the CFRP fibers when it hits the surface. A rebound hammer from Proceq,
namely, Silver Schmidt was used for the study. The Silver Schmidt hammer is a unique
integrated concrete test hammer featuring true rebound value calculated from the quotient
of impact velocity and rebound velocity to provide maximum accuracy.
Figure 69 Silver Schmidt Hammer (Proceq Operating Manual, 2017)
5.1.2 Evaluation
The device was used to measure the Concrete-CFRP surface hardness. The hammer
measures the rebound of a spring-loaded mass impacting against the surface of the
sample. The test hammer will hit the concrete at a defined energy. Its rebound is
dependent on the hardness of the concrete and is measured by the test

equipment. The test was done according to ASTM C805 standards as mentioned in
the ACI 440.2R-17 guidelines.
Figure 70 Schmidt Hammer test
5.3.2 Discussions
For the calculation of the surface hardness, the ratio between the rebound velocity and
the impact velocity was calculated as Q. For every sample, nine points were tested as
shown in figure 71, for the side with CFRP laminate on the beam and the test was
repeated twice. The calculations were done according to the ASTM C805 standards
and the results of the Q value (mean value of the tests) are tabulated below.

Figure 71 Rebound Values
• According to the results from the rebound hammer test, the control sample
beams have less surface hardness than most of the parameters. The bond in
control beams might have been compromised.
• Beam 7 and 8 have the same parameter of surface wetness, but the surface
hardness for both the beams are 50 and 68.5 respectively.
• Similarly, Beam 9 and beam 10 have upward installation of CFRP, but the
surface hardness for both the beams are 62.5 and 50.75 respectively.
• By looking at the varying results, it can be concluded that Schmidt hammer
was not a reliable tool that can be used on the FRP surface to correlate the
parameters affecting the bond.
54 5057 55
52 5350
68
62
50
60
0
10
20
30
40
50
60
70
80
1 2 3 4 5 6 7 8 9 10 11
Q V
alu
e
Beam number
Rebound (Q) Value

5.2 ASTM Pull off Adhesion Test
5.2.1 Evaluation
Epoxy from Sikadur was used to attach the CFRP Laminate to the concrete. ACI 440
mentions that the tensile strength of the concrete on surfaces where the CFRP system may
be installed should be determined by conducting a pull-off adhesion test in accordance with
ACI 503R. The determines the greatest perpendicular force (in tension) that a surface area
can bear before a plug of material is detached. Failure will occur along the weakest plane
within the system comprised of the test fixture, adhesive, coating system, and substrate,
and will be exposed by the fracture surface. The general pull-off adhesion test is performed
according to the International Concrete Repair Institute (ICRI) 310-2R (16) guidelines. It is
done by scoring through the coating down to the surface of the concrete substrate at a
diameter equal to the diameter of the loading fixture (dolly) and securing the loading fixture
normal (perpendicular) to the surface of the coating with an adhesive. After the adhesive
is cured, a testing apparatus is attached to the loading fixture and aligned to apply tension
normal to the test surface. The force applied to the loading fixture is then uniformly
increased and monitored until a plug of material is detached. When a plug of material is
detached, the exposed surface represents the plane of limiting strength within the system.
The nature of the failure is qualified in accordance with the percent of adhesive and
cohesive failures, and the actual interfaces and layers involved. The pull-off adhesion
strength is computed based on the maximum indicated load, the instrument calibration data
and the surface area stressed. For this study, a device from Defelsko named PosiTest AT-
A Automatic was used. The device has an electronically controlled hydraulic pump that
automatically applies smooth and continuous pull-off pressure. The maximum pull-off

pressure and rate of pull was recorded at two points 3 inches from the edge of the beam.
The diameter of the fixture (dolly) is 2 inches.
Figure 72 Pull off Test Mechanism
Figure 73 Location of the fixture at A and B points

Figure 74 Scoring through the coating
Figure 75 Fixtures attached to the beam samples for pull off test
5.2.2 Discussions
The efficacy of the CFRP- Concrete bond can be determined by inspecting the mode of
failure. The average strength from both the fixtures was calculated and compared to the
control beam samples. Different modes of failure are shown in figure 77. The desired type
of Mode is G, which means that the bond is proper, and the failure is in the concrete
substrate. If the mode of failure is A, it means that the dolly failed in adhesion (between the

dolly and the glue used to attach dolly). Mode C is also an undesirable mode and it shows
that the dolly failed in adhesion (between the CFRP and epoxy used to attach CFRP;
Sikadur 300, Sikadur 31). The results from Mode A and Mode C result cannot be used to
determine the bond between CFRP and concrete, hence the value was ignored while
taking the average. The strength for every sample is tabulated in the table below.
Figure 76 Pull off adhesion tester
Figure 77 Modes of Failure (ASTM D7522/D7522M, Standard Test Method for Pull-Off Strength for CFRP Laminate Systems Bonded to Concrete Substrate, © 2009)

Table 8 Pull off Adhesion Tensile Strength
Beam number A MPa (psi) B MPa (psi) Average MPa (psi) Failure Mode
1 2.25 (326) 1.18 (171*) 2.25 (326) Mode F
2 2.06 (299) 2.3 (334) 2.17 (316.5) Mode G
3 0.9 (134*) 1.8 (260) 1.8 (260) Mode D
4 2.27 (329) 3.8 (551) 3.03 (440) Mode G
5 2.33 (339) 3.75 (545) 3.05 (442) Mode G
6 2.03 (295) 2.5 (360) 2.25 (327.5) Mode G
7 2.65 (384) 1.8 (270) 2.25 (327) Mode F
8 1.77 (257) 0.5 (78*) 1.77 (257) Mode C
9 2.42 (352) 2.9 (429) 2.6 (390.5) Mode F
10 1.48 (215) 1.5 (218) 1.5 (216.5) Mode F
11 2.9 (433) 3.05 (442) 3.01 (437.5) Mode F
*dolly fixture not attached properly, Mode A
Figure 78 Beam 2, ASTM Pull off test Mode G

Figure 79 Beam 9, ASTM Pull off test Mode F
Figure 80 Beam 11, ASTM Pull off test Mode F
Figure 81 Beam 8, ASTM Pull off test Mode C

5.3 In-Place Compressive strength
According to ACI 440, the in-place compressive strength of concrete should be determined
using cores in accordance with ACI 318-05 requirements. The load-carrying capacity of the
existing structure should be based on the information gathered in the field investigation,
the review of design calculations and drawings, and as determined by analytical methods.
Load tests or other methods can be incorporated into the overall evaluation process if
deemed appropriate. For this study, the compressive test was done with cylinder samples
to calculate the crushing strength at 28 days and at the time of the non-destructive testing.
The average of cylinders was calculated and is tabulated below.
Figure 82 Laboratory test to determine the crushing strength
Table 9 In-place compressive strength
Number of days Compressive strength (f’c) MPa (Ksi)
28 22.75 (3.3)
303 24.12 (3.5)

5.4 Three Point Bending Test
5.4.1 Experimental setup
The purpose of the experiment was to examine the failure load of all the beam samples
and compare them each other. Three-point loading test was considered to test the beams
and determine the failure load. Two supports were used on each side of the beam. All
supports used were made of thick steel to prevent deflection at the support. On the top
center of the beam, point loading was done using the 600 kips compression machine. All
the eleven beams were tested under constant rate of loading. The notch in the mid-span
ensured that the failure was at the mid-span during the bending test. Data was collected
from LVDT and strain gauge. The figure shown below shows the experimental setup.
Figure 83 Demonstration of Three-point bending test setup

Figure 84 Sample beam, Test setup
5.6.2 Evaluation and Results
Eleven beams having for parameters and two control specimens were tested using the 600
Kips compressive machine at the Civil Engineering Lab Building at UTA. The main causes
of failure in CFRP Composites can be breaking of fibers, debonding, micro cracking of the
matrix and delamination.
The failure load for every beam was recorded and is tabulated below. The modes of failure
were different for each beam and are classified as shown in the figure 89. If the ends of
the plate are properly anchored, then failure occurs when the ultimate flexural capacity of
the beam is reached, by either tensile rupture of the CFRP plate (Fig. 2a) or crushing of
concrete (Fig. 2b). For either CFRP rupture or concrete crushing, the steel reinforcement
generally has already yielded at failure. Due to the brittleness of CFRP, when failure
occurs by CFRP rupture, the concrete has generally not reached failure. This differs from

that of conventional RC beams, where due to the ductility of steel reinforcement, the
compressive concrete generally has reached failure at the ultimate limit state of the beam.
In addition, the brittleness of CFRP means that flexural failure of CFRP plated RC beams,
by either CFRP rupture or crushing of concrete, displays limited ductility. As a result, failure
by concrete crushing is permissible in CFRP plated beams, which contrasts with
conventional RC beam design where steel yielding should be ensured to precede concrete
crushing (Teng J., Chen J., 2007). The results of the test are tabulated below.
Figure 85 Failure modes of CFRP-Plated beams (Teng J., Chen J., 2007)

Table 10 Results of Three-point bending test
Beam Failure Load KN (lbs.) Failure Mode
1 46.25 (10400) Concrete cover separation
2 41.15 (9250) Plate interfacial debonding
3 55.6 (12500) Concrete cover separation
4 44.92 (10100) Concrete cover separation
5 47.6 (10700) Concrete cover separation
6 44.5 (10000) Plate interfacial debonding
7 42.75 (9610) Plate interfacial debonding
8 44.35 (9970) Plate interfacial debonding
9 52.67 (11840) Plate interfacial debonding
10 54.7 (12300) Plate interfacial debonding
11 46.64 (9580) Plate interfacial debonding
Figure 86 Intermediate crack induced interfacial debonding

(a)
(b)
Figure 87 Intermediate crack induced interfacial debonding

Figure 88 CFRP Debonding
Looking at the results from three-point bending test, it was suspected that the control
samples were comprised. Since there was no delamination that was visible in Non-
destructive testing of the control samples. The decrease in strength could be because of
a lower f’c of the control samples. To confirm the suspicion, rebound hammer was used to
find the f’c of the control samples. The hammer was used on the concrete surface and the
results of Q values and f’c are shown in the figure 89. The compressive strength of concrete
(f’c) was calculated using the formula and curve given by the manufacturer of Proceq Silver
Schmidt Hammer. The curve is also recommended for use by the ASTM C805 standards.
The results show that the f’c for the control samples was 2.6 Ksi and 2.8 Ksi, which is lower
than the beam samples with parameters. The strength of the composite structure depends
on the strength of concrete. From the ACI 440 calculations, it is evident that the total
nominal strength is the sum of Mn and Mnf, where Mn is the design flexural strength of the
section and Mnf is the contribution of FRP in bending.

Figure 89 Results from Silver Schmidt Hammer
The graph shown in figure 90 illustrates the comparison of load versus the displacement
recorded by the LVDT between the control beams and the beams with parameters. The
three-point bending test results we were more focused on the failure modes (delamination)
of FRP. After the FRP debonding, the vertical displacement of the sample beam was noted
down. The point on the graph after the CFRP debonding, showed a drastic drop in load
with the same deflection. This implies that the beam is not carrying any more load with an
increase in deflection. The behavior of each beam is unique and could not be correlated
with the parameters. The FRP application on the beams makes them stiffer and reduces
the deflection. The graph in figure 90 and 91 shows the behavior of eleven beams that can
be compared to each other.
0
0.5
1
1.5
2
2.5
3
3.5
4
30
32
34
36
38
40
42
44
46
1 2 3 4 5 6 7 8 9 10 11
Com
pre
ssiv
e S
trength
of
Concre
te (
f'c)
in
Ksi
Rebound V
alu
e (
Q)
Beam number
Rebound hammer test to find f'c of concrete
Rebound Value (Q) f'c of the concrete beams

Figure 90 Load vs Displacement Graph for Beam samples

Figure 91 Load vs Displacement Graph for Beam sample

5.6.3 Discussions
1. The Load vs Displacement at midspan measured by the LVDT is shown in figure
90 and 91. The initial displacement of the beams when there is no load applied is
due to the equilibrium of the compression testing machine and the friction between
the Beam and the plate that is in contact with the LVDT. The initial displacement
must hence be ignored. A change in displacement for a constant load of 3000 lbs
is noticed due concrete losing its strength and the CFRP got engaged or in other
words started resisting the forces. After the peak load, no further load can be taken
by the beams and a constant displacement is observed. This is due to the
delamination of the CFRP laminate. Somme beams also show a post reserve
strength that is shown by the behavior of the beams which resist an additional load
after a drop in the displacement.
2. From the results, it can be observed that, delamination due to adhesion occurs
when the void size is large than compared to the smaller void size. In addition, the
failure load is lower for beam 6 as compared to beam 3. If the size of the voids is
further increased, load carrying capacity might decline. The percentage
delamination for the beams due to artificial voids is calculated as,
Total laminate area= 36 in x 8 in = 288 in2
Delamination area, Beam 3 = 0.64 in2 i.e. 0.23%
Beam 4 = 2.56 in2 i.e. 0.89%
Beam 5 = 1.28 in2 i.e. 0.45%
Beam 6 = 5.12 in2 i.e. 1.78%
From the bending tests results, it was observed that there is no loss of strength
due to the presence of voids in the CFRP-Concrete bond. As per the ACI 440 2R-

17 guidelines, delamination less than 2 in2 or less than 5% of the total laminate
area are permissible, which can be verified by this study.
3. The presence of water weakens the adhesion between CFRP-Concrete and
causes delamination in the CFRP laminate. The following observations were
made to establish the effect of surface wetness on the CFRP-Concrete bond,
Beam 7 failure load= 9610 lbs
Beam 8 Failure load= 9970 lbs, Average failure load = 9790 lbs
Control sample average failure load =10075 lbs
Loss of strength 325 lbs i.e 3.5%.
The ACI 440.2R-17 guidelines and manufacturer guidelines state that the CFRP
application must be done in the absence or water. The effect of presence moisture
(C Tuakta, O. Büyüköztürk, 2011) and effect of presence water (Wan et al, 2006)
was found to have an adverse effect on the durability of the Bond between CFRP
and Concrete. In this study, an undesirable mode of failure (Plate interfacial
debonding) was observed along with a loss of 3.5% strength. The tests were
conducted one year after the sample was cast, but it is also important to find out
the prolonged effect of surface wetness on the bond.
4. For the beams, 9 and 10 the failure observed is plate interfacial debonding and it
can be concluded that the bond affects due to upward application of CFRP and it
must be taken in consideration while designing.
Effect of Overhead Application of CFRP
Control beams average failure load = 10075 lbs
Beam 9 & 10 Average failure load = 11870 lbs
The strength increased by 1795 lbs with respect to the control sample due to the
application of Sikadur 31 epoxy. The test results from pull off test and bending

tests indicate that the resulting failures are adhesive failures along the
primer/concrete interface, these point out that the quality of bond is poor. The load
vs displacement data for the beams show that the beams had a good strength and
stiffness compared to the other samples. The beam samples also showcased post
reserve strength after the delamination of CFRP laminate. Although the bond
quality was not good, the effect of application of a combination of epoxies
increased the strength of the beam. Control samples with 2 epoxies must be
casted and studied to evaluate the effect of overhead application of the CFRP
laminate.
5. Effect of Improper surface application
For Beam 11, the surface was roughened to CSP3 profile according to ACI 440R
guidelines. After the application of epoxy, dirt was planted artificially to evaluate its
effect on the concrete-CFRP bond. From the bending test, the failure load for the
beam with was 495 lbs i.e. 5% less than the control sample. The mode of failure
from the pull off test and bending test indicates a poor-quality bond, adhesive
failures/delamination along the primer/concrete interface were observed. The
prolonged effect of this parameter must be considered as the dirt may induce
stress in the CFRP-Concrete bond and might result in loss of strength over the
years.

Chapter 6
CONCLUSIONS AND RECOMMENDATIONS
6.1 Conclusion
The current research was an extension to the study “Quantitative Non-Destructive
Evaluation (NDE) of FRP Laminate-Concrete Bond Strength” where parameters such as
epoxy type, CFRP laminate type, voids and surface roughness were considered. This study
was successful in determining the quality of bond using the NDE Techniques.
• Voids and improper surface profile was clearly visible in the infrared thermography.
• The Ground Penetrating RADAR shows the internal structure of concrete (sub-
surface) and presence of voids.
• Ultrasound tomography depicts all the surface and sub-surface disbonds.
• Use of more than one NDE is suggested to compare and compile the findings.
• NDE can be used as an effective tool to evaluate the quality of bond between
CFRP-concrete. Thus, helping us identify poor workmanship and/or environmental
effects that can affect the bond.
• As the ACI 400.2R-17 does not specify the strategy to conduct Non-destructive
tests, this study may serve as a valuable reference for optimization and inspection
of CFRP-Concrete bond at the interface, using Non-destructive testing devices for
practical applications.
• The debonding failure modes of the beam samples from the destructive tests,
justify the accuracy of the NDE approach to identify the quality of the bond.

6.2 Recommendations
• The effect of additional parameters on the bond strength need to be investigated:
- Aging of Epoxy.
- Application of FRP to concrete at hot versus cold temperature.
- Application of FRP at direct sunlight versus shaded area.
- Humidity.
- Application of the FRP on old versus new concrete.
- Behaviour of Epoxy pockets in extreme temperature conditions
• More research is needed to study the effect of combination of all the parameters
at the same time.
• Microwave NDE can be also used to detect the quality of bond as it shows
promising results in finding the voids by previous researchers
• The ground penetrating radar with antenna 2600 MHz was used. Additional
antenna frequency could be used to develop additional equations. Also, the
orientation of the antenna and the addition of other materials could be investigated
to develop more formulas. The long-term effect of these parameters must be
considered. There could be a significant loss of strength over the years due to the
delamination if accompanied by cracks
• The effect of the parameters in presence of reinforcement can be considered.

References:
1. ACI (American Concrete Institute). (2008). “Guide for the design and construction
of externally bonded CFRP systems for strengthening concrete structures.” ACI
440.2R, Farmington Hills, MI.
2. Alleyne DN, Cawley P (1992). The interaction of Lamb waves with defects. IEEE
Transactions on Ultrasonics, Ferroelectrics and Frequency Control, 39(3), 381-397
3. ASTM D4541-17 Standard Test Method for Pull-Off Strength of Coatings Using
Portable Adhesion Testers, ASTM International, West Conshohocken, PA,
2017, https://doi.org/10.1520/D4541-17
4. ASTM. (2009). “Standard test method for pull-off strength for CFRP bonded to
concrete structures.” ASTM D7522/D7522M, Reston, VA
5. Autodesk. “AutoCAD.” Autodesk - 3D Design & Engineering Software for
Architecture, Manufacturing, and Entertainment, 2017, usa.autodesk.com/.
6. D. H. Chen and A. Wimsatt, “Inspection and condition assessment using ground
penetrating radar,” Journal of Geotechnical and Geoenvironmental Engineering,
vol. 136, no. 1, pp. 207–213, 2010.
7. Ekenel, M. & Myers, J. (2011). Nondestructive Evaluation of RC Structures
Strengthened with CFRP Laminates Containing Near-Surface Defects in the form
of Delaminations. Science and Engineering of Composite Materials, 14(4), pp.
299-316. Retrieved 31 Jan. 2018, from doi:10.1515/SECM.2007.14.4.299
8. Frédéric Taillade, Marc Quiertant, Karim Benzarti, Jean Dumoulin, Christophe
Aubagnac. Non-destructive Evaluation of CFRP Strengthening Systems Bonded
on RC Structures Using Pulsed Stimulated Infrared Thermography, In: Infrared
Thermography, Chapter 9. Non-destructive Evaluation of CFRP Strengthening
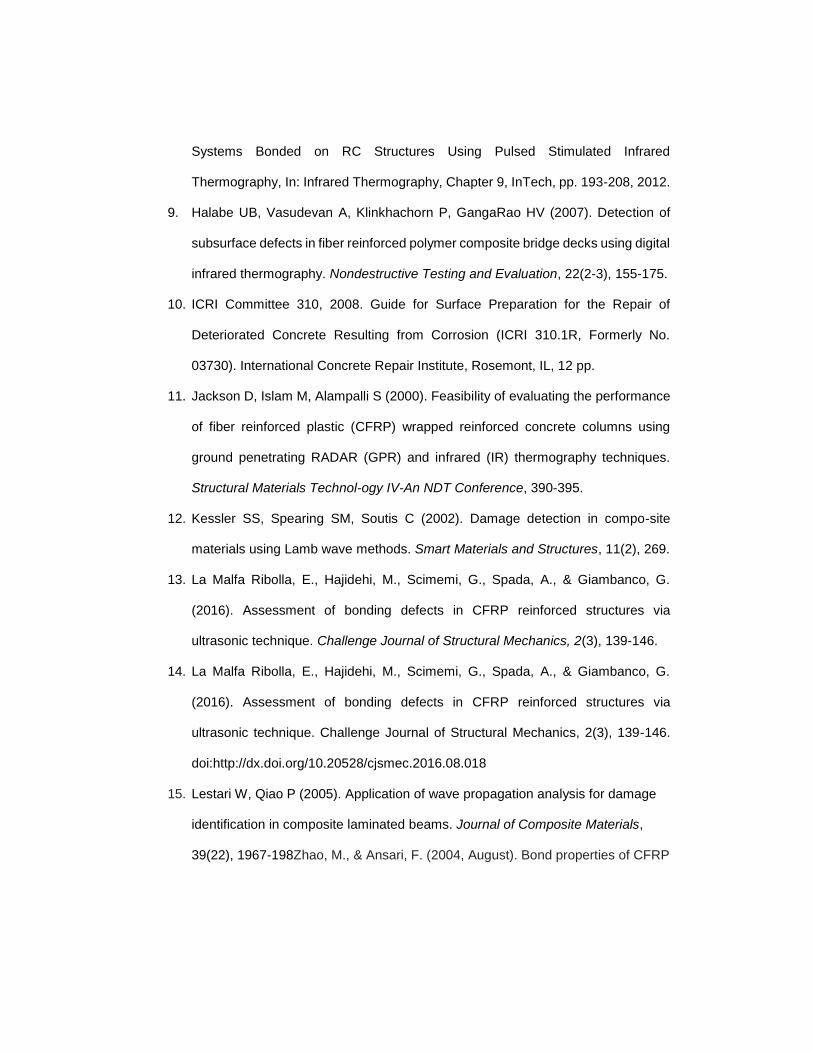
Systems Bonded on RC Structures Using Pulsed Stimulated Infrared
Thermography, In: Infrared Thermography, Chapter 9, InTech, pp. 193-208, 2012.
9. Halabe UB, Vasudevan A, Klinkhachorn P, GangaRao HV (2007). Detection of
subsurface defects in fiber reinforced polymer composite bridge decks using digital
infrared thermography. Nondestructive Testing and Evaluation, 22(2-3), 155-175.
10. ICRI Committee 310, 2008. Guide for Surface Preparation for the Repair of
Deteriorated Concrete Resulting from Corrosion (ICRI 310.1R, Formerly No.
03730). International Concrete Repair Institute, Rosemont, IL, 12 pp.
11. Jackson D, Islam M, Alampalli S (2000). Feasibility of evaluating the performance
of fiber reinforced plastic (CFRP) wrapped reinforced concrete columns using
ground penetrating RADAR (GPR) and infrared (IR) thermography techniques.
Structural Materials Technol-ogy IV-An NDT Conference, 390-395.
12. Kessler SS, Spearing SM, Soutis C (2002). Damage detection in compo-site
materials using Lamb wave methods. Smart Materials and Structures, 11(2), 269.
13. La Malfa Ribolla, E., Hajidehi, M., Scimemi, G., Spada, A., & Giambanco, G.
(2016). Assessment of bonding defects in CFRP reinforced structures via
ultrasonic technique. Challenge Journal of Structural Mechanics, 2(3), 139-146.
14. La Malfa Ribolla, E., Hajidehi, M., Scimemi, G., Spada, A., & Giambanco, G.
(2016). Assessment of bonding defects in CFRP reinforced structures via
ultrasonic technique. Challenge Journal of Structural Mechanics, 2(3), 139-146.
doi:http://dx.doi.org/10.20528/cjsmec.2016.08.018
15. Lestari W, Qiao P (2005). Application of wave propagation analysis for damage
identification in composite laminated beams. Journal of Composite Materials,
39(22), 1967-198Zhao, M., & Ansari, F. (2004, August). Bond properties of CFRP

fabrics and concrete joints. In 13th world conference on earthquake engineering,
Vancouver, BC, Canada, Paper (No. 35).
16. PROCEQ Pundit PL “Link” software 3.0, 2017
17. Mabry NJ, Peters KJ, Seracino R. Depth detection of bond defects in multilayered
externally bonded CFRP-to-concrete using pulse phase thermography. J Compos
Constr. 2015;19(6):04015002.
18. Rajan Sen, Developments in the durability of CFRP-concrete bond, Construction
and Building Materials, Volume 78, 2015, Pages 112-125,
19. RADAN 7 (2014 ) [Computer software]. Salem, NH, Geophysical Survey Systems
(GSSI).
20. S. Bagavathiappan, B.B. Lahiri, T. Saravanan, John Philip, T. Jayakumar, Infrared
thermography for condition monitoring – A review, Infrared Physics & Technology,
Volume 60, 2013, Pages 35-55, ISSN 1350-4495,
http://www.sciencedirect.com/science/article/pii/S1350449513000327)
21. Sanchez, K. and Tarranza, N. I. (2014). “Reliability of Rebound Hammer Test in
Concrete Compressive Strength Estimation.” Int'l Journal of Advances in
Agricultural & Environmental Engg. (IJAAEE), Vol. 1, Issue 2, pp. 198-202.
22. Sankaran, Apurva & Bhuvaneshwari, Balasubramaniam & Srinivasan,
Maheswaran & A.S., Santhi & Iyer, Nagesh. (2012). Application of Multi-layer
Composites in Construction and their Future Challenges
23. Scheers, Bart. (2001). Ultra-wideband ground penetrating radar with application to
the detection of anti personnel landmines.
24. Shih JKC, Tann DB, Hu CW, Delpak R, Andreou E (2003). Remote sens-ing of air
blisters in concrete-CFRP bond layer using IR thermogra-phy. International
Journal of Materials and Product Technology, 19(1-2), 174-187.

25. Su Z, Ye L, Lu Y (2006). Guided Lamb waves for identification of damage in
composite structures: A review. Journal of Sound and Vibration, 295(3), 753-780
26. Teng J., Chen J., "Debonding Failures of RC beams strengthened with externally
bonded CFRP reinforcement: Behaviours and Modelling," 2007.
27. Teng JG et al. CFRP composites in civil engineering. Hong Kong: Elsevier; 2001
28. Tzu-Yang Yu, Oral Büyüköztürk, A far-field airborne radar NDT technique for
detecting debonding in GCFRP–retrofitted concrete structures, NDT & E
International, Volume 41, Issue 1, 2008, Pages 10-24,
29. Valluzzi, M. R., Grinzato, E., Pellegerino, C., and Modena, C. (2009). “IR
thermography for interface analysis of CFRP laminates externally bonded to RC
beams.” Mater. Struct., 42(1), 25–34.
30. Wikipedia contributors. (2016, December 7). Schmidt hammer. In Wikipedia, The
Free Encyclopedia. Retrieved 02:17, March 7, 2018,
from https://en.wikipedia.org/w/index.php?title=Schmidt_hammer&oldid=7535372
56
31. Zhao, M., & Ansari, F. (2004, August). Bond properties of CFRP fabrics and
concrete joints. In 13th world conference on earthquake engineering, Vancouver,
BC, Canada, Paper (No. 35).

Biographical Information
Ankita A Lad is a Structural Engineering Masters student at The University of Texas at
Arlington. She received her bachelor’s degree in Civil Engineering from Mumbai
University, India in 2015. She worked as a trainee design engineer at SpaceAge
Architects and Structural Consultants, Mumbai, India from June 2015 to July 2016. She
worked as a Graduate Research Assistant under the guidance of Dr. Nur Yazdani during
her graduate studies. She was the Treasurer for Structural Engineering Institute, Graduate
Student Chapter at UTA for the year 2017-2018 and an active member of the Chi Epsilon
Civil Engineering Honor Society. She was awarded with the Outstanding Graduate
Student of the year award by the Civil Engineering Department at UT Arlington in the year
2018.
Related Documents