QPM Devices in KTA and RKTP Andrius Žukauskas Doctoral Thesis Department of Applied Physics KTH – Royal Institute of Technology Stockholm, Sweden 2014

Welcome message from author
This document is posted to help you gain knowledge. Please leave a comment to let me know what you think about it! Share it to your friends and learn new things together.
Transcript

QPM Devices in KTA and RKTP
Andrius Žukauskas
Doctoral Thesis
Department of Applied Physics
KTH – Royal Institute of Technology
Stockholm, Sweden 2014

QPM Devices in KTA and RKTP
© Andrius Zukauskas, 2014
Laser Physics
Department of Applied Physics
KTH – Royal Institute of Technology
106 91 Stockholm
ISBN 978-91-7501-974-1
TRITA-FYS 2013:71
ISSN 0280-316X
ISRN KTH/FYS/--13:71--SE
Akademisk avhandling som med tillstånd av Kungliga Tekniska Högskolan
framlägges till offentlig granskning för avläggande av teknologie doktorsexamen
fredagen, den 31 Januari 2014, Albanova, Roslagstullsbacken 21, KTH, Stockholm.
Avhandlingen kommer att försvaras på engelska.
Cover picture: QPM crystals with 5 mm, 3 mm and 1 mm apertures
Printed by Universitetsservice US AB, Stockholm 2014

iii
Andrius Zukauskas
QPM Devices in KTA and RKTP
Department of Applied Physics, KTH – Royal Institute of Technology
106 91 Stockholm, Sweden
ISBN 978-91-7501-974-1
Abstract
Even though KTiOPO4 (KTP) is considered to be one of the best nonlinear materials for quasi-
phase matched (QPM) frequency conversion in the visible and the near-infrared spectral regions,
its use is often limited by poor material homogeneity, high ionic conductivity, a considerable
linear absorption and photochromatic damage. On the other hand, the improved material
homogeneity and the lower ionic conductivity of bulk Rb-doped KTP (RKTP) make this material
an ideal alternative for fabrication of fine-pitch QPM gratings, while the arsenate isomorph
KTiOAsO4 (KTA) promises a better performance in the green spectral region and adds the
advantage of a wider transparency window in the infrared. Unfortunately, the available studies on
these materials are limited and unable to answer the question whether RKTP and KTA are
feasible alternatives to KTP in terms of periodic poling and optical performance.
The optical performance of the QPM devices depends on the periodic poling quality,
therefore, a detailed comprehension of domain-grating formation in the KTP isomorphs is highly
desired. The goals of this thesis were to gain a better understanding of the periodic poling process
in the KTP isomorphs, in order to study the specifics of ferroelectric domain engineering in KTA
and RKTP, and to evaluate the optical performance of these isomorphs. Fine-pitch periodically-
poled structures were engineered both in KTA and RKTP crystals. It was demonstrated that QPM
gratings with excellent quality and with periods as short as 8.49 μm can be fabricated in KTA
crystals. Comparative transmission studies have shown that periodically poled KTA (PPKTA)
crystals can be superior to KTP for QPM second harmonic generation in the visible spectral
region due to lower linear absorption.
It was also demonstrated that RKTP is a superior alternative to KTP for high-quality QPM
grating fabrication. A consistent room-temperature periodic poling of 5 mm thick RKTP crystals
with a period of 38.86 μm has been achieved. The obtained large aperture periodically poled
RKTP (PPRKTP) crystals showed an outstanding QPM grating uniformity and excellent optical
performance in optical parametric oscillator (OPO) applications. Moreover, it was shown that
RKTP is less susceptible to blue-induced infrared absorption than KTP.
Finally, a novel and a relatively simple method for self-assembling quasi-periodic sub-μm
scale ferroelectric domain structure in RKTP crystals has been presented. It was shown that, after
treatment in aqueous KOH/KNO3 solution, periodic poling of RKTP with planar electrodes
resulted in one-dimensional ferroelectric domain structure with an average periodicity of
650±200 nm, extending over the whole 1 mm thick crystal. Such self-assembled structures in
RKTP were used to demonstrate 5th
order non-collinear QPM backward second harmonic
generation.

iv
Sammanfattning
Kaliumtitanylfosfat (KTiOPO4, KTP) anses allmänt vara ett av de bästa ickelinjära optiska
materialen för kvasifasanpassad (QPM) frekvenskonvertering i det synliga och nära-infraröda
våglängdsområdet. Materialets användbarhet begränsas dock ofta av den höga andelen K-
vakanser och materialdefekter vilket leder till hög ledningsförmåga. Vidare har KTP en relativt
hög linjär absorption i det synliga området och relativt låg intensitetbroende skadetröskel.
Rubidiumdopad KTP (RKTP), med dess lägre defektkoncentration och ledningsförmåga är ett
bättre alternativ vid tillverkning av domängitter med korta perioder, medan isomorfen KTiOAsO4
(KTA) ger bättre prestanda i det gröna våglängdsområdet samt utökad transmission i det
infraröda våglängdsområdet. Tidigare har dessa material inte studerats i någon större utsträckning
och det var då oklart om RKTP och KTA är lämpliga alternativ till KTP vad gäller periodisk
polning och optisk prestanda.
Vid QPM används s.k. periodiskt polade kristaller för vilka frekvenskonverteringens
verkningsgrad och den frekvenskonverterade strålens optiska kvalitet beror på det skapade
domängittrets kvalitet. Därför vore det önskvärt med en djupare förståelse för hur domängitter
skapas i KTP-isomorfer under periodisk polning. I detta syfte har polningsprocessen i KTP och
dess isomorfer, KTA och RKTP studerats och den optiska kvaliteten hos de skapade
domängittren har undersökts. Domängitter med korta perioder har skapats i både KTA och
RKTP, och i fallet KTA har det visats att homogena gitter med en period så kort som 8.49 µm
kan tillverkas. En jämförande studie av domängittren skapade i de olika kristallerna har visat att
KTA är överlägset KTP för frekvensdubbling i det synliga våglängdsområdet p.g.a. dess lägre
linjära absorption.
I avhandlingen visas också att RKTP är överlägset KTP för skapande av domängitter av hög
kvalitet. Homogena gitter med 38,6 µm periodicitet har skapats i 5 mm tjocka kristaller genom
polning vid rumstemperatur. Kristallerna har använts i för frekvenskonvertering i en optisk
parametrisk oscillator och har uppvisat hög och jämn kvalitet längs hela kristallens tjocklek
samtidigt so de hade hög optisk prestanda. Det har även visats att RKTP är mindre känsligt för
infraröd absorption inducerat av blått ljus än KTP.
Slutligen har en ny, relativt enkel metod för skapande av självorganiserade kvasiperiodiska
domänstrukturer med domänstorlekar under 1 µm i RKTP demonstrerats. Kristallytorna
behandlas med KOH/KNO3 i vattenlösning, följt av polning med plana elektroder vilket ger
upphov till en kvasiperiodisk domänstruktur med genomsnittliga perioder mellan 500 nm och 700
nm över hela kristallens tjocklek. Dessa självorganiserade strukturer i RKTP användes för att visa
femte ordningens QPM åstakomma kolinjär, motpropagerande frekvensdubbling.
v
Preface
The research described in this thesis has been performed in the Laser Physics group, of the
Applied Physics department at KTH (Royal Institute of Technology), in Stockholm, between
2009 and 2013.
This work has been in part funded by the Swedish Research Council (VR) through the
Linnaeus Center of Excellence ADOPT, the Swedish Foundation for Strategic Research (SSF),
the Göran Gustafsson Foundation, the Carl Trygger Foundation, and the EC FP7 project
MIRSURG under Grant No. 224042.

vi

vii
List of Publications
This thesis is based on the following journal papers:
I. A. Zukauskas, N. Thilmann, V. Pasiskevicius, F. Laurell, and C. Canalias, “Periodically
poled KTiOAsO4 for highly-efficient mid-infrared optical parametric devices,” Appl. Phys
Lett. 95, 191103 (2009).
II. A. Zukauskas, N. Thilmann, V. Pasiskevicius, F. Laurell, and C. Canalias, “5 mm thick
periodically poled Rb-doped KTP for high energy optical parametric frequency
conversion”, Opt. Mat. Express 1, 201-206 (2011).
III. A. Zukauskas, G. Strömqvist, V. Pasiskevicius, F. Laurell, M. Fokine, and C. Canalias,
“Fabrication of submicrometer quasi-phase-matched devices in KTP and RKTP,” Opt. Mat.
Express 1, 1319-1325 (2011).
IV. A. Zukauskas, V. Pasiskevicius, and C. Canalias, "Second-harmonic generation in
periodically poled bulk Rb-doped KTiOPO4 below 400 nm at high peak-intensities," Opt.
Express 21, 1395-1403 (2013).
V. A. Zukauskas, V. Pasiskevicius, F. Laurell, and C. Canalias, “High-fidelity periodic
domain structures in KTiOAsO4 for the visible spectral range,” Opt. Mat. Express 3, 1444-
1449 (2013).
VI. A. Zukauskas, V. Pasiskevicius, and C. Canalias, “Quasi-periodic self-assembled sub-μm
ferroelectric bulk domain gratings in Rb-doped KTiOPO4,” accepted for publication in
Applied Physics Letters.
VII. P. Zeil, A. Zukauskas, S. Tjörnhammar, C. Canalias, V. Pasiskevicius, and F. Laurell,
”High-power continuous-wave frequency-doubling in KTiOAsO4,” Opt. Express 21,
30453-30459 (2013).

viii
Description of Author Contribution
My contribution to the original papers has been the following:
Paper I
I periodically poled the KTA crystals, participated in the optical evaluation experiments,
discussions and the writing of the paper.
Paper II
I periodically poled the large aperture crystals, participated in the optical evaluation experiments,
discussions and the writing of the paper.
Paper III
I participated in the sample preparation, periodic poling, discussions and the writing of the paper.
Paper IV
I periodically poled the crystals, participated in the optical evaluation experiments, discussions
and the writing of the paper.
Paper V
I periodically poled the crystals, performed the optical evaluation experiments, participated in the
discussions and the writing of the paper.
Paper VI
I did the sample preparation, poling, and the optical evaluation experiments, participated in
discussions and the writing of the paper.
Paper VII
I provided the periodically poled KTA samples, participated in the discussions and the writing of
the paper.

ix
Related Publications not Included in the Thesis
A. Zukauskas, N. Thilmann, V. Pasiskevicius, F. Laurell, and C. Canalias, ”Periodically A.
Poled KTiOAsO4 For Mid-Infrared Light Generation,” Advanced Solid State Photonics
(ASSP 2010), San Diego, USA, January 31 – February 3 (2010), AMC6.
A. Zukauskas, V. Pasiskevicius, F. Laurell, and C. Canalias, ”Grey-Track Resistant B.
Periodically Poled Rb-doped KTiOPO4 For Blue-Light Generation,” Conference on
Lasers and Electro-Optics (CLEO 2010), San Jose, USA, May 16-21 (2010), CMG3.
A. Zukauskas, V. Pasiskevicius, F. Laurell, C. Canalias, M. Safinas, and A. Michailovas, C.
”High-Performance Periodically Poled Rb-doped KTP For Frequency Conversion In
Blue/Green Region,” Europhoton 2010, Hamburg, Germany, August 29 – September 3
(2010), FrA4.
N.Thilmann, G. Strömqvist, A. Zukauskas, B. Jacobsson, C. Canalias, V. Pasiskevicius, D.
and F. Laurell, "Optical parametric oscillator at 2.1 µm with large aperture periodically
poled KTiOPO4," Europhoton 2010, Hamburg, Germany, August 29 – September 3
(2010).
F. Masiello, T. A. Lafford, P. Pernot, J. Baruchel, D. S. Keeble, P. A. Thomas, E.
A. Zukauskas, G. Strömqvist, F. Laurell, and C. Canalias, "Investigation by coherent X-
ray section topography of ferroelectric domain behavior as a function of temperature in
periodically poled Rb:KTP," J. Appl. Cryst. 44, 462-466 (2011).
A. Zukauskas, N. Thilmann, V. Pasiskevicius, F. Laurell, and C. Canalias, ”5 mm Thick F.
Periodically Poled Rb:KTiOPO4 for High Power Optical Frequency Conversion,”
Advanced Solid State Photonics (ASSP 2011), Istanbul, Turkey, February 13-16 (2011),
JWB1.
A. Zukauskas, N. Thilmann, V. Pasiskevicius, F. Laurell, and C. Canalias, ”High Fidelity G.
Large Aperture Periodically Poled Rb:KTiOPO4 for High Energy Frequency
Conversion,” Conference on Lasers and Electro-Optics (CLEO 2011), Baltimore, USA,
May 1-6 (2011), CTuE6.
C. Canalias, A. Zukauskas, V. Pasiskevicius, and F. Laurell, "Submicrometer QPM H.
devices," Nonlinear Optics: Materials, Fundamentals and Applications, 2011.
U. Eismann, F. Gerbier, C. Canalias, A. Zukauskas, G. Trenec, J. Vigue, F. Chevy, and I.
C. Salomon, "An all-solid-state laser source at 671 nm for cold-atom experiments with
lithium," Appl. Phys. B 106, 25-36 (2012).
G. Stoeppler, N. Thilmann, V. Pasiskevicius, A. Zukauskas, C. Canalias, and J.
M. Eichhorn, "Tunable mid-infrared ZnGeP2 RISTRA OPO pumped by periodically-
poled Rb:KTP optic parametric master-oscillator power amplifier," Opt. Express 20,
4509-4517 (2012).
A. Zukauskas, V. Pasiskevicius, F. Laurell and C. Canalias, "Self-Assembled K.
Ferroelectric Nano-Domain Gratings in Bulk RKTP", Conference on Lasers and Electro-
Optics (CLEO 2012), San Jose, USA, May 6-11 (2012), CTh4D.4.

x
A. Zukauskas, C. Liljestrand, V. Pasiskevicius, F. Laurell and C. Canalias, "Progress in L.
Fabrication of sub-μm QPM Devices in Bulk Rb-doped KTP", Europhoton 2012,
Stockholm, Sweden, August 26-31 (2012), TuA.3.
N. Thilmann, G. Stoeppler, M. Eichhorn, V. Pasiskevicius, A. Zukauskas, and M.
C. Canalias, "ZnGeP2 RISTRA OPO in the mid-IR region pumped by a periodically poled
KTiOPO4 master-oscillator power amplifier," Europhoton 2012, Stockholm, Sweden,
August 26-31 (2012), TuA.4.
A. Zukauskas, V. Pasiskevicius, F. Laurell, and C. Canalias, “Periodically Poled N.
KTiOAsO4 for Second Harmonic Generation in the Green Region,” Conference on Lasers
and Electro-Optics (CLEO 2013), San Jose, USA, June 9-14 (2013), CW3B.3.
H. Kianirad, A. Zukauskas, T. Frisk, C. Canalias, and F. Laurell, “Contact poling of O.
RKTP with silicon needles,” in Conference on Lasers and Electro-Optics Europe (CLEO
Europe 2013), Munich, Germany, May 12-16 (2013), CD-7.6 MON.
C. Canalias, A. Zukauskas, C. Liljestrand, V. Pasiskevicius, and F. Laurell, “Sub-P.
wavelength Domain Engineering in KTP isomorphs: QPM Devices with Counter-
propagating Photons,” Conference on Lasers and Electro-Optics Pacific Rim (CLEO-PR
2013), Kyoto, Japan, June 30 – July 4 (2013), WA3-1.
P. Zeil, A. Zukauskas, C. Canalias, V. Pasiskevicius, and F. Laurell, “High-power Q.
continuous-wave frequency -doubling in KTiOAsO4,” in Advanced Solid-State Lasers,
ASSL 2013, (Optical Society of America, 2013), AM3A.4.
K. Seger, N. Meiser, S. Tjörnhammar, A. Zukauskas, C. Canalias, V. Pasiskevicius, and R.
F. Laurell, ” Intra-cavity frequency-doubled Yb:KYW laser using periodically poled Rb-
doped KTP with a volume Bragg grating input coupler,” Appl. Phys. B., DOI
10.1007/s00340-013-5587-y.

xi
Acknowledgements
This thesis is a final product of my study years at KTH and I would like to express my greatest
gratitude to the people who have helped and supported me throughout this project.
First of all, I would like to offer a special thanks to my main supervisor Dr. Carlota Canalias
for introducing and guiding me through the path of KTP and periodic poling. I appreciate your
excellent knowledge and enthusiasm which you have shared with me during those numerous
hours in the lab. It is always a pleasure to have interresting discussions with you, both within and
outside the field of periodic poling. I am also very grateful for the priceless support you provided
during my research as well as criticism and advices which helped me to grow as a researcher.
I would also like to thank professor Valdas Pasiskevicius and professor Fredrik Laurell for
accepting me as a PhD student in the Laser Physics group and providing priceless support and
feedback during these five years.
I would like to express my gratitude to professor emeritus Jens A. Tellefsen for enthusiasm
and valuable knowledge of English language that you kindly shared with me by proof-reading
this thesis.
I am grateful to my colleagues: Nicky Thilmann, Hoon Jang, Peter Zeil, Hoda Kianirad,
Charlotte Liljestrand, Gustav Lindgren, Kai Seger, Niels Meiser, Dr. Michael Fokine and Dr.
Gustav Strömqvist for fruitful collaborations, shared experiments and nice discussions.
A special thanks goes to Staffan Tjörnhammar for being a nice office mate, and for
interresting discussions about science and life.
Mårten Stjernström – one of the nicest persons I ever met in my life – I will never forget you.
Additionally, I would also like to thank Algis Stalnionis for waking my interrest in nonlinear
optics and pointing me in the right direction.
I am grateful to Tautvydas Lisauskas for numerous conversations about the PhD student’s life
and life in general during these five years.
I am also very grateful to my parents, my brother, my grandmother, my parents in law, and the
rest of the family for their moral support.
Last, but not least, I would like to thank my beloved wife Agnė, who has always been by my
side providing me with love and understanding. Thank you dear for believing in me, I hardly
could have done it without you.

xii

xiii
Contents
CHAPTER 1. INTRODUCTION 1
1.1. BACKGROUND AND MOTIVATION 1
1.2. THESIS STRUCTURE 3
REFERENCES 4
CHAPTER 2. BASIC PRINCIPLES OF NONLINEAR OPTICS 7
2.1. NATURE OF NONLINEAR PROCESSES 7
2.2. SECOND ORDER NONLINEAR PROCESSES 8
2.3. SECOND ORDER NONLINEAR COEFFICIENTS 10
2.4. COUPLED WAVE EQUATIONS 10
2.5. PHASE MATCHING 12
2.6. BIREFRINGENT PHASE MATCHING 14
2.7. QUASI-PHASE MATCHING 15
2.8. QPM SHG TUNING AND TOLERANCES 18
2.9. OPTIMAL FOCUSING WITH GAUSSIAN BEAMS 19
2.10. OPTICAL PARAMETRIC OSCILLATORS 20
REFERENCES 22
CHAPTER 3. FERROELECTRICS 23
3.1. CRYSTAL SYMMETRY 23
3.2. FERROELECTRIC MATERIALS 24
3.3. POLARIZATION REVERSAL 28
3.4. ROLE OF DEFECTS 30
REFERENCES 32
CHAPTER 4. KTP, RKTP AND KTA 35
4.1. INTRODUCTION 35
4.2. CRYSTAL STRUCTURE 35
4.3. CRYSTAL GROWTH 38
4.4. IONIC CONDUCTIVITY 39
4.5. OPTICAL PROPERTIES 41
4.6. SELLMEIER EQUATIONS 44
REFERENCES 47

xiv
CHAPTER 5. PERIODIC POLING OF THE KTP ISOMORPHS 51
5.1. INTRODUCTION 51
5.2. POLARIZATION SWITCHING CHARACTERISTICS IN THE KTP ISOMORPHS 51
5.3. DOMAIN BROADENING 56
5.4. SAMPLE PREPARATION 58
5.5. ELECTRIC FIELD POLING SETUP 59
5.6. ELECTRIC FIELD PULSE OPTIMIZATION 61
5.7. SAMPLE CHARACTERIZATION 64
REFERENCES 65
CHAPTER 6. PERIODIC DOMAIN STRUCTURES IN KTA 67
6.1. KTA AS A NONLINEAR MEDIUM 67
6.2. PERIODIC POLING OF KTA 67
6.3. PPKTA-BASED OPO 69
6.4. PPKTA FOR SECOND HARMONIC GENERATION 70
6.5. TEMPERATURE TUNING CHARACTERISTICS 73
REFERENCES 76
CHAPTER 7. LARGE APERTURE QPM DEVICES 77
7.1. LARGE APERTURE NONLINEAR CRYSTALS 77
7.2. PERIODIC POLING OF 5 MM THICK RKTP CRYSTALS 77
7.3. LARGE APERTURE PPRKTP OPO PERFORMANCE 80
REFERENCES 82
CHAPTER 8. SHORT-PERIOD QPM DEVICES FOR BLUE LIGHT GENERATION 83
8.1. NEED OF SHORT-PERIOD QPM STRUCTURES 83
8.2. PERIODIC POLING OF SHORT-PERIOD QPM STRUCTURES 83
8.3. FREQUENCY CONVERSION IN THE BLUE REGION 84
REFERENCES 88
CHAPTER 9. SUB-ΜM QPM DEVICES 89
9.1. INTRODUCTION 89
9.2. PERIODIC POLING OF SUB-ΜM QPM DEVICES 89
9.3. SELF-ASSEMBLED SUB-ΜM DOMAINS IN RKTP 91
REFERENCES 95
CHAPTER 10. CONCLUSIONS 97
1
Chapter 1. Introduction
1.1. Background and Motivation
The field of nonlinear optics emerged in 1961 with the first demonstration of second harmonic
generation (SHG) [1.1], and developed very quickly, resulting in a wide range of applications
both in fundamental research and in everyday life applications. Recent decades saw great
progress both in designing new coherent radiation sources based on nonlinear optical frequency
conversion, and in the development of new nonlinear materials which enabled the use of
nonlinear optics in areas such as biology, medicine, spectroscopy, remote sensing, material
processing, quantum optics, aerospace and defense applications. Indeed, nonlinear optical
frequency conversion is one of the best and, sometimes, the only way to achieve coherent
electromagnetic radiation in spectral regions where other coherent radiation sources are not
available or lack technological advancement. Today, this is an active field of research, constantly
demanding further development of nonlinear optical materials.
In order to ensure an efficient nonlinear frequency conversion, a proper phase relationship
must be maintained between the interacting waves. This condition, known as phase matching, is
not automatically fulfilled; therefore, several techniques have been developed to make efficient
frequency conversion possible. The most commonly used method, so-called birefringent phase
matching, relies on the material’s birefringence in order to ensure an efficient power flow from
the pump to the generated waves. Unfortunately, this technique suffers from several drawbacks
including Poynting vector walkoff, polarization dependent nonlinearity, and limited frequency
conversion spectral range.
Quasi-phase matching (QPM) is an alternative phase matching technique, which ensures
efficient energy coupling between the interacting waves during the frequency conversion process
and is essentially free of the drawbacks present in birefringent phase matching. Flexibility is
perhaps the main advantage of QPM. It allows implementing any nonlinear interaction within the
transparency range of the material at any temperature and for any set of polarizations of the
interacting waves by appropriately designing the QPM structure. Moreover, it enables nonlinear
interactions involving counter-propagating waves, which cannot be realized relying solely on the
material’s birefringence. Examples of these interactions are backward second harmonic
generation, mirrorless optical parametric oscillators [1.2] and amplifiers, etc. QPM relies on
periodic structuring of the material nonlinearity in order to reset the accumulated phase mismatch
between the interacting waves every coherence length. Various methods to implement quasi-
phase matching exist, including the growth of the orientation-patterned nonlinear materials [1.3],
and different types of poling techniques [1.4-1.56]. Today, the most extensively used way to
implement QPM is electric field poling of ferroelectric oxide crystals. Electric field poling was
first demonstrated in 1993 in LiNbO3 (LN) [1.6], and since then, LiNbO3 and LiTaO3 (LT) have
become the most intensively investigated and used materials for periodic poling. Those materials
present some attractive properties, such as relatively high nonlinearity, wide transparency range,

1.1. Background and Motivation
2
commercial availability, and widely investigated periodic poling techniques, which are also
relatively standardized today. Despite all the advantages, some serious drawbacks with those
materials became apparent. One of the problems is photorefractive damage, which limits the use
of LN to relatively low power applications. Another issue is a high coercive field (~21 kV/mm in
congruent LN), limiting the possible apertures of QPM devices based on congruent LN to 0.5
mm. Considerable efforts in the area of crystal growth have resulted in the development of
stoichiometric LN and LT crystals with substantially reduced coercive fields and improved
optical properties. Later, developments in vapor transport equilibration (VTE) technique allowed
the preparation of LN [1.7] and LT [1.8] crystals with near-stoichiometric compositions in a
controlled manner. Doping with MgO resulted in improved resistance to photorefractive damage
in those crystals. However, a trigonal crystal structure of LN and LT crystals favors hexagonal or
triangular domain shapes, making the fabrication of one-dimensional QPM gratings with periods
below 7 μm and apertures >300 μm extremely difficult.
KTiOPO4 (KTP) has also been extensively used for fabrication of QPM devices via electric
field periodic poling. This material is considered to be one of the best for frequency conversion in
the visible and the near-infrared spectral regions because of its good mechanical and thermal
properties, as well as a high nonlinearity, absence of photorefraction and relatively high optical
damage threshold. A wide transparency range of this material (0.35 – 4.3 μm) makes it an ideal
candidate for 1-μm-pumped QPM second harmonic generation (SHG) and optical parametric
oscillator (OPO) applications. The transmission window of the arsenate isomorphs extends the
available spectral range further to ~5.2 μm in the infrared region. The relatively low coercive
field of the KTP isomorphs allows, in principle, fabrication of large aperture QPM devices.
Moreover, their orthorhombic crystal structure and the large anisotropy of the ferroelectric
domain propagation velocities favor periodic poling of fine-pitch, high aspect ratio, one-
dimensional QPM structures.
Clearly, KTP has established itself as a good nonlinear medium for QPM applications,
however, it still suffers from serious drawbacks such as high ionic conductivity and
unsatisfactory material homogeneity, which influence the quality of the periodic poling. In
addition, photochromic damage and a considerable linear absorption in the green spectral region
have detrimental effects on the optical performance of KTP.
On the other hand, its arsenate isomorph KTiOAsO4 (KTA) promises a better performance for
green-light generation due to the improved power handling properties [1.9], and a substantially
reduced optical absorption at 532 nm. Unfortunately, the use of KTA for SHG applications
involving birefringent type II phase matching is limited by a SHG wavelength cut-off around
1075 nm [1.10]. The potential of KTA for QPM applications in the visible region remains
unexplored due to the difficulties in implementing short-period QPM structures. Moreover, due
to the extended transmission range in the infrared spectral region, KTA also seems to be an ideal
candidate for 1 μm-pumped QPM OPO devices operating between 2 μm and 5 μm, which are
important for spectroscopy and sensing [1.11], directed countermeasures, or few-cycle
femtosecond pulse generation [1.12]. Additionally, employing such OPOs in cascaded schemes
[1.13] allows reaching the 6-12 μm spectral region, covering the second atmospheric

Chapter 1. Introduction
3
transmission window and the vibrational absorption bands of some biologically important organic
molecules. Nevertheless, the limited number of available studies on periodic poling of KTA does
not answer whether it is feasible to implement QPM in this material.
Recently, bulk Rb-doped KTP (RKTP) with a Rb doping of 0.3 % has been commercialized.
Due to its relatively low ionic conductivity, it appears to be a better candidate for fabrication of
high aspect-ratio ferroelectric domain gratings, and the improved homogeneity of this material
promises higher poling yield. This is beneficial for obtaining large aperture QPM devices, which
can be used for high-energy OPOs with applications in such areas as biology and medicine
[1.14], or material processing [1.15]. Moreover, RKTP is also interesting for fabrication of fine
pitch, particularly sub-μm, QPM structures. Such structures can be employed to implement
nonlinear interactions involving counter-propagating photons, paving the way to applications
such as all-optical switching components [1.1617-1.18], tunable slow-light structures [1.19], and
ultra-bright, backward-wave biphoton sources for quantum information processing [1.20]. In
addition, a lower susceptibility to gray-tracking promises a better performance of this material in
the blue spectral region. Unfortunately, despite the superior properties of RKTP, a very limited
amount of studies of this material is available to date.
The aim of this thesis was to develop periodically poled QPM devices based on RKTP and
KTA crystals, as well as to assess their performance. A relatively simple fabrication method of
fine ferroelectric-domain gratings in these materials was established through the optimization of
the periodic poling procedure. This has enabled fabrication of bulk sub-μm ferroelectric domain
gratings in RKTP, demonstrating that this material is excellent for short-period QPM devices. In
addition, periodic poling of 5 mm thick PPRKTP crystals has shown that this material is also the
best choice for large aperture QPM device fabrication. The ability to achieve consistent periodic
poling in KTA has clearly demonstrated that it can be superior to ordinary KTP both in OPO
applications aiming to reach wavelengths of up to 5 μm in the mid-infrared spectral region, and in
SHG applications pumped by 1 μm light.
1.2. Thesis structure
This thesis is structured as follows: Chapter 2 describes the basic principles of nonlinear optics,
including quasi-phase matching, which is a key concept behind the ferroelectric domain
engineering for nonlinear optical applications. Chapter 3 introduces the principles of crystal
symmetry, ferroelectricity, and polarization switching in ferroelectrics, which are important for
understanding of ferroelectric domain engineering in KTP. In Chapter 4, the most important
physical properties of the KTP isomorphs are described. Chapter 5 introduces the electric field
poling technique and outlines the specifics of the periodic poling of the KTP isomorphs. Chapter
6 describes the periodic poling of KTA for OPO and SHG applications. In Chapter 7 fabrication
and evaluation of 5 mm thick PPRKTP crystals are detailed. Chapter 8 introduces fabrication of
short period QPM structures with large aspect ratios in 1 mm thick crystals for blue light
generation. In Chapter 9, periodic poling of sub-μm QPM structures and self-assembled domain
structures in RKTP is reported.
4
References 1.1. P. A. Franken, A. E. Hill, C. W. Peters, and G. Weinreich, “Generation of optical harmonics,” Phys. Rev. Lett.
7, 118 (1961).
1.2. C. Canalias and V. Pasiskevicius, “Mirrorless optical parametric oscillator,” Nature Photonics 1, 459-462
(2007).
1.3. C. B. Ebert, L. A. Eyres, M. M. Fejer, and J. S. Harris, Jr., “MBE of antiphase GaAs films using GaAs/Ge/GaAs
heteroepitaxy,” J. Crystal Growth, 201/202, 187 (1999).
1.4. M. C. Gupta, W. P. Risk, A. C. G. Nutt, and S. D. Lau, ” Domain inversion in KTiOPO4 using electron beam
scanning,” Appl. Phys. Lett. 63, 1167-1169 (1993).
1.5. W. P. Risk, and S. D. Lau, “Periodic electric field poling of KTiOPO4 using chemical patterning,” Appl. Phys.
Lett. 69, 3999-4001 (1996).
1.6. M. Yamada, N. Nada, M. Saitoh, and K. Watanabe, “First‐order quasi‐phase matched LiNbO3 waveguide
periodically poled by applying an external field for efficient blue second‐harmonic generation,” Appl. Phys. Lett. 62,
435-436 (1993).
1.7. P. F. Bordui, R. G. Norwood, D. H. Jundt, and M. M. Fejer, “Preparation and characterization of off-congruent
lithium niobate crystals,” J. Appl. Phys. 71, 875-879 (1992).
1.8. M. Katz, R. K. Route, D. S. Hum, K. R. Parameswaran, G. D. Miller, and M. M. Fejer, “Vapor-transport
equilibrated near-stoichiometric lithium tantalate for frequency-conversion applications,” Opt. Lett. 29, 1775-1777
(2004).
1.9. W. R. Bosenberg, L. K. Cheng, and J. D. Bierlein, “Optical parametric frequency conversion properties of
KTiOAsO4,” Appl. Phys. Lett. 65, 2765-2767 (1994).
1.10. J. D. Bierlein, H. Vanherzeele, and A. A. Ballman, “Erratum: “Linear and nonlinear optical properties of flux‐
grown KTiOAsO4,” [Appl. Phys. Lett. 54, 783 (1989)],” Appl. Phys. Lett. 61, 3193 (1992).
1.11. A. K. Y. Ngai, S. T. Persijn, M. M. J. W. Van Herpen, S. M. Cristescu, and F. J. M. Harren, Mid-Infrared
Coherent Sources and Applications, (Springer, New York, 2008).
1.12. O. Chalus, Ph. K. Bates, M. Smolarski, and J. Biegert, “Mid-IR short-pulse OPCPA with micro-Joule energy at
100kHz,” Opt. Express 17, 3587 (2009).
1.13. M. W. Haakestad, G. Arisholm, E. Lippert, S. Nicolas, G. Rustad, and K. Stenersen, “High-pulse-energy 8 μm
laser source based on optical parametric amplification in ZnGeP2,” Proc. SPIE 6998, 699812 (2008).
1.14. V. A. Serebryakov, E. V. Boiko, N. N. Petrishchev, and A. V. Yan, “Medical applications of mid-IR lasers.
Problems and prospects,” J. Opt. Technol. 77, 6-17 (2010).
1.15. S. T. Yang, M. J. Matthews, S. Elhadj, D. Cooke, G. M. Guss, V. G. Draggoo, and P. J. Wegner, “Comparing
the use of mid-infrared versus far-infrared lasers for mitigating damage growth on fused silica,” Appl. Opt. 49, 2606-
2616 (2010).
Chapter 1. Introduction
5
1.16. G. D. Landry and T. A. Maldonaldo, “Efficient nonlinear phase shifts due to cascaded second-order processes
in a counterpropagating quasi-phase-matched configuration,” Opt. Lett. 22, 1400-1402 (1997).
1.17. G. D. Landry and T. A. Maldonaldo, “Switching and second Harmonic generation using counterpropagating
quasi-phase-matching in a mirrorless configuration,” J. Lightwave Technol. 17, 316-320 (1999).
1.18. K. Gallo, G. Assanto, K. R. Parameswaran, and M. M. Fejer, “All-optical diode in a periodically poled lithium
niobate waveguide,” Appl. Phys. Lett. 79, 314-316 (2001).
1.19. J. Khurgin, “Slowing and stopping photons using backward frequency conversion in quasi-phase-matched
waveguides,” Phys. Rev. A 72, 023810 (2005).
1.20. C.-S. Chuu and S. E. Harris, “Ultrabright backward-wave biphoton source,” Phys. Rev. A 83, 061803 (2011).

6
7
Chapter 2. Basic principles of nonlinear optics
2.1. Nature of nonlinear processes
The term “nonlinear optics” reflects the nonlinear material response to an applied optical field. In
optics, when the applied optical field strength is low, the induced polarization in a dielectric
material depends on the applied optical field linearly. For a quasi-monochromatic wave and
lossless and dispersionless medium, the induced polarization can be expressed as:
( ) ( ) ( ), (2.1.1)
where ε0 is the permittivity of free space and χ(1)
is the linear susceptibility. However, when
intense light interacts with the nonlinear medium, the material response can be extended into a
power series of ( ):
( ) [ ( ) ( ) ( ) ( ) ( ) ( ) ]
( )( ) ( )( ) ( )( ) (2.1.2)
Here, χ(2)
and χ(3)
are the second order and the third order nonlinear optical susceptibilities,
respectively. Considering the vector nature of the fields, χ(2)
is a third rank tensor and χ(3)
is a
fourth rank tensor.
Let us now consider the second order contribution to the nonlinear polarization:
( )( ) ( ) ( ) (2.1.3)
Changing the sign of ( ) should also change the sign of the nonlinear response, if we assume
inversion symmetry:
( )( ) ( )[ ( )] (2.1.4)
which is equivalent to:
( )( ) ( ) ( ) (2.1.5)
From Eq. (2.1.3) and Eq. (2.1.5) it is clear that χ(2)
should be zero in this case, therefore, second
order nonlinear optical interactions can only occur only in noncentrosymmetric crystals, whereas
third order interactions can occur both in centrosymmetric and noncentrosymmetric media.
The nonlinear processes in which the initial and final quantum mechanical states of a system
are identical, are identified as parametric [2.1]. In a parametric process, the population can be
removed from the ground state only for brief intervals of time, when it resides on a virtual level.
Processes, which involve the transfer of population from one real level to another, are known as
non-parametric. Parametric processes can always be described by a real susceptibility, whereas
2.2. Second order nonlinear processes
8
for non-parametric processes, the susceptibility is complex. The photon energy is always
conserved in a parametric process, while this is not necessary the case in non-parametric
processes.
Examples of non-parametric processes are saturable absorption, multiphoton absorption and
stimulated Raman scattering. Frequency doubling, third harmonic generation, or optical
parametric generation - are examples of parametric processes. In this thesis, only parametric
nonlinear processes of 2nd
order are considered.
2.2. Second order nonlinear processes
An optical field, incident upon a χ(2)
nonlinear medium, and consisting of two different frequency
components, ω1 and ω2, can be represented as:
( )
(2.2.1)
Equations (2.1.3) and (2.2.1) give:
( )( ) ( )[
( ) ( )
] ( )[
] (2.2.2)
The complex polarization amplitudes of the four non-zero frequency components are as follows:
( ) ( )
(SHG),
( ) ( )
(SHG),
( ) ( ) (SFG),
( ) ( )
(DFG).
The abbreviations given in brackets denote the respective nonlinear processes: second
harmonic generation (SHG), sum frequency generation (SFG) and difference frequency
generation (DFG), respectively. The fifth zero-frequency term in Eq. (2.2.2) corresponds to a
process called optical rectification. It leads to the creation of a quasi-static electric field across the
nonlinear crystal.
Sum frequency generation is illustrated in Fig. 2.1. The complex amplitude describing this
process is given by:
( ) ( ) . (2.2.3)
In this case, two photons at frequencies ω1 and ω2 are combined into a third photon at a
frequency ω3. The solid line in the Fig. 2.1(b) represents the atomic ground state, while the
dashed lines represent the virtual levels.

Chapter 2. Basic principles of nonlinear optics
9
Fig. 2.1. Illustration of sum frequency generation (a) and the energy level diagram of the process (b).
A special case of sum frequency generation is the second harmonic generation, in which the
two input waves have the same frequency, ω1 = ω2 = ω, and the generated wave has the
frequency of 2ω. SHG is often used to obtain coherent radiation at 532 nm by frequency doubling
the well-established Nd:YAG lasers operating at 1064 nm.
The complex amplitude of the polarization for difference frequency generation is given by:
( ) ( )
. (2.2.4)
This process is illustrated in Fig. 2.2. The generated wave has a frequency of ω3 = ω1 – ω2.
Fig. 2.2. Illustration of difference frequency generation (a) and the energy level diagram of the process (b).
The processes of sum frequency generation and difference frequency generation may appear to
be very similar, however, there is an important difference: in DFG, one photon at frequency ω1 is
destroyed and, simultaneously, one new photon at a frequency ω2 and another one at frequency
ω3 are created. Therefore, the input field at frequency ω2 can be amplified, and thus this process
is also called optical parametric amplification (OPA). This can even happen when the input at
frequency ω2 is absent, and, if the gain is high enough, a significant output power can be
generated. Then the process is called optical parametric generation (OPG). If an optical resonator
is added to the OPG, the output fields can be amplified to fairly large values, and such a device is
called optical parametric oscillator (OPO). Conventionally, the interacting fields are called pump
(ω1 = ωp), signal (ω2 = ωs) and idler (ω3 = ωi), respectively, so that: ωp > ωs > ωi. An OPO can
be wavelength-tuned, since any pair of frequencies ω2 and ω3 can satisfy the condition ω1 = ω2 +
ω3. In practice, this is achieved by adjusting the phase-matching condition. OPOs are frequently
used to obtain coherent radiation in the mid-infrared region, where there is a lack of other reliable
coherent radiation sources.
χ(2)
ω1
ω2
ω1
ω2
ω3 = ω
1 + ω
2 ω
1
ω2
ω3
(a) (b)
χ(2)
ω1
ω2
ω1
ω2
ω3 = ω
1 - ω
2
ω1
ω2
ω3
(a) (b)

2.3. Second order nonlinear coefficients
10
2.3. Second order nonlinear coefficients
In principle, the second order susceptibility is described as a third rank tensor with 27 different
elements. However, when the frequencies of the optical waves in the nonlinear interaction are
much smaller than the lowest resonance frequency of the material, the medium can be considered
lossless, Kleinman symmetry can thus be applied [2.2], and a contracted notation can be used.
The nonlinearity tensor, d, is often used instead of the susceptibility χ(2)
:
( ) (2.3.1)
Under intrinsic permutation symmetry, dijk is symmetric with respect to the last two indices;
therefore, the following simplified notation is usually adopted:
jk: 11 22 33 23,32 31,13 12,21
l: 1 2 3 4 5 6
Then, the nonlinear coefficient matrix can be expressed as:
[
]. (2.3.2)
Then, the nonlinear polarization for SFG (ω1 + ω2 = ω3) can be described as:
[
( ) ( )
( )
] [
]
[
( ) ( ) ( ) ( )
( ) ( )
( ) ( ) ( ) ( )
( ) ( ) ( ) ( )
( ) ( ) ( ) ( )]
(2.3.3)
When the Kleinman symmetry condition is valid, the number of independent elements further
reduces from 18 to 10. The nonlinear coefficient matrix then acquires the following form:
[
]. (2.3.4)
2.4. Coupled wave equations
Using Maxwell’s equations for a nonmagnetic nonlinear medium with no free charges and zero
currents, the wave equation can be written as [2.1]:
( )
. (2.4.1)

Chapter 2. Basic principles of nonlinear optics
11
Equation (2.4.1) has the form of a driven wave equation, where the nonlinear response of the
material acts as a source term. For the case of SFG, the solution to this equation for a plane wave
at frequency ω3 propagating in +x direction, can be expressed as follows:
( ) ( ) , (2.4.2)
where
, and
( )( ), are the wavenumber and the refractive index, respectively,
at frequency ω3.
The applied optical fields are:
( ) ( ) ,
( ) ( ) (2.4.3)
The nonlinear source term in this case can be expressed as:
( ) , (2.4.4)
where ( ) and deff is an effective nonlinear coefficient, which depends
on the polarizations of the interacting waves and on the phase matching conditions.
Using the slowly-varying-envelope-approximation (SVEA), the second derivative terms can
be neglected:
|
| |
|,
|
| |
|, (2.4.5)
|
| |
|.
Substituting Eqs. (2.4.2), (2.4.3), (2.4.4) and (2.4.5) into the wave equation, (2.4.1) gives the
coupled wave equations for SFG:
,
, (2.4.6)
,
where Δk = k1 + k2 – k3 is the phase mismatch between the interacting waves.

2.5. Phase matching
12
2.5. Phase matching
Assuming undepleted input beams, the amplitudes A1 and A2 can be taken as constant in Eq.
(2.4.6). For the special case of Δk = 0 the amplitude A3 increases linearly with the propagation
distance x. The condition Δk = 0 is called perfect phase matching. Consequently, the intensity of
the wave ω3 increases quadratically with the propagation distance, and can be expressed as
folows:
(
) (2.5.1)
where L is the length of the nonlinear medium. The intensity I3 as a function of phase mismatch
ΔkL/2 is given in Fig. 2.3.
Fig. 2.3. Intensity of the generated wave as a function of the phase mismatch.
The intensity of the generated wave decreases when |ΔkL/2| deviates from zero. The output
wave gets out of phase with the driving polarization and power starts flowing back into the input
waves over a characteristic propagation length, which is called the coherence length, and is
defined as:
. (2.5.2)
The phase matching condition may in general be difficult to achieve due to the dispersion of
the material. The conditions for efficient frequency conversion with collinearly propagating
beams can be expressed as:
(2.5.3)
For SHG, the condition for perfect phase matching is:

Chapter 2. Basic principles of nonlinear optics
13
( ) ( ) (2.5.4)
When the process is phase matched, the generated second harmonic intensity according to Eq.
(2.5.1) is proportional to the square of the propagated distance, L. When the input beam intensity
is high and the propagation length in the nonlinear medium is long, the conversion efficiency
may become large and pump depletion can no longer be neglected. For a perfect phase matching,
the intensities of the fundamental and second harmonic beams are [2.3]:
( ) ( ) ( ) (2.5.5)
( ) ( ) ( ) (2.5.6)
where G is defined as:
√
( ). (2.5.7)
Fig. 2.4 illustrates the intensity evolution during the SHG process with the propagation
distance in the nonlinear medium.
Fig. 2.4. Fundamental (red curve) and second harmonic (green curve) intensity as a function of the
propagation length in the nonlinear medium for perfect phase matching case.
Uniform plane wave approximation predicts a total conversion of the fundamental wave into
the second harmonic wave; however, in practice, the conversion efficiency may be limited by
many factors, such as the laser-beam profile, beam quality, focusing conditions, etc. Often,
second harmonic conversion efficiencies above 50% can be achieved, and under special
conditions, e.g., with cavity enhancement, conversion efficiencies up to 90% are actually possible
[2.4].

2.6. Birefringent phase matching
14
2.6. Birefringent phase matching
Birefringent phase matching (BPM) relies on the material property, called birefringence, in order
to achieve efficient frequency conversion. As an example, we will consider SHG in a negative
uniaxial crystal. The ordinary wave (i.e., the wave polarized perpendicular to the plane
containing the optical axis of the crystal and the propagation direction), experiences the so-called
ordinary refractive index, no, which stays the same regardless of the propagation direction. On the
other hand, the extraordinary wave (i.e., the wave polarized in the plane containing the optical
axis of the crystal and the propagation direction), experiences the index of refraction, ne, which
depends on the angle θ between the optical axis and the propagation direction. From the ellipse
equation, the angle-dependent index of refraction for the extraordinary wave can be determined
by the following expression [2.5]:
( )
√ (
)
, (2.6.1)
where is the principal value of the refractive index for the extraordinary wave. ( ) for
θ = 90° and ( ) for θ = 0°. For a negative uniaxial crystal, .
Within its transparency range, the nonlinear medium experiences normal dispersion: the
refractive index of a higher frequency wave is larger. Fig. 2.5 shows the angular dependence of
the index of refraction for the ordinary and the extraordinary waves, both for the fundamental and
the second harmonic waves.
Fig. 2.5. The angular dependence of the index of refraction on the propagation direction for the
ordinary and the extraordinary waves for second harmonic generation in negative uniaxial crystal.
no(ω)
ne(ω)
no(2ω)
ne(2ω)
2kω
k2ω
θ
O
A
nx
nz
Chapter 2. Basic principles of nonlinear optics
15
It is obvious that in the direction OA, the phase matching condition for collinear SHG is
fulfilled:
( ) ( ) (2.6.2)
Depending on the polarizations of the interacting waves, the different phase-matching schemes
are grouped into two types: type I phase matching, in which the two lowest-frequency waves are
polarized the same way; while in type II phase matching, their polarizations are orthogonal.
Although birefringent phase matching is a straightforward technique, it suffers from several
issues. First, when the angle θ is not 0° or 90°, the Poynting vector and the propagation vector are
not parallel, resulting in a divergence between the ordinary and the extraordinary waves, which
limits the conversion efficiency. This so-called walk-off effect, can be avoided by setting the
angle θ = 90° and tuning the temperature, provided that the material’s birefringence has a strong
enough dependence on temperature. This is called noncritical phase matching. Second, since the
nonlinearity is polarization dependent, it is not always possible to use the highest coefficient for a
particular frequency conversion process. For instance, in KTP d33 cannot be used for frequency
conversion using the BPM scheme. Moreover, the birefringence may be too weak to achieve
phase matching in certain spectral regions. For instance, SHG involving type II phase matching is
not possible for wavelengths below 1075 nm in KTA crystals [2.6].
2.7. Quasi-phase matching
Instead of relying on the material properties, quasi-phase matching (QPM) ensures efficient
frequency conversion by artificially structuring the nonlinear medium. This technique is
essentially free of the issues present in birefringent phase matching. QPM was first proposed in
1962 by Armstrong et al. [2.7], with the idea of SHG in a set of nonlinear crystals periodically
oriented by 180°, with the length of each crystal along the propagation direction equal to the
coherence length. In noncentrosymmetric crystals this results in the changing of the sign of the
components of the nonlinearity tensor, and, subsequently, resetting the phase mismatch between
the interacting waves. A more feasible and a widely used approach to achieve QPM is by
periodically reversing the spontaneous polarization in a ferroelectric crystal. This process, called
periodic poling, is usually done by applying an external electric field over a periodic electrode.
Another approach for implementing QPM relies on growing orientation-patterned nonlinear
materials, such as GaAs [2.8]. This thesis focuses on implementing QPM structures by periodic
poling of the KTP-family materials.
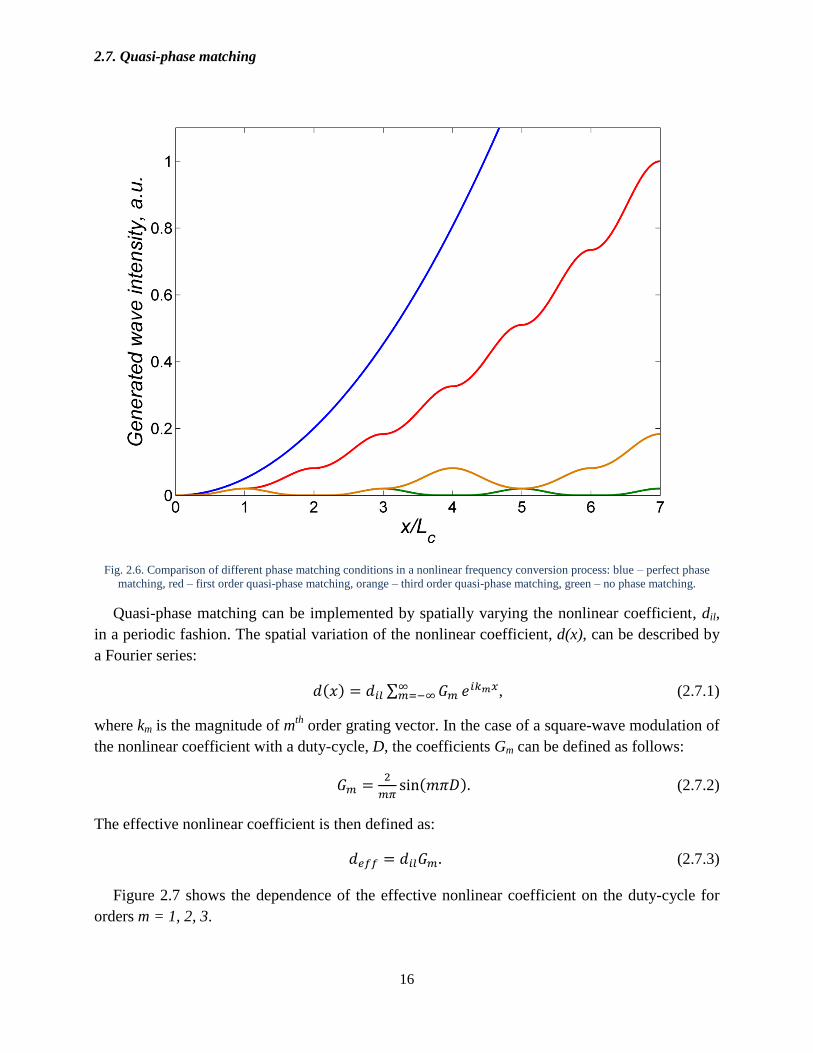
The idea behind QPM is illustrated in Fig. 2.6. For perfect phase matching, given by the blue
curve, the generated wave intensity grows quadratically with the propagation distance. If a phase
mismatch is introduced, the generated wave intensity reaches the maximum point at one
coherence length and starts coupling back into the input waves, as shown in the green curve. In
the case of QPM, the phase difference between the interacting waves is reset every coherence
length and efficient frequency conversion can be achieved, as shown in the red curve in Fig. 2.6.
2.7. Quasi-phase matching
16
Fig. 2.6. Comparison of different phase matching conditions in a nonlinear frequency conversion process: blue – perfect phase
matching, red – first order quasi-phase matching, orange – third order quasi-phase matching, green – no phase matching.
Quasi-phase matching can be implemented by spatially varying the nonlinear coefficient, dil,
in a periodic fashion. The spatial variation of the nonlinear coefficient, d(x), can be described by
a Fourier series:
( ) ∑ , (2.7.1)
where km is the magnitude of mth
order grating vector. In the case of a square-wave modulation of
the nonlinear coefficient with a duty-cycle, D, the coefficients Gm can be defined as follows:
( ) (2.7.2)
The effective nonlinear coefficient is then defined as:
(2.7.3)
Figure 2.7 shows the dependence of the effective nonlinear coefficient on the duty-cycle for
orders m = 1, 2, 3.

Chapter 2. Basic principles of nonlinear optics
17
Fig. 2.7. Effective nonlinear coefficient (normalized to dil) as a function of the duty-cycle for orders m = 1, 2, 3.
From Eqs. (2.7.2), (2.7.3) and Fig. 2.7 it is obvious that first order QPM, with a duty-cycle D
= 0.5 is the most desirable, since it gives the highest effective nonlinear coefficient.
Assuming that efficient coupling between the three interacting waves is dominated by a
particular Fourier component, Gm, the coupled wave equations are:
(2.7.4)
The mismatch is given by:
, (2.7.5)
where,
. (2.7.6)
2.8. QPM SHG tuning and tolerances
18
The optimal period for the most efficient frequency conversion depends on the material
dispersive properties:
. (2.7.7)
Even though the first order QPM reduces the nonlinearity with a factor of 2/π, it can still be
more efficient than birefringent phase matching, because the highest nonlinear coefficient can be
utilized.
The main advantage of the QPM method is the flexibility that allows tailoring any nonlinear
interaction within the material transparency range by appropriately designing the QPM structure.
Additional advantages include noncritical phase matching, large acceptance angle, the possibility
to implement multiple QPM nonlinear processes in a single crystal, etc. Of particular interest is
the possibility of using QPM to realize nonlinear interactions involving counter propagating
waves, which otherwise are impossible to obtain with BPM in the visible and near-infrared
spectral range. Examples of such interactions are backward second harmonic generation (BSHG),
broadband, counter-propagating optical parametric amplifiers, and mirrorless parametric
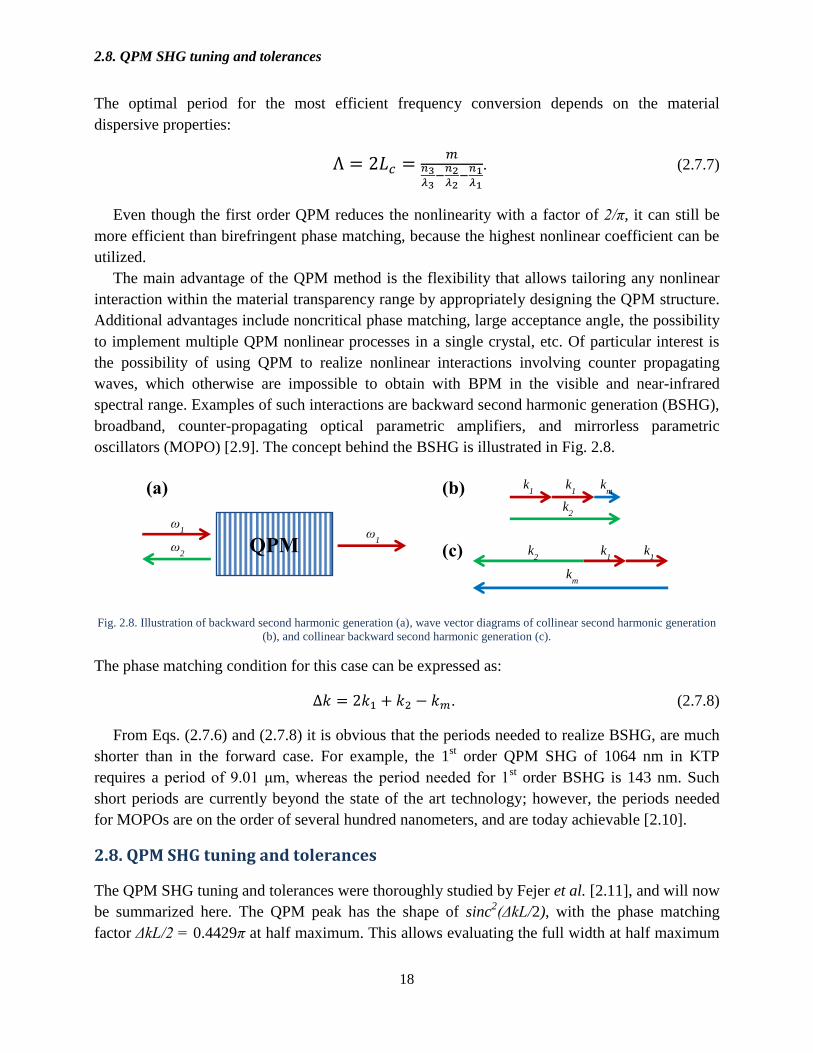
oscillators (MOPO) [2.9]. The concept behind the BSHG is illustrated in Fig. 2.8.
Fig. 2.8. Illustration of backward second harmonic generation (a), wave vector diagrams of collinear second harmonic generation
(b), and collinear backward second harmonic generation (c).
The phase matching condition for this case can be expressed as:
. (2.7.8)
From Eqs. (2.7.6) and (2.7.8) it is obvious that the periods needed to realize BSHG, are much
shorter than in the forward case. For example, the 1st order QPM SHG of 1064 nm in KTP
requires a period of 9.01 μm, whereas the period needed for 1st order BSHG is 143 nm. Such
short periods are currently beyond the state of the art technology; however, the periods needed
for MOPOs are on the order of several hundred nanometers, and are today achievable [2.10].
2.8. QPM SHG tuning and tolerances
The QPM SHG tuning and tolerances were thoroughly studied by Fejer et al. [2.11], and will now
be summarized here. The QPM peak has the shape of sinc2(ΔkL/2), with the phase matching
factor ΔkL/2 = 0.4429π at half maximum. This allows evaluating the full width at half maximum
QPM
ω1
ω2
ω1
(a) (b) k1 k
1
k2
km
k1 k
1 k
2
km
(c)

Chapter 2. Basic principles of nonlinear optics
19
(FWHM) acceptance bandwidths for parameters affecting the phase matching. The spectral
acceptance bandwidth of the fundamental wavelength can be expressed as [2.11]:
|
|
, (2.8.1)
where the derivatives are evaluated at their respective wavelengths. It is worth noting that the
spectral acceptance bandwidth tends to increase towards longer wavelengths because of the
decrease in the dispersion.
The FWHM angular acceptance for a noncritically phase matched interaction in an isotropic
medium is given by [2.11]:
√
. (2.8.2)
The refractive indices of the material are temperature dependent. In addition, the thermal
expansion alters the period and the length of the QPM structure when the temperature of the
nonlinear medium is changed. The temperature acceptance bandwidth can be expressed as [2.11]:
|
( )|
, (2.8.3)
where α is the thermal expansion coefficient. The temperature acceptance bandwidth increases
towards longer wavelengths. The indices of refraction and their temperature dependencies are
obtained from Sellmeier equations for a particular nonlinear material. From the temperature
acceptance bandwidth, an effective QPM grating length can be estimated, which is a good
measure of the quality of the QPM structure. The QPM structure is considered to be of high
quality when the calculated effective length is equal to the physical grating length, L.
2.9. Optimal focusing with Gaussian beams
Most commonly, lasers have a Gaussian spatial intensity distribution. The diffraction of a focused
Gaussian beam limits the interaction length during second harmonic generation, therefore an
optimal focusing condition exists, which is essentially a tradeoff between the focused beam
intensity and the interaction length in the nonlinear medium. A theory, developed by Boyd and
Kleinman [2.12], defines the focusing parameter:
, (2.9.1)
where L is the crystal length, and b = 2πw02/λ is the so-called confocal parameter. The second
harmonic conversion efficiency can be expressed as:
( ), (2.9.2)

2.10. Optical parametric oscillators
20
where deff is the effective nonlinear coefficient, ω1, k1, P1 and n1 – the frequency, wavevector,
power and the index of refraction of the fundamental beam, n2 – the index of refraction of the
second harmonic beam, c – the speed of light, ε0 – the permittivity of free space, and h(B,ξ) is the
Boyd-Kleinman focusing factor. For QPM (no walk-off, B = 0), the maximum nonlinear
interaction is specified by the focusing parameter and the focusing factor ( )
The adjustment with respect to ξ is not a very critical factor, since the second harmonic
efficiency stays within 10% of its maximum value in the range 1.52 ≤ ξ ≤ 5.3. From Eq. (2.9.2), it
is obvious that the conversion efficiency increases linearly with the fundamental power and the
nonlinear crystal length. In order to compare the performance of different QPM devices, the
conversion efficiency is normalized with respect to the length of the nonlinear medium and the
power of the fundamental beam:
( ) (2.9.3)
The normalized conversion efficiency is usually evaluated in the low power regime.
The effective nonlinear coefficient can be used as a quality measure of the QPM structure and
is defined as:
√
( ), (2.9.4)
where m is the QPM order.
2.10. Optical parametric oscillators
In difference frequency generation, a strong input signal at frequency ωp interacts with a weak
signal at frequency ωs, and, as a consequence, the signal at frequency ωs gets amplified and a
signal at frequency ωi is generated (Fig. 2.9(a)). The power, coupled to the signal and the idler
waves from the pump, is governed by Manley-Rowe relations [2.1]:
(2.10.1)
where Ip, Is and Ii denote the intensities of the pump, the signal and the idler waves, respectively.
Since the difference frequency mixing is an amplification process, the coupling between the
signal and the idler must be considered. For undepleted pump and with a strong gain, the signal
and the idler intensities are respectively given by:
( ) ( ) ( ) (2.10.2)
( ) ( )
( ) (2.10.3)

Chapter 2. Basic principles of nonlinear optics
21
Here, g is the gain coefficient:
. (2.10.4)
In an OPO, the nonlinear medium is placed into an optical cavity providing feedback of the
generated waves. The simplest OPO configuration is a linear cavity (Fig. 2.9(b)), where the input
coupler is a highly reflective mirror and the output coupler is a partially reflective mirror for the
signal and/or the idler waves.
Fig. 2.9. Energy level diagram of difference frequency generation process (a) and optical parametric oscillator linear cavity (b).
If the resonator mirrors are reflective at ωs or ωi, the device is called singly resonant OPO.
When the mirrors are reflective at ωs and ωi, the device is a doubly resonant OPO. The
operational threshold for a doubly resonant OPO is usually lower than that for a singly resonant
OPO. Nevertheless, singly resonant OPOs are predominantly used due to their superior stability
and tuning characteristics. For a singly resonant OPO, the oscillation occurs at the cavity mode
closest to the gain peak, whereas for a doubly resonant OPO, the oscillation is supported by both
modes corresponding to the signal and the idler, which may not necessarily be closest to the gain
peak. Consequently, small fluctuations in the pump frequency or the cavity length can lead to
large variations in the output frequencies of a doubly resonant OPO.
Any pair of signal and idler frequencies, satisfying the condition ωp = ωs + ωi, can be
generated by an OPO. The OPO tuning can be accomplished by setting the phase matching
condition Δk = 0 for any pair of frequencies ωs and ωi. The most popular way to tune OPOs
employing QPM is by changing the temperature of the nonlinear medium. Other methods include
the use of noncolinear geometries, multiple gratings, fan-shaped gratings and a variation of the
QPM period by rotating the QPM grating [2.13].
χ(2)
ωp
ωp
ωs
ωi
(b)
ωp
ωs
ωi
(a)
R1 R
2
22
References 2.1. R. W. Boyd, Nonlinear optics (Academic Press, 2008).
2.2. D. A. Kleinman, “Nonlinear dielectric polarization in optical media,” Phys. Rev. 126, 1977 (1962).
2.3. P. N. Butcher, and D. Cotter, The elements of nonlinear optics (Cambridge University Press, 1998).
2.4. T. Sudmeyer, Y. Imai, H. Masuda, N. Eguchi, M. Saito, and S. Kubota, “Efficient 2nd
and 4th
harmonic
generation of a single-frequency, continuous-wave fiber amplifier,” Opt. Express 16, 1546-1551 (2008).
2.5. Дмитриев В. Г., Тарасов Л. В., Прикладная нелинейная оптика: Генераторы второй гармоники и
параметрические генераторы света (Радио и связь, 1982).
2.6. J. D. Bierlein, H. Vanherzeele, and A. A. Ballman, “Erratum: “Linear and nonlinear optical properties of flux‐
grown KTiOAsO4,”” Appl. Phys. Lett. 61, 3193 (1992).
2.7. J. A. Armstrong, N. Bloembergen, J. Ducuing, and P. S. Pershan, “Interactions between light waves in a
nonlinear dielectric,” Phys. Rev. 127, 1918 (1962).
2.8. C. B. Ebert, L. A. Eyres, M. M. Fejer, and J. S. Harris, Jr., “MBE of antiphase GaAs films using GaAs/Ge/GaAs
heteroepitaxy,” J. Crystal Growth, 201/202, 187 (1999).
2.9. S. E. Harris, “Proposed backward wave oscillation in the infrared,” Appl. Phys. Lett. 9, 114 (1996).
2.10. C. Canalias, and V. Pasiskevicius, “Mirrorless optical parametric oscillator,” Nature photon. 1, 459 (2007).
2.11. M. M. Fejer, G. A. Magel, D. H. Jundt, and R. L. Byer, ”Quasi-phase-matched second harmonic generation:
tuning and tolerances,” IEEE J. Quantum Electron. 28, 2631 (1992).
2.12. G. D. Boyd, and D. A. Kleinman, “Parametric interaction of focused Gaussian light beams,” J. Appl. Phys. 39,
3597 (1968).
2.13. J. P. Feve, O. Pacaud, B. Boulanger, B. Menaert, J. Hellström, V. Pasiskevicius, and F. Laurell, “Widely and
continuously tunable optical parametric oscillator based on a cylindrical periodically poled KTiOPO4 crystal,” Opt.
Lett. 26, 1882 (2001).

23
Chapter 3. Ferroelectrics
3.1. Crystal symmetry
A crystalline solid consists of atoms which have a regular arrangement that exhibits translational
symmetry. An ideal crystal can be defined as being defectless and with the atoms taking
equilibrium positions in the crystal lattice. For simplicity, we can assume that ideal crystals are
also of infinite dimensions. Ideal crystals exhibit many types of symmetries, which determine
many of their properties. The crystal symmetry operations are those that project the crystal back
onto itself. Examples of such symmetry operations are translations, rotations, and reflections.
These operations are called point transformations since they leave at least one crystal lattice point
fixed. A collection of such point transformations form groups, called point groups. There are only
32 different point groups that are allowed by translational symmetry [3.1]. In the international
(Herman-Mauguin) notation, the rotation axes are denoted by a number n (angle of rotation is
2π/n). The rotation inversion axes are denoted by the corresponding number with the macron
symbol . The mirror plane, with its direction being normal to the plane, is denoted by the
symbol m. If the rotation axis and a mirror plane have the same direction, they are denoted as the
fraction n/m. If the notation contains three positions, then they denote symmetry operations in the
z-, y-, x- directions, respectively. For example, KTP belongs to the point group 2mm, which
means that it has a two-fold rotation axis along the polar z- direction (angle of rotation π), and
two mirror planes along the x- and the y- directions.
Table 3.1 shows the seven basic crystal systems with the 32 point groups as their subdivisions.
These seven crystal systems, based on their optical properties, can be subdivided into three
groups: biaxial, uniaxial and isotropic.
Table 3.1. The seven crystal systems with corresponding point groups and optical groups. The polar point
groups are given in bold.
Crystal system Point group Optical group
Triclinic
Biaxial
Monoclinic
( )
Biaxial
Orthorhombic
( )( )( )
Biaxial
Tetragonal
( )
( )( )( )
Uniaxial

3.2. Ferroelectric materials
24
Trigonal
( )
Uniaxial
Hexagonal
( )
( )( )( )
Uniaxial
Cubic
( )
( )( )( )
Isotropic
3.2. Ferroelectric materials
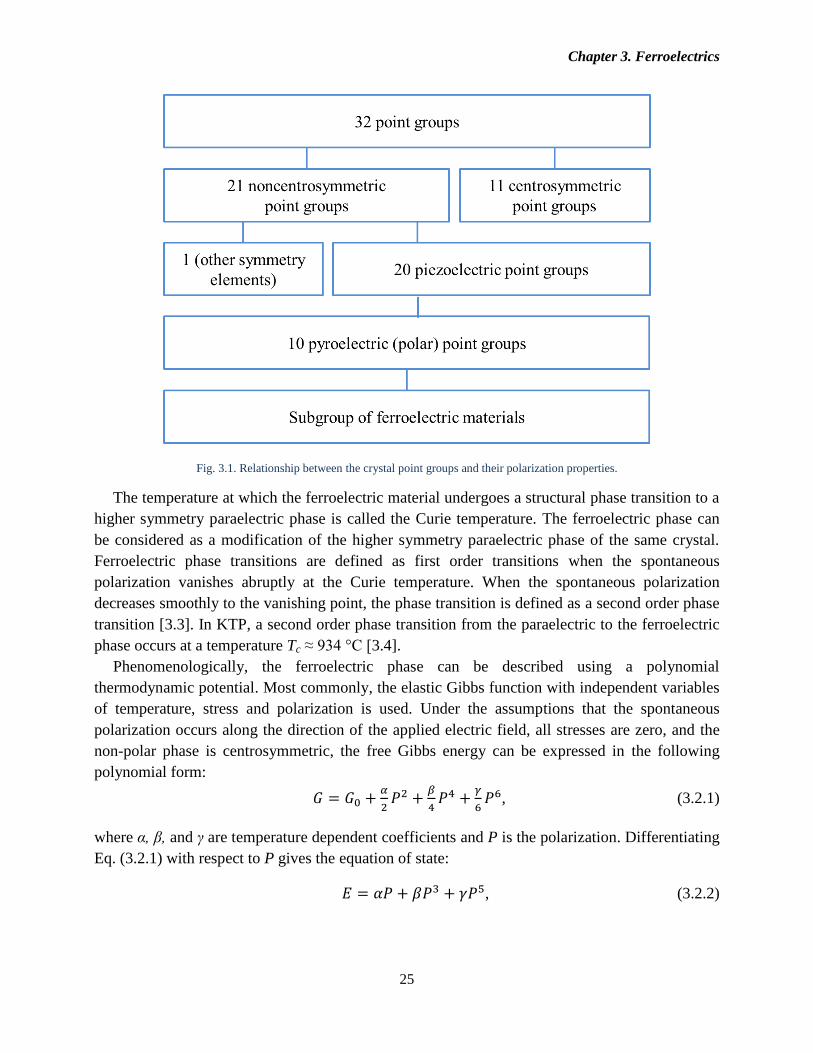
Ferroelectricity is strongly related to the crystal structure of the material. The relation between
the crystal point groups and their polarization properties are shown in Fig. 3.1. Eleven point
groups out of the 32 are centrosymmetric, and 21 are noncentrosymmetric. The absence of
inversion symmetry is a requirement for piezoelectricity. One of the 21 noncentrosymmetric
point groups exhibits other symmetry elements and is not piezoelectric, while the other 20 point
groups are piezoelectric. If a mechanical stress is applied to a piezoelectric crystal along certain
directions, it exhibits an electric polarization proportional to the applied stress. On the other hand,
if an electric field is applied across such crystal, it expands or contracts proportionally to the
applied field. Ten of the 20 piezoelectric point groups are polar: they exhibit a nonvanishing
dipole moment per unit volume – the so-called spontaneous polarization. The ten polar classes
are: 1, 2, m, 2mm, 4, 4mm, 3, 3m, 6 and 6mm [3.2]. An electric charge can be created on the
surface of the polar crystal if it is heated or cooled, since the external or internal conductivity in
general cannot provide enough current to screen the change of the spontaneous polarization with
temperature. This effect is called pyroelectricity. Ferroelectric materials are a subgroup of the
pyroelectric class, and therefore they also exhibit pyroelectric and piezoelectric properties. A
material is classified as ferroelectric, if it possesses a spontaneous polarization over a certain
range of temperatures that can be reversed or reoriented by applying an external electric field
[3.3].
Chapter 3. Ferroelectrics
25
Fig. 3.1. Relationship between the crystal point groups and their polarization properties.
The temperature at which the ferroelectric material undergoes a structural phase transition to a
higher symmetry paraelectric phase is called the Curie temperature. The ferroelectric phase can
be considered as a modification of the higher symmetry paraelectric phase of the same crystal.
Ferroelectric phase transitions are defined as first order transitions when the spontaneous
polarization vanishes abruptly at the Curie temperature. When the spontaneous polarization
decreases smoothly to the vanishing point, the phase transition is defined as a second order phase
transition [3.3]. In KTP, a second order phase transition from the paraelectric to the ferroelectric
phase occurs at a temperature Tc ≈ 934 °C [3.4].
Phenomenologically, the ferroelectric phase can be described using a polynomial
thermodynamic potential. Most commonly, the elastic Gibbs function with independent variables
of temperature, stress and polarization is used. Under the assumptions that the spontaneous
polarization occurs along the direction of the applied electric field, all stresses are zero, and the
non-polar phase is centrosymmetric, the free Gibbs energy can be expressed in the following
polynomial form:
, (3.2.1)
where α, β, and γ are temperature dependent coefficients and P is the polarization. Differentiating
Eq. (3.2.1) with respect to P gives the equation of state:
, (3.2.2)
3.2. Ferroelectric materials
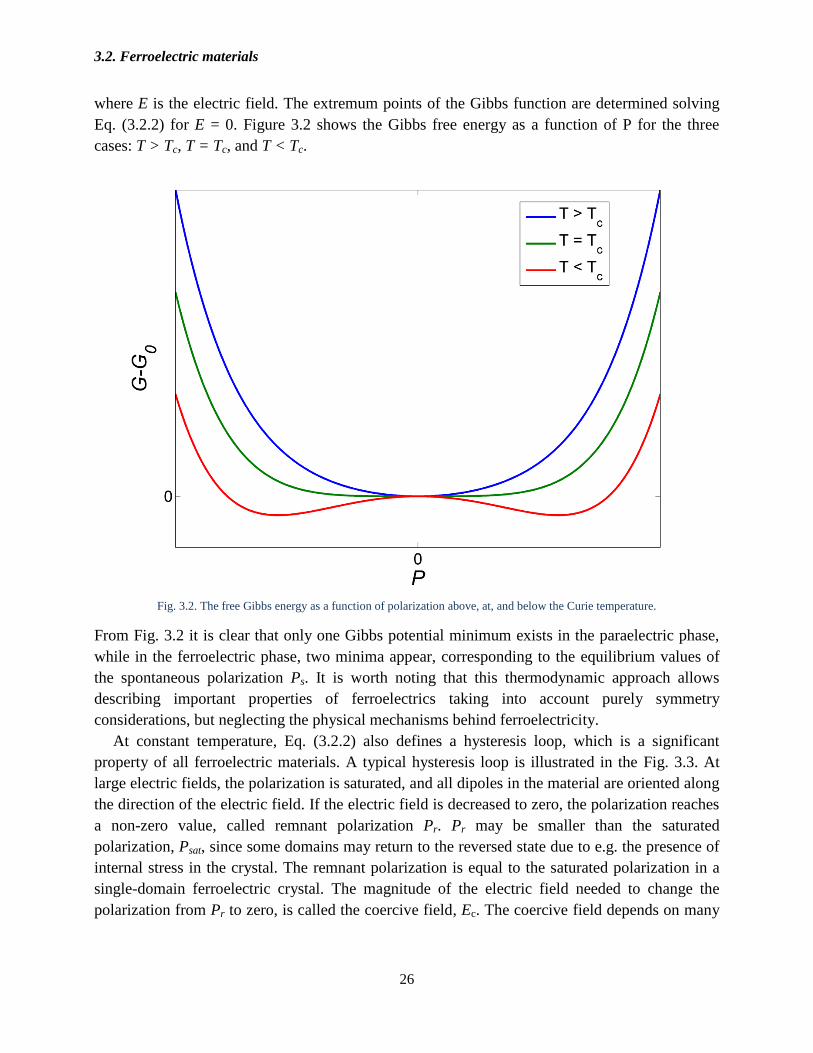
26
where E is the electric field. The extremum points of the Gibbs function are determined solving
Eq. (3.2.2) for E = 0. Figure 3.2 shows the Gibbs free energy as a function of P for the three
cases: T > Tc, T = Tc, and T < Tc.
Fig. 3.2. The free Gibbs energy as a function of polarization above, at, and below the Curie temperature.
From Fig. 3.2 it is clear that only one Gibbs potential minimum exists in the paraelectric phase,
while in the ferroelectric phase, two minima appear, corresponding to the equilibrium values of
the spontaneous polarization Ps. It is worth noting that this thermodynamic approach allows
describing important properties of ferroelectrics taking into account purely symmetry
considerations, but neglecting the physical mechanisms behind ferroelectricity.
At constant temperature, Eq. (3.2.2) also defines a hysteresis loop, which is a significant
property of all ferroelectric materials. A typical hysteresis loop is illustrated in the Fig. 3.3. At
large electric fields, the polarization is saturated, and all dipoles in the material are oriented along
the direction of the electric field. If the electric field is decreased to zero, the polarization reaches
a non-zero value, called remnant polarization Pr. Pr may be smaller than the saturated
polarization, Psat, since some domains may return to the reversed state due to e.g. the presence of
internal stress in the crystal. The remnant polarization is equal to the saturated polarization in a
single-domain ferroelectric crystal. The magnitude of the electric field needed to change the
polarization from Pr to zero, is called the coercive field, Ec. The coercive field depends on many

Chapter 3. Ferroelectrics
27
parameters, such as the temperature, pressure, frequency and the waveform of the applied field,
electrodes, crystal history, etc.
Fig. 3.3. Typical hysteresis loop of a ferroelectric material, showing the spontaneous polarization,
remnant polarization and the coercive field.
Polarization switching is the process in which an electric field opposite to the spontaneous
polarization and with a magnitude exceeding that of the coercive field is applied to a ferroelectric
crystal to change the direction of the spontaneous polarization.
The electric displacement, the electric field and the polarization are connected via the
following relation:
. (3.2.3)
The displacement field is a consequence of the polarizability of the material in an external
electric field and the net spontaneous polarization. Gauss’s law in differential form states:
, (3.2.4)
where ρ is the free charge density. From Eqs. (3.2.3) and (3.2.4):
( ) (3.2.5)
In an ideal, infinite ferroelectric crystal, the spontaneous polarization is uniform,
Therefore
. In real ferroelectric crystals, however, at the crystal surfaces or
in the bulk of the material due to defects, and, therefore, gives rise to an electric field, antiparallel
to the spontaneous polarization, which is called the depolarization field [3.5]. The depolarization
field can be compensated for by the flow of the internal free charges in the crystal. Alternatively,
the depolarization field can also be compensated by free charges present in the crystal
E
P
Psat
Pr
Ec

3.3. Polarization reversal
28
environment. When the surface charge is accumulated, the electric field is zero both in the bulk
and outside of the ferroelectric crystal, but not just below the surfaces of the crystal.
When a crystal is cooled down from the paraelectric phase to the ferroelectric phase, the
direction of the spontaneous polarization can take two alternative values. Different regions of the
crystal can be polarized along the opposite directions and form ferroelectric domains in order to
minimize the energy associated with the depolarization field. A ferroelectric domain can be
defined as a crystal region with a homogeneous spontaneous polarization [3.3]. The region in the
crystal, which separates two domains with antiparallel spontaneous polarization directions, is
called a domain wall. The ferroelectric domain structure is stable when the depolarization energy
and the domain wall energy are at their minimum values.
3.3. Polarization reversal
It is accepted that the polarization reversal in ferroelectrics involves the following steps: domain
nucleation, domain growth along the polar axis, sideways expansion and coalescence of the
domains. Most commonly, domain nucleation is modelled as a statistical process with the
probability depending exponentially on the applied external electric field [3.6]. The theory of the
domain nucleation was first formulated by Merz [3.7] and further expanded by Landauer [3.8].
When a new domain is nucleated, the total energy change is given by:
, (3.3.1)
where Ww represents the domain wall energy, WE is the depolarization energy of the nucleus, and
D·EV is the electrostatic energy of the nucleus of volume V in the applied electric field.
Assuming that both the polarization and the local electric field within the nucleus are uniform,
the rate of domain nucleation is proportional to exp(-ΔW/kT). The Landauer theory predicts a
critical nucleus energy that is unrealistically large (on the order of 108kT) [3.9]. Experimentally,
however, switching can be observed at fields lower than the estimated thermodynamic coercive
field. Since the Landauer model assumes an ideal insulating ferroelectric crystal containing no
free carriers or defects, defect-assisted nucleation models were proposed by Janovec [3.10] and
Molotskii et al. [3.11]. The most accepted domain nucleation model today, proposed by Gerra et
al. [3.12], extends the Landauer model by including the ferroelectric-electrode coupling and
defects in the ferroelectric-electrode interface. In this model the domains of the shape of prolate
semispheroids are considered. The total energy change associated with the nucleation of a new
domain now includes the ferroelectric-electrode interface energy, and can be expressed as:
, (3.3.2)
where r is the base radius of the domain, and ξ represents the local surface field.
The ferroelectric domain growth is anisotropic in the three dimensions. The domain forward
growth velocity (along the polar direction) is usually much larger than lateral growth velocities,
and follows an inverse exponential dependence on the applied electric field [3.9]. The domain
wall velocity along the polar direction in the KTP isomorphs is at least a few orders of magnitude

Chapter 3. Ferroelectrics
29
higher than that in the lateral directions [3.13]. It is important to point out that due to the
measurement difficulties the problem of the domain forward growth velocity in ferroelectrics still
remains an open question.
A domain sideways expansion mechanism through a lateral domain wall motion is unlikely
[3.5]. Miller and Weinreich explained the domain sideways expansion via the nucleation at the
crystal surface and the propagation of step-like domains adjacent to the existing domain walls
[3.14]. The most energetically favorable shape of a step-like domain forming adjacent to an
existing domain wall is triangular, as shown in Fig. 3.4. Thus, the domain sideways expansion
speed depends on the rate of nucleation and the growth velocity of such step-like domains.
Fig. 3.4. Schematic representation of a triangular, step-like domain adjacent to an existing domain wall. The applied electric field
is parallel to the z axis (adapted from [3.14]).
BaTiO3 is considered to be a model ferroelectric in many aspects of polarization switching and
domain dynamics. This material is the most studied experimentally, and the obtained results can
be generalized to other ferroelectric crystals. The temporal dependence of the polarization
switching on the electric field magnitude was first determined experimentally by Merz in BaTiO3
by applying electric field pulses and measuring the transient current as a function of time [3.7].
The switching time is defined as the time needed to complete the switching process under a given
applied external electric field. For convenience, it is taken as the time measured from the
beginning of the electric field pulse until the switching current drops to 5% of its maximum
value. For BaTiO3, in low fields (below Ec) the switching time follows an exponential
dependence:
(
), (3.3.3)
where α is the activation field. Domain wall motion evaluation by Miller and Savage in BaTiO3
revealed that the sideways domain wall velocity at low fields also shows an exponential
dependence [3.15]:
Ps P
s
x y
z

3.4. Role of defects
30
(
), (3.3.4)
where v∞ and δ are parameters independent of the applied electric field. At higher fields (above
Ec) the switching time dependence follows a power-law [3.16]:
, (3.3.5)
where n is the material-dependent parameter. Stadler and Zachmanidis demonstrated that in the
high field range, the domain wall velocity in BaTiO3 has the following dependence [3.17]:
, (3.3.6)
which is consistent with Eq. (3.3.5). Assuming an exponential nucleation rate dependence on the
electric field, the polarization switching behavior can be understood as nucleation-dominated in
the low field regime, while at high fields, the nucleation is not a limiting factor any more, and,
therefore, switching is governed by the domain wall motion. It is important to note that even
though this model is based on the studies of BaTiO3, the existence of the different stages of
domain evolution is general for most ferroelectric crystals, with the exponential dependence
being characteristic for low electric fields, while the behavior at high fields is material-specific.
Indeed, a similar polarization switching behavior is reported for KTP by Rosenman et al. [3.18],
Urenski et al. [3.19], and Canalias et al. [3.13], distinguishing a nucleation-dominated regime at
low fields, whereas at high fields, the switching rate is controlled by the domain wall motion.
In principle, polarization switching using short electric field pulses is feasible provided that
the electric field magnitude is large enough. However, Fatuzzo and Merz have experimentally
showed that there is a critical pulse duration, t*, below which there is no net reversal of the
spontaneous polarization [3.20]. The physical mechanism behind this phenomenon is not yet
fully understood [3.6]. Fatuzzo and Merz suggested that the time t* may be associated with the
time needed to form critical nuclei [3.20], whereas Gopalan and Mitchell attributed it to domain
stabilization time and backswitching [3.21].
3.4. Role of defects
The existence of a defect causes deformations in the crystal lattice and thus modifies the local
fields. The extent of these effects depends on the parameters such as the type and the location of
the defect and the defect-host interaction. An accentric defect creates a dipole moment [3.5]:
∑ , (3.4.1)
where Δμd is the change in the dipole moment and Δxi is the displacement of the charge qi in the
surrounding lattice due to the defect. The interaction between different defects can be neglected if
the defect concentration N is sufficiently small. The change in the macroscopic polarization can
be described by the following expression:
. (3.4.2)

Chapter 3. Ferroelectrics
31
The polarization contribution due to the defects ΔP may or may not reverse when the polarization
of the ferroelectric crystal is reversed by an external electric field. If it reverses, the hysteresis
loop may become biased, i.e., the coercive field will be dependent on the field required to reverse
the dipoles associated with the defects. If it does not reverse, it may act as initial nucleation sites
during the polarization reversal, or may be the source of backswitching.
Domain wall pinning may also have a considerable impact on the polarization switching. The
domain wall becomes pinned when, under an applied external electric field, its motion is
hindered by the coupling of the domain wall with defects in the crystal [3.9]. Defects impose a
pinning potential that needs to be overcome in order to enable the motion of the domain wall
through the pinning point. Depinning requires either a larger electric field magnitude or a longer
pulse duration. This effect can influence the quality of the QPM grating during the periodic
poling process, therefore the use of high quality crystals with low defect concentrations is always
desirable.

32
References
3.1. J. Patterson and B. Bailey, Solid-State Physics, (Springer-Verlag, 2010).
3.2. K. C. Kao, Dielectric Phenomena in Solids, (Academic Press, 2004).
3.3. ANSI/IEEE std. 180-1986, IEEE Standard Definitions of Primary Ferroelectric Terms, The Institute of
Electrical and Electronics Engineers, Inc., (New York, 1986).
3.4. V. K. Yanovskii, and V. I. Voronkova, “Ferroelectric Phase Transitions and Properties of Crystals of the
KTiOPO4 Family,” Phys. Status Solidi 93, 665-668 (1986).
3.5. M. E. Lines, and A. M. Glass, Principles and Applications of Ferroelectrics and Related Materials, (Oxford
University Press, 1977).
3.6. T. Volk and M. Wöhlecke, Lithium Niobate. Defects, Photorefraction and Ferroelectric Switching, (Springer-
Verlag, 2008).
3.7. W. J. Merz, “Domain Formation and Domain Wall Motions in Ferroelectric BaTiO3 Single Crystals,” Phys. Rev.
95, 690-698 (1954).
3.8. R. Landauer, “Electrostatic Considerations in BaTiO3 Domain Formation during Polarization Reversal,” J. Appl.
Phys. 28, 227-234 (1957).
3.9. A. K. Tagantsev, L. E. Cross, and J. Fousek, Domains in Ferroic Crystals and Thin Films, (Springer-Verlag,
2010).
3.10. V. Janovec, “Anti-parallel ferroelectric domains in surface space-charge layers of BaTiO3,” Czech. J. Phys. 9,
468-480 (1959).
3.11. M. Molotskii, R. Kris, and G. Rosenman, “Fluctuon effects in ferroelectric polarization switching,” J. Appl.
Phys. 88, 5318-5327 (2000).
3.12. G. Gerra, A. K. Tagantsev, and N. Setter, ”Surface-Stimulated Nucleation of Reverse Domains in
Ferroelectrics,” Phys. Rev. Lett. 94, 107602 (2005).
3.13. C. Canalias, J. Hirohashi, V. Pasiskevicius, and F. Laurell, “Polarization-switching characteristics of flux-
grown KTiOPO4 and RbTiOPO4 at room temperature,” J. Appl. Phys. 97, 124105 (2005).
3.14. R. C. Miller and G. Weinreich, “Mechanism for the Sidewise Motion of 180° Domain Walls in Barium
Titanate,” Phys. Rev. 117, 1460-1466 (1960).
3.15. R. C. Miller and A. Savage, “Velocity of Sidewise 180° Domain-Wall Motion in BaTiO3 as a Function of the
Applied Electric Field,” Phys. Rev. 112, 755-762 (1958).
3.16. H. L. Stadler, “Ferroelectric Switching Time of BaTiO3 Crystals at High Voltages,” J. Appl. Phys. 29, 1485-
1487 (1958).
3.17. H. L. Stadler and P. J. Zachmanidis, “Nucleation and Growth of Ferroelectric Domains in BaTiO3 at Fields
from 2 to 450 kV/cm,” J. Appl. Phys. 34, 3255-3260 (1963).
3.18. G. Rosenman, A. Skliar, M. Oron, and M. Katz, ” Polarization reversal in KTiOPO4 crystals,” J. Phys. D: Appl.
Phys. 30, 277-282 (1997).

Chapter 3. Ferroelectrics
33
3.19. P. Urenski, M. Lesnykh, Y. Rosenwaks, G. Rosenman, and M. Molotskii, ”Anisotropic domain structure of
KTiOPO4 crystals,” J. Appl. Phys. 90, 1950-1954 (2001).
3.20. E. Fatuzzo and W. J. Merz, “Switching Mechanism, in Triglycine Sulfate and Other Ferroelectrics,” Phys. Rev.
116, 61-68 (1959).
3.21. V. Gopalan and T. E. Mitchell, “Wall velocities, switching times, and the stabilization mechanism of 180°
domains in congruent LiTaO3 crystals,” J. Appl. Phys. 83, 941-954 (1998).

34

35
Chapter 4. KTP, RKTP and KTA
4.1. Introduction
The KTP isomorphs have a unit formula, MTiOXO4, where M usually is K, Rb, Cs or Tl, and X
can be P or As. Mixed compositions, such as, e.g., RbXK1-XTiOPO4, are also available. These
crystals do not occur in nature. The first report of KTP synthesis dates back to 1890 [4.1],
however, it was not until the 1970s that KTP and its isomorphs attracted some interest, primarily
as nonlinear media for frequency conversion applications [4.2]. These materials are biaxial
nonlinear crystals with many excellent properties, such as relatively high nonlinearity, high
damage threshold, low optical losses, physical and chemical stability, etc., which make them very
attractive for nonlinear optics.
The crystal structure of KTP was determined for the first time in 1974 by Tordjman [4.1, 4.3],
whereas its ferroelectric properties were first reported in the 1980s [4.4]. Reports of periodic
poling of KTP date back to the 1990s. Various methods were employed to achieve periodic
poling in KTP, including electric field poling using chemical patterning [4.5], electron beam
writing [4.6], poling at low temperatures [4.7], as well as electric field poling at room
temperature [4.8].
This thesis deals mainly with periodic poling of KTP, KTA and bulk Rb-doped KTP (RKTP)
crystals. Some important properties of these crystals are outlined in this chapter.
4.2. Crystal structure
The KTP isomorphs are orthorhombic and belong to the point group 2mm and the space group
Pna21. The crystallographic axes a, b and c correspond to the optical axes x, y and z, respectively.
The crystal lattice constants for KTP and KTA are given in Table 4.1 [4.9, 4.10]. Every unit cell
of a KTP isomorph consists of four asymmetric units, with two formula units per cell.
Table 4.1. Crystal lattice constants of KTP and KTA.
Material Crystallographic axis, Å
A b c
KTP 12.819 6.399 10.584
KTA 13.130 6.581 10.781
Note that owing to very low dopant concentration, the lattice constants for bulk Rb-doped KTP
can be considered the same as those of KTP.
The crystal structure of KTP consists of PO4 tetrahedra and distorted TiO6 octahedra, with
large cavities in the framework, occupied by the alkali ions, as illustrated in Fig. 4.1. PO4
tetrahedra are replaced by AsO4 tetrahedra in the KTA crystals. There are eight oxygen atoms
bonding both titanium and phosphorus/arsenic atoms. Two oxygen atoms bond only titanium
atoms.

4.2. Crystal structure
36
Fig. 4.1. Crystal structure of KTP, viewed in the (010) direction. TiO6 octahedra are given in blue, PO4 tetrahedra – in orange, and
K+ ions – in purple color (adapted from [4.9]).
The titanium atoms are displaced in the TiO6 octahedra, therefore the length of the Ti-O bonds is
different. The difference in the Ti-O bond lengths has been suggested as the partial cause of the
optical nonlinearity in the KTP crystals. An analysis of KSnOPO4 (KSP) crystals performed by
Thomas et al. [4.11], showed that these crystals are closer to being centrosymmetric, because the
SnO6 octahedra in these crystals are much less distorted than TiO6 in KTP. The SHG output of
KSP crystals is only 2% of that of KTP. It has also been shown that the Ti-O bonds are strongly
covalent [4.12]. Indeed, the large polarizability of the short covalent Ti-O bonds could also
explain the nonlinearity of KTP. On the other hand, the TiO6 groups are less distorted in KTA;
however, the nonlinearity of KTA is similar to that of KTP. Another study indicates that the TiO6
and P(1)O4 groups are mainly responsible for the linear optical properties, and that the
nonlinearity comes from the KOx (x = 8, 9) and the P(2)O4 groups [4.13]. These contradicting
reports indicate that the degree of contribution of the different bonds to the nonlinearity is not yet
completely determined.
The cavities, accommodating the cations in the KTP crystal framework, are slightly stretched
in the polar direction, forming open channels along the c axis, as shown in Fig. 4.2. These
channels are responsible for the high ionic conductivity of KTP and KTA. A cation can occupy
one of two alternative sites within each cavity. These sites are designated as K(1) and K(2). In the
KTP and the KTA crystals both sites are occupied by K+ ions, with the K(1) site being eight-
coordinated and the K(2) site being nine-coordinated.

Chapter 4. KTP, RKTP and KTA
37
Fig. 4.2. Ionic transport channels in the KTP crystal structure, viewed in the (001) direction (adapted from [4.9]).
The RKTP crystals reported in this thesis are grown from a flux containing 1.4 mol% Rb+,
resulting in 0.3% Rb+ ions replacing K
+ ions in the bulk of the grown crystals [4.14]. Rubidium
ions preferentially occupy the larger K(2) sites within the crystal structure, when the Rb+
concentration is low [4.15].
It has been suggested that domain inversion in the KTP isomorphs occurs by shifting the alkali
ions to the alternative sites in the –c direction, with a slight relaxation of the oxygen sublattice
[4.16]. The eight-coordinated alkali ion becomes nine-coordinated and the nine-coordinated
alkali ion becomes eight-coordinated. Then the crystal structure is reproduced with the reversed
polarity.
Fig. 4.3. Schematic view of the opposite polarity domains in KTP, linked through the P(1) atoms (adapted from [4.17]).

4.3. Crystal growth
38
An X-ray study of the structural matching at the domain walls performed by Pernot-
Rejmankova et al., indicates that the P(1) atom is the pivotal point, linking the inverted domains
in the periodically poled KTP crystal, as shown in Fig. 4.3 [4.17].
4.3. Crystal growth
The most convenient method to grow large single crystals is to pull the seed from a melt of the
material while at the same time controlling the temperature gradients. A necessary condition for
this method is that the material melts congruently, i.e., the liquid composition of the material
must remain the same as that of the solid. Unfortunately, this is not the case for the KTP
isomorphs since they decompose before the melting point is reached. There are two alternative
techniques for growing these crystals: the so-called hydrothermal and the flux growth methods.
The most commonly used technique to grow relatively large single crystals of KTP is the flux
growth. The term “flux” refers to a solvent containing the crystal components. Fluxes used for
growing the KTP isomorphs usually contain various phosphates/arsenates or tungstates. If the
flux contains only the crystal components, it is called self-flux. Various dopants can be added to
the flux in order to modify the properties of the crystals to be grown. In all of the cases, the
crystals are grown in a high temperature flux, usually within 700-1000 °C, depending on the
solvents used; however, below the crystal’s melting temperature. For example, KTP crystals can
be grown from K6P4O13 flux between 928 °C and 840 °C [4.18].The crystal growth starts from a
seed, placed in the coldest spot in the flux in order to avoid secondary nucleations, and continues
while the temperature of the container with the flux is slowly decreased. Good temperature
stability (better than ±0.05 K) and low temperature gradients ensure low thermal strain. It is also
important to ensure sufficient flux convection, therefore, the crystal is usually rotated. Flow
inhomogeneity is avoided by periodically changing the rotation direction.
The usual morphology of an as-grown KTP crystal is shown in Fig. 4.4 [4.1]. The crystal tends
to grow on the (100), (201), (011) and (110) planes. The (201) and (011) faces form sharp caps
along the polar direction. The growth rates of the different facets vary depending on the growth
parameters, such as the flux components used, and the flux saturation, the temperature, etc.
Depending on the growth process, other morphologies are also available; for instance, the growth
process can be modified to have a morphology exhibiting (001) faces, which is favorable for
growing periodically patterned crystals from a periodically poled seed [4.19]. The disadvantages
of the flux growth method include slow crystal growth, different growth rates of the facets and
flux impurities. On the other hand, this method is simpler and less expensive compared to the
hydrothermal growth.
Alternatively, KTP isomorphs can be grown using the hydrothermal technique. The term
“hydrothermal“ originates from the field of geological research. The first crystals grown using
this technique date from the 19th
century. In this method, the material is first dissolved in a
mineralizer and then recrystallized using high pressure and high temperature.

Chapter 4. KTP, RKTP and KTA
39
Fig. 4.4. Morphology of the KTP crystals [4.1].
The growth is performed in an autoclave, which must be able to withstand corrosive solvents
under the high pressures and temperatures. A temperature gradient is created across the
autoclave, so that the nutrient is dissolved in the hot part and then the crystallization occurs in the
cooler part. The convection currents generated by the temperature gradient ensure the transport of
the material from the hot part to the cooler part. Hydrothermal growth of KTP can be done using
a 2M K2HPO4 mineralizer at a temperature of 400 °C and at a pressure of 1 kbar [4.20]. KTA
crystals can also be grown using the hydrothermal method from a 4M KH2AsO4 mineralizer at a
temperature of 590 °C and at a pressure of 1.7 kbar [4.21]. The main advantage of this method is
that high quality crystals with a low concentration of vacancies can be grown; however, the
special growth conditions and the need for complex equipment make this method a very
expensive alternative.
4.4. Ionic conductivity
KTP and its isomorphs are ionic conductors. As already mentioned in Section 4.2, the crystal
framework forms open channels along the polar direction, allowing the alkali ions to move via a
vacancy hopping mechanism when an electric field is applied across the crystal. Since the
channels are formed along the polar direction, the ionic conductivity is highly anisotropic. The
magnitude of the conductivity can vary depending on the isomorph composition and the growth
process. Potassium vacancies V(K+) are the main defects responsible for the high ionic
conductivity of the KTP isomorphs. These defects are dominant in the flux-grown crystals and
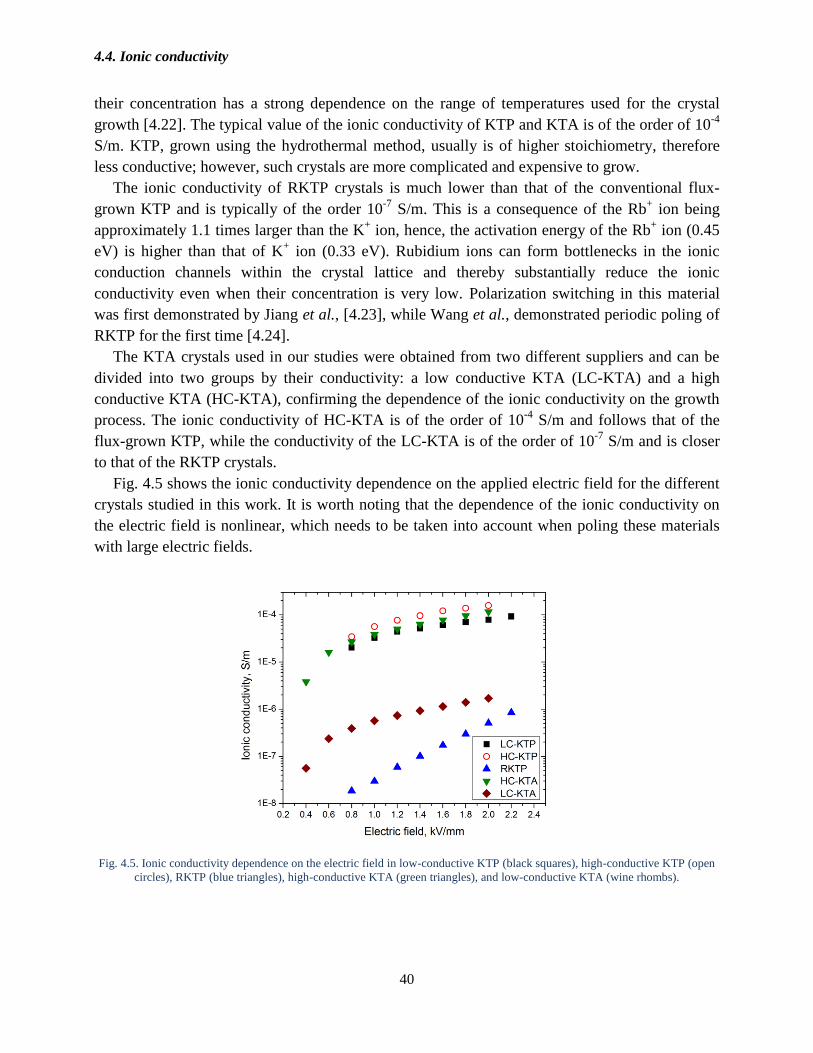
4.4. Ionic conductivity
40
their concentration has a strong dependence on the range of temperatures used for the crystal
growth [4.22]. The typical value of the ionic conductivity of KTP and KTA is of the order of 10-4
S/m. KTP, grown using the hydrothermal method, usually is of higher stoichiometry, therefore
less conductive; however, such crystals are more complicated and expensive to grow.
The ionic conductivity of RKTP crystals is much lower than that of the conventional flux-
grown KTP and is typically of the order 10-7
S/m. This is a consequence of the Rb+ ion being
approximately 1.1 times larger than the K+ ion, hence, the activation energy of the Rb
+ ion (0.45
eV) is higher than that of K+ ion (0.33 eV). Rubidium ions can form bottlenecks in the ionic
conduction channels within the crystal lattice and thereby substantially reduce the ionic
conductivity even when their concentration is very low. Polarization switching in this material
was first demonstrated by Jiang et al., [4.23], while Wang et al., demonstrated periodic poling of
RKTP for the first time [4.24].
The KTA crystals used in our studies were obtained from two different suppliers and can be
divided into two groups by their conductivity: a low conductive KTA (LC-KTA) and a high
conductive KTA (HC-KTA), confirming the dependence of the ionic conductivity on the growth
process. The ionic conductivity of HC-KTA is of the order of 10-4
S/m and follows that of the
flux-grown KTP, while the conductivity of the LC-KTA is of the order of 10-7
S/m and is closer
to that of the RKTP crystals.
Fig. 4.5 shows the ionic conductivity dependence on the applied electric field for the different
crystals studied in this work. It is worth noting that the dependence of the ionic conductivity on
the electric field is nonlinear, which needs to be taken into account when poling these materials
with large electric fields.
Fig. 4.5. Ionic conductivity dependence on the electric field in low-conductive KTP (black squares), high-conductive KTP (open
circles), RKTP (blue triangles), high-conductive KTA (green triangles), and low-conductive KTA (wine rhombs).

Chapter 4. KTP, RKTP and KTA
41
4.5. Optical properties
The nonlinear coefficient matrix in KTP is:
[
]. (4.5.1)
The nonlinear coefficients for KTP and KTA are given in Table 4.2. For QPM applications,
usually the largest d33 coefficient is used.
Table 4.2. Nonlinear coefficients in KTP and KTA.
d15 d24 d31 d32 d33
KTP @ 1064 nm, pm/V [4.25] 1.91 3.64 2.54 4.35 16.9
KTA @ 1064 nm, pm/V [4.26] 2.3 3.2 2.8 4.2 16.2
The optically induced damage threshold is an important parameter of any nonlinear crystal,
since it indicates the amount of optical power which can be safely transmitted through the
nonlinear medium. The necessity to keep the laser beam intensity below this threshold may also
limit the efficiency of the nonlinear frequency conversion process. There are several different
mechanisms which can cause optical damage in nonlinear crystals:
1. Linear absorption, dominant with CW, long (>1 μs) pulses and high repetition rate pulse trains.
2. Avalanche ionization, pronounced for shorter pulses (<1 μs).
3. Multiphoton ionization, dominant with ultra-short (femtosecond) pulses.
Defects, imperfections, and impurities may act as absorption centers or as a source of initial
free electrons, and, thereby, play an important role in the ability of the nonlinear material to
handle high optical power. Since the concentration of impurities and defects may vary in the
crystal, depending on the sample preparation process, the damage threshold is usually presented
as a statistical quantity. The damage threshold at the crystal surfaces is usually lower than that in
the crystal bulk. The single-shot optical damage threshold is higher compared to the one when the
crystal is irradiated with multiple pulses due to accumulation effects. Optical damage may be
caused by a single dominant mechanism, or by a combination of different mechanisms. Optically
induced damage threshold is a function of the wavelength, pulse duration, pulse repetition rate,
focal spot dimensions and the polarization; therefore, these parameters must always be indicated
together with the measured damage threshold value.
Most optical damage investigations in KTP were done employing nanosecond pulses. Some
damage threshold values for KTP are given in Table 4.3. For arbitrary polarized nanosecond
pulses, the damage threshold of KTP is ~2-3 GW/cm2. For comparison, the damage threshold of
another extensively used QPM material – near-stoichiometric LiTaO3, in the nanosecond regime,
is ~600 MW/cm2 [4.27].
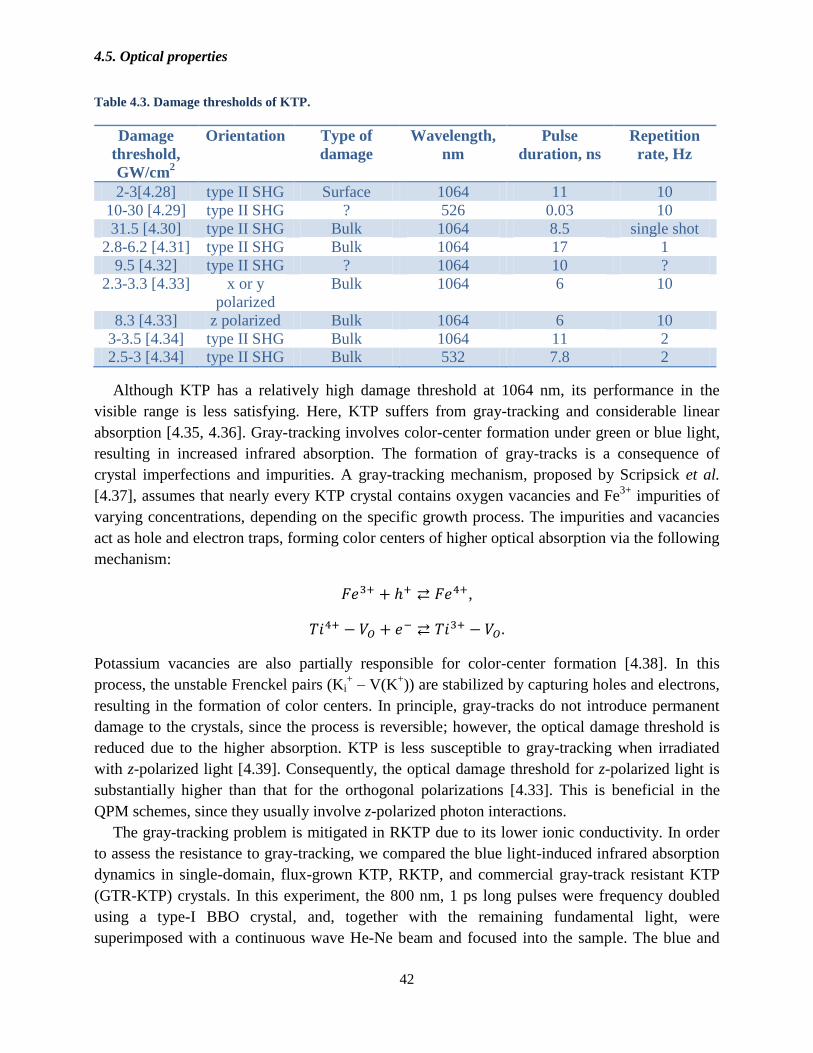
4.5. Optical properties
42
Table 4.3. Damage thresholds of KTP.
Damage
threshold,
GW/cm2
Orientation Type of
damage
Wavelength,
nm
Pulse
duration, ns
Repetition
rate, Hz
2-3[4.28] type II SHG Surface 1064 11 10
10-30 [4.29] type II SHG ? 526 0.03 10
31.5 [4.30] type II SHG Bulk 1064 8.5 single shot
2.8-6.2 [4.31] type II SHG Bulk 1064 17 1
9.5 [4.32] type II SHG ? 1064 10 ?
2.3-3.3 [4.33] x or y
polarized
Bulk 1064 6 10
8.3 [4.33] z polarized Bulk 1064 6 10
3-3.5 [4.34] type II SHG Bulk 1064 11 2
2.5-3 [4.34] type II SHG Bulk 532 7.8 2
Although KTP has a relatively high damage threshold at 1064 nm, its performance in the
visible range is less satisfying. Here, KTP suffers from gray-tracking and considerable linear
absorption [4.35, 4.36]. Gray-tracking involves color-center formation under green or blue light,
resulting in increased infrared absorption. The formation of gray-tracks is a consequence of
crystal imperfections and impurities. A gray-tracking mechanism, proposed by Scripsick et al.
[4.37], assumes that nearly every KTP crystal contains oxygen vacancies and Fe3+
impurities of
varying concentrations, depending on the specific growth process. The impurities and vacancies
act as hole and electron traps, forming color centers of higher optical absorption via the following
mechanism:
,
Potassium vacancies are also partially responsible for color-center formation [4.38]. In this
process, the unstable Frenckel pairs (Ki+ – V(K
+)) are stabilized by capturing holes and electrons,
resulting in the formation of color centers. In principle, gray-tracks do not introduce permanent
damage to the crystals, since the process is reversible; however, the optical damage threshold is
reduced due to the higher absorption. KTP is less susceptible to gray-tracking when irradiated
with z-polarized light [4.39]. Consequently, the optical damage threshold for z-polarized light is
substantially higher than that for the orthogonal polarizations [4.33]. This is beneficial in the
QPM schemes, since they usually involve z-polarized photon interactions.
The gray-tracking problem is mitigated in RKTP due to its lower ionic conductivity. In order
to assess the resistance to gray-tracking, we compared the blue light-induced infrared absorption
dynamics in single-domain, flux-grown KTP, RKTP, and commercial gray-track resistant KTP
(GTR-KTP) crystals. In this experiment, the 800 nm, 1 ps long pulses were frequency doubled
using a type-I BBO crystal, and, together with the remaining fundamental light, were
superimposed with a continuous wave He-Ne beam and focused into the sample. The blue and

Chapter 4. KTP, RKTP and KTA
43
the infrared light was polarized parallel and perpendicular to the crystal z-axis, respectively. The
dynamics of the color-center concentration in the samples, after starting the exposure to the
picosecond pulses, was determined by measuring the changes in the transmission of the He-Ne
beam. Figure 4.6 shows the gray-tracking dynamics of the investigated RKTP, KTP and the
GTR-KTP crystals.
Fig. 4.6. Induced absorption dynamics in RKTP, KTP, and GTR-KTP.
It is clear that RKTP presents the highest resistance to gray-tracking. This can be attributed to the
fact that RKTP has a reduced effective mobility of the potassium vacancies. Surprisingly, in the
blue spectral region, GTR-KTP appears to be the most susceptible to gray-tracking. Owing to the
proprietary process of the crystal growth, there is not enough information to determine the
physical reasons of this strong susceptibility to gray-tracking in GTR-KTP.
The transmission spectra for KTP and KTA crystals are shown in Fig. 4.7 [4.40].
Fig. 4.7. Transmission windows of KTP and KTA in the E||z direction [40].

4.6. Sellmeier equations
44
The transmission window of KTP is approximately 0.35-4.3 µm, with a strong absorption feature
at ~2.8 µm, caused by OH- impurities, incorporated into the crystals during the growth process.
The transparency of KTA extends to ~5.2 µm in the infrared spectral range.
A higher linear absorption in KTP at 532 nm leads to thermal dephasing and, consequently, to
lower conversion efficiency, long-term stability and optical damage threshold in SHG
applications. The absorption spectra in the visible region for KTP, RKTP and KTA crystals from
different vendors are shown in Fig. 4.8.
Fig. 4.8. Absorption as a function of wavelength in KTP, RKTP and KTA crystals for z-polarized light.
Obviously, all evaluated crystals show different absorption properties in the visible spectral
range. The most striking difference can be observed among the KTA crystals obtained from
vendor I and KTA crystals from vendors II and III. It is also interesting that the difference in
absorption among the LC-KTA and HC-KTA crystals, obtained from vendor I, is not significant,
even though they substantially differ in their ionic conductivity. This suggests that the increased
absorption in the KTA crystals from vendors II and III is likely connected to the impurities which
might have been introduced during the growth process to prevent multi-domain crystal formation
[4.26]. This also raises the question if the reduced linear absorption in the visible range is an
intrinsic property of the KTA crystals, or whether the growth process of KTP and RKTP crystals
can be improved in order to reduce the linear absorption in these crystals.
4.6. Sellmeier equations
The QPM grating period in the KTP isomorphs may vary from a few hundred nanometers to a
few hundred micrometers depending on the application. For example, periods used for nonlinear
interactions, involving counter-propagating photons are in the sub-μm range, a PPKTP crystal
designed for SHG of 1064 nm has a period of 9.01 μm, and a 1064 nm pumped degenerate OPO
requires a period of 38.86 μm. The optimal period for a specific application depends on the
dispersive properties of the material, therefore, accurate knowledge of indices of refraction for

Chapter 4. KTP, RKTP and KTA
45
the interacting waves is needed. In addition, the temperature dependence of the refractive indices
is very important. The indices of refraction can be calculated using the Sellmeier equations. In
KTP and RKTP, the best results for wavelengths shorter than 1 μm can be obtained using the
Sellmeier equations derived by Fan et al. [4.41], together with the temperature correction from
Wiechmann et al. [4.42]. The Sellmeier equation in this case is given by:
. (4.6.1)
The temperature correction can be written as:
(4.6.2)
The coefficients A, B, C, D, E, F, and a, b, c, d are material specific, and λ is the vacuum
wavelength with units in microns. For wavelengths above 1 μm, the Sellmeier data derived by
Fradkin et al. [4.43], together with the temperature correction by Emanuelli and Arie [4.44], are
better optimized. In this case, Eq. (4.6.1) is suitable for calculating the index of refraction but the
temperature correction takes the form:
( ) ( ) (4.6.3)
where
∑
. (4.6.4)
Here the coefficients am are material specific.
Unfortunately, the available Sellmeier data for KTA do not give as good prediction as for
KTP. The Sellmeier equation for KTA, derived by Kato and Umemura [4.45], gives the best
results for the wavelengths shorter than 1 μm and is given by:
, (4.6.5)
while Eq. (4.6.2) can be used to calculate the refractive index temperature dependence. For
wavelengths longer than 1 μm, the Sellmeier data by Fradkin-Kashi et al. [4.46], together with
the temperature correction by Emanuelli and Arie [4.44] gives better results. The index of
refraction, in this case, can be calculated using Eq. (4.6.1), while the temperature correction can
be calculated using Eqs. (4.6.3) and (4.6.4). The Sellmeier coefficients for KTP and KTA are
given in Table 4.4. The coefficients for temperature correction evaluation for wavelengths below
1 μm are given in Table 4.5 and for wavelengths above 1 μm – in Table 4.6.
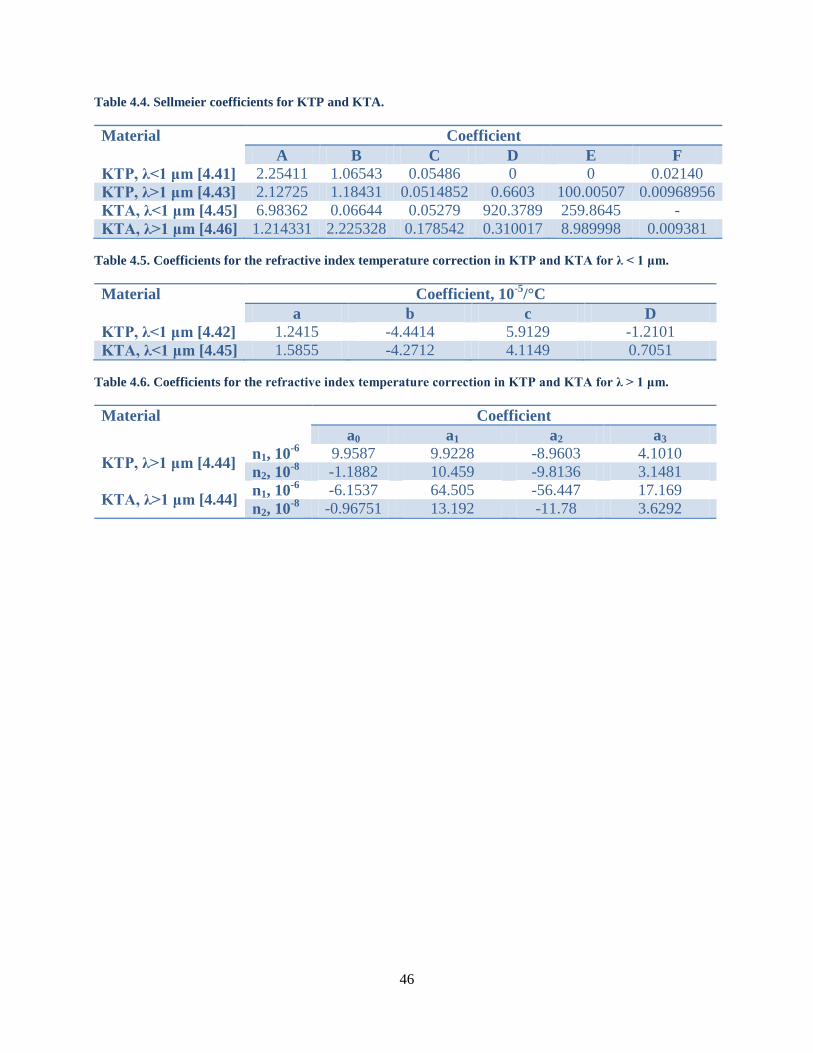
46
Table 4.4. Sellmeier coefficients for KTP and KTA.
Material Coefficient
A B C D E F
KTP, λ<1 μm [4.41] 2.25411 1.06543 0.05486 0 0 0.02140
KTP, λ>1 μm [4.43] 2.12725 1.18431 0.0514852 0.6603 100.00507 0.00968956
KTA, λ<1 μm [4.45] 6.98362 0.06644 0.05279 920.3789 259.8645 -
KTA, λ>1 μm [4.46] 1.214331 2.225328 0.178542 0.310017 8.989998 0.009381
Table 4.5. Coefficients for the refractive index temperature correction in KTP and KTA for λ < 1 μm.
Material Coefficient, 10-5
/°C
a b c D
KTP, λ<1 μm [4.42] 1.2415 -4.4414 5.9129 -1.2101
KTA, λ<1 μm [4.45] 1.5855 -4.2712 4.1149 0.7051
Table 4.6. Coefficients for the refractive index temperature correction in KTP and KTA for λ > 1 μm.
Material Coefficient
a0 a1 a2 a3
KTP, λ>1 μm [4.44] n1, 10
-6 9.9587 9.9228 -8.9603 4.1010
n2, 10-8
-1.1882 10.459 -9.8136 3.1481
KTA, λ>1 μm [4.44] n1, 10
-6 -6.1537 64.505 -56.447 17.169
n2, 10-8
-0.96751 13.192 -11.78 3.6292

Chapter 4. KTP, RKTP and KTA
47
References 4.1. J. Nordborg, “Non-linear Optical Titanyl Arsenates,” Doctoral thesis, Department of Inorganic Chemistry,
Chalmers University of Technology (Göteborg, Sweden, 2000).
4.2. F. C. Zumsteg, J. D. Bierlein, and T. E. Gier, “KxRb1−xTiOPO4: A new nonlinear optical material,” J. Appl.
Phys. 47, 4980-4985 (1976).
4.3. P. I. Tordjman, R. Masse, and J. C. Guitel, ”Structure Cristalline du Monophosphate KTiPO5,” Zeitschrift für
Kristallographie 139, 103-115 (1974).
4.4. V. K. Yanovskii, and V. I. Voronkova, “Ferroelectric Phase Transitions and Properties of Crystals of the
KTiOPO4 Family,” Phys. Status Solidi 93, 665-668 (1986).
4.5. W. P. Risk, and S. D. Lau, “Periodic electric field poling of KTiOPO4 using chemical patterning,” Appl. Phys.
Lett. 69, 3999-4001 (1996).
4.6. M. C. Gupta, W. P. Risk, A. C. G. Nutt, and S. D. Lau, ” Domain inversion in KTiOPO4 using electron beam
scanning,” Appl. Phys. Lett. 63, 1167-1169 (1993).
4.7. G. Rosenman, A. Skliar, D. Eger, M. Oron, and M. Katz, ”Low temperature periodic electrical poling of flux-
grown KTiOPO4 and isomorphic crystals,” Appl. Phys. Lett. 73, 3650-3652 (1998).
4.8. H. Karlsson and F. Laurell, “Electric field poling of flux grown KTiOPO4,” Appl. Phys. Lett. 71, 3474-3476
(1997).
4.9. D. R. Allan, J. S. Loveday, R. J. Nelmes, and P. A. Thomas, “A high-pressure structural study of potassium
titanyl phosphate (KTP) up to 5 GPa,” J. Phys. Condens. Matter 4, 2747-2760 (1992).
4.10. P. Pernot-Rejmankova, P. A. Thomas, P. Cloetens, F. Lorut, J. Baruchel, Z. W. Hu, P. Urenski, and G.
Rosenman, “Periodically poled KTA crystal investigated using coherent X-ray beams,” J. Appl. Cryst. 33, 1149-
1153 (2000).
4.11. P. A. Thomas, A. M. Glazer, and B. E. Watts, “Crystal Structure and Nonlinear Optical Properties of
KSnOPO4 and their Comparison with KTiOPO4,” Acta Cryst. B46, 333-343 (1990).
4.12. N. K. Hansen, J. Protas, and G. Marnier, “The electron-density distribution in KTiOPO4,” Acta Cryst. B47,
660-672 (1991).
4.13. D. Xue and S. Zhang, “The origin of nonlinearity in KTiOPO4,” Appl. Phys. Lett. 70, 943-945 (1997).
4.14. F. Masiello, T. A. Lafford, P. Pernot, J. Baruchel, D. S. Keeble, P. A. Thomas, A. Zukauskas, G. Strömqvist, F.
Laurell, and C. Canalias, “Investigation by coherent X-ray section topography of ferroelectric domain behaviour as a
function of temperature in periodically poled Rb:KTP,” J. Appl. Cryst. 44, 462-466 (2011).
4.15. P. A. Thomas, R. Duhlev, and S. J. Teat, “A comparative structural study of a flux-grown crystal of
K0.86Rb0.14TiOPO4 and an ion-exchanged crystal of K0.84Rb0.16TiOPO4” Acta Cryst. B50, 538-543 (1994).
4.16. R. A. Stolzenberger and M. P. Scripsick, “Recent advancements in the periodic poling and characterization of
RTA and its isomorphs,” Proc. SPIE 3610, 23-35 (1999).

References
48
4.17. P. Pernot-Rejmankova, P. A. Thomas, P. Cloetens, T. Lyford, and J. Baruchel, “Structural matching of
ferroelectric domains and associated distortion in potassium titanyl phosphate crystals,” J. Phys.: Condens.
Matter 15, 1613–1624 (2003).
4.18. R. J. Bolt, M. H. van der Mooren, and H. de Haas, ”Growth of KTiOPO4 (KTP) single crystals by means of
phosphate and phosphate/sulfate fluxes out of a three-zone furnace,” J. Cryst. Growth 114, 141-152 (1991).
4.19. A. Peña, B. Menaert, B. Boulanger, F. Laurell, C. Canalias, V. Pasiskevicius, P. Segonds, C. Felix, J. Debray
and S. Pairis, “Template-growth of periodically domain-structured KTiOPO4 [Invited],” Opt. Materials Express 1,
185-191 (2011).
4.20. R. A. Laudise, R. J. Cava, and A. J. Caporaso, “Phase relations, solubility and growth of potassium titanyl
phosphate, KTP,” J. Crystal Growth 74, 275-280 (1986).
4.21. R. F. Belt and J. B. Ings, “Hydrothermal growth of potassium titanyl arsenate (KTA) in large autoclaves,” J.
Crystal Growth 128, 956-962 (1993).
4.22. P. A. Morris, A. Ferretti, and J. D. Bierlein, “Reduction of the ionic conductivity of flux grown KTiOPO4
crystals,” J. Cryst. Growth 109, 367-375 (1991).
4.23. Q. Jiang, P. A. Thomas, K. B. Hutton, and R. C. C. Ward, “Rb-doped potassium titanyl phosphate for periodic
ferroelectric domain inversion,” J. Appl. Phys. 92, 2717-2723 (2002).
4.24. S. Wang, V. Pasiskevicius, and F. Laurell, “High-efficiency frequency converters with periodically-poled Rb-
doped KTiOPO4,” Opt. Mat. 30, 594-599 (2007).
4.25. H. Vanherzeele and J. D. Bierlein, “Magnitude of the nonlinear-optical coefficients of KTiOPO4,” Opt. Lett.
17, 982-984 (1992).
4.26. L. K. Cheng, L.-T. Cheng, J. D. Bierlein, F. C. Zumsteg, and A. A. Ballman, “Properties of doped and undoped
crystals of single domain KTiOAsO4,” Appl. Phys. Lett. 62, 346-348 (1993).
4.27. D. S. Hum, R. K. Route, G. D. Miller, V. Kondilenko, A. Alexandrovski, J. Huang, K. Urbanek, R. L. Byer,
and M. M. Fejer, “ Optical properties and ferroelectric engineering of vapor-transport-equilibrated, near-
stoichiometric lithium tantalate for frequency conversion,“ J. Appl. Phys. 101, 093108 (2007).
4.28. F. Ahmed, “Laser damage threshold of KTiOPO4,” Appl. Opt. 28, 119-122 (1989).
4.29. J. D. Bierlein and H. Vanherzeele, “Potassium titanyl phosphate: properties and new applications,” J. Opt. Soc.
Am. B 6, 622-633 (1989).
4.30. R. J. Bolt and M. van der Mooren, “Single shot bulk damage threshold and conversion efficiency
measurements on flux grown KTiOPO4 (KTP),” Opt. Commun. 100, 399-410 (1993).
4.31. X. B. Hu, H. Liu, J. Y. Wang, H. J. Zhang, H. D. Jiang, S. S. Jiang, Q. Li, Y. L. Tian, Y. Y. Huang, W. X.
Huang, and W. He, ”Comparative study of KTiOPO4 crystals,” Opt. Mat. 23, 369-372 (2003).
4.32. C. Zhang, L. Huang, W. Zhou, G. Zhang, H. Hou, Q. Ruan, W. Lei, S. Qin, F. Lu, Y. Zuo, H. Shen, and G.
Wang, “Growth of KTP crystals with high damage threshold by hydrothermal method,” J. Cryst. Growth 292, 364-
367 (2006).
Chapter 4. KTP, RKTP and KTA
49
4.33. F. R. Wagner, A. Hildenbrand, J. Y. Natoli, M. Commandre, F. Theodore, and H. Albrecht, “Laser damage
investigation in KTiOPO4 (KTP) and RbTiOPO4 (RTP) crystals: threshold anisotropy and the influence of SHG,”
Proc. SPIE 6720, 672015 (2007).
4.34. P. Yankov, D. Schumov, A. Monev, and A. Nenov, “Laser damage tests of large flux-grown KTiOPO4
crystals,” Opt. Lett. 18, 1771-1773 (1993).
4.35. J. Hirohashi, V. Pasiskevicius, S. Wang, and F. Laurell, “Picosecond blue-light-induced infrared absorption in
single-domain and periodically poled ferroelectrics,” J. Appl. Phys. 101, 033105 (2007).
4.36. S. Wang, V. Pasiskevicius, and F. Laurell, “Dynamics of green light-induced infrared absorption in KTiOPO4
and periodically poled KTiOPO4,” J. Appl. Phys. 96, 2023-2028 (2004).
4.37. M. P. Scripsick, D. N. Loiacono, J. Rottenberg, S. H. Goellner, L. E. Halliburton, and F. K. Hopkins, “Defects
responsible for gray tracks in flux-grown KTiOPO4,” Appl. Phys. Lett. 66, 3428-3430 (1995).
4.38. V. Mürk, V. Denks, A. Dudelzak, P.-P. Proulx, and V. Vassiltsenko, “Gray tracks in KTiOPO4: Mechanism of
creation and bleaching,” Nucl. Instrum. Methods Phys. Res., Sect. B 141, 472-476 (1998).
4.39. X. B. Hu, J. Y. Wang, H. J. Zhang, H. D. Jiang, H. Liu, X. D. Mu, and Y. J. Ding, “Dependence of
photochromic damage on polarization in KTiOPO4 crystals,” J. Cryst. Growth 247, 137-140 (2003).
4.40. G. Hansson, H. Karlsson, S. Wang, and F. Laurell, ” Transmission measurements in KTP and isomorphic
compounds,” Appl. Opt. 39, 5058-5069 (2000).
4.41. T. Y. Fan, C. E. Huang, B. Q. Hu, R. C. Eckardt, Y. X. Fan, R. L. Byer, and R. S. Feigelson, ” Second
harmonic generation and accurate index of refraction measurements in flux-grown KTiOPO4,” Appl. Opt. 26, 2390-
2394 (1987).
4.42. W. Wiechmann, S. Kubota, T. Fukui, and H. Masuda, “Refractive-index temperature derivatives of potassium
titanyl phosphate,” Opt. Lett. 18, 1208-1210 (1993).
4.43. K. Fradkin, A. Arie, A. Skliar, and G. Rosenman, “Tunable midinfrared source by difference frequency
generation in bulk periodically poled KTiOPO4,” Appl. Phys. Lett. 74, 914-916 (1999).
4.44. S. Emanueli and A. Arie, “Temperature-Dependent Dispersion Equations for KTiOPO4 and KTiOAsO4,” Appl.
Opt. 42, 6661-6665 (2003).
4.45. K. Kato, and N. Umemura, “Sellmeier and thermo-optic dispersion formulas for KTiOAsO4,” in Conference on
Lasers and Electro-Optics, CLEO 2004, Technical Digest (CD), (Optical Society of America, 2004), paper CThT35.
http://www.opticsinfobase.org/abstract.cfm?URI=CLEO-2004-CThT35
4.46. K. Fradkin-Kashi, A. Arie, P. Urenski, and G. Rosenman, ” Mid-infrared difference–frequency generation in
periodically poled KTiOAsO4 and application to gas sensing,” Opt. Lett. 25, 743-745 (2000).

50
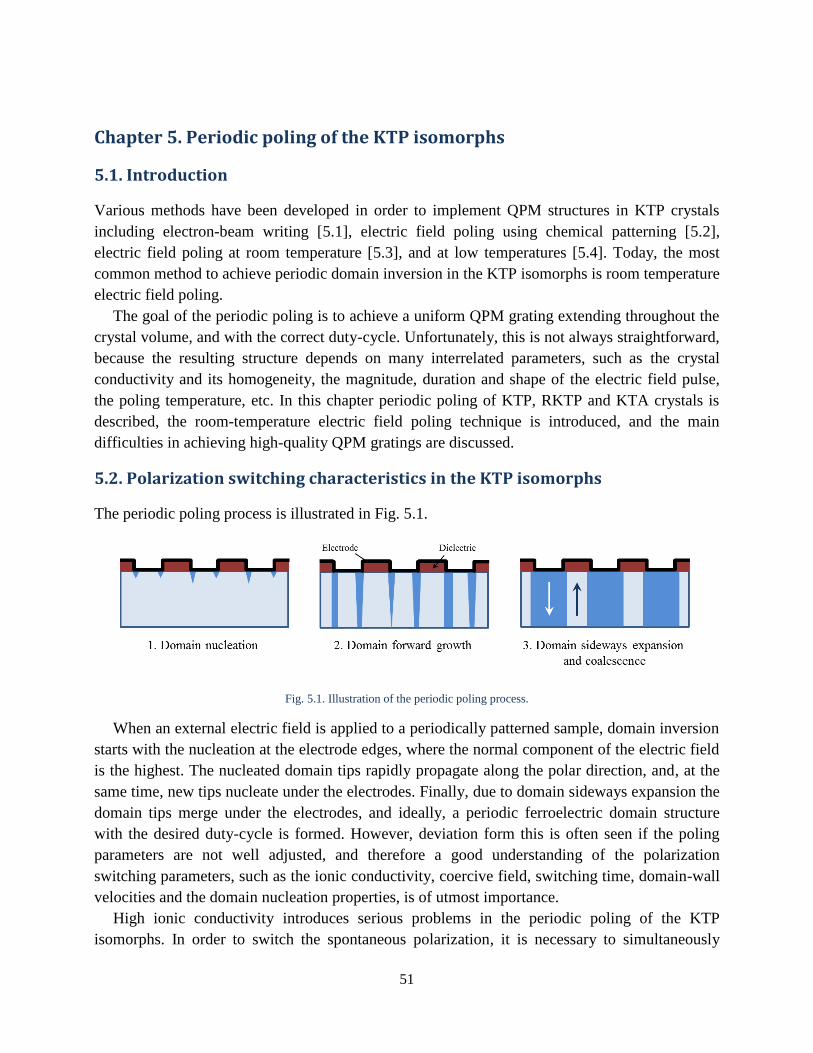
51
Chapter 5. Periodic poling of the KTP isomorphs
5.1. Introduction
Various methods have been developed in order to implement QPM structures in KTP crystals
including electron-beam writing [5.1], electric field poling using chemical patterning [5.2],
electric field poling at room temperature [5.3], and at low temperatures [5.4]. Today, the most
common method to achieve periodic domain inversion in the KTP isomorphs is room temperature
electric field poling.
The goal of the periodic poling is to achieve a uniform QPM grating extending throughout the
crystal volume, and with the correct duty-cycle. Unfortunately, this is not always straightforward,
because the resulting structure depends on many interrelated parameters, such as the crystal
conductivity and its homogeneity, the magnitude, duration and shape of the electric field pulse,
the poling temperature, etc. In this chapter periodic poling of KTP, RKTP and KTA crystals is
described, the room-temperature electric field poling technique is introduced, and the main
difficulties in achieving high-quality QPM gratings are discussed.
5.2. Polarization switching characteristics in the KTP isomorphs
The periodic poling process is illustrated in Fig. 5.1.
Fig. 5.1. Illustration of the periodic poling process.
When an external electric field is applied to a periodically patterned sample, domain inversion
starts with the nucleation at the electrode edges, where the normal component of the electric field
is the highest. The nucleated domain tips rapidly propagate along the polar direction, and, at the
same time, new tips nucleate under the electrodes. Finally, due to domain sideways expansion the
domain tips merge under the electrodes, and ideally, a periodic ferroelectric domain structure
with the desired duty-cycle is formed. However, deviation form this is often seen if the poling
parameters are not well adjusted, and therefore a good understanding of the polarization
switching parameters, such as the ionic conductivity, coercive field, switching time, domain-wall
velocities and the domain nucleation properties, is of utmost importance.
High ionic conductivity introduces serious problems in the periodic poling of the KTP
isomorphs. In order to switch the spontaneous polarization, it is necessary to simultaneously

5.2. Polarization switching characteristics in the KTP isomorphs
52
supply an electric field exceeding the coercive field of the material, together with a sufficient
amount of charge, in order to compensate the ionic current that screens the switching. The shape
and the length of the electric field pulse should be designed in a way that will prevent excessive
ion-migration in the crystal, which can lead to material breakdown, while at the same time
promoting large domain-velocity anisotropy in the in-plane and the polar directions. Therefore,
these requirements may impose some limitations, set by the available poling equipment. In
addition, high ionic conductivity is one of the dominant factors influencing the domain
broadening during the periodic poling process.
Typically, a pronounced variation of the conductivity can be observed across the as-purchased
crystal wafers, which can drastically affect the switching characteristics. The conductivity along
the polar direction can be determined by applying electric field pulses and measuring the ionic
current through a probe with a known surface area. The electric field is applied in the direction
parallel to the spontaneous polarization in order to avoid polarization reversal. The spontaneous
polarization direction is determined using a d33 piezo tester. By measuring the conductivity in
multiple points across the wafer it is possible to obtain a conductivity map and thereby determine
the homogeneity of the wafer. A typical conductivity map of a flux-grown KTP is shown in Fig.
5.2(a).
Fig. 5.2. Ionic conductivity map of KTP (a), RKTP (b) wafers.
Usually, the conductivity variation along the x axis of the wafer is small, while the variation
along the y axis is much more pronounced, sometimes as much as an order of magnitude, and has
a parabolic shape. A similar conductivity profile has been obtained for RKTP wafers (Fig.
5.2(b)). Note that the RKTP conductivity is approximately two orders of magnitude lower than
that of the flux-grown KTP.
In general, such behavior should also apply to the KTA crystals, however, the KTA crystals
used in this project were purchased already cut and polished as single pieces of size of 10 × 5 × 1
mm3 along x, y and z axes, respectively. Unfortunately, it was not possible to obtain conductivity
maps or to track the crystal-to-crystal relation in this case.
The coercive field of the material determines the peak voltage of the pulses used for the
periodic poling. It can be determined by observing the switching current under a linearly ramped
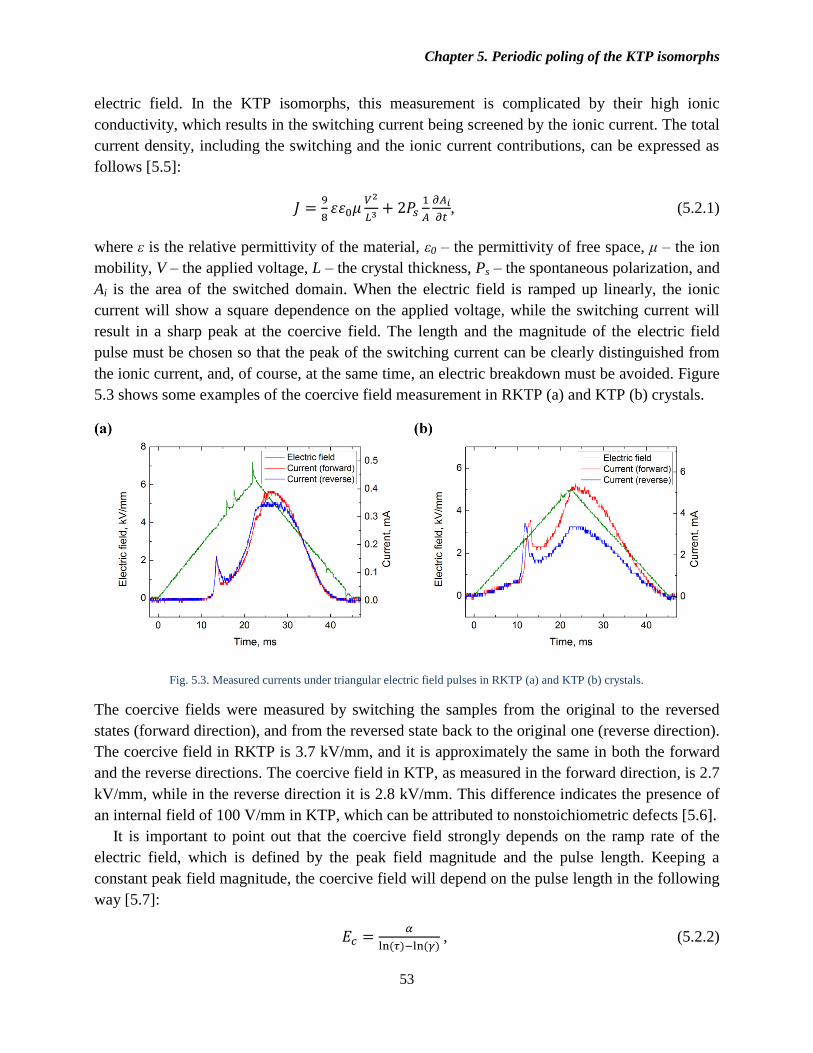
Chapter 5. Periodic poling of the KTP isomorphs
53
electric field. In the KTP isomorphs, this measurement is complicated by their high ionic
conductivity, which results in the switching current being screened by the ionic current. The total
current density, including the switching and the ionic current contributions, can be expressed as
follows [5.5]:
, (5.2.1)
where ε is the relative permittivity of the material, ε0 – the permittivity of free space, μ – the ion
mobility, V – the applied voltage, L – the crystal thickness, Ps – the spontaneous polarization, and
Ai is the area of the switched domain. When the electric field is ramped up linearly, the ionic
current will show a square dependence on the applied voltage, while the switching current will
result in a sharp peak at the coercive field. The length and the magnitude of the electric field
pulse must be chosen so that the peak of the switching current can be clearly distinguished from
the ionic current, and, of course, at the same time, an electric breakdown must be avoided. Figure
5.3 shows some examples of the coercive field measurement in RKTP (a) and KTP (b) crystals.
Fig. 5.3. Measured currents under triangular electric field pulses in RKTP (a) and KTP (b) crystals.
The coercive fields were measured by switching the samples from the original to the reversed
states (forward direction), and from the reversed state back to the original one (reverse direction).
The coercive field in RKTP is 3.7 kV/mm, and it is approximately the same in both the forward
and the reverse directions. The coercive field in KTP, as measured in the forward direction, is 2.7
kV/mm, while in the reverse direction it is 2.8 kV/mm. This difference indicates the presence of
an internal field of 100 V/mm in KTP, which can be attributed to nonstoichiometric defects [5.6].
It is important to point out that the coercive field strongly depends on the ramp rate of the
electric field, which is defined by the peak field magnitude and the pulse length. Keeping a
constant peak field magnitude, the coercive field will depend on the pulse length in the following
way [5.7]:
( ) ( ) , (5.2.2)
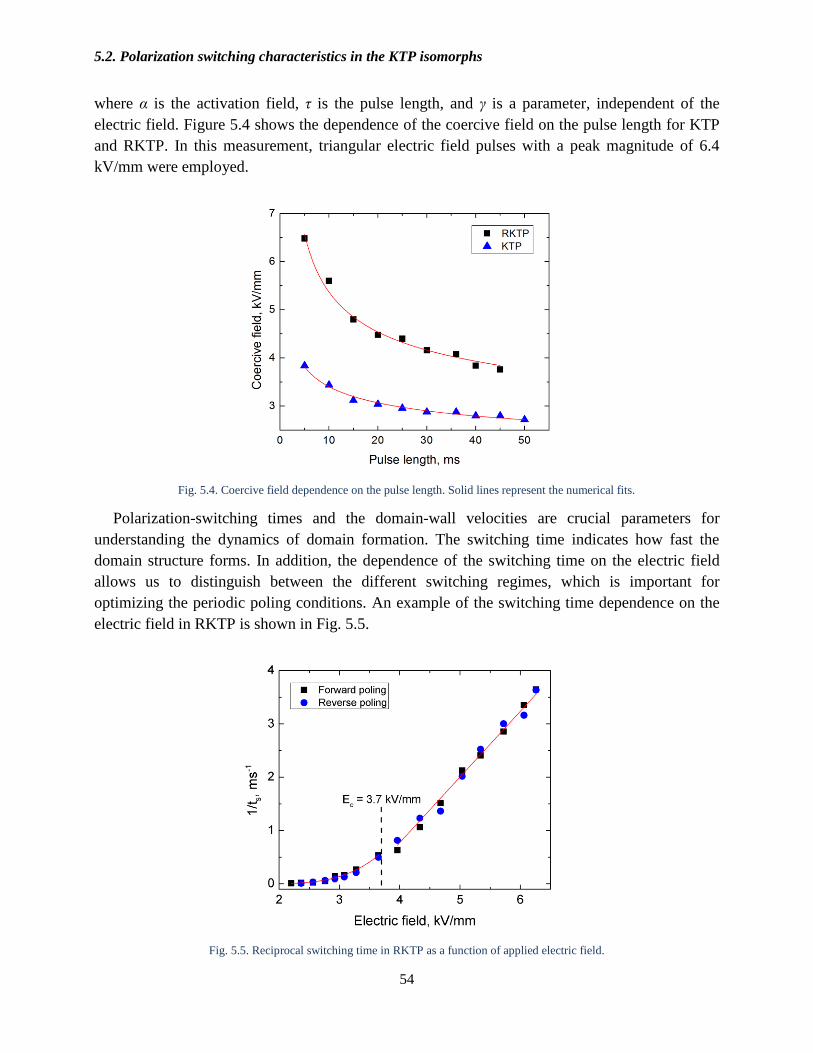
5.2. Polarization switching characteristics in the KTP isomorphs
54
where α is the activation field, τ is the pulse length, and γ is a parameter, independent of the
electric field. Figure 5.4 shows the dependence of the coercive field on the pulse length for KTP
and RKTP. In this measurement, triangular electric field pulses with a peak magnitude of 6.4
kV/mm were employed.
Fig. 5.4. Coercive field dependence on the pulse length. Solid lines represent the numerical fits.
Polarization-switching times and the domain-wall velocities are crucial parameters for
understanding the dynamics of domain formation. The switching time indicates how fast the
domain structure forms. In addition, the dependence of the switching time on the electric field
allows us to distinguish between the different switching regimes, which is important for
optimizing the periodic poling conditions. An example of the switching time dependence on the
electric field in RKTP is shown in Fig. 5.5.
Fig. 5.5. Reciprocal switching time in RKTP as a function of applied electric field.

Chapter 5. Periodic poling of the KTP isomorphs
55
Two different polarization-switching regimes can be distinguished: the low-field regime
(below Ec), where the switching is limited by domain nucleation, and the high-field regime
(above Ec), where the polarization switching is dominated by the domain wall motion. Similar
results have been obtained for KTP crystals [5.5].
The domain-wall velocities determine the domain anisotropy and can be estimated by the
Miller and Savage method [5.8]: an electric field pulse is applied to the sample and the resulting
domain structure is observed; the domain-wall velocity is defined as the average domain width
divided by the electric field pulse length. In KTP, the estimated velocity in the y direction is ~30
times larger than that in the x direction. The domain-wall velocity along the polar axis is at least
two orders of magnitude higher than that in the lateral directions [5.5].
The ferroelectric-electrode interface is one of the key factors influencing the domain
nucleation rate. Experimentally, it has been determined that an aluminum film, deposited on the
c- polar face, enhances the domain nucleation in KTP isomorphs. Fig. 5.6 compares the density of
the nucleation sites in a virgin RKTP sample ((a) and (b)) to that of RKTP samples metallized on
the c- face (c), and the c
+ face (d).
Fig. 5.6. Nucleation sites on the c- face (a) and c+ face (b) of a virgin RKTP crystal, RKTP crystal with an aluminum film on c-
face (c) and RKTP crystal with an aluminum film on c+ face (d).

5.3. Domain broadening
56
In all of the cases, a 5 ms long symmetric triangular pulse with a peak magnitude of 5 kV/mm
was applied. As can be seen, the nucleation density is the highest in the RKTP sample with an
aluminum film deposited on the c- face; therefore, this face is a preferential choice for patterning.
A similar behavior can be observed in other KTP isomorphs.
5.3. Domain broadening
A periodic electrode pattern distorts the distribution of the normal component of the applied
electric field, Ez, and gives rise to a tangential component, Ex. The distributions of Ez and Ex are
shown in Fig. 5.7.
Fig. 5.7. Electric field distribution of the normal component (a) and tangential component (b) in ferroelectric crystal due to the
electrode edge [5.9].
During the polarization-switching, the depolarization energy is minimized by the externally
supplied compensation charges. The Ez component is responsible for the inversion of the
spontaneous polarization. The domain reversal starts at the edges of the electrodes, since the Ez
component is much higher there than in the bulk. However, compensation charges may also be
injected under the isolating photoresist layer by the high tangential electric field component, Ex, if
the conductivity of the crystal is high enough, leading to domain nucleation and growth under the
dielectric, causing domain broadening. The width of the domain, growing under the insulating
layer, is [5.9]:
, (5.3.1)
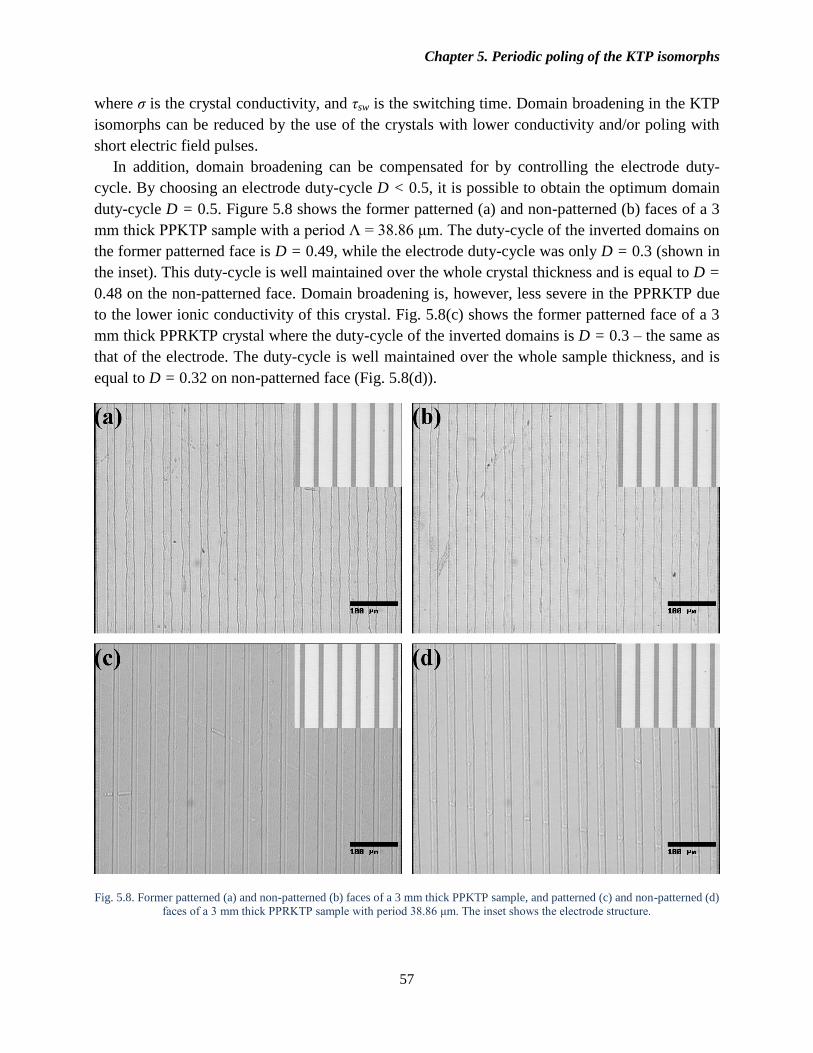
Chapter 5. Periodic poling of the KTP isomorphs
57
where σ is the crystal conductivity, and τsw is the switching time. Domain broadening in the KTP
isomorphs can be reduced by the use of the crystals with lower conductivity and/or poling with
short electric field pulses.
In addition, domain broadening can be compensated for by controlling the electrode duty-
cycle. By choosing an electrode duty-cycle D < 0.5, it is possible to obtain the optimum domain
duty-cycle D = 0.5. Figure 5.8 shows the former patterned (a) and non-patterned (b) faces of a 3
mm thick PPKTP sample with a period Λ = 38.86 μm. The duty-cycle of the inverted domains on
the former patterned face is D = 0.49, while the electrode duty-cycle was only D = 0.3 (shown in
the inset). This duty-cycle is well maintained over the whole crystal thickness and is equal to D =
0.48 on the non-patterned face. Domain broadening is, however, less severe in the PPRKTP due
to the lower ionic conductivity of this crystal. Fig. 5.8(c) shows the former patterned face of a 3
mm thick PPRKTP crystal where the duty-cycle of the inverted domains is D = 0.3 – the same as
that of the electrode. The duty-cycle is well maintained over the whole sample thickness, and is
equal to D = 0.32 on non-patterned face (Fig. 5.8(d)).
Fig. 5.8. Former patterned (a) and non-patterned (b) faces of a 3 mm thick PPKTP sample, and patterned (c) and non-patterned (d)
faces of a 3 mm thick PPRKTP sample with period 38.86 μm. The inset shows the electrode structure.

5.4. Sample preparation
58
5.4. Sample preparation
The sample preparation for periodic poling is illustrated in Fig. 5.9. Usually the largest d33
nonlinear coefficient is preferred when fabricating QPM devices in the KTP isomorphs. The as-
purchased KTP or RKTP wafers are usually z-cut and have typical dimensions of 35 × 30 × 1
mm3 along the x, y and z directions, respectively. Due to the variations in the conductivity, it is
reasonable to cut the wafer into smaller samples, so that each sample can be poled separately in
order to obtain a higher poling yield. Typically, the wafer is cut into smaller samples of size 10 ×
6 × 1 mm3 along the x, y and z axes respectively. To take advantage of the ferroelectric domain
anisotropy in the KTP isomorphs [5.10, 5.11], the orientation of the periodic electrode pattern is
chosen such that the grating vector is aligned along the x axis and the electrode stripes are aligned
along the y axis of the crystal.
Fig. 5.9. A schematic representation of the sample preparation steps for periodic poling.
The end faces of the samples are polished to an optical quality to let the laser beam pass along the
x axis of the crystals. For grating periods larger than 2 μm, standard contact photolithography
patterning is employed. For this purpose, a 1.8 μm thick photoresist layer is deposited on the c-
surfaces of the crystals using the spin-coating technique. The photoresist is soft-baked at a
temperature of 110 °C for 90 s to ensure proper hardening of the photoresist and then the desired
pattern is exposed using a contact mask aligner. After the exposure, the photoresist is developed
and an aluminum electrode is deposited in the openings. The photoresist structure is kept as an
insulator for the regions where domain inversion is undesired.
Due to the limitations of our contact photolithographic system, it is not possible to expose
structures smaller than 1 μm, therefore, for applications requiring sub-μm periods, a special in-
house interferometric lithography system operating at 266 nm wavelength was built. A deep UV

Chapter 5. Periodic poling of the KTP isomorphs
59
photoresist is used in this case together with a sample preparation procedure similar to the one
described above.
5.5. Electric field poling setup
After the sample preparation, the crystal is contacted to the poling circuit using liquid electrodes.
The schematic poling circuit is shown in Fig. 5.10. The pulse shape is synthesized by an arbitrary
waveform generator and is amplified with a high voltage amplifier. A serial resistance R1 = 10
kΩ, is used to monitor the current. The resistances R2 = 100 MΩ and R3 = 100 kΩ act as a
voltage divider. The electric field across the sample is determined by measuring the voltage
across the resistance R3.
Fig. 5.10. Schematic setup of the poling circuit.
If the magnitude of the applied electric field is too large, domain switching under the isolating
photoresist occurs, causing domain broadening and domain merging – so the crystal is considered
to be overpoled. Conversely, if the magnitude of the applied electric field is too low, the area
under the electrodes is not fully reversed and the crystal is underpoled. In addition, the outcome
of the periodic poling may vary depending on the individual crystal properties, and, therefore,
monitoring of the poling process is required. In very low conductive ferroelectric crystals like
LiNbO3, the charge transferred through the sample can be used to monitor the poling process.
The poling is stopped when the total charge, transferred through the crystal is Q = 2PsA, where A
is the area of the electrode. However, due to the relatively high ionic conductivity of the KTP
isomorphs it is very difficult to distinguish the switching current from the ionic counterpart,
therefore, alternative monitoring methods must be employed. In this thesis, two different
monitoring techniques have been used: is the first one is based on electro-optic effect [5.12], and
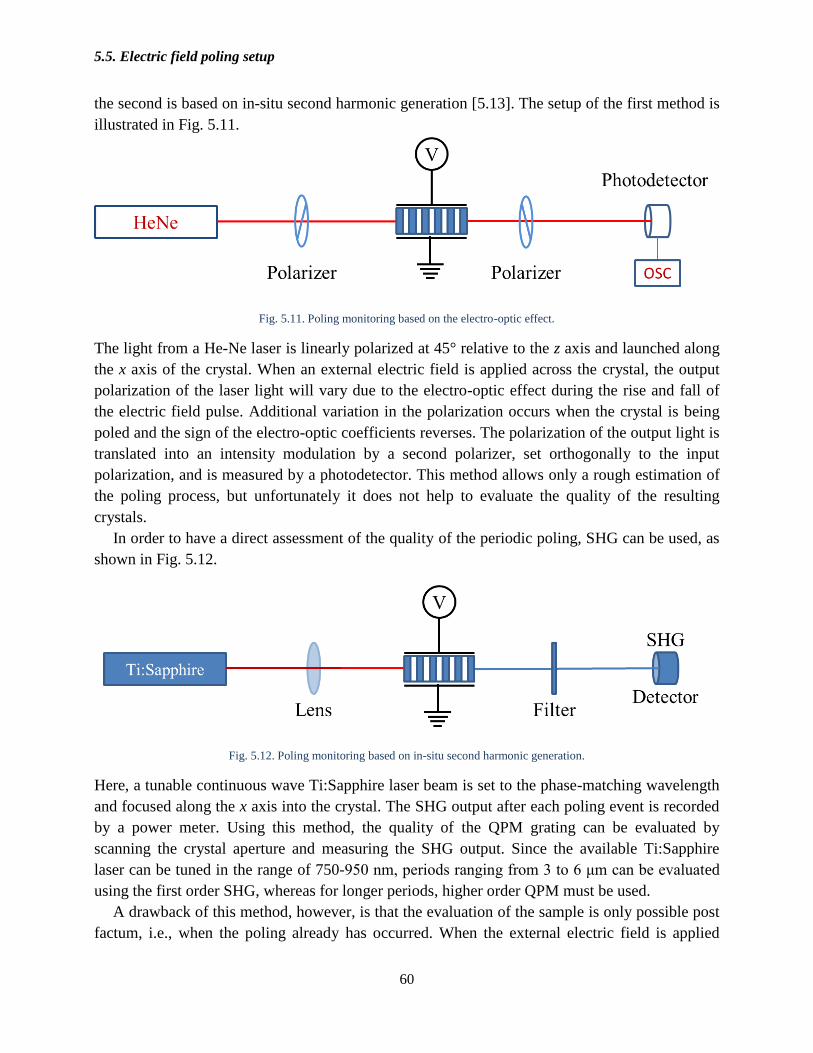
5.5. Electric field poling setup
60
the second is based on in-situ second harmonic generation [5.13]. The setup of the first method is
illustrated in Fig. 5.11.
Fig. 5.11. Poling monitoring based on the electro-optic effect.
The light from a He-Ne laser is linearly polarized at 45° relative to the z axis and launched along
the x axis of the crystal. When an external electric field is applied across the crystal, the output
polarization of the laser light will vary due to the electro-optic effect during the rise and fall of
the electric field pulse. Additional variation in the polarization occurs when the crystal is being
poled and the sign of the electro-optic coefficients reverses. The polarization of the output light is
translated into an intensity modulation by a second polarizer, set orthogonally to the input
polarization, and is measured by a photodetector. This method allows only a rough estimation of
the poling process, but unfortunately it does not help to evaluate the quality of the resulting
crystals.
In order to have a direct assessment of the quality of the periodic poling, SHG can be used, as
shown in Fig. 5.12.
Fig. 5.12. Poling monitoring based on in-situ second harmonic generation.
Here, a tunable continuous wave Ti:Sapphire laser beam is set to the phase-matching wavelength
and focused along the x axis into the crystal. The SHG output after each poling event is recorded
by a power meter. Using this method, the quality of the QPM grating can be evaluated by
scanning the crystal aperture and measuring the SHG output. Since the available Ti:Sapphire
laser can be tuned in the range of 750-950 nm, periods ranging from 3 to 6 μm can be evaluated
using the first order SHG, whereas for longer periods, higher order QPM must be used.
A drawback of this method, however, is that the evaluation of the sample is only possible post
factum, i.e., when the poling already has occurred. When the external electric field is applied

Chapter 5. Periodic poling of the KTP isomorphs
61
across the crystal, there is a change in the refractive index due to the electro-optic effect, which
shifts the phase-matching wavelength outside the narrow bandwidth of the CW Ti:Sapphire laser,
making QPM SHG detection during the periodic poling impossible. Recently, this was addressed
by instead using a mode-locked Ti:Sapphire laser, emitting femtosecond pulses with a FWHM
bandwidth of 6 nm. This enables an efficient SH generation and online detection during the
periodic poling and allows studying the dynamics of the ferroelectric domain structure formation.
5.6. Electric field pulse optimization
The high ionic conductivity presents a serious problem for periodic poling of the KTP isomorphs:
first, it leads to domain broadening, described earlier in Section 5.3, and second, it hampers the
domain growth in the polar direction. According to Eq. (5.3.1), the domain broadening problem
in high conductive ferroelectrics should be mitigated by polarization switching with short electric
field pulses, which also increases the domain propagation velocity along the polar axis, since
short pulses mean that large electric-field magnitudes must be used. However, the choice of the
optimal pulse length is not obvious. Another consideration is the choice of the electric field pulse
shape, which can have a significant impact on the QPM grating quality. An online second
harmonic generation experiment was performed in order to study the effect of the electric field
pulse length and its shape in periodic poling of the RKTP crystals. In this experiment, the crystals
were patterned with a period of 4 μm and electrode duty-cycle of 0.47. The domain dynamics was
studied by the in-situ SHG employing a mode-locked Ti:Sapphire laser as a pump source,
operating at 842 nm central wavelength and emitting 170 fs pulses at 76 MHz repetition rate with
a FWHM bandwidth of 6 nm, which enabled efficient first order QPM second harmonic
generation during the poling process. The z-polarized laser beam was collimated to a radius of 30
μm, launched along the x direction, and centered along the z direction in the crystal. The filtered
SH signal was detected with a microsecond temporal resolution detector. This method provides
integrated information of the domain formation along the beam path, therefore, the temporal
shape of the detected SH signal reflects the dynamics of the QPM structure formation in the
sampled volume. Two basic pulse-shapes were chosen: square and symmetric triangular electric-
field pulses, as shown in Fig. 5.13. The SH signal temporal evolution during the periodic poling
process, shown in Fig. 5.13, demonstrates some characteristic features, namely, the incubation
time (ti), the rise time (tr), the dwell time (td) and the fall time (tf). The incubation time can be
associated with the time needed to form the stable ferroelectric domain nuclei under the
electrodes [5.14]. The rise time reflects the formation of the QPM grating within the sampled
volume. The detection of the SHG signal begins when the reversed domains start propagating
through the beam path, and reaches a maximum when the duty-cycle of the domains is close to
0.5. A short rise time indicates a more uniform QPM structure formation, while a long one
suggests a larger temporal dispersion between the formation and the growth of the different
individual domains, resulting in a less homogeneous QPM structure. The dwell time can be
associated with the time needed to form critical nuclei under the insulating photoresist layer. The
fall time, associated with the rapid drop of the SH signal, indicates the deviations from the ideal

5.6. Electric field pulse optimization
62
duty-cycle due to the domain broadening, eventually resulting in domain coalescence,
corresponding to zero SH signal.
Fig. 5.13. The investigated pulse shapes: square electric field pulse (a), and triangular electric field pulse (b). The blue curves
represent the temporal evolution of the second harmonic signal during the poling process.
From Fig. 5.13 it is clear that the QPM grating formation in RKTP occurs on a millisecond
timescale, therefore, millisecond pulse length is a reasonable choice for periodic poling. On the
other hand, using short pulses increases the coercive field of the material, as evident from Fig.
5.4, and this may therefore be a limiting factor due to the available poling equipment. In addition,
an incorrectly chosen pulse length and magnitude may lead to excessive ion migration in the
crystal, leading to material breakdown. The experimentally determined optimum electric field
pulse length for periodic poling of the KTP isomorphs is typically 2.5-5 ms.
Figure 5.14 shows the evolution of the SH signal in the RKTP crystals poled with a 5 ms long
square pulse (a), and a 5 ms long triangular pulse (b), together with the respective ferroelectric
domain structures revealed after selective etching on the c+ faces of both crystals ((c) and (d)).
The electric field magnitude in the case of the square pulse was 3.6 kV/mm, while in the
triangular pulse case the peak field magnitude was 4.2 kV/mm. In both cases, the field
magnitudes were chosen to obtain the maximum SHG output. The rise time in the case of the
triangular pulse is 0.34 ms, while in the square pulse case it is almost an order of magnitude
longer (2.07 ms). Substantially shorter rise times suggest that poling with pulses of triangular
shape is beneficial, since it results in higher quality QPM gratings. This conclusion is supported
by the fact that the ferroelectric domain structure on the c+ face of the PPRKTP crystal, poled
with a triangular pulse (Fig. 5.14(d)), is more uniform than that obtained with the square pulse
(Fig. 5.14(c)). The superiority of the triangular pulses in periodic poling of RKTP is also
confirmed by the substantially higher normalized conversion efficiency obtained in the sample
poled with triangular electric field pulse (1.7 %/Wcm), compared to the square pulse case (0.7
%/Wcm).

Chapter 5. Periodic poling of the KTP isomorphs
63
Fig. 5.13. SH signal evolution (blue curve) under square electric field pulse (a), and triangular electric field pulse (b), when the
field magnitudes are chosen to obtain the maximum SHG output after the periodic poling. Corresponding ferroelectric domain
structures revealed by selective etching in the square pulse case (c) and the triangular pulse case (d).
The differences between periodic poling with square and triangular electric field pulses can be
explained by the different nucleation probability distributions in each case. While poling with the
square electric field pulse, a constant electric field determines a fixed domain nucleation rate,
therefore, the nucleation and propagation of the individual domains happens until the electric
field is switched off, resulting in a less uniform QPM grating, which is reflected by a longer SH
signal rise time. From Fig. 5.5, it is evident that the polarization switching occurs in a nucleation-
limited regime in the square pulse case. On the other hand, since the nucleation probability has an
exponential dependence on the electric field [5.15], poling with the triangular pulse results in
most domains nucleating near the peak of the electric field pulse, where the probability is the
highest, which is also reflected by a short SH signal rise time. A more uniform domain growth
under triangular pulses was previously confirmed in a study, using digital holography [5.16].
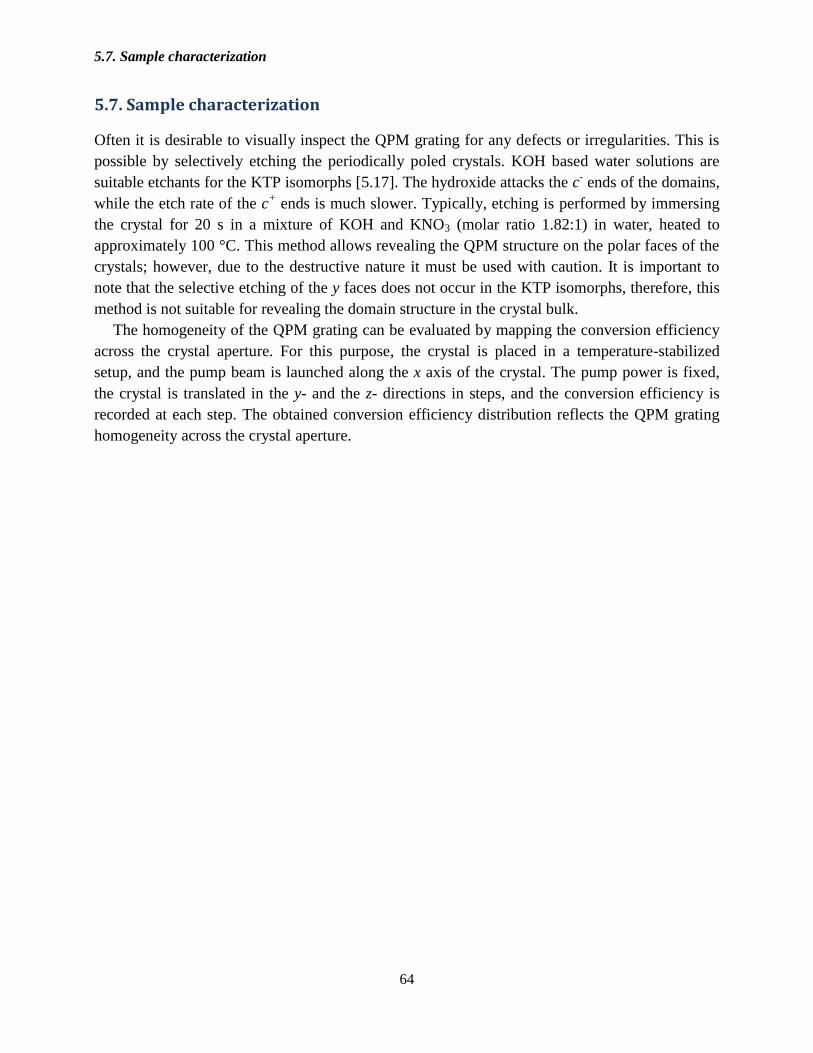
5.7. Sample characterization
64
5.7. Sample characterization
Often it is desirable to visually inspect the QPM grating for any defects or irregularities. This is
possible by selectively etching the periodically poled crystals. KOH based water solutions are
suitable etchants for the KTP isomorphs [5.17]. The hydroxide attacks the c- ends of the domains,
while the etch rate of the c+ ends is much slower. Typically, etching is performed by immersing
the crystal for 20 s in a mixture of KOH and KNO3 (molar ratio 1.82:1) in water, heated to
approximately 100 °C. This method allows revealing the QPM structure on the polar faces of the
crystals; however, due to the destructive nature it must be used with caution. It is important to
note that the selective etching of the y faces does not occur in the KTP isomorphs, therefore, this
method is not suitable for revealing the domain structure in the crystal bulk.
The homogeneity of the QPM grating can be evaluated by mapping the conversion efficiency
across the crystal aperture. For this purpose, the crystal is placed in a temperature-stabilized
setup, and the pump beam is launched along the x axis of the crystal. The pump power is fixed,
the crystal is translated in the y- and the z- directions in steps, and the conversion efficiency is
recorded at each step. The obtained conversion efficiency distribution reflects the QPM grating
homogeneity across the crystal aperture.

Chapter 5. Periodic poling of the KTP isomorphs
65
References
5.1. M. C. Gupta, W. P. Risk, A. C. G. Nutt, and S. D. Lau, ” Domain inversion in KTiOPO4 using electron beam
scanning,” Appl. Phys. Lett. 63, 1167-1169 (1993).
5.2. W. P. Risk, and S. D. Lau, “Periodic electric field poling of KTiOPO4 using chemical patterning,” Appl. Phys.
Lett. 69, 3999-4001 (1996).
5.3. H. Karlsson and F. Laurell, “Electric field poling of flux grown KTiOPO4,” Appl. Phys. Lett. 71, 3474-3476
(1997).
5.4. G. Rosenman, A. Skliar, D. Eger, M. Oron, and M. Katz, ”Low temperature periodic electrical poling of flux-
grown KTiOPO4 and isomorphic crystals,” Appl. Phys. Lett. 73, 3650-3652 (1998).
5.5. C. Canalias, J. Hirohashi, V. Pasiskevicius, and F. Laurell, “Polarization-switching characteristics of flux-grown
KTiOPO4 and RbTiOPO4 at room temperature,” J. Appl. Phys. 97, 124105 (2005).
5.6. P. A. Morris, A. Ferretti, and J. D. Bierlein, “Reduction of the ionic conductivity of flux grown KTiOPO4
crystals,” J. Cryst. Growth 109, 367-375 (1991).
5.7. H. H. Wieder, “Activation field and coercivity of ferroelectric barium titanate,” J. Appl. Phys. 28, 367-369
(1957).
5.8. R. C. Miller and A. Savage, “Velocity of Sidewise 180° Domain-Wall Motion in BaTiO3 as a Function of the
Applied Electric Field,” Phys. Rev. 112, 755-762 (1958).
5.9. G. Rosenman, Kh. Garb, A. Skliar, M. Oron, D. Eger, and M. Katz, “Domain broadening in quasi-phase-
matched nonlinear optical devices,” Appl. Phys. Lett. 73, 865-867 (1998).
5.10. G. Rosenman, A. Skliar, M. Oron, and M. Katz, ”Polarization reversal in KTiOPO4 crystals,” J. Phys. D: Appl.
Phys. 30, 277-282 (1996).
5.11. P. Urenski, M. Lesnykh, Y. Rosenwaks, and G. Rosenman, “Anisotropic domain structure of KTiOPO4
crystals,” J. Appl. Phys. 90, 1950-1954 (2001).
5.12. H. Karlsson, F. Laurell, and L. K. Cheng, “Periodic poling of RbTiOPO4 for quasi-phase matched blue light
generation,” Appl. Phys. Lett. 74, 1519 (1999).
5.13. S. Wang, V. Pasiskevicius, and F. Laurell, “High-efficiency frequency converters with periodically-poled Rb-
doped KTiOPO4,” Opt. Materials 30, 594-599 (2007).
5.14. V. Gopalan and T. E. Mitchell, “Wall velocities, switching times, and the stabilization mechanism of 180°
domains in congruent LiTaO3 crystals,” J. Appl. Phys. 83, 941-954 (1998).
5.15. R. C. Miller and A. Savage, “Velocity of Sidewise 180° Domain-Wall Motion in BaTiO3 as a Function of the
Applied Electric Field,” Phys. Rev. 112, 755-762 (1958).
5.16. C. Canalias, V. Pasiskevicius, F. Laurell, S. Grilli, P. Ferraro, and P. De Natale, “In situ visualization of
domain kinetics in flux grown KTiOPO4 by digital holography,” J. Appl. Phys. 102, 064105 (2007).
5.17. F. Laurell, M. G. Roelofs, W. Bindloss, H. Hsiung, A. Suna, and J. D. Bierlein, “Detection of ferroelectric
domain reversal in KTiOPO4 waveguides,” J. Appl. Phys. 71, 4664-4670 (1992).

66

67
Chapter 6. Periodic domain structures in KTA
6.1. KTA as a nonlinear medium
The high ionic conductivity of KTA is probably the main impediment to achieve periodic
poling in this material. Conductivity variations across the poled area may significantly influence
the quality of the QPM grating. Additionally, high ionic conductivity sets a demanding
requirement for simultaneously supplying the high voltage and the large amount of external
charge needed to compensate the ionic current. Rosenman et al., overcome the conductivity
problem by poling KTA at temperatures below 170 K, where the ionic conductivity of KTA is
suppressed [6.1]. This method, however, requires complex instrumentation, and a substantially
increased coercive field at low temperatures limits the aperture of the QPM devices. On the other
hand, the work presented in this thesis demonstrates that it is possible to periodically pole KTA
with short electric field pulses at room temperature.
6.2. Periodic poling of KTA
The KTA crystals used in this work were commercial, single-domain, z-cut, flux-grown samples,
obtained from three different vendors. Four different types of KTA crystals were distinguished by
their vendors and their conductivity: low-conductive KTA from vendor I (LC-KTA), high-
conductive KTA from vendor I (HC1-KTA), high-conductive KTA from vendor II (HC2-KTA),
and high-conductive KTA from vendor III (HC3-KTA). This designation is given in Table 6.1.
Table 6.1. KTA crystal designation by vendor and conductivity.
Crystal designation Crystal vendor Conductivity, S/m
LC-KTA Coherent Inc. 5 × 10⁻⁸
- 8.2 × 10⁻⁸
HC1-KTA Coherent Inc. 1.5 × 10⁻⁵
- 4 × 10⁻⁵
HC2-KTA Eksma Optics 8.1 × 10⁻⁵
- 1.1 × 10⁻⁴
HC3-KTA Crystech Inc. 2 × 10⁻³
- 3.4× 10⁻³
Most of the as-purchased KTA crystals were found to be multi-domain, with “natural”
domains of sizes varying from a few millimeters to tens of micrometers and extending over the
whole crystal thickness, therefore, they were first poled with planar electrodes to obtain single-
domain crystals. This “pre-poling” was performed by applying several 5 ms long 6 kV/mm
square shape electric field pulses.
For OPO applications, the HC1-KTA crystals were patterned on the c- faces with a period of
39.5 μm and a duty-cycle of 0.5. For relatively large periods, domain broadening is less severe
and such crystals can be periodically poled with short square shape electric field pulses. In this
case 5 ms long electric field pulses were used. The magnitude of the electric field was set
between 2.3 and 2.6 kV/mm depending on the specific ionic conductivity of each sample. An
example of the resulting domain structure on the patterned face (a) and the non-patterned face (b)

6.2. Periodic poling of KTA
68
of a selectively etched PPKTA sample is shown in Fig. 6.1. Note that the duty-cycle of the
inverted domains in this sample varies from 0.54 on the patterned face to 0.56 on the non-
patterned face, therefore it can be assumed that a slightly lower electric field magnitude would
have resulted in an ideal 0.5 duty-cycle all the way through the crystal.
Fig. 6.1. Periodic domain structure revealed by selective etching on the patterned face (a) and the non-patterned face (b) of a
PPKTA sample with period 39.5 μm.
For SHG at 1066 nm, the LC-KTA, HC2-KTA and HC3-KTA crystals patterned with a period
of 8.49 μm and a duty-cycle of 0.15 were used. Since domain broadening depends on the crystal
conductivity, it was expected that the electrode pattern would be best reproduced in the LC-KTA
crystals, while some broadening would occur in the HC2-KTA crystals. In the HC3-KTA
crystals, the domain broadening would be the most severe. As discussed in Chapter 5, poling with
short electric field pulses of a symmetric triangular shape should mitigate the domain-broadening
problem. Furthermore, triangular pulses offer a larger tolerance window of the electric field
magnitude, which was of utmost importance for these samples, since the crystals that were
initially multi-domain presented regions with slightly different coercive fields. The LC-KTA
samples were poled at room temperature with 2.5 ms long electric field pulses of magnitude 5.4
kV/mm, while the HC2-KTA samples were poled applying 5 ms long pulses of magnitude 4.6
kV/mm. The total charge transferred through the crystal, including the contributions of the ionic
and the switching current, was 3.3 × 10⁻⁵
C in the periodically poled HC2-KTA (HC-PPKTA)
case, and 7.6 × 10⁻⁶
C in the periodically poled LC-KTA (LC-PPKTA) case. Since the
spontaneous polarization was assumed to be the same in both materials, the actual current
required for domain switching was about an order of magnitude larger in HC2-KTA. The current
requirement for switching the HC3-KTA crystals was even larger. Unfortunately, the available
equipment failed to meet this requirement, therefore, these high-conductive crystals could not be
switched. Figure 6.2 shows the domain structure on the polar faces of the HC-PPKTA (a) and the
LC-PPKTA (b) crystals. The duty-cycle of the inverted domains is around 0.45 on the patterned
face, and 0.51 on the non-patterned face. As expected, the domain broadening was reduced in the
LC-PPKTA crystals, leading to a duty-cycle of the reversed domains of 0.27 on the patterned
face, and approximately 0.36 on the opposite face, as shown in Fig. 6.2(b).

Chapter 6. Periodic domain structures in KTA
69
Fig. 6.2. Periodic domain structure on the patterned face of the HC-PPKTA (a) and the LC-PPKTA (b) crystals. The insets show
the periodic structure on the non-patterned faces of the HC-PPKTA and the LC-PPKTA crystals, respectively.
6.3. PPKTA-based OPO
The PPKTA crystal shown in Fig. 6.1 was used to demonstrate a QPM OPO. For this purpose,
the uncoated crystal was placed in a linear OPO cavity, pumped by 1064 nm light, generating a
1.538 μm signal and a 3.452 μm idler output. The effective nonlinear coefficient of the PPKTA
crystal was evaluated by measuring the threshold energy for different cavity lengths while using a
90% reflectivity output coupler. Figure 6.3 shows the measured threshold energies for cavity
lengths of 30–50 mm together with the calculated thresholds for different values of deff.
Fig. 6.3. PPKTA OPO threshold energy versus the OPO cavity length. Squares represent the
experimental data. The dotted, solid and dashed lines are calculated OPO threshold energies,
corresponding to effective nonlinearities of 9 pm/V, 10.1 pm/V and 11 pm/V, respectively.

6.4. PPKTA for second harmonic generation
70
As can be seen, an effective nonlinear coefficient value deff = 10.1 pm/V is in good agreement
with the experimental results. This value is very close to the expected value of 10.3 pm/V
obtained by deff = 2d33/π, where d33 = 16.2 pm/V [6.2] for a perfect QPM grating with a duty-
cycle of 0.5.
To obtain a highly efficient OPO, a partially reflective output coupler with R = 50% at the
signal wavelength, and a cavity length of 30 mm were used. Figure 6.4 shows the pump
depletion, the signal efficiency, and the combined signal and idler efficiency for different pump
energies.
Fig. 6.4. PPKTA OPO pump depletion and the efficiencies as a function of pump energy.
Two dielectric mirrors, transmitting at 1064 nm and reflecting at 1.5 μm, were used to separate
the signal and the pump light. The signal wavelength was 1538.2 nm with a FWHM bandwidth of
2.5 nm while the maximum signal output was 0.6 mJ (130 MW/cm2) for a pump energy of 2 mJ
(440 MW/cm2). The depletion and the combined signal and idler efficiency reached 45% for 2 mJ
of pump energy and were approximately the same over the whole pump energy range. This
supports the expected low absorption of the PPKTA at the signal wavelength.
6.4. PPKTA for second harmonic generation
The uncoated HC-PPKTA and LC-PPKTA crystals were evaluated in a SHG setup pumped by a
tunable CW Ti:Sapphire laser. The pump beam was launched along the crystal x-axis and focused
into the crystal to a beam waist of 25 μm, while the crystal temperature was kept at 21 °C. Figure
6.5 shows the conversion efficiencies for these crystals as a function of pump power at a
wavelength of 1066 nm.

Chapter 6. Periodic domain structures in KTA
71
Fig. 6.5. Second harmonic power (open symbols) and conversion efficiency (solid symbols) of
HC-PPKTA (squares) and LC-PPKTA (circles) as a function of pump power. The solid curves
represent the quadratic fits in the SH power case, and linear fits in the efficiency case.
At a fundamental pump power of 347 mW, the HC-PPKTA crystal generated 1.15 mW of green
light. This crystal showed a normalized conversion efficiency of 1.2 %/Wcm, and its effective
nonlinear coefficient was deff = 10.5 pm/V, which is close to the calculated value of 10.3 pm/V,
obtained from d33 = 16.2 pm/V [6.2]. Slightly lower values were obtained for the LC-PPKTA
crystal (normalized conversion efficiency of 1.03%/Wcm, deff = 9.7 pm/V) due to the deviation
from the ideal duty-cycle of 0.5. The estimated normalized conversion efficiency and the
effective nonlinearity value for the ideal duty-cycle in this crystal are ηnorm = 1.26%/Wcm and deff
= 10.7 pm/V, respectively.
The normalized conversion efficiency distributions across the crystal aperture for the HC-
PPKTA and the LC-PPKTA are shown in Fig. 6.6.
Fig. 6.6. Normalized conversion efficiency distribution across the crystal aperture in (a) the HC-PPKTA, and (b) the LC-PPKTA
crystals.
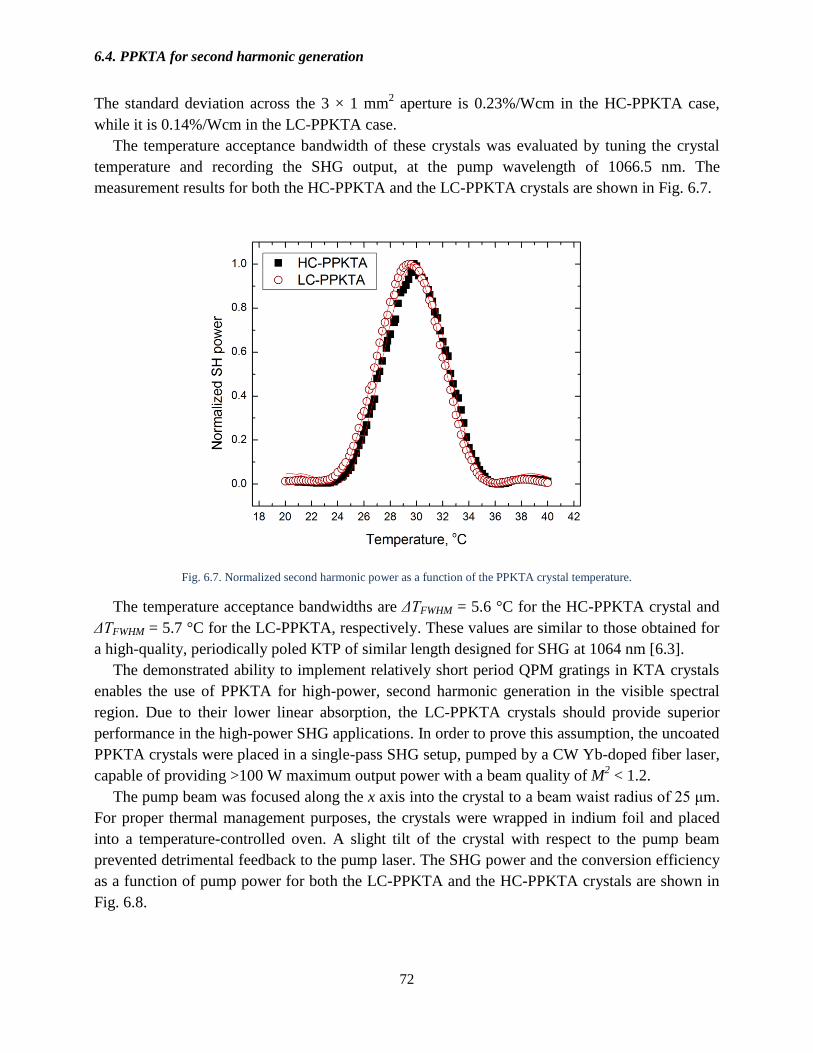
6.4. PPKTA for second harmonic generation
72
The standard deviation across the 3 × 1 mm2 aperture is 0.23%/Wcm in the HC-PPKTA case,
while it is 0.14%/Wcm in the LC-PPKTA case.
The temperature acceptance bandwidth of these crystals was evaluated by tuning the crystal
temperature and recording the SHG output, at the pump wavelength of 1066.5 nm. The
measurement results for both the HC-PPKTA and the LC-PPKTA crystals are shown in Fig. 6.7.
Fig. 6.7. Normalized second harmonic power as a function of the PPKTA crystal temperature.
The temperature acceptance bandwidths are ΔTFWHM = 5.6 °C for the HC-PPKTA crystal and
ΔTFWHM = 5.7 °C for the LC-PPKTA, respectively. These values are similar to those obtained for
a high-quality, periodically poled KTP of similar length designed for SHG at 1064 nm [6.3].
The demonstrated ability to implement relatively short period QPM gratings in KTA crystals
enables the use of PPKTA for high-power, second harmonic generation in the visible spectral
region. Due to their lower linear absorption, the LC-PPKTA crystals should provide superior
performance in the high-power SHG applications. In order to prove this assumption, the uncoated
PPKTA crystals were placed in a single-pass SHG setup, pumped by a CW Yb-doped fiber laser,
capable of providing >100 W maximum output power with a beam quality of M2 < 1.2.
The pump beam was focused along the x axis into the crystal to a beam waist radius of 25 μm.
For proper thermal management purposes, the crystals were wrapped in indium foil and placed
into a temperature-controlled oven. A slight tilt of the crystal with respect to the pump beam
prevented detrimental feedback to the pump laser. The SHG power and the conversion efficiency
as a function of pump power for both the LC-PPKTA and the HC-PPKTA crystals are shown in
Fig. 6.8.

Chapter 6. Periodic domain structures in KTA
73
Fig. 6.8. Second harmonic power (a), and conversion efficiency (b) as a function of pump power in the LC-PPKTA and the
HC-PPKTA crystals. Solid curves represent the numerical fits.
The theoretical fits are provided by a model based on a numerical solution of the coupled
wave equations and spatially resolved heat propagation. This model takes into account the
focusing conditions, pump depletion and the linear absorption. However the thermal dephasing
effects are not accounted for in this model. From Fig. 6.8 it is clear that, due to the higher linear
absorption at 533 nm, thermal dephasing becomes pronounced in the HC-PPKTA crystal at a
considerably lower power level, compared to the LC-PPKTA sample. Consequently, the LC-
PPKTA generated a maximum power of 13.6 W with a 25% conversion efficiency, while in the
HC-PPKTA crystal, the maximum SH power was only 5.3 W with a 17% conversion efficiency.
Further improvements in the thermal management, e.g., a reduction of the aperture of the PPKTA
crystals, should allow further upscaling of the SH power.
6.5. Temperature tuning characteristics
From the OPO and the SHG experiments it became clear that the existing Sellmeier data are not
suitable for our KTA crystals. To illustrate this, the tuning of the OPO output wavelength was
carried out by varying the OPO PPKTA crystal temperature between 15 and 65 °C. Figure 6.9
shows the measured signal and the calculated idler wavelengths as a function of the crystal
temperature. The theoretical tuning curves are based on the Sellmeier equations derived by
Fradkin-Kashi et al. [6.4], together with the temperature correction proposed by Emanuelli and
Arie [6.5]. From Fig. 6.9, it is clear that there is a discrepancy between the calculated and the
experimental tuning curves, which might be caused by the differences in the material, for
instance, the concentration of the impurities added during the crystal growth to promote the
single-domain crystal formation [6.2].

6.5. Temperature tuning characteristics
74
Fig. 6.9. The dependence of the OPO output wavelength on the PPKTA crystal temperature.
Squares represent the experimental data, solid lines – the theoretical dependence.
In the SHG case, the dependence of the phase-matched pump wavelength on the crystal
temperature was evaluated for both the HC-PPKTA and the LC-PPKTA crystals. In this
measurement, the pump beam was kept parallel to the grating vector and the crystal temperature
was varied in steps of 2 °C between 20 and 40 °C, while the pump was tuned to give the highest
SH output at each step. Figure 6.10 shows the phase-matched pump wavelength as a function of
the crystal temperature for these crystals.
Fig. 6.10. Temperature tuning of the phase-matched pump wavelength in the LC-PPKTA and the
HC-PPKTA crystals. Squares and circles represent the experimental data, solid lines – the
theoretical dependence.
Chapter 6. Periodic domain structures in KTA
75
The dashed curve represents the theoretical prediction based on the Sellmeier equations derived
by Fradkin-Kashi et al. [6.4], together with the temperature correction, optimized for these
equations, proposed by Emanuelli and Arie [6.5]. The large discrepancy between the measured
and the calculated values in this case may be due to the fact that these Sellmeier equations were
optimized for mid-infrared spectral range and are more suitable for 1 μm pumped OPO
applications. The solid curve is calculated using the temperature-corrected Sellmeier equations
derived by Kato and Umemura [6.6]. As in the OPO case, here the difference between the
experimental and the calculated values can be explained by the small differences in the raw KTA
material, which had already been pointed out as a source for the relatively large refractive index
differences [6.2, 6.7].
From these measurements it is clear that further studies of the impact of the crystal
composition on the refractive index of KTA and the temperature dependence of the refractive
index are needed both in the visible and the infrared spectral regions.

76
References 6.1. G. Rosenman, A. Skliar, Y. Findling, P. Urenski, A. Englander, P. A. Thomas, and Z. W. Hu, ”Periodically
poled KTiOAsO4 crystals for optical parametric oscillation,” J. Phys. D 32, L49-L52 (1999).
6.2. L. K. Cheng, L. T. Cheng, J. D. Bierlein, F. C. Zumsteg, and A. A. Ballman, “Properties of doped and undoped
crystals of single domain KTiOAsO4,” Appl. Phys. Lett. 62, 346 (1993).
6.3. V. Pasiskevicius, S. Wang, J. A. Tellefsen, F. Laurell, and H. Karlsson, “Efficient Nd:YAG Laser Frequency
Doubling with Periodically Poled KTP,” Appl. Opt. 37, 7116-7119 (1998).
6.4. K. Fradkin-Kashi, A. Arie, P. Urenski, and G. Rosenman, ” Mid-infrared difference–frequency generation in
periodically poled KTiOAsO4 and application to gas sensing,” Opt. Lett. 25, 743-745 (2000).
6.5. S. Emanueli and A. Arie, “Temperature-Dependent Dispersion Equations for KTiOPO4 and KTiOAsO4,” Appl.
Opt. 42, 6661-6665 (2003).
6.6. K. Kato, and N. Umemura, “Sellmeier and thermo-optic dispersion formulas for KTiOAsO4,” in Conference on
Lasers and Electro-Optics, CLEO 2004, Technical Digest (CD), (Optical Society of America, 2004), paper CThT35.
http://www.opticsinfobase.org/abstract.cfm?URI=CLEO-2004-CThT35
6.7. K. Kato, “Second-harmonic and sum-frequency generation in KTiOAsO4,” IEEE J. Quant. Electron. 30, 881-883
(1994).

77
Chapter 7. Large aperture QPM devices
7.1. Large aperture nonlinear crystals
Implementation of large aperture QPM devices is challenging due to the increasingly high
voltages required for polarization-switching together with the difficulty of propagating the
domain grating through the whole crystal thickness. Periodically poled, Mg-doped congruent
LiNbO3 with thicknesses up to 10 mm and Mg-doped congruent LiTaO3 with thicknesses of 5
mm have been recently reported [7.1, 7.2]. In these materials, periodic poling was performed at
elevated temperatures in order to take advantage of the decreased coercive field. However, the
domain structures obtained are still limited in homogeneity due to duty-cycle variations, domain
broadening, and domain merging throughout the crystal thickness.
Periodically poled structures in KTP and RTA crystals with a thickness of up to 3 mm have
been reported previously [7.3, 7.4]. However in flux-grown KTP, the high ionic conductivity, the
inhomogeneous stoichiometry over a single wafer and a poor wafer-to-wafer consistency limits
the yield of well-poled samples. RTA has a substantially lower ionic conductivity compared to
flux-grown KTP; however, its availability is very limited and, therefore, was not considered as a
candidate for large aperture QPM device fabrication.
Improved material properties and the ability to handle higher optical powers make RKTP the
best choice for periodic poling of large aperture QPM crystals to date.
7.2. Periodic poling of 5 mm thick RKTP crystals
Large aperture QPM devices were implemented in 5 mm thick RKTP crystals. A period of 38.86
μm with a duty-cycle of 0.5 was chosen for a 1064 nm pumped degenerate OPO, generating 2128
nm wavelength at room temperature. Since the currently available poling equipment is capable of
providing a maximum voltage of 20 kV, it was not possible to use triangular pulses with these
crystals, therefore, they were periodically poled at room temperature by applying 5 ms long
square electric field pulses of magnitude 3.2 kV/mm. Since the poling was performed in the low
field regime, two consecutive electric field pulses were needed in order to get complete domain
reversal under the periodic electrodes. Figure 7.1 shows the ferroelectric domain structure on the
patterned face (a) and the non-patterned face (b) of the 5 mm thick RKTP crystal after the first
electric field pulse. Because of the high fringing fields at the electrode edges, only the domain
tips nucleated at these edges and propagated through the whole 5 mm thickness after the first
pulse. Additionally, some domains had already nucleated under the electrodes, although they had
not propagated. The domain structure on the patterned face (c) and the non-patterned face (d) of 5
mm thick PPRKTP crystal after the second electric field pulse is also shown in Fig. 7.1.

7.2. Periodic poling of 5 mm thick RKTP crystals
78
Fig. 7.1. Ferroelectric domain structure on the patterned (a) and the non-patterned (b) faces of 5 mm thick PPRKTP crystal after
poling with a single electric field pulse, and the patterned (c), and the non-patterned (d) faces of 5 mm thick PPRKTP crystal after
the second electric field pulse. The top parts represent the original metal-photoresist pattern with a duty-cycle of 0.5.
As can be seen, the duty-cycle is close to 0.5 on the patterned face and is approximately 0.57
on the opposite face of the crystal. Taking into account the crystal thickness of 5 mm, the domain
broadening is very small. The homogeneity of the sample is well illustrated in Fig. 7.2, which
shows the OPO output energy distribution across the crystal aperture of 8 × 4 × 5 mm3 along the
x, y and z directions, respectively. From this measurement it is clear that the QPM grating is
uniform and homogeneous in the bulk of the 5 mm thick PPRKTP crystal.
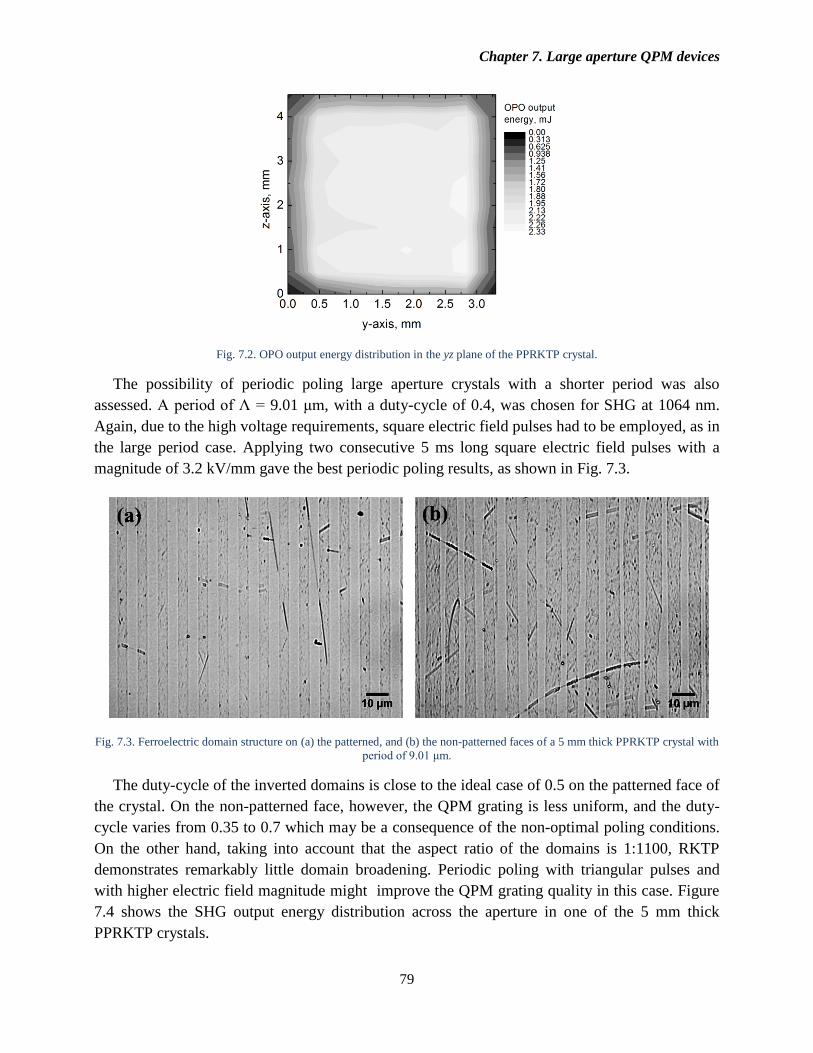
Chapter 7. Large aperture QPM devices
79
Fig. 7.2. OPO output energy distribution in the yz plane of the PPRKTP crystal.
The possibility of periodic poling large aperture crystals with a shorter period was also
assessed. A period of Λ = 9.01 μm, with a duty-cycle of 0.4, was chosen for SHG at 1064 nm.
Again, due to the high voltage requirements, square electric field pulses had to be employed, as in
the large period case. Applying two consecutive 5 ms long square electric field pulses with a
magnitude of 3.2 kV/mm gave the best periodic poling results, as shown in Fig. 7.3.
Fig. 7.3. Ferroelectric domain structure on (a) the patterned, and (b) the non-patterned faces of a 5 mm thick PPRKTP crystal with
period of 9.01 μm.
The duty-cycle of the inverted domains is close to the ideal case of 0.5 on the patterned face of
the crystal. On the non-patterned face, however, the QPM grating is less uniform, and the duty-
cycle varies from 0.35 to 0.7 which may be a consequence of the non-optimal poling conditions.
On the other hand, taking into account that the aspect ratio of the domains is 1:1100, RKTP
demonstrates remarkably little domain broadening. Periodic poling with triangular pulses and
with higher electric field magnitude might improve the QPM grating quality in this case. Figure
7.4 shows the SHG output energy distribution across the aperture in one of the 5 mm thick
PPRKTP crystals.

7.3. Large aperture PPRKTP OPO performance
80
Fig. 7.4. SHG output energy distribution in yz plane of the PPRKTP crystal.
As can be seen from Fig. 7.4, the QPM grating is less homogeneous in this crystal compared to
larger period case.
7.3. Large aperture PPRKTP OPO performance
A large-aperture OPO PPRKTP crystal was pumped by a seeded, diode-pumped, single-
longitudinal mode Nd:YAG laser and amplifier system providing 12 ns long pulses at 1064 nm
wavelength and at a 100 Hz repetition rate with a maximum output energy of 130 mJ. The
reflectivity of the OPO output coupler was 30% at 2.1 μm. The OPO cavity length was set to 20
mm, while the temperature was stabilized just above room temperature. The z-polarized pump
was expanded and collimated into a beam with a ~2 mm radius and then launched along the x-
axis into the crystal. Figure 7.5 shows the pump depletion and the combined signal and idler
efficiency as a function of the pump energy.
Fig. 7.5. The OPO output energy, conversion efficiency, and the pump depletion for different pump energies inside the crystal.

Chapter 7. Large aperture QPM devices
81
The temperature tuning properties of the OPO were studied by varying the crystal temperature
between 10 and 70 °C. Figure 7.6(a) shows the experimental data together with the theoretical
tuning curves based on the Sellmeier equations for KTP derived by Fradkin et al. [7.5], including
the temperature correction proposed by Emanueli and Arie [7.6], and the temperature-corrected
Sellmeier equations by Kato and Takaoka [7.7].
Fig. 7.6. Temperature tuning of the signal and the idler waves (a), and the OPO output spectrum at degeneracy with the crystal
temperature set to 50 °C (b).
The discrepancy between the measured and the theoretical temperature tuning curves may be
explained by the fact that neither of the Sellmeier equations were derived at this wavelength span.
In order to investigate the spectral properties of the OPO at degeneracy, the crystal
temperature was set to 50 °C and the OPO output spectrum was recorded, as shown in Fig.
7.6(b). The measurement was performed using a spectrometer with a PbSe detector. The output is
centered at a wavelength of ~2.1 µm with a FWHM of 80 nm. Two side peaks, with a separation
in frequency of ~16 THz from each other can also be seen in the recorded spectrum. The
frequency of 8 THz corresponds to the lowest-frequency infrared-active TO phonon mode in
KTP [7.8]. Therefore, these peaks can be attributed to a four-wave mixing process, assisted by
intra-cavity stimulated Raman scattering [7.9], and followed by the amplification of the
sidebands by the second order parametric process. Narrowing down the intra-cavity gain by using
a volume Bragg grating should effectively remove the gain from this process.

82
References 7.1. H. Ishizuki and T. Taira, “Fabrication of 10-mm-thick periodically poled Mg-doped congruent LiNbO3 device
for high-energy wavelength conversion,” in Conference on Lasers and Electro-Optics, CLEO 2012, Technical Digest
(CD), (Optical Society of America, 2012), paper CTh1B.1.
7.2. H. Ishizuki and T. Taira, “High-energy quasi-phase-matched optical parametric oscillation using Mg-doped
congruent LiTaO3 crystal,” Opt. Express 18, 253-258 (2010).
7.3. H. Karlsson, M. Olsson, G. Arvidsson, F. Laurell, U. Bäder, A. Borsutzky, R. Wallenstein, S. Wickström, and
M. Gustafsson, “Nanosecond optical parametric oscillator based on large-aperture periodically poled RbTiOAsO4,”
Opt. Lett. 24, 330-332 (1999).
7.4. M. Peltz, U. Bäder, A. Borsutzky, R. Wallenstein, J. Hellström, H. Karlsson, V. Pasiskevicius, and F. Laurell,
“Optical parametric oscillators for high pulse energy and high average power operation based on large aperture
periodically poled KTP and RTA,” Appl. Phys. B 73, 663-670 (2001).
7.5. K. Fradkin, A. Arie, A. Skliar, G. Rosenman, “Tunable midinfrared source by difference frequency generation in
bulk periodically poled KTiOPO4,” Appl. Phys. Lett., 74, 914-916 (1999).
7.6. S. Emanueli, A. Arie, “Temperature-dependent dispersion equations for KTiOPO4 and KTiOAsO4,” Appl. Opt.
42, 6661-6665 (2003).
7.7. K. Kato, E. Takaoka, “Sellmeier and thermo-optic dispersion formulas for KTP,” Appl. Opt. 41, 5040-5044
(2002).
7.8. V. Pasiskevicius, C. Canalias, and F. Laurell, “Highly efficient stimulated Raman scattering of picosecond
pulses in KTiOPO4,” Appl. Phys. Lett. 88, 041110 (2006).
7.9. V. Pasiskevicius, A. Fragemann, F. Laurell, R. Butkus, V. Smilgevicius, and A. Piskarskas, “Enhanced
stimulated Raman scattering in optical parametric oscillators from periodically poled KTP,” Appl. Phys. Lett. 82,
325-327 (2003).

83
Chapter 8. Short-period QPM devices for blue light generation
8.1. Need of short-period QPM structures
Many important applications, such as high density optical information storage [8.1],
biomedical research [8.2], laser cooling of atoms [8.3] and spectroscopy [8.4] demand coherent
radiation sources operating in the blue spectral region. Most commonly, blue light is generated by
LBO [8.5, 8.6] or BBO [8.7, 8.8] crystals in birefringent phase matching configurations.
Unfortunately, there is no simple way to implement QPM in these materials. In addition, these
materials exhibit relatively low effective nonlinearities and their hygroscopic properties add
additional complications [8.9].
KTP is a widely used QPM nonlinear material which is also free of photorefractive damage
issues. The use of the KTP isomorphs in the blue spectral region, together with the possibility of
implementing QPM, may bring additional advantages, such as the ability to employ the highest
nonlinearity available in this material and the use of noncritical phase matching. QPM structures
with periods of the order of a few micrometers are needed for second harmonic generation in the
blue spectral region. RKTP is an ideal candidate for the fabrication of such short-period QPM
devices. Additionally, this material has a lower susceptibility to gray-tracking as compared to
regular flux-grown KTP, which is beneficial for applications in the visible region (see Section
4.5). For low-intensity fundamental beams (below ~300 MW/cm2), the shortest wavelength
where the KTP isomorphs could be used, is given by the material bandgap of about 3.5 eV (355
nm). For ultrashort pulses, with higher peak intensities, where the nonlinear absorption becomes
important, the short wavelength range is further restricted, therefore, the effects of multi-photon
absorption and the increased thermal loading in PPKTP and in PPRKTP on the SHG efficiency at
wavelengths below 400 nm, need to be evaluated.
8.2. Periodic poling of short-period QPM structures
For SHG at 796 nm, the RKTP crystals were patterned with a period of 3.18 μm and with an
electrode duty-cycle of 0.2. For comparison purposes, KTP crystals were also patterned with the
same period and with an electrode duty-cycle of 0.1. Both RKTP and KTP crystals were
periodically poled with 5 ms long triangular pulses with the magnitudes of 7.7 and 6.0 kV/mm,
respectively. Figure 8.1 shows the resulting domain structure revealed on the polar faces after
selective chemical etching on (a) the patterned face and (b) the non-patterned face of the
PPRKTP crystal, and (c) the patterned face and (d) the non-patterned face of the PPKTP crystal.
The inverted ferroelectric-domain duty-cycle close to 0.47 was obtained on both polar faces of
the PPRKTP crystal, and is a result of the periodic poling in the high field regime. In the PPKTP
case, substantial domain broadening can be observed, resulting in a duty-cycle close to 0.62 on
the patterned face; however, the domain structure did not propagate homogeneously through the
crystal bulk.

8.3. Frequency conversion in the blue region
84
Fig. 8.1. Ferroelectric domain structure on patterned (a) and non-patterned (b) faces of PPRKTP, and patterned (c) and non-
patterned (d) faces of PPKTP crystal. The period is Λ = 3.18 μm.
8.3. Frequency conversion in the blue region
The uncoated PPKTP and PPRKTP crystals shown in Fig. 8.1 were evaluated in a CW SHG
setup. The PPRKTP crystal showed a normalized conversion efficiency of 1.79 %/Wcm and an
effective nonlinear coefficient deff = 8.3 pm/V, which is somewhat lower than the calculated value
deff = 2d33/π = 10 pm/V [8.10]. Indeed, this should be expected since the duty-cycle of the domain
structure deviates from the perfect one. The highest normalized conversion efficiency achieved in
PPKTP crystals was 1.1 %/Wcm when the fundamental beam was propagating close to the
patterned crystal face. The effective nonlinear coefficient in this case was deff = 6.45 pm/V.
In order to evaluate the performance of the PPKTP and the PPRKTP crystals at higher
intensities a femtosecond Ti:Sapphire laser operating at a 76 MHz repetition rate was used. In
order to compare the relatively long (6.5 mm) crystals, the fundamental beam was focused to a
waist radius of 50 µm along the x-axis in the crystal and the pulse length was adjusted to 138 fs.
The calculated wavelength acceptance bandwidth of the 6.5 mm long PPKTP crystals was 0.17
nm. The temperature of each crystal was stabilized to 25 °C. The generated second harmonic
average power and the efficiency, both in the PPKTP and the PPRKTP, are shown in Fig. 8.2(a).

Chapter 8. Short-period QPM devices for blue light generation
85
Fig. 8.2. (a), SH average power (open symbols) and SHG efficiency (solid symbols) in the 6.5 mm-long PPKTP (circles) and the
PPRKTP (squares) for 138 fs long fundamental pulses at 796 nm. (b), long-term variation of the SHG efficiency at 0.4 GW/cm2.
Due to the higher quality of the PPRKTP structures, the efficiency in this QPM device is
substantially higher than that in the PPKTP. Strong gray-tracking in the PPKTP at a fundamental
peak intensity of 0.5 GW/cm2 could be observed. This process requires the presence of both the
intense near-infrared and the generated SH blue light. While increasing the fundamental average
power further, the nonlinear absorption-induced gray-tracking leads to thermal dephasing and to
an eventual breakdown of the crystal. Under the same pumping conditions, the PPRKTP did not
show any signs of gray-tracking even at the peak intensity of 0.77 GW/cm2. The time-
dependence of the conversion efficiencies over two hours of continuous operation in both
materials is shown in fig. 8.2(b). The peak intensity here was 0.4 GW/cm2. This clearly indicates
the long-term color-center formation effect in the PPKTP crystal, which was not observed in the
case of PPRKTP.
When the group velocity mismatch is large, higher conversion efficiency for femtosecond
pulses can normally be achieved by employing short nonlinear crystals and tight focusing.
Therefore, the length of the PPRKTP crystals was reduced to 1 mm. The wavelength acceptance
bandwidth of the 1 mm long PPRKTP crystals was estimated to be 1.1 nm. The fundamental
pulse length in this case was 85 fs. The focusing conditions remained the same as with the 138 fs
pulses. Figure 8.3 shows the SH average power and the conversion efficiency as a function of the
average pump power in this PPRKTP crystal. From Fig. 8.3 it is evident that the SHG efficiency
in the shorter PPRKTP crystals is actually lower than in the longer ones, and the efficiency is
decreasing at the fundamental peak intensities above 1 GW/cm2. Again, no visible gray-tracking
could be seen in the PPRKTP crystals even after operation at peak intensities of 1.5 GW/cm2.
The saturation of the SHG efficiency and the lower saturated efficiency in shorter crystals
cannot be explained only by thermal effects, which should be much more pronounced in longer
crystals. The group velocity dispersion is also reduced in shorter crystals.

8.3. Frequency conversion in the blue region
86
Fig. 8.3. Second harmonic average power (solid squares) and the conversion efficiency (open
circles) in a 1 mm long PPRKTP crystal. Pump: 85 fs pulses at 76 MHz repetition rate, 796 nm
wavelength.
The strongest process limiting the efficiency of the frequency doubling of 796 nm high-peak
power pulses is two photon absorption (TPA). It should be noted that the energy of the
fundamental frequency photon is smaller than one half of the bandgap of RKTP, therefore the
most probable is the simultaneous absorption of the fundamental and the second harmonic
photons. The effect of the TPA is clearly seen in an open aperture z-scan measurement, as shown
in Fig. 8.4.
Fig. 8.4. Normalized total transmission (solid squares) and the ratio of the second harmonic and
the fundamental powers after the crystal (open squares) as a function of crystal position with
respect to the beam waist. The maximum intensity at the beam waist is 5.8 GW/cm2. The PPRKTP
crystal length is 1 mm, pulse length is 85 fs.
0 200 400 600 800
0
20
40
60
80
100
120
140
SH
avera
ge p
ow
er,
mW
Fundamental average power, mW
0.0 0.5 1.0 1.5
0.05
0.10
0.15
0.20
Eff
icie
ncy
Peak intensity, GW/cm2
-4 -2 0 2 40.0
0.2
0.4
0.6
0.8
1.0
z, mm
No
rma
lize
d t
ota
l tr
an
sm
issio
n
0.0
0.2
0.4
0.6
PS
H/P
F

Chapter 8. Short-period QPM devices for blue light generation
87
In this measurement, the beam waist radius was 13 µm and the crystal temperature was stabilized
to 25 °C, corresponding to the most efficient SHG in the CW experiments. The total combined
fundamental and second harmonic power transmission decreases by 53% when the crystal is at
the beam waist position. At this position, about 50% of the total transmitted power is actually in
the second harmonic. Moreover, such a reduction of the transmitted power was not observed in
the single-domain RKTP crystals.
It is clear that the two-photon absorption involving both the fundamental and the second
harmonic photons is the main source of the losses which, in turn, limits the obtainable SHG
efficiency in this extreme SHG regime. As a result, the SHG efficiency at 796 nm, as normalized
to the incident fundamental power, does not exceed 20% even for the short PPRKTP crystals and
for tight focusing, in strong contrast to the femtosecond SHG at 1 µm or the CW SHG at 846 nm,
where the multi-photon absorption process is absent or significantly reduced [8.11, 8.12]. The
above experiments could not be performed with the PPKTP due to crystal damage associated
with an increased absorption by induced color-centers.

88
References 8.1. T. Tanaka, K. Takahashi, K. Sako, R. Kasegawa, M. Toishi, K. Watanabe, D. Samuels, and M. Takeya,
“Littrow-type external-cavity blue laser for holographic data storage,” Appl. Opt. 46, 3583-3592 (2007).
8.2. T. Wunderer, J. E. Northrup, Z. Yang, M. Teepe, N. M. Johnson, P. Rotella, and M. Wraback, “Nitride
VECSELs as Light Sources for Biomedical Applications,” Conference on Lasers and Electro-Optics (CLEO 2013),
San Jose, USA, June 9-14 (2013), JM3O.1.
8.3. S. Kobtsev, B. Lev, J. Fortagh, and V. Baraulya, ”Powerful narrow-line source of blue light for laser cooling
Yb/Er and Dysprosium atoms,” Proc. SPIE 7578, 75782F (2010).
8.4. O. M. Marago, B. Fazio, P. G. Gucciardi, and E. Arimondo, “Atomic gallium laser spectroscopy with violet/blue
diode lasers,” Appl. Phys. B 77, 809-815 (2003).
8.5. Y. Asakawa, H. Kumagai, K. Midorikawa, M. Obara, ”50% frequency doubling efficiency of 1.2-W cw
Ti:sapphire laser at 746 nm,” Optics Commun. 217, 311-315 (2003).
8.6. J. Zhang, J. Y. Huang, H. Wang, K. S. Wong, and G. K. Wong, “Second-harmonic generation from
regeneratively amplified femtosecond laser pulses in BBO and LBO crystals,” J. Opt. Soc. Am. B 15, 200-209
(1998).
8.7. T. Kanai, X. Zhou, T. Sekikawa, S. Watanabe, and T. Togashi, “Generation of subterawatt sub-10-fs blue pulses
at 1–5kHz by broadband frequency doubling,” Opt. Lett. 28, 1484-1486 (2003).
8.8. W.-L. Zhou, Y. Mori, T. Sasaki, and S. Nakai, “High-efficiency intracavity continuous-wave ultraviolet
generation using crystals CsLiB6O10, β-BaB2O4 and LiB3O5,” Opt. Commun. 123, 583-586 (1996).
8.9. Z. Lin, L. F. Xu, R. K. Li, Z. Wang, C. Chen, M.-H. Lee, E. G. Wang, and D.-S. Wang, “Ab initio study of the
hygroscopic properties of borate crystals,” Phys. Rev. B 70, 233104 (2004).
8.10. M. V. Pack, D. J. Armstrong, and A. V. Smith, “Measurement of tensors of KTiOPO4, KTiOAsO4, RbTiOPO4
RbTiOAsO4,” Appl. Opt. 43, 3319-3323 (2004).
8.11. A. A. Lagatsky, C. T. A. Brown, W. Sibbett, S. J. Holmgren, C. Canalias, V. Pasiskevicius, F. Laurell, and E.
U. Rafailov, “Efficient doubling of femtosecond pulses in aperiodically and periodically poled KTP crystals,” Opt.
Express 15, 1155-1160 (2007).
8.12. F. Torabi-Goudarzi, and E. Riis, “Efficient cw high-power frequency doubling in periodically poled KTP,”
Opt. Commun. 227, 389–403 (2003).

89
Chapter 9. Sub-μm QPM devices
9.1. Introduction
Second-order nonlinear interactions involving counter-propagating waves demand QPM
periods on the order of the scale of the optical wavelength. Even though such QPM structures
were already demonstrated in KTP [9.12-9.3], their fabrication remains a challenge. First, standard
photolithography is applicable only to domain sizes larger than 1 μm. Second, the electrode
fringing fields and the lateral domain growth become increasingly important when the domain
sizes are in the sub-µm range, limiting the quality and the yield of periodically poled structures.
Therefore, a reliable structuring technology for sub-μm QPM gratings needs to be developed.
9.2. Periodic poling of sub-μm QPM devices
In order to create patterns with sub-μm periods, an in-house built UV-laser lithography system
has been used. A schematic setup of this system is shown in Fig. 9.1.
Fig. 9.1. UV laser lithography system for sub-μm period patterning.
A frequency-quadrupled, CW single-mode Nd:YVO4 laser, operating at 266 nm wavelength, was
employed as an exposure source. The laser beam is cleaned up using a spatial filter, then
expanded and collimated. Using a reflective diffraction grating, the collimated beam is then split
into the +1 and –1 diffraction orders, which are then recombined using high-reflective mirrors to
form an interference fringe pattern. The period of the interference pattern can be tuned by
adjusting the angles and positions of the mirrors used to reflect the two diffraction orders. The
interference pattern is then exposed to a UV26 photoresit layer deposited on the c- face of the
RKTP crystal. A pattern profile, achieved using this lithography method, is shown in Fig. 9.2.
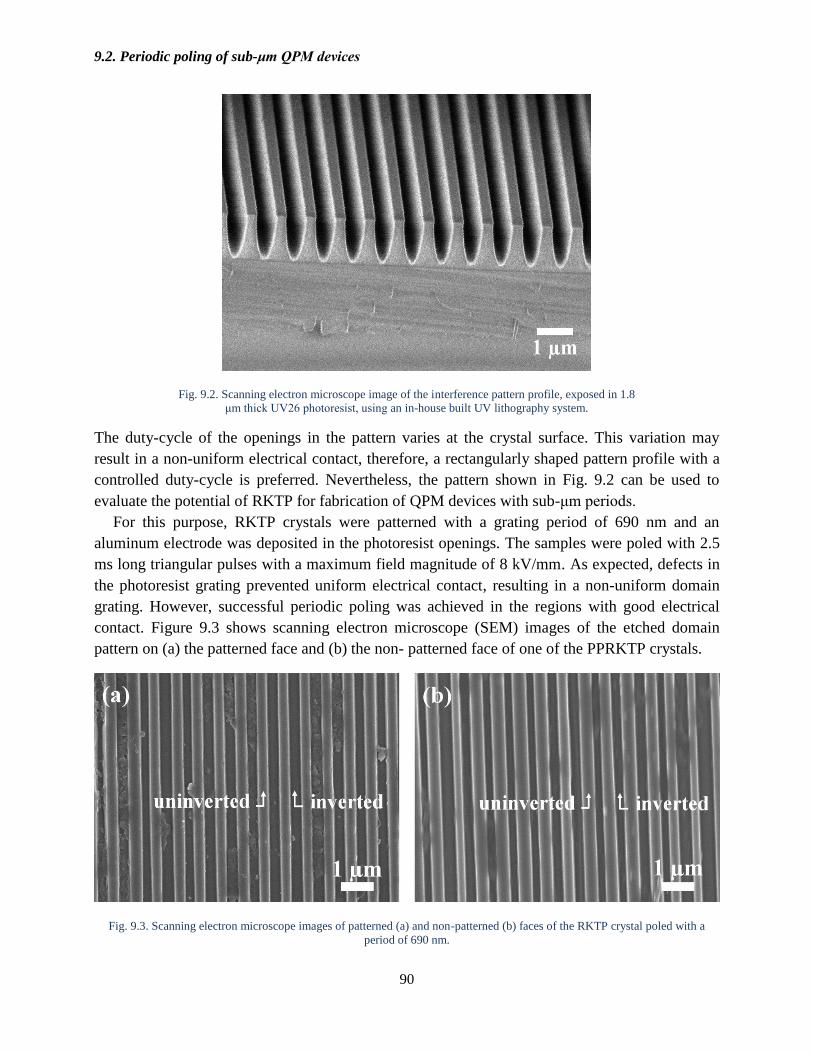
9.2. Periodic poling of sub-μm QPM devices
90
Fig. 9.2. Scanning electron microscope image of the interference pattern profile, exposed in 1.8
μm thick UV26 photoresist, using an in-house built UV lithography system.
The duty-cycle of the openings in the pattern varies at the crystal surface. This variation may
result in a non-uniform electrical contact, therefore, a rectangularly shaped pattern profile with a
controlled duty-cycle is preferred. Nevertheless, the pattern shown in Fig. 9.2 can be used to
evaluate the potential of RKTP for fabrication of QPM devices with sub-μm periods.
For this purpose, RKTP crystals were patterned with a grating period of 690 nm and an
aluminum electrode was deposited in the photoresist openings. The samples were poled with 2.5
ms long triangular pulses with a maximum field magnitude of 8 kV/mm. As expected, defects in
the photoresist grating prevented uniform electrical contact, resulting in a non-uniform domain
grating. However, successful periodic poling was achieved in the regions with good electrical
contact. Figure 9.3 shows scanning electron microscope (SEM) images of the etched domain
pattern on (a) the patterned face and (b) the non- patterned face of one of the PPRKTP crystals.
Fig. 9.3. Scanning electron microscope images of patterned (a) and non-patterned (b) faces of the RKTP crystal poled with a
period of 690 nm.

Chapter 9. Sub-μm QPM devices
91
The duty-cycle of the inverted domains on the patterned face was 0.49, whereas it varied between
0.45 and 0.6 in the non-patterned face in this PPRKTP crystal. This shows that domain
broadening in RKTP is limited even when poling sub-µm periods.
9.3. Self-assembled sub-μm domains in RKTP
As discussed above, the fabrication of sub-μm domain structures is still challenging, therefore, it
is desirable to explore alternative techniques. The properties of the polar faces and the
ferroelectric-electrode interface strongly influence the dynamics of the polarization switching.
Indeed, recently, a few novel sub-µm self-organized domain formation techniques in LiNbO3
(LN) have been demonstrated, based on the modification of the ferroelectric surface via
interaction with the intense UV light [9.4] or via ion implantation [9.5]. Unfortunately, the
trigonal crystal structure of LN favors a sub-µm self-organized surface domain formation along
the three equivalent symmetry directions in the crystal, resulting in a three-fold ray pattern of
sub-µm ferroelectric domains on the crystal surface [9.4, 9.6]. On the other hand, the domain
anisotropy of RKTP suggests that the modification of the polar surfaces of this material may be a
valid route to obtain one-dimensional bulk sub-μm ferroelectric domain structures.
For this purpose, RKTP crystals were placed in a KOH and KNO3 aqueous solution (molar
ratio: KOH:KNO3:H2O = 1.8:1:11.2) at a temperature of 135 °C for 2-3 minutes. Afterwards, the
crystals were contacted to the poling circuit and poled applying single 5 ms long symmetric
triangular electric field pulses of magnitude 4.8 – 6.4 kV/mm. The poling resulted in a quasi-
periodic domain grating that extends over the whole poled region, and was revealed by
selectively etching the crystals using the same solution. The width of the inverted domains, as
well as the distance between the neighbouring domains, were systematically measured in several
locations of each sample with a scanning electron microscope (SEM) in order to extract statistical
data. Figure 9.4 shows typical domain structure on (a) former c- and (b) former c
+ face of one of
the self-assembled RKTP (SA-RKTP) crystals.
Fig. 9.4. Scanning electron microscope images of the domain structure on (a) the former c- face and (b) the former c+ face of a
chemically treated RKTP sample, poled with planar electrodes.

9.3. Self-assembled sub-μm domains in RKTP
92
The average domain size on the former c- face of the crystal is 225 ± 75 nm and the average
domain periodicity is 650 ± 200 nm. Since the domain nucleation in RKTP starts preferentially
on the c- face, and the domain propagation is directed towards the c
+ surface, the domains
measured on the former c+ face are slightly smaller with an average domain size of 175 ± 75 nm.
Such domain sizes and periodicities are characteristic to all chemically treated RKTP samples
poled with symmetric triangular electric field pulses with the magnitudes in the range of 5.6 – 6.0
kV/mm. Figure 9.5 shows the obtained domain size and periodicity as a function of the poling
field. Note that the domain width along the x direction remains relatively constant for the
investigated electric field range. Since the domain nucleation rate depends on the electric field
magnitude, in crystals poled with low electric fields the domain structure is less dense, and the
domains have not propagated along the polar axis. With moderate electric field, the domain
density increases, shortening the distances among them, and the period becomes more uniform as
can be seen from the smaller standard deviation. At the highest electric field, domain merging
starts to occur, increasing the overall domain size and thus decreasing the domain density.
Fig. 9.5. (a) domain size, and (b) periodicity dependence on the E-field magnitude. The error bars represent standard deviation of
the distribution.
In order to gain a better understanding of the self-assembled domain grating formation,
samples treated at different temperatures and with different solutions were studied. No significant
difference either in the periodicity or the domain size could be observed when the solution
temperature was varied between 75 and 200 °C. In addition, it is worth noting that at 200 °C, the
surface corrugation resulting from the etching was quite severe with deep (> 4 μm) etch pits,
however, it did not affect the resulting domain width and density. This suggests a surface charge-
mediated mechanism rather than a surface mechanical-damage mechanism. Indeed, dry etching
of the RKTP samples with argon ions, or wet etching in hydrofluoric acid (HF) did not result in
any self-assembled domain structures. On the other hand, treatment with water-based solutions of
KOH, RbOH, KNO3 or RbNO3, did result in self-assembled gratings with similar features in
terms of periodicity and domain size. However, ion-bath in pure KNO3 at 400 °C for 2 hours did
not result in an ordered domain structure. This suggests a surface-layer modification involving K+
or Rb+ ions, both being native to the RKTP crystal structure, and mediated by the OH
- groups.

Chapter 9. Sub-μm QPM devices
93
The following mechanism can be proposed: the OH- anions readily attack the c
- face, leaving this
face ready to take a surplus of K+ ions, whereas the c
+ face remains relatively untouched. This
results in a change of the surface-layer properties on the c- face, which translates into a higher
and more uniform nucleation site density. When the external electric field is applied, it is
energetically more favorable to nucleate new domains and propagate them along the y and z
directions than to expand them along the x axis. In untreated samples, the nucleation site density
is more heterogeneous and with a larger span of thresholds, making the sideways growth and
nucleation to be competing effects. The switching time measurements further support this idea:
the treated samples, poled with 20 ms long square pulses of magnitude 4.4 kV/mm, completely
switched in 3 ms, whereas virgin samples, poled at under the same conditions, switched in 6.5
ms. This reduction of the switching time by approximately a factor of two can be associated with
a larger nucleation site density and a lower nucleation threshold. Nevertheless, this simplified
picture is incomplete. First, the relatively constant domain size suggests some sort of intrinsic
effect, related to the crystallographic structure or defects of the RKTP crystal. Second, domain-
domain interaction is also possible [9.7], and seems to play an important role. Figure 9.8 shows
the former c- face of a sample poled at 5.2 kV/mm. It can be clearly seen that the nucleated
domains appear already aligned along the y direction, suggesting electrostatic interaction, and a
possible correlated nucleation [9.8, 9.9].
Fig. 9.8. SEM image of the domain structure on the former c- face of a SA-RKTP crystal, poled with 5.2 kV/mm.
Further investigations are needed to gain a better understanding of the physical mechanisms
behind the self-organized formation of ferroelectric domain structures in the RKTP crystals in
order to answer the question whether it is possible to obtain truly periodic sub-μm QPM
structures using this relatively simple method.
One of the SA-RKTP crystals, which contained a self-assembled ferroelectric domain
structure with a periodicity of 552 ± 160 nm, was used to demonstrate non-collinear 5th
order
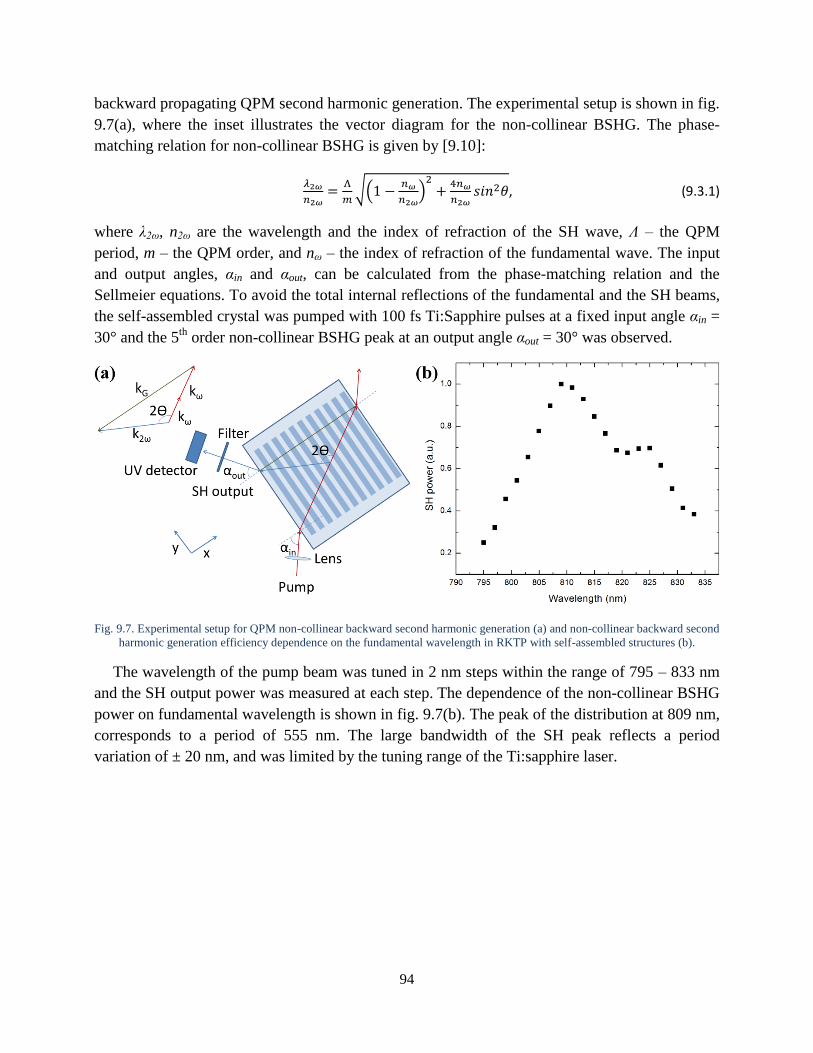
94
backward propagating QPM second harmonic generation. The experimental setup is shown in fig.
9.7(a), where the inset illustrates the vector diagram for the non-collinear BSHG. The phase-
matching relation for non-collinear BSHG is given by [9.10]:
√(
)
, (9.3.1)
where λ2ω, n2ω are the wavelength and the index of refraction of the SH wave, Λ – the QPM
period, m – the QPM order, and nω – the index of refraction of the fundamental wave. The input
and output angles, αin and αout, can be calculated from the phase-matching relation and the
Sellmeier equations. To avoid the total internal reflections of the fundamental and the SH beams,
the self-assembled crystal was pumped with 100 fs Ti:Sapphire pulses at a fixed input angle αin =
30° and the 5th
order non-collinear BSHG peak at an output angle αout = 30° was observed.
Fig. 9.7. Experimental setup for QPM non-collinear backward second harmonic generation (a) and non-collinear backward second
harmonic generation efficiency dependence on the fundamental wavelength in RKTP with self-assembled structures (b).
The wavelength of the pump beam was tuned in 2 nm steps within the range of 795 – 833 nm
and the SH output power was measured at each step. The dependence of the non-collinear BSHG
power on fundamental wavelength is shown in fig. 9.7(b). The peak of the distribution at 809 nm,
corresponds to a period of 555 nm. The large bandwidth of the SH peak reflects a period
variation of ± 20 nm, and was limited by the tuning range of the Ti:sapphire laser.

Chapter 9. Sub-μm QPM devices
95
References 9.1. C. Canalias and V. Pasiskevicius, “Mirrorless optical parametric oscillator,” Nature Photonics 1, 459-462
(2007).
9.2. C. Canalias, V. Pasiskevicius, R. Clemens, and F. Laurell, “Sub-micron periodically poled flux grown
KTiOPO4,” Appl. Phys. Lett. 82, 4233-4235 (2003).
9.3. C. Canalias, V. Pasiskevicius, M. Fokine and F. Laurell, “Backward quasi-phase matched second harmonic
generation in sub-micrometer periodically poled flux-grown KTiOPO4,” Appl. Phys. Lett. 86, 181105 (2005).
9.4. C. E. Valdivia, C. L. Sones, J. G. Scott, S. Mailis, R. W. Eason, D. A. Scymgeour, V. Gopalan, T. Jungk, E.
Soergel, and I. Clark, “Nanoscale surface domain formation on the +z face of lithium niobate by pulsed ultraviolet
laser illumination,” Appl. Phys. Lett. 86, 022906 (2005).
9.5. D. O. Alikin, E. I. Shishkin, E. V. Nikolaeva, V. Ya. Shur, M. F. Sarmanova, A. V. Ievlev, M. S. Nebogatikov,
and N. V. Gavrilov, ” Formation of Self-Assembled Domain Structures in Lithium Niobate Modified by Ar Ions
Implantation,” Ferroelectrics 399, 35-42 (2010).
9.6. I. T. Wellington, C. E. Valdivia, T. J. Sono, C. L. Sones, S. Mailis, and R. W. Eason, “Ordered nano-scale
domains in lithium niobate single crystals via phase-mask assisted all-optical poling,” Appl. Surf. Sci. 253, 4215-
4219 (2007).
9.7. L.-H. Peng, Y.-C. Shih, S.-M. Tsan, and C.-C. Hsu, “Mitigation of transverse domain growth in two-
dimensional polarization switching of lithium niobate,” Appl. Phys. Lett. 81, 5210-5212 (2002).
9.8. V. Ya. Shur, E. L. Rumyantsev, E. Nikolaeva, E. Shishkin, R. G. Batchko, G. D. Miller, M. M. Fejer, and R. L.
Byer, “Micro- and nanoscale domain engineering in lithium niobate and lithium tantalate,” Proc. SPIE 3992, 143-154
(2000).
9.9. V. Ya. Shur, “Kinetics of ferroelectric domains: Application of general approach to LiNbO3 and LiTaO3,” J.
Mater. Sci. 41, 199-210 (2006).
9.10. S. Moscovich, A. Arie, R. Urneski, A. Agronin, G. Rosenman, and Y. Rosenwaks, “Noncollinear second-
harmonic generation in sub-micrometer-poled RbTiOPO4,” Opt. Express 12, 2236-2242 (2004).

96

97
Chapter 10. Conclusions
This work focuses on periodic poling of KTP, RKTP and KTA crystals. It has been shown that
optimization of the poling parameters such as electric field pulse shape and duration can
significantly improve the QPM grating-quality and reduce domain broadening, enabling
fabrication of fine-pitch bulk domain structures. The optical performance of the QPM devices
based on different KTP isomorphs has been also evaluated.
Compared to KTP, KTA presents mainly two advantages: first, it has an extended
transparency range in infrared region, and second, it has a lower linear absorption in the green
spectral region. Prior this work, the potential of KTA for QPM applications had not been fully
explored due to the difficulties in implementing QPM structures. For OPO applications, a
PPKTA with a period of 39.5 μm and an effective nonlinearity of 10.1 pm/V has been fabricated.
The crystal was used in a Nd:YAG-pumped OPO setup to generate a signal wavelength of 1538
nm an idler wavelength of 3452 nm, with a combined signal and idler conversion efficiency of
45%. KTA also proved to be very suitable frequency conversion in the visible spectral range. The
crystals poled for green-light generation had a QPM period of 8.49 μm and present an effective
nonlinear coefficient as high as 10.5 pm/V with good uniformity over the crystal aperture. They
were used to generate 13.6 W output power with 25% conversion efficiency at 533 nm, which
today it is the highest power achieved in a CW single pass QPM SHG configuration with a KTP
isomorph as a gain medium. In addition, the absorption characteristics of KTA crystals obtained
from different growth processes were studied, suggesting that optimization of growth process
may play a key role on the transmission properties of KTA in the visible range.
It is well known that the ionic conductivity of the KTP crystals is one of the key factors
influencing domain broadening and plays a significant role in periodic poling. This problem is
alleviated by using RKTP, which presents an ionic conductivity two orders of magnitude lower
than that of regular flux-grown KTP, allowing fabrication of high aspect ratio domain structures.
This has been exploited to fabricate large-aperture QPM devices in 5 mm thick crystals, which
were used to demonstrate a degenerate QPM-OPO, which generated 60 mJ of combined signal
and idler output energy, corresponding to 6 W of average power with a conversion efficiency of
50% at a room temperature. Some of these large aperture crystals were employed in a master-
oscillator power amplifier setup to pump ZnGeP2 OPO in order to reach 6.45 μm wavelength for
laser surgery applications.
It has also been demonstrated that RKTP is more resistant to gray-tracking in blue region than
conventional flux-grown KTP. This allowed investigating the PPRKTP frequency doubling
performance at 796 nm in high-peak power and high-repetition rate regime, showing that the
predominant mechanism limiting the SHG efficiency in this spectral range is the two-photon
absorption process involving the fundamental and the second harmonic photons.
The potential of RKTP for fabrication of QPM structures with sub-μm periods was also
evaluated. The favorable properties of RKTP allow fabrication of periodic QPM structures with a
period as short as 690 nm. Moreover, a relatively simple method for self-assembling quasi-

98
periodic sub-μm ferroelectric domain gratings was introduced by exploiting nucleation
enhancement via chemical etching.
The results presented here provide a better understanding of ferroelectric domain dynamics in
the KTP isomorphs and enable the fabrication of excellent-quality QPM structures. On the other
hand, there are still issues to overcome and improvements to be made. Future work should
include the development of a reliable structuring technology of bulk sub-μm QPM gratings to be
able to explore the full potential of nonlinear optics involving counter-propagating waves.
Moreover, a better understanding of the physical mechanisms behind the self-organized
formation of the ferroelectric domain structures in RKTP crystals may open the way to truly
periodic self-assembled QPM structures using this relatively simple technique.
Finally, detailed studies of absorption and gray-tracking in the blue and the green spectral
regions should further clarify the physical mechanisms behind these phenomena and answer the
question whether the crystal growth improvements can enhance the performance of the KTP
isomorphs in the visible spectral range.
Related Documents