Jordan Economic Insight 2015

QNB Group Jordan Economic Insight 2015
Aug 14, 2015
Welcome message from author
This document is posted to help you gain knowledge. Please leave a comment to let me know what you think about it! Share it to your friends and learn new things together.
Transcript
Jordan Economic Insight2015
1
Contents Executive Summary
Background 2
Recent Developments 3
Macroeconomic Outlook 5
Key Macroeconomic Indicators 7
QNB Economics Publications 8
QNB Group International Network 9
A. Recent Developments (2014-15)
Real GDP grew 3.1% in 2014 (2.8% in 2013), driven by a continued
recovery in mining and quarrying as well as strong growth in
agriculture and construction
Inflation moderated to 2.9% in 2014 (4.8% in 2013) and turned
negative in March 2015 (-1.2%) as the impact from the liberalisation of
fuel prices and higher electricity tariffs subsided and foreign inflation
turned negative
The current account deficit narrowed to an estimated 6.8% of GDP in
2014 (10.3% in 2013) as higher grants and stronger export receipts more
than offset increased energy import costs due to lower gas from Egypt
The fiscal deficit narrowed to 2.3% of GDP in 2014 (5.6% in 2013),
reflecting fiscal consolidation supported by the on-going IMF
programme and higher foreign grants
Higher confidence in the Jordanian dinar (JOD) increased international
reserves to USD14.1bn at end-2014
The banking sector continues to recover, reflecting higher confidence in
the JOD: deposits continued to grow robustly (9.7%) while lending grew
moderately (4.6%) as banks preferred to buy government bonds rather
than to lend, resulting in a lower loan to deposit ratio (65.5%); banks
continued to clean up their balance sheets of legacy non-performing
loans (NPLs), leading to a further improvement in profitability
B. Macroeconomic Outlook (2015-17)
Despite a difficult geopolitical context and a weak global economy,
Jordan continues to recover helped by lower oil prices, IMF support and
GCC grants
Real GDP growth is expected to accelerate to 4.0% in 2015, mainly
driven by construction, mining exports (partly through bilateral
agreements with India) as well as higher government investment;
growth is projected to gather further momentum in 2016 (4.3%) and
2017 (4.5%) as economic reforms continue to bear fruit
Lower energy and food prices are expected to lead inflation to slow to
an average 0.8% in 2015, which will more than offset the further
planned increase in electricity tariffs; a projected rise in global
commodity prices in 2016-17 and stronger domestic demand are
expected to push inflation up to 2.0% in 2016 and 2.5% in 2017
The current account deficit is projected to narrow to 2.9% of GDP in
2015, primarily from lower energy prices as well as higher export
growth from the mining sector; the deficit is expected to widen again in
2016 (3.9% of GDP) and in 2017 (4.7% of GDP) as energy prices rebound
Higher taxes and lower expenditures should further narrow the fiscal
deficit in 2015 (2.1% of GDP) while net public debt is likely to gradually
decline, following a peak at end-2014 (80.3% of GDP)
Deposit growth is likely to continue to slow in 2015 (5.2%) on lower
inflation, but rebound in 2016 (6.9%) and 2017 (7.4%) on stronger
economic growth and higher inflation; lending growth is expected to
rebound in 2015 (7.4%), 2016 (8.9%) and 2017 (9.5%) as lower policy
rates and reduced government financing needs push banks to increase
their lending book; profitability should rise on further declines in NPLs
and continued high capitalisation ratios
Joannes Mongardini
Head of Economics
+974 4453 4412
Rory Fyfe
Senior Economist
+974 4453 4643
Ehsan Khoman
Economist
+974 4453 4423
Hamda Al–Thani
Economist
+974 4453 4646
Ziad Daoud
Economist
+974 4453 4642
Economics Team
Editorial closing: 3 May 2015
2
Background
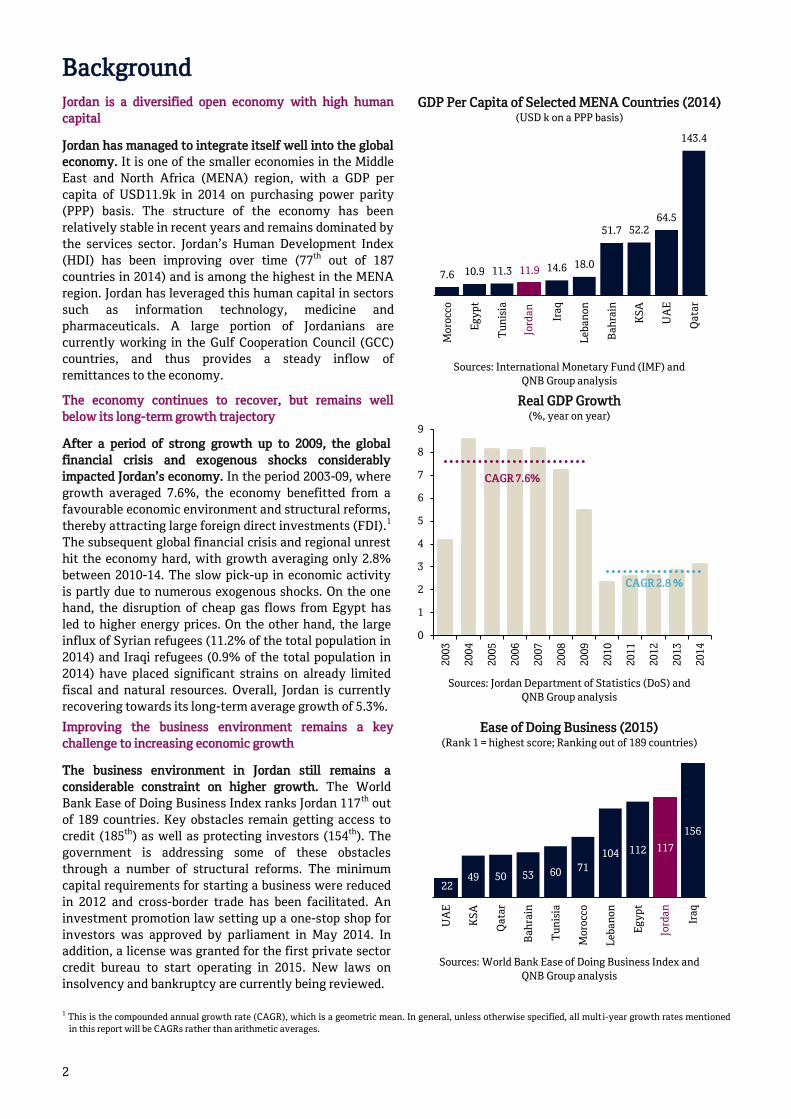
Jordan is a diversified open economy with high human
capital
Jordan has managed to integrate itself well into the global
economy. It is one of the smaller economies in the Middle
East and North Africa (MENA) region, with a GDP per
capita of USD11.9k in 2014 on purchasing power parity
(PPP) basis. The structure of the economy has been
relatively stable in recent years and remains dominated by
the services sector. Jordan’s Human Development Index
(HDI) has been improving over time (77th out of 187
countries in 2014) and is among the highest in the MENA
region. Jordan has leveraged this human capital in sectors
such as information technology, medicine and
pharmaceuticals. A large portion of Jordanians are
currently working in the Gulf Cooperation Council (GCC)
countries, and thus provides a steady inflow of
remittances to the economy.
GDP Per Capita of Selected MENA Countries (2014) (USD k on a PPP basis)
Sources: International Monetary Fund (IMF) and
QNB Group analysis
The economy continues to recover, but remains well
below its long-term growth trajectory
After a period of strong growth up to 2009, the global
financial crisis and exogenous shocks considerably
impacted Jordan’s economy. In the period 2003-09, where
growth averaged 7.6%, the economy benefitted from a
favourable economic environment and structural reforms,
thereby attracting large foreign direct investments (FDI).1
The subsequent global financial crisis and regional unrest
hit the economy hard, with growth averaging only 2.8%
between 2010-14. The slow pick-up in economic activity
is partly due to numerous exogenous shocks. On the one
hand, the disruption of cheap gas flows from Egypt has
led to higher energy prices. On the other hand, the large
influx of Syrian refugees (11.2% of the total population in
2014) and Iraqi refugees (0.9% of the total population in
2014) have placed significant strains on already limited
fiscal and natural resources. Overall, Jordan is currently
recovering towards its long-term average growth of 5.3%.
Real GDP Growth (%, year on year)
Sources: Jordan Department of Statistics (DoS) and
QNB Group analysis
Improving the business environment remains a key
challenge to increasing economic growth
The business environment in Jordan still remains a
considerable constraint on higher growth. The World
Bank Ease of Doing Business Index ranks Jordan 117th out
of 189 countries. Key obstacles remain getting access to
credit (185th) as well as protecting investors (154th). The
government is addressing some of these obstacles
through a number of structural reforms. The minimum
capital requirements for starting a business were reduced
in 2012 and cross-border trade has been facilitated. An
investment promotion law setting up a one-stop shop for
investors was approved by parliament in May 2014. In
addition, a license was granted for the first private sector
credit bureau to start operating in 2015. New laws on
insolvency and bankruptcy are currently being reviewed.
Ease of Doing Business (2015) (Rank 1 = highest score; Ranking out of 189 countries)
Sources: World Bank Ease of Doing Business Index and
QNB Group analysis
1 This is the compounded annual growth rate (CAGR), which is a geometric mean. In general, unless otherwise specified, all multi-year growth rates mentioned
in this report will be CAGRs rather than arithmetic averages.
7.6 10.9 11.3 11.9 14.6 18.0
51.7 52.264.5
143.4
Mo
rocc
o
Eg
yp
t
Tu
nis
ia
Ira
q
Le
ba
no
n
Ba
hra
in
KS
A
UA
E
Qa
tar
Jord
an
0
1
2
3
4
5
6
7
8
9
20
03
20
04
20
05
20
06
20
07
20
08
20
09
20
10
20
11
20
12
20
13
20
14
CAGR 7.6%
CAGR 2.8 %
2249 50 53 60 71
104 112 117
156
UA
E
KS
A
Qa
tar
Ba
hra
in
Tu
nis
ia
Mo
rocc
o
Le
ba
no
n
Eg
yp
t
Ira
q
Jord
an
3
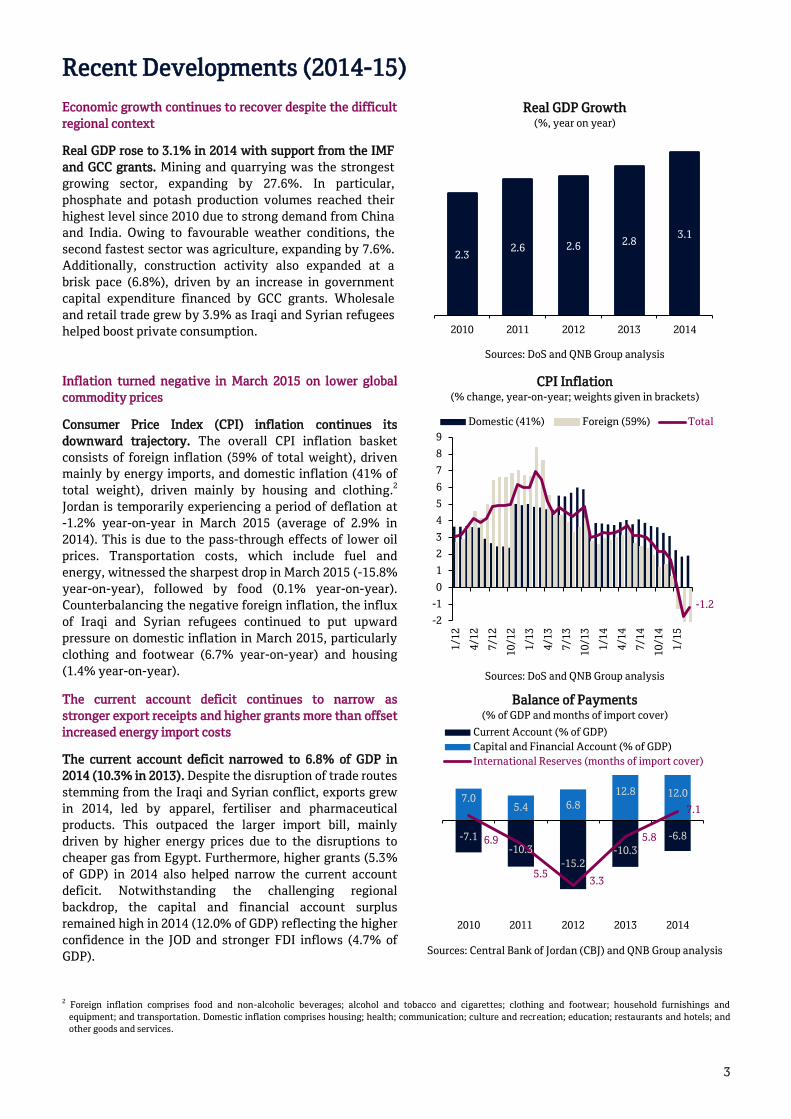
Recent Developments (2014-15)
Economic growth continues to recover despite the difficult
regional context
Real GDP rose to 3.1% in 2014 with support from the IMF
and GCC grants. Mining and quarrying was the strongest
growing sector, expanding by 27.6%. In particular,
phosphate and potash production volumes reached their
highest level since 2010 due to strong demand from China
and India. Owing to favourable weather conditions, the
second fastest sector was agriculture, expanding by 7.6%.
Additionally, construction activity also expanded at a
brisk pace (6.8%), driven by an increase in government
capital expenditure financed by GCC grants. Wholesale
and retail trade grew by 3.9% as Iraqi and Syrian refugees
helped boost private consumption.
Real GDP Growth (%, year on year)
Sources: DoS and QNB Group analysis
Inflation turned negative in March 2015 on lower global
commodity prices
Consumer Price Index (CPI) inflation continues its
downward trajectory. The overall CPI inflation basket
consists of foreign inflation (59% of total weight), driven
mainly by energy imports, and domestic inflation (41% of
total weight), driven mainly by housing and clothing.2
Jordan is temporarily experiencing a period of deflation at
-1.2% year-on-year in March 2015 (average of 2.9% in
2014). This is due to the pass-through effects of lower oil
prices. Transportation costs, which include fuel and
energy, witnessed the sharpest drop in March 2015 (-15.8%
year-on-year), followed by food (0.1% year-on-year).
Counterbalancing the negative foreign inflation, the influx
of Iraqi and Syrian refugees continued to put upward
pressure on domestic inflation in March 2015, particularly
clothing and footwear (6.7% year-on-year) and housing
(1.4% year-on-year).
CPI Inflation (% change, year-on-year; weights given in brackets)
Sources: DoS and QNB Group analysis
The current account deficit continues to narrow as
stronger export receipts and higher grants more than offset
increased energy import costs
The current account deficit narrowed to 6.8% of GDP in
2014 (10.3% in 2013). Despite the disruption of trade routes
stemming from the Iraqi and Syrian conflict, exports grew
in 2014, led by apparel, fertiliser and pharmaceutical
products. This outpaced the larger import bill, mainly
driven by higher energy prices due to the disruptions to
cheaper gas from Egypt. Furthermore, higher grants (5.3%
of GDP) in 2014 also helped narrow the current account
deficit. Notwithstanding the challenging regional
backdrop, the capital and financial account surplus
remained high in 2014 (12.0% of GDP) reflecting the higher
confidence in the JOD and stronger FDI inflows (4.7% of
GDP).
Balance of Payments (% of GDP and months of import cover)
Sources: Central Bank of Jordan (CBJ) and QNB Group analysis
2 Foreign inflation comprises food and non-alcoholic beverages; alcohol and tobacco and cigarettes; clothing and footwear; household furnishings and
equipment; and transportation. Domestic inflation comprises housing; health; communication; culture and recreation; education; restaurants and hotels; and
other goods and services.
2.32.6 2.6 2.8
3.1
2010 2011 2012 2013 2014
-1.2
-2
-1
0
1
2
3
4
5
6
7
8
9
1/1
2
4/1
2
7/1
2
10
/12
1/1
3
4/1
3
7/1
3
10
/13
1/1
4
4/1
4
7/1
4
10
/14
1/1
5
Domestic (41%) Foreign (59%) Total
-7.1-10.3
-15.2
-10.3
-6.8
7.05.4 6.8
12.8 12.0
6.9
5.53.3
5.8
7.1
2010 2011 2012 2013 2014
Current Account (% of GDP)
Capital and Financial Account (% of GDP)
International Reserves (months of import cover)

4
International reserves continue to rise on higher
confidence in the JOD
Higher confidence in the JOD has led the central bank to
continue accumulating international reserves. Jordan’s
long-standing currency peg against the US dollar rests on
the maintenance of a high level of international reserves.
Improved confidence in the JOD, driven by an
improvement in Jordan’s economic indicators, has led to a
robust increase in Jordanian deposits and a corresponding
decline in foreign currency deposits. This reflects the
overall improvement in investor sentiment towards the
Jordanian economy. As a result, the CBJ further
accumulated international reserves to USD14.1bn at end-
2014 (7.1 months of import cover). This, combined with
lower inflation levels, has prompted the CBJ to reduce its
overnight deposit rate twice in 2014 and cut it further to
1.75% in February 2015, to encourage bank lending and
support economic growth.
International Reserves and Currency Substitution (USD bn and %)
* Currency substitution is defined as the deposits of
foreign currency as a percentage of total deposits
Sources: CBJ and QNB Group analysis
Higher grants and one-off revenues from the sale of mobile
licences reduced the fiscal deficit in 2014
The fiscal deficit narrowed further to 2.3% of GDP in 2014
(5.6% in 2013), reflecting fiscal consolidation supported by
the on-going IMF programme and grants. Government
revenues increased to 28.4% of GDP, supported by reforms
such as the elimination of exemptions from value added
taxes (VAT), tax hikes on alcohol and cigarettes as well as
one-off revenues from the sale of mobile licences. In
addition, higher external grants, including the USD5bn
pledged by GCC states, contributed to narrowing the deficit
in 2014. Government spending rose to 30.7% of GDP, partly
reflecting continuing losses from the National Electric and
Power Company (NEPCO). Interruptions in gas supplies
from Egypt forced Jordan to run its power plants primarily
on more costly heavy fuel in 2014, thus increasing the cost
of producing electricity. The government has been
financing NEPCO losses through higher net public debt,
which reached 80.3% of GDP at end-2014.
Fiscal Balance (% of GDP)
Sources: CBJ, Jordan Ministry of Finance (MoF) and QNB Group
analysis
The banking sector expanded broadly in line with the
overall economy in 2014
Jordanian banks continue to be stable, liquid and
adequately capitalised despite the difficult regional
context. Notwithstanding robust deposit growth (9.7%),
lending grew moderately (4.8%) in 2014 as banks preferred
to buy government bonds rather than lend. Additionally,
disruptions in trade to Iraq and Syria caused by the on-
going regional context resulted in lower lending to the
trade and services sector. As a result, the loan to deposit
ratio fell significantly in 2014 (65.6%). Banks have
continued to clean up their balance sheets of legacy non-
performing loans (NPLs), leading to a moderate pickup in
profitability.
Banking Sector (% change; year-on-year)
Sources: CBJ and QNB Group analysis
18
20
22
24
26
28
30
0
2
4
6
8
10
12
14
16
1/1
1
5/1
1
9/1
1
1/1
2
5/1
2
9/1
2
1/1
3
5/1
3
9/1
3
1/1
4
5/1
4
9/1
4
1/1
5
International Reserves (bn USD) (Left Axis)
Currency Substitution* (Right Axis)
24.9
26.423.0
24.1
28.4
30.4
33.2
31.329.7
30.7-5.6
-6.8
-8.3
-5.6
-2.3
2010 2011 2012 2013 2014
Revenue Expenditure Fiscal Balance
9.4
%
7.8
%
4.2
%
9.0
%
4.8
%
10
.9%
8.3
%
2.4
%
10
.5%
9.7
%
8.5
% 9.7
%
12
.5%
6.2
%
4.8
%
64.2%65.0%
71.4%
68.6%
65.6%
2010 2011 2012 2013 2014
Assets Deposits
Loans Loans to Deposit Ratio
5
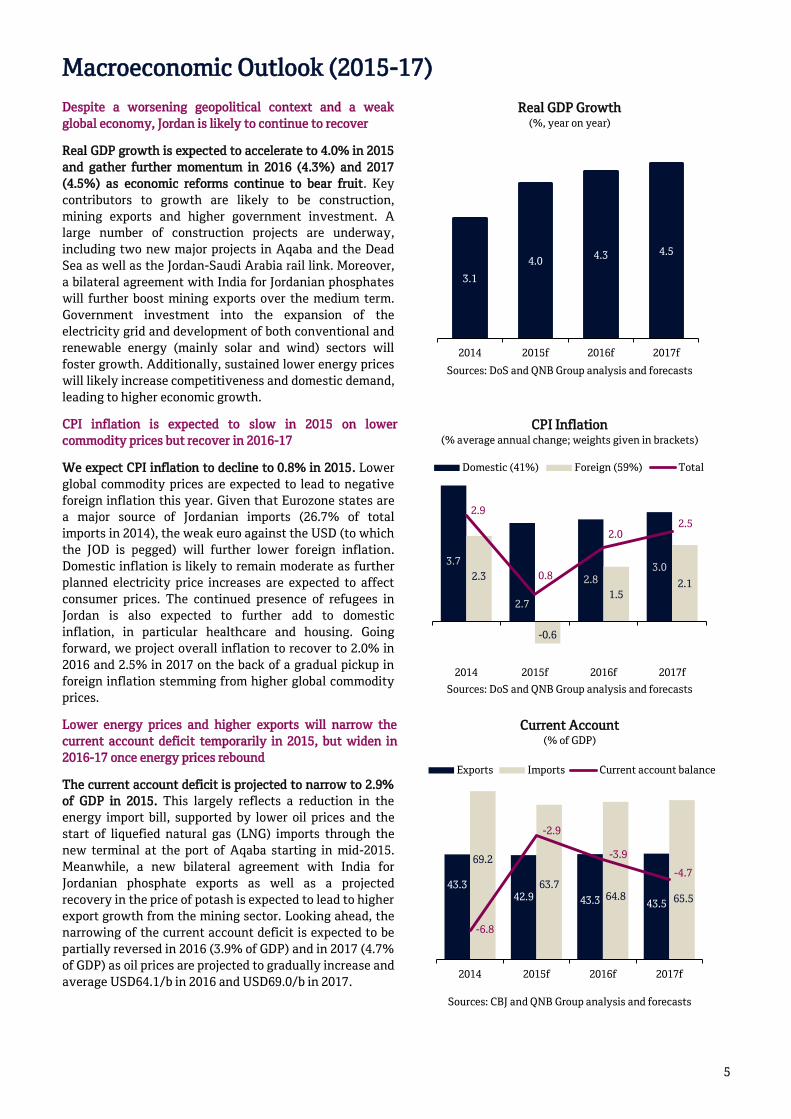
Macroeconomic Outlook (2015-17)
Despite a worsening geopolitical context and a weak
global economy, Jordan is likely to continue to recover
Real GDP growth is expected to accelerate to 4.0% in 2015
and gather further momentum in 2016 (4.3%) and 2017
(4.5%) as economic reforms continue to bear fruit. Key
contributors to growth are likely to be construction,
mining exports and higher government investment. A
large number of construction projects are underway,
including two new major projects in Aqaba and the Dead
Sea as well as the Jordan-Saudi Arabia rail link. Moreover,
a bilateral agreement with India for Jordanian phosphates
will further boost mining exports over the medium term.
Government investment into the expansion of the
electricity grid and development of both conventional and
renewable energy (mainly solar and wind) sectors will
foster growth. Additionally, sustained lower energy prices
will likely increase competitiveness and domestic demand,
leading to higher economic growth.
Real GDP Growth (%, year on year)
Sources: DoS and QNB Group analysis and forecasts
CPI inflation is expected to slow in 2015 on lower
commodity prices but recover in 2016-17
We expect CPI inflation to decline to 0.8% in 2015. Lower
global commodity prices are expected to lead to negative
foreign inflation this year. Given that Eurozone states are
a major source of Jordanian imports (26.7% of total
imports in 2014), the weak euro against the USD (to which
the JOD is pegged) will further lower foreign inflation.
Domestic inflation is likely to remain moderate as further
planned electricity price increases are expected to affect
consumer prices. The continued presence of refugees in
Jordan is also expected to further add to domestic
inflation, in particular healthcare and housing. Going
forward, we project overall inflation to recover to 2.0% in
2016 and 2.5% in 2017 on the back of a gradual pickup in
foreign inflation stemming from higher global commodity
prices.
CPI Inflation (% average annual change; weights given in brackets)
Sources: DoS and QNB Group analysis and forecasts
Lower energy prices and higher exports will narrow the
current account deficit temporarily in 2015, but widen in
2016-17 once energy prices rebound
The current account deficit is projected to narrow to 2.9%
of GDP in 2015. This largely reflects a reduction in the
energy import bill, supported by lower oil prices and the
start of liquefied natural gas (LNG) imports through the
new terminal at the port of Aqaba starting in mid-2015.
Meanwhile, a new bilateral agreement with India for
Jordanian phosphate exports as well as a projected
recovery in the price of potash is expected to lead to higher
export growth from the mining sector. Looking ahead, the
narrowing of the current account deficit is expected to be
partially reversed in 2016 (3.9% of GDP) and in 2017 (4.7%
of GDP) as oil prices are projected to gradually increase and
average USD64.1/b in 2016 and USD69.0/b in 2017.
Current Account (% of GDP)
Sources: CBJ and QNB Group analysis and forecasts
3.1
4.04.3 4.5
2014 2015f 2016f 2017f
3.7
2.7
2.83.0
2.3
-0.6
1.52.1
2.9
0.8
2.02.5
2014 2015f 2016f 2017f
Domestic (41%) Foreign (59%) Total
43.342.9 43.3 43.5
69.2
63.764.8 65.5
-6.8
-2.9
-3.9
-4.7
2014 2015f 2016f 2017f
Exports Imports Current account balance
6
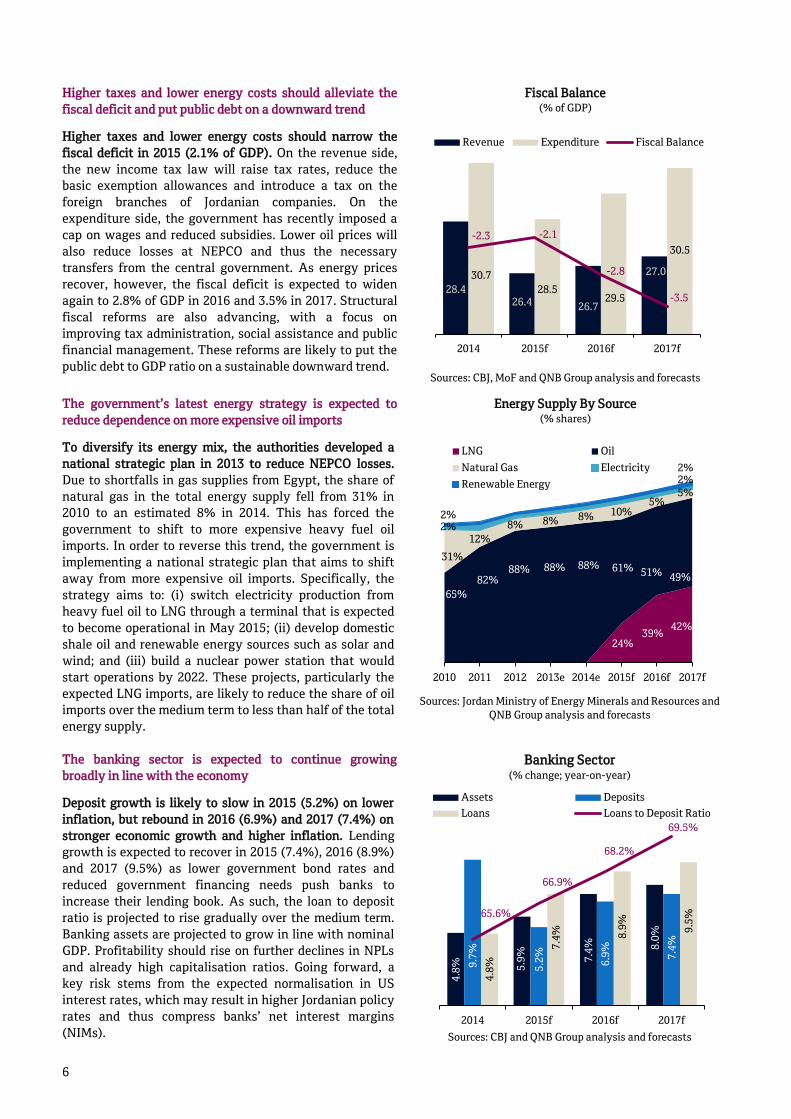
Higher taxes and lower energy costs should alleviate the
fiscal deficit and put public debt on a downward trend
Higher taxes and lower energy costs should narrow the
fiscal deficit in 2015 (2.1% of GDP). On the revenue side,
the new income tax law will raise tax rates, reduce the
basic exemption allowances and introduce a tax on the
foreign branches of Jordanian companies. On the
expenditure side, the government has recently imposed a
cap on wages and reduced subsidies. Lower oil prices will
also reduce losses at NEPCO and thus the necessary
transfers from the central government. As energy prices
recover, however, the fiscal deficit is expected to widen
again to 2.8% of GDP in 2016 and 3.5% in 2017. Structural
fiscal reforms are also advancing, with a focus on
improving tax administration, social assistance and public
financial management. These reforms are likely to put the
public debt to GDP ratio on a sustainable downward trend.
Fiscal Balance (% of GDP)
Sources: CBJ, MoF and QNB Group analysis and forecasts
The government’s latest energy strategy is expected to
reduce dependence on more expensive oil imports
To diversify its energy mix, the authorities developed a
national strategic plan in 2013 to reduce NEPCO losses.
Due to shortfalls in gas supplies from Egypt, the share of
natural gas in the total energy supply fell from 31% in
2010 to an estimated 8% in 2014. This has forced the
government to shift to more expensive heavy fuel oil
imports. In order to reverse this trend, the government is
implementing a national strategic plan that aims to shift
away from more expensive oil imports. Specifically, the
strategy aims to: (i) switch electricity production from
heavy fuel oil to LNG through a terminal that is expected
to become operational in May 2015; (ii) develop domestic
shale oil and renewable energy sources such as solar and
wind; and (iii) build a nuclear power station that would
start operations by 2022. These projects, particularly the
expected LNG imports, are likely to reduce the share of oil
imports over the medium term to less than half of the total
energy supply.
Energy Supply By Source (% shares)
Sources: Jordan Ministry of Energy Minerals and Resources and
QNB Group analysis and forecasts
The banking sector is expected to continue growing
broadly in line with the economy
Deposit growth is likely to slow in 2015 (5.2%) on lower
inflation, but rebound in 2016 (6.9%) and 2017 (7.4%) on
stronger economic growth and higher inflation. Lending
growth is expected to recover in 2015 (7.4%), 2016 (8.9%)
and 2017 (9.5%) as lower government bond rates and
reduced government financing needs push banks to
increase their lending book. As such, the loan to deposit
ratio is projected to rise gradually over the medium term.
Banking assets are projected to grow in line with nominal
GDP. Profitability should rise on further declines in NPLs
and already high capitalisation ratios. Going forward, a
key risk stems from the expected normalisation in US
interest rates, which may result in higher Jordanian policy
rates and thus compress banks’ net interest margins
(NIMs).
Banking Sector (% change; year-on-year)
Sources: CBJ and QNB Group analysis and forecasts
28.426.4 26.7
27.030.7
28.529.5
30.5
-2.3 -2.1
-2.8
-3.5
2014 2015f 2016f 2017f
Revenue Expenditure Fiscal Balance
24%39%
42%
65%
82%88% 88% 88% 61% 51% 49%
31%
12%
8% 8% 8% 10%5%
5%
2%
2%
2%
2%
2010 2011 2012 2013e 2014e 2015f 2016f 2017f
LNG Oil
Natural Gas Electricity
Renewable Energy
4.8
% 5.9
%
7.4
% 8.0
%
9.7
%
5.2
%
6.9
%
7.4
%
4.8
%
7.4
% 8.9
%
9.5
%65.6%
66.9%
68.2%
69.5%
2014 2015f 2016f 2017f
Assets Deposits
Loans Loans to Deposit Ratio
7
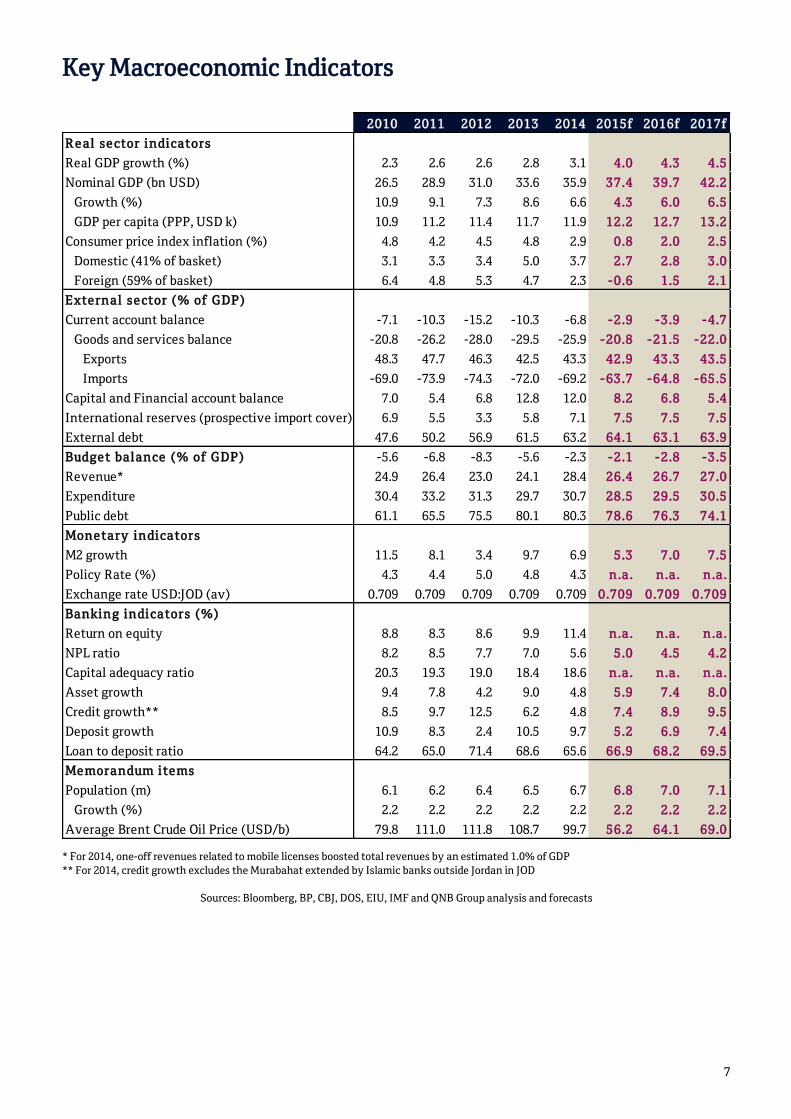
Key Macroeconomic Indicators
* For 2014, one-off revenues related to mobile licenses boosted total revenues by an estimated 1.0% of GDP
** For 2014, credit growth excludes the Murabahat extended by Islamic banks outside Jordan in JOD
Sources: Bloomberg, BP, CBJ, DOS, EIU, IMF and QNB Group analysis and forecasts
2010 2011 2012 2013 2014 2015f 2016f 2017f
R e al se ctor indicators
Real GDP growth (%) 2.3 2.6 2.6 2.8 3.1 4.0 4.3 4.5
Nominal GDP (bn USD) 26.5 28.9 31.0 33.6 35.9 37.4 39.7 42.2
Growth (%) 10.9 9.1 7.3 8.6 6.6 4.3 6.0 6.5
GDP per capita (PPP, USD k) 10.9 11.2 11.4 11.7 11.9 12.2 12.7 13.2
Consumer price index inflation (%) 4.8 4.2 4.5 4.8 2.9 0.8 2.0 2.5
Domestic (41% of basket) 3.1 3.3 3.4 5.0 3.7 2.7 2.8 3.0
Foreign (59% of basket) 6.4 4.8 5.3 4.7 2.3 -0.6 1.5 2.1
Exte rnal se ctor (% of GDP)
Current account balance -7.1 -10.3 -15.2 -10.3 -6.8 -2.9 -3.9 -4.7
Goods and services balance -20.8 -26.2 -28.0 -29.5 -25.9 -20.8 -21.5 -22.0
Exports 48.3 47.7 46.3 42.5 43.3 42.9 43.3 43.5
Imports -69.0 -73.9 -74.3 -72.0 -69.2 -63.7 -64.8 -65.5
Capital and Financial account balance 7.0 5.4 6.8 12.8 12.0 8.2 6.8 5.4
International reserves (prospective import cover) 6.9 5.5 3.3 5.8 7.1 7.5 7.5 7.5
External debt 47.6 50.2 56.9 61.5 63.2 64.1 63.1 63.9
Budge t balance (% of GDP) -5.6 -6.8 -8.3 -5.6 -2.3 -2.1 -2.8 -3.5
Revenue* 24.9 26.4 23.0 24.1 28.4 26.4 26.7 27.0
Expenditure 30.4 33.2 31.3 29.7 30.7 28.5 29.5 30.5
Public debt 61.1 65.5 75.5 80.1 80.3 78.6 76.3 74.1
Mone tary indicators
M2 growth 11.5 8.1 3.4 9.7 6.9 5.3 7.0 7.5
Policy Rate (%) 4.3 4.4 5.0 4.8 4.3 n.a. n.a. n.a.
Exchange rate USD:JOD (av) 0.709 0.709 0.709 0.709 0.709 0.709 0.709 0.709
Banking indicators (%)
Return on equity 8.8 8.3 8.6 9.9 11.4 n.a. n.a. n.a.
NPL ratio 8.2 8.5 7.7 7.0 5.6 5.0 4.5 4.2
Capital adequacy ratio 20.3 19.3 19.0 18.4 18.6 n.a. n.a. n.a.
Asset growth 9.4 7.8 4.2 9.0 4.8 5.9 7.4 8.0
Credit growth** 8.5 9.7 12.5 6.2 4.8 7.4 8.9 9.5
Deposit growth 10.9 8.3 2.4 10.5 9.7 5.2 6.9 7.4
Loan to deposit ratio 64.2 65.0 71.4 68.6 65.6 66.9 68.2 69.5
Me morandum ite ms
Population (m) 6.1 6.2 6.4 6.5 6.7 6.8 7.0 7.1
Growth (%) 2.2 2.2 2.2 2.2 2.2 2.2 2.2 2.2
Average Brent Crude Oil Price (USD/b) 79.8 111.0 111.8 108.7 99.7 56.2 64.1 69.0
8
QNB Group Publications
Recent Economic Insight Reports
China 2015 India 2014 Indonesia 2014 Jordan 2014 KSA 2013
Kuwait 2015 Oman 2013 Qatar – Sep 2014 Qatar - Feb 2015 UAE 2013
Qatar reports
Qatar Monthly Monitor
Recent Economic Commentaries
Qatar’s Inflation Moderates on Lower Foreign Inflation
Taking Stock of the Latest US Economic Data
UK Elections Marginally Favour the Less Austere
Oil, Currencies and Diverging Monetary Policies: the Global Economy in 2015
The Chinese Renminbi Lands in Doha
Eight Reasons Why The US Economy Has Slowed Down in Q1
The Qatari Economy Grew Fast in 2014 Despite Falling Oil Prices
Global Headwinds To Slow Several Asian Countries
Has The Fed Run Out Of Patience?
Will China Meet its 2015 Growth Target?
India’s Budget Delivers on Modi’s Reform Agenda
Little Global Spillover from the Greek Drama
Why Did Bank Indonesia Cut Interest Rates?
Are We In For Another US Dollar Squeeze?
Are Oil Prices Poised For a Rebound?
Capital Flows into Emerging Markets to Remain Volatile in 2015
How the ECB Learned to Love Quantitative Easing
China’s Slowdown Could Further Deflate Commodity Prices
The Great Deflation of 2015
Disclaimer and Copyright Notice
All the information in this report has been carefully collated and verified. However, QNB Group accepts no liability
whatsoever for any direct or consequential losses arising from its use. Where an opinion is expressed, unless otherwise
cited, it is that of the authors which does not coincide with that of any other party, and such opinions may not be
attributed to any other party.
The report is distributed on a complimentary basis to valued business partners of QNB Group. It may not be reproduced
in whole or in part without permission.
9
QNB International Branches and Representative Offices
China Room 930, 9th Floor
Shanghai World Financial Center
100 Century Avenue
Pudong New Area
Shanghai
China
Tel: +86 21 6877 8980
Fax: +86 21 6877 8981
Mauritania Al-Khaima City Center
10, Rue Mamadou Konate
Mauritania
Tel: +222 45249651
Fax: +222 4524 9655
United Kingdom 51 Grosvenor Street
London W1K 3HH
United Kingdom
Tel: +44 207 647 2600
Fax: +44 207 647 2647
France 65 Avenue d’lena 75116 Paris
France
Tel: +33 1 53 23 0077
Fax: +33 1 53 23 0070
Oman QNB Building
MBD Area - Matarah
Opposite to Central Bank of Oman
P.O. Box: 4050
Postal Code: 112, Ruwi
Oman
Tel: +968 2478 3555
Fax: +968 2477 9233
Vietnam 31/F Saigon Trade Center
37 Ton Duc Thang street, District 1
Ho Chi Minh City
Tel: +84 8 3911 7525
Fax: +84 8 939 100 082
Iran
Representative Office
6th floor Navak Building
Unit 14 Africa Tehran
Iran
Tel: +98 21 88 889 814
Fax: +98 21 88 889 824
Singapore Three Temasek Avenue
#27-01 Centennial Tower
Singapore 039190
Singapore
Tel: +65 6499 0866
Fax: +65 6884 9679
Yemen QNB Building
Al-Zubairi Street
P.O. Box: 4310 Sana’a
Yemen
Tel: +967 1 517517
Fax: +967 1 517666
Kuwait
Al-Arabia Tower
Ahmad Al-Jaber Street
Sharq Area
P.O. Box: 583
Dasman 15456
Kuwait
Tel: +965 2226 7023
Fax: +965 2226 7031
South Sudan Juba
P.O. Box: 587
South Sudan
Lebanon Ahmad Shawki Street
Capital Plaza Building
Mina El Hosn, Solidere – Beirut
Lebanon
Tel: +961 1 762 222
Fax: +961 1 377 177
Sudan Africa Road - Amarat
Street No. 9, P.O. Box: 8134
Sudan
Tel: +249 183 48 0000
Fax: +249 183 48 6666

10
QNB Subsidiaries and Associate Companies
Algeria The Housing Bank for Trade
and Finance (HBTF)
Tel: +213 2191881/2
Fax: +213 21918878
Iraq Mansour Bank
Associate Company
P.O. Box: 3162
Al Alawiya Post Office
Al Wihda District Baghdad
Iraq
Tel: +964 1 7175586
Fax: +964 1 7175514
Switzerland QNB Banque Privée
Subsidiary
3 Rue des Alpes
P.O. Box: 1785
1211 Genève-1 Mont Blanc
Switzerland
Tel: +41 22907 7070
Fax: +41 22907 7071
Bahrain The Housing Bank for Trade
and Finance (HBTF)
Tel: +973 17225227
Fax: +973 17227225
Jordan The Housing Bank for Trade
and Finance (HBTF)
Associate Company
P.O. Box: 7693
Postal Code 11118 Amman
Jordan
Tel: +962 6 5200400
Fax: +962 6 5678121
Syria QNB Syria
Subsidiary
Baghdad Street
P.O. Box: 33000 Damascus
Syria
Tel: +963 11-2290 1000
Fax: +963 11-44 32221
Egypt QNB ALAHLI
Dar Champollion
5 Champollion St, Downtown 2664
Cairo
Egypt
Tel: +202 2770 7000
Fax: +202 2770 7099
Libya Bank of Commerce and Development
BCD Tower, Gamal A Nasser Street
P.O. Box: 9045, Al Berka
Benghazi
Libya
Tel: +218 619 080 230
Fax: +218 619 097 115
www.bcd.ly
Tunisia QNB Tunisia
Associate Company
Rue de la cité des sciences
P.O. Box: 320 – 1080 Tunis Cedex
Tunisia
Tel: +216 7171 3555
Fax: +216 7171 3111
www.tqb.com.tn
India QNB India Private Limited
802 TCG Financial Centre
Bandra Kurla Complex
Bandra East
Mumbai 400 051
India
Tel: + 91 22 26525613
Palestine The Housing Bank for Trade
and Finance (HBTF)
Tel: +970 2 2986270
Fax: +970 2 2986275
UAE
Commercial Bank International p.s.c
Associate Company
P.O. Box: 4449, Dubai,
Al Riqqa Street, Deira
UAE
Tel: +971 04 2275265
Fax: +971 04 2279038
Indonesia QNB Indonesia Tower, 18 Parc
Jl. Jendral Sudirman Kav.
52-53 Jakarta 12190
Tel : +62 21 515 5155
Fax : +62 21 515 5388
qnbkesawan.co.id
Qatar Al Jazeera Finance Company
Associate Company
P.O. Box: 22310 Doha
Qatar
Tel: +974 4468 2812
Fax: +974 4468 2616

Qatar National Bank S.A.QP.O. Box 1000, Doha, Qatar
Tel: +974 4440 7407Fax: +974 4441 3753
qnb.com
Related Documents