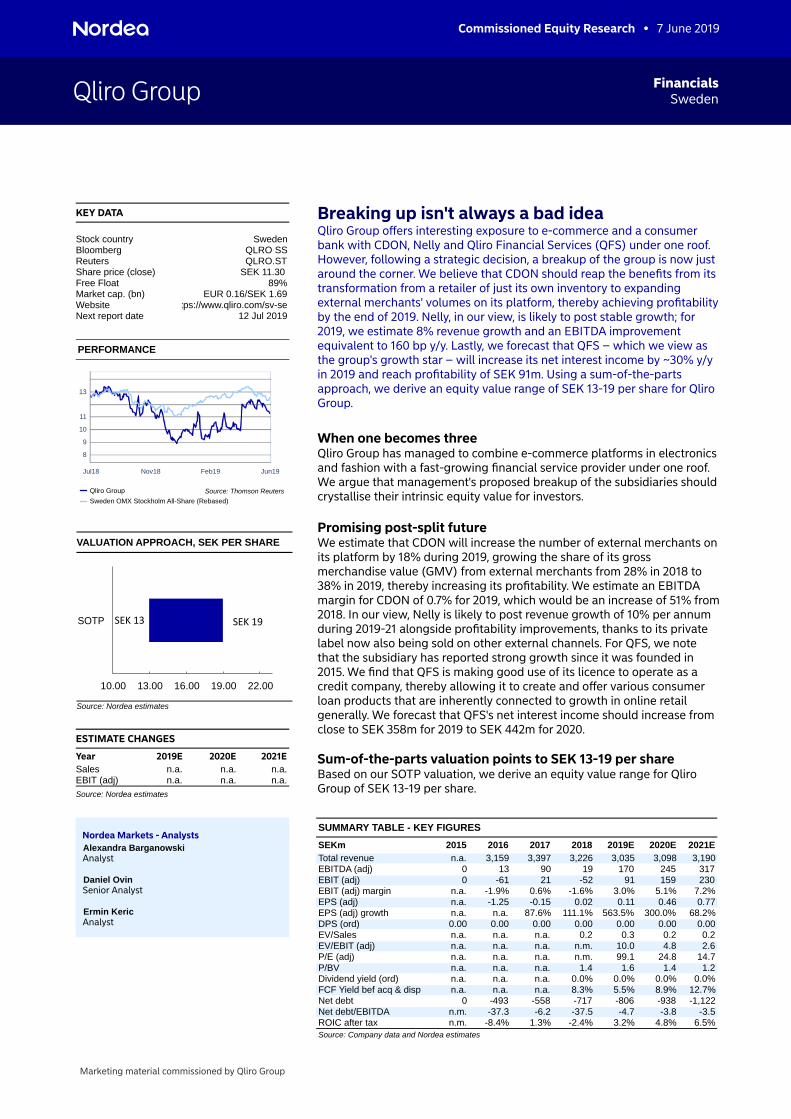
Qliro Group Sweden Financials Commissioned Equity Research • 7 June 2019 KEY DATA Sweden Stock country QLRO SS Bloomberg QLRO.ST Reuters SEK 11.30 Share price (close) 89% Free Float EUR 0.16/SEK 1.69 Market cap. (bn) tps://www.qliro.com/sv-se Website 12 Jul 2019 Next report date PERFORMANCE Jul18 Nov18 Feb19 Jun19 8 9 10 11 13 Qliro Group Sweden OMX Stockholm All-Share (Rebased) Source: Thomson Reuters VALUATION APPROACH, SEK PER SHARE 10.00 13.00 16.00 19.00 22.00 SOTP SEK 13 SEK 19 Source: Nordea estimates ESTIMATE CHANGES 2021E 2020E 2019E Year n.a. n.a. n.a. Sales n.a. n.a. n.a. EBIT (adj) Source: Nordea estimates Breaking up isn't always a bad idea Qliro Group offers interesting exposure to e-commerce and a consumer bank with CDON, Nelly and Qliro Financial Services (QFS) under one roof. However, following a strategic decision, a breakup of the group is now just around the corner. We believe that CDON should reap the benefits from its transformation from a retailer of just its own inventory to expanding external merchants' volumes on its platform, thereby achieving profitability by the end of 2019. Nelly, in our view, is likely to post stable growth; for 2019, we estimate 8% revenue growth and an EBITDA improvement equivalent to 160 bp y/y. Lastly, we forecast that QFS – which we view as the group's growth star – will increase its net interest income by ~30% y/y in 2019 and reach profitability of SEK 91m. Using a sum-of-the-parts approach, we derive an equity value range of SEK 13-19 per share for Qliro Group. When one becomes three Qliro Group has managed to combine e-commerce platforms in electronics and fashion with a fast-growing financial service provider under one roof. We argue that management's proposed breakup of the subsidiaries should crystallise their intrinsic equity value for investors. Promising post-split future We estimate that CDON will increase the number of external merchants on its platform by 18% during 2019, growing the share of its gross merchandise value (GMV) from external merchants from 28% in 2018 to 38% in 2019, thereby increasing its profitability. We estimate an EBITDA margin for CDON of 0.7% for 2019, which would be an increase of 51% from 2018. In our view, Nelly is likely to post revenue growth of 10% per annum during 2019-21 alongside profitability improvements, thanks to its private label now also being sold on other external channels. For QFS, we note that the subsidiary has reported strong growth since it was founded in 2015. We find that QFS is making good use of its licence to operate as a credit company, thereby allowing it to create and offer various consumer loan products that are inherently connected to growth in online retail generally. We forecast that QFS's net interest income should increase from close to SEK 358m for 2019 to SEK 442m for 2020. Sum-of-the-parts valuation points to SEK 13-19 per share Based on our SOTP valuation, we derive an equity value range for Qliro Group of SEK 13-19 per share. Nordea Markets - Analysts Alexandra Barganowski Analyst Daniel Ovin Senior Analyst Ermin Keric Analyst SUMMARY TABLE - KEY FIGURES 2021E 2020E 2019E 2018 2017 2016 2015 SEKm 3,190 3,098 3,035 3,226 3,397 3,159 n.a. Total revenue 317 245 170 19 90 13 0 EBITDA (adj) 230 159 91 -52 21 -61 0 EBIT (adj) 7.2% 5.1% 3.0% -1.6% 0.6% -1.9% n.a. EBIT (adj) margin 0.77 0.46 0.11 0.02 -0.15 -1.25 n.a. EPS (adj) 68.2% 300.0% 563.5% 111.1% 87.6% n.a. n.a. EPS (adj) growth 0.00 0.00 0.00 0.00 0.00 0.00 0.00 DPS (ord) 0.2 0.2 0.3 0.2 n.a. n.a. n.a. EV/Sales 2.6 4.8 10.0 n.m. n.a. n.a. n.a. EV/EBIT (adj) 14.7 24.8 99.1 n.m. n.a. n.a. n.a. P/E (adj) 1.2 1.4 1.6 1.4 n.a. n.a. n.a. P/BV 0.0% 0.0% 0.0% 0.0% n.a. n.a. n.a. Dividend yield (ord) 12.7% 8.9% 5.5% 8.3% n.a. n.a. n.a. FCF Yield bef acq & disp -1,122 -938 -806 -717 -558 -493 0 Net debt -3.5 -3.8 -4.7 -37.5 -6.2 -37.3 n.m. Net debt/EBITDA 6.5% 4.8% 3.2% -2.4% 1.3% -8.4% n.m. ROIC after tax Source: Company data and Nordea estimates Marketing material commissioned by Qliro Group

Welcome message from author
This document is posted to help you gain knowledge. Please leave a comment to let me know what you think about it! Share it to your friends and learn new things together.
Transcript
Qliro Group SwedenFinancials
Commissioned Equity Research • 7 June 2019
KEY DATA
SwedenStock countryQLRO SSBloombergQLRO.STReuters
SEK 11.30 Share price (close)89%Free Float
EUR 0.16/SEK 1.69Market cap. (bn)tps://www.qliro.com/sv-seWebsite
12 Jul 2019Next report date
PERFORMANCE
Jul18 Nov18 Feb19 Jun19
8
9
10
11
13
Qliro Group
Sweden OMX Stockholm All-Share (Rebased)
Source: Thomson Reuters
VALUATION APPROACH, SEK PER SHARE
10.00 13.00 16.00 19.00 22.00
SOTP SEK 13 SEK 19
Source: Nordea estimates
ESTIMATE CHANGES
2021E2020E2019EYearn.a.n.a.n.a.Salesn.a.n.a.n.a.EBIT (adj)
Source: Nordea estimates
Breaking up isn't always a bad ideaQliro Group offers interesting exposure to e-commerce and a consumer bank with CDON, Nelly and Qliro Financial Services (QFS) under one roof. However, following a strategic decision, a breakup of the group is now just around the corner. We believe that CDON should reap the benefits from its transformation from a retailer of just its own inventory to expanding external merchants' volumes on its platform, thereby achieving profitability by the end of 2019. Nelly, in our view, is likely to post stable growth; for 2019, we estimate 8% revenue growth and an EBITDA improvement equivalent to 160 bp y/y. Lastly, we forecast that QFS – which we view as the group's growth star – will increase its net interest income by ~30% y/y in 2019 and reach profitability of SEK 91m. Using a sum-of-the-parts approach, we derive an equity value range of SEK 13-19 per share for Qliro Group.
When one becomes threeQliro Group has managed to combine e-commerce platforms in electronics and fashion with a fast-growing financial service provider under one roof. We argue that management's proposed breakup of the subsidiaries should crystallise their intrinsic equity value for investors.
Promising post-split futureWe estimate that CDON will increase the number of external merchants on its platform by 18% during 2019, growing the share of its gross merchandise value (GMV) from external merchants from 28% in 2018 to 38% in 2019, thereby increasing its profitability. We estimate an EBITDA margin for CDON of 0.7% for 2019, which would be an increase of 51% from 2018. In our view, Nelly is likely to post revenue growth of 10% per annum during 2019-21 alongside profitability improvements, thanks to its private label now also being sold on other external channels. For QFS, we note that the subsidiary has reported strong growth since it was founded in 2015. We find that QFS is making good use of its licence to operate as a credit company, thereby allowing it to create and offer various consumer loan products that are inherently connected to growth in online retail generally. We forecast that QFS's net interest income should increase from close to SEK 358m for 2019 to SEK 442m for 2020.
Sum-of-the-parts valuation points to SEK 13-19 per shareBased on our SOTP valuation, we derive an equity value range for Qliro Group of SEK 13-19 per share.
Nordea Markets - AnalystsAlexandra BarganowskiAnalyst
Daniel OvinSenior Analyst
Ermin KericAnalyst
SUMMARY TABLE - KEY FIGURES
2021E2020E2019E2018201720162015SEKm3,1903,0983,0353,2263,3973,159n.a.Total revenue
3172451701990130EBITDA (adj)23015991-5221-610EBIT (adj)
7.2%5.1%3.0%-1.6%0.6%-1.9%n.a.EBIT (adj) margin0.770.460.110.02-0.15-1.25n.a.EPS (adj)
68.2%300.0%563.5%111.1%87.6%n.a.n.a.EPS (adj) growth0.000.000.000.000.000.000.00DPS (ord)0.20.20.30.2n.a.n.a.n.a.EV/Sales2.64.810.0n.m.n.a.n.a.n.a.EV/EBIT (adj)
14.724.899.1n.m.n.a.n.a.n.a.P/E (adj)1.21.41.61.4n.a.n.a.n.a.P/BV
0.0%0.0%0.0%0.0%n.a.n.a.n.a.Dividend yield (ord)12.7%8.9%5.5%8.3%n.a.n.a.n.a.FCF Yield bef acq & disp-1,122-938-806-717-558-4930Net debt
-3.5-3.8-4.7-37.5-6.2-37.3n.m.Net debt/EBITDA6.5%4.8%3.2%-2.4%1.3%-8.4%n.m.ROIC after tax
Source: Company data and Nordea estimates
Marketing material commissioned by Qliro Group
Qliro Group7 June 2019
Contents
Factors to consider when investing in Qliro Group 3
Company overview 14
E-commerce 24
Consumer Financial Services 43
Peer overview 55
Historical financials 63
Estimates 69
Detailed estimates: Quarterly 73
Detailed estimates: Annual 76
Valuation 79
Risks factors 84
Reported numbers and forecasts 85
Disclaimer and legal disclosures 88
Marketing material commissioned by Qliro Group 2
Qliro Group7 June 2019
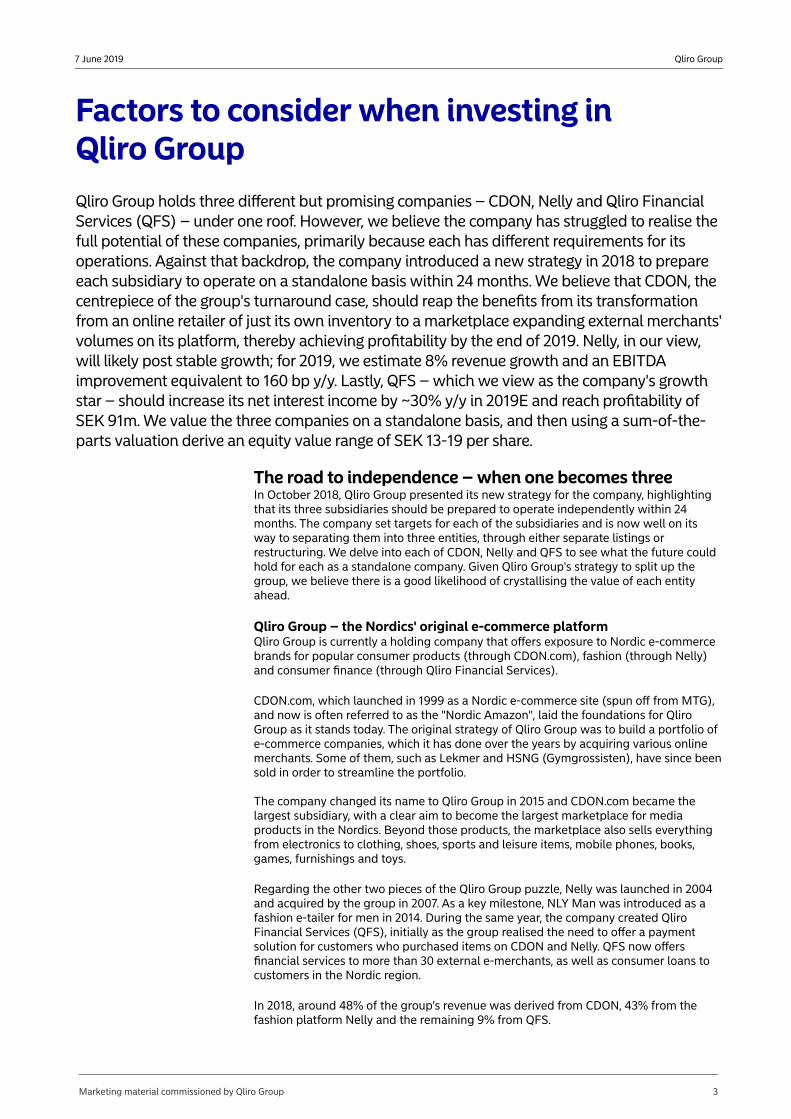
Factors to consider when investing in Qliro GroupQliro Group holds three different but promising companies – CDON, Nelly and Qliro Financial Services (QFS) – under one roof. However, we believe the company has struggled to realise the full potential of these companies, primarily because each has different requirements for its operations. Against that backdrop, the company introduced a new strategy in 2018 to prepare each subsidiary to operate on a standalone basis within 24 months. We believe that CDON, the centrepiece of the group's turnaround case, should reap the benefits from its transformation from an online retailer of just its own inventory to a marketplace expanding external merchants' volumes on its platform, thereby achieving profitability by the end of 2019. Nelly, in our view, will likely post stable growth; for 2019, we estimate 8% revenue growth and an EBITDA improvement equivalent to 160 bp y/y. Lastly, QFS – which we view as the company's growth star – should increase its net interest income by ~30% y/y in 2019E and reach profitability of SEK 91m. We value the three companies on a standalone basis, and then using a sum-of-the-parts valuation derive an equity value range of SEK 13-19 per share.
The road to independence – when one becomes threeIn October 2018, Qliro Group presented its new strategy for the company, highlighting that its three subsidiaries should be prepared to operate independently within 24 months. The company set targets for each of the subsidiaries and is now well on its way to separating them into three entities, through either separate listings or restructuring. We delve into each of CDON, Nelly and QFS to see what the future could hold for each as a standalone company. Given Qliro Group's strategy to split up the group, we believe there is a good likelihood of crystallising the value of each entity ahead.
Qliro Group – the Nordics' original e-commerce platformQliro Group is currently a holding company that offers exposure to Nordic e-commerce brands for popular consumer products (through CDON.com), fashion (through Nelly) and consumer finance (through Qliro Financial Services).
CDON.com, which launched in 1999 as a Nordic e-commerce site (spun off from MTG), and now is often referred to as the "Nordic Amazon", laid the foundations for Qliro Group as it stands today. The original strategy of Qliro Group was to build a portfolio of e-commerce companies, which it has done over the years by acquiring various online merchants. Some of them, such as Lekmer and HSNG (Gymgrossisten), have since been sold in order to streamline the portfolio.
The company changed its name to Qliro Group in 2015 and CDON.com became the largest subsidiary, with a clear aim to become the largest marketplace for media products in the Nordics. Beyond those products, the marketplace also sells everything from electronics to clothing, shoes, sports and leisure items, mobile phones, books, games, furnishings and toys.
Regarding the other two pieces of the Qliro Group puzzle, Nelly was launched in 2004 and acquired by the group in 2007. As a key milestone, NLY Man was introduced as a fashion e-tailer for men in 2014. During the same year, the company created Qliro Financial Services (QFS), initially as the group realised the need to offer a payment solution for customers who purchased items on CDON and Nelly. QFS now offers financial services to more than 30 external e-merchants, as well as consumer loans to customers in the Nordic region.
In 2018, around 48% of the group's revenue was derived from CDON, 43% from the fashion platform Nelly and the remaining 9% from QFS.
Marketing material commissioned by Qliro Group 3
Qliro Group7 June 2019
Qliro Group's revenue split into segments
DISTRIBUTION OF NET SALES BY SEGMENT IN 2018
CDON48%
Nelly43%
QFS9%
Source: Company data and Nordea estimates
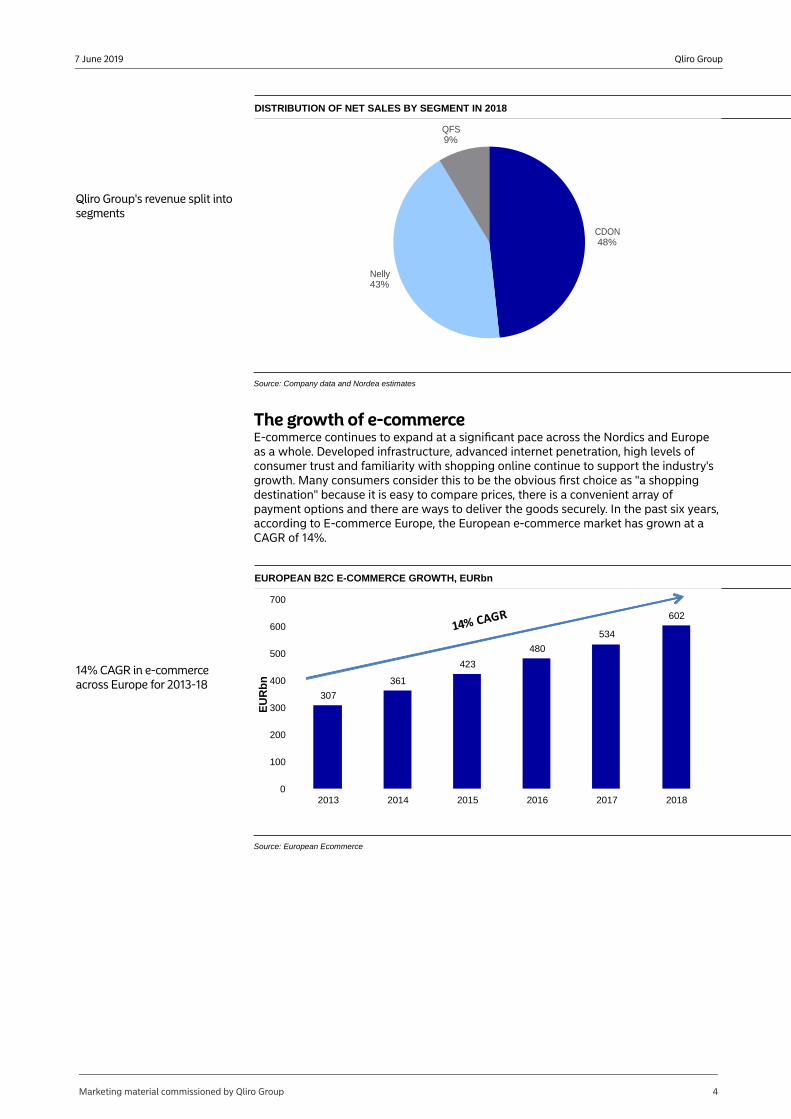
The growth of e-commerceE-commerce continues to expand at a significant pace across the Nordics and Europe as a whole. Developed infrastructure, advanced internet penetration, high levels of consumer trust and familiarity with shopping online continue to support the industry's growth. Many consumers consider this to be the obvious first choice as "a shopping destination" because it is easy to compare prices, there is a convenient array of payment options and there are ways to deliver the goods securely. In the past six years, according to E-commerce Europe, the European e-commerce market has grown at a CAGR of 14%.
14% CAGR in e-commerce across Europe for 2013-18
EUROPEAN B2C E-COMMERCE GROWTH, EURbn
307
361
423
480
534
602
0
100
200
300
400
500
600
700
2013 2014 2015 2016 2017 2018
EU
Rb
n
Source: European Ecommerce
Marketing material commissioned by Qliro Group 4
Qliro Group7 June 2019
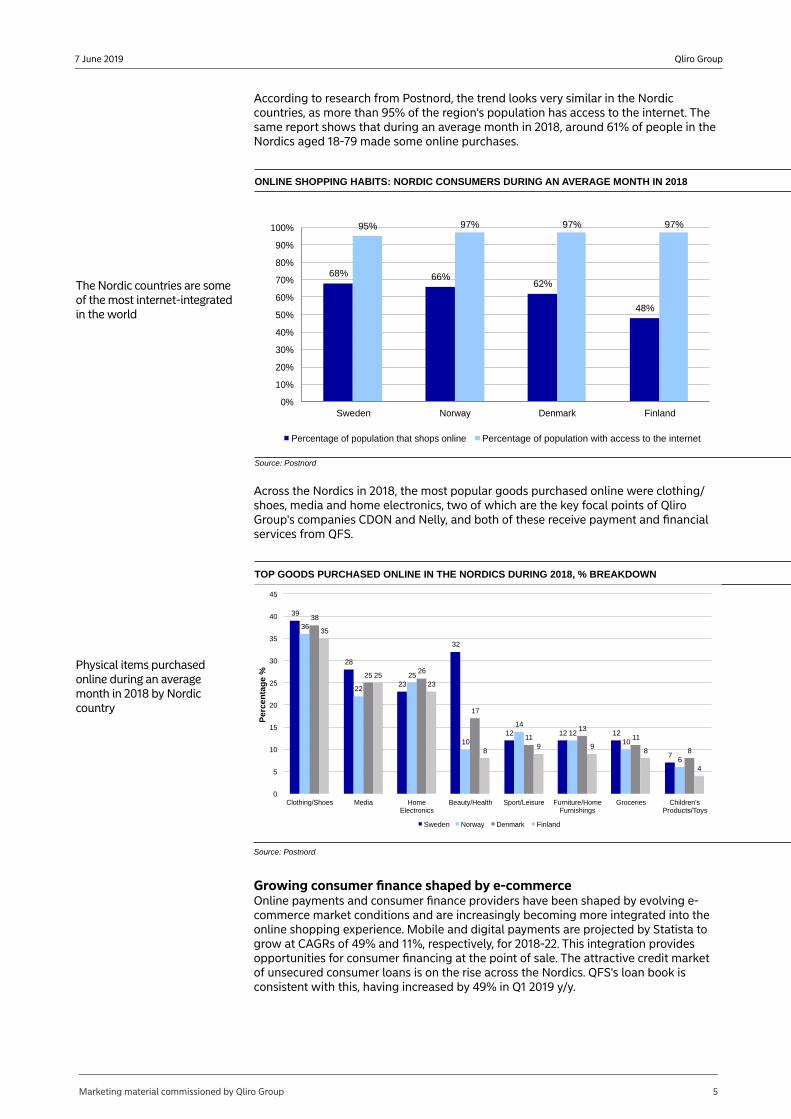
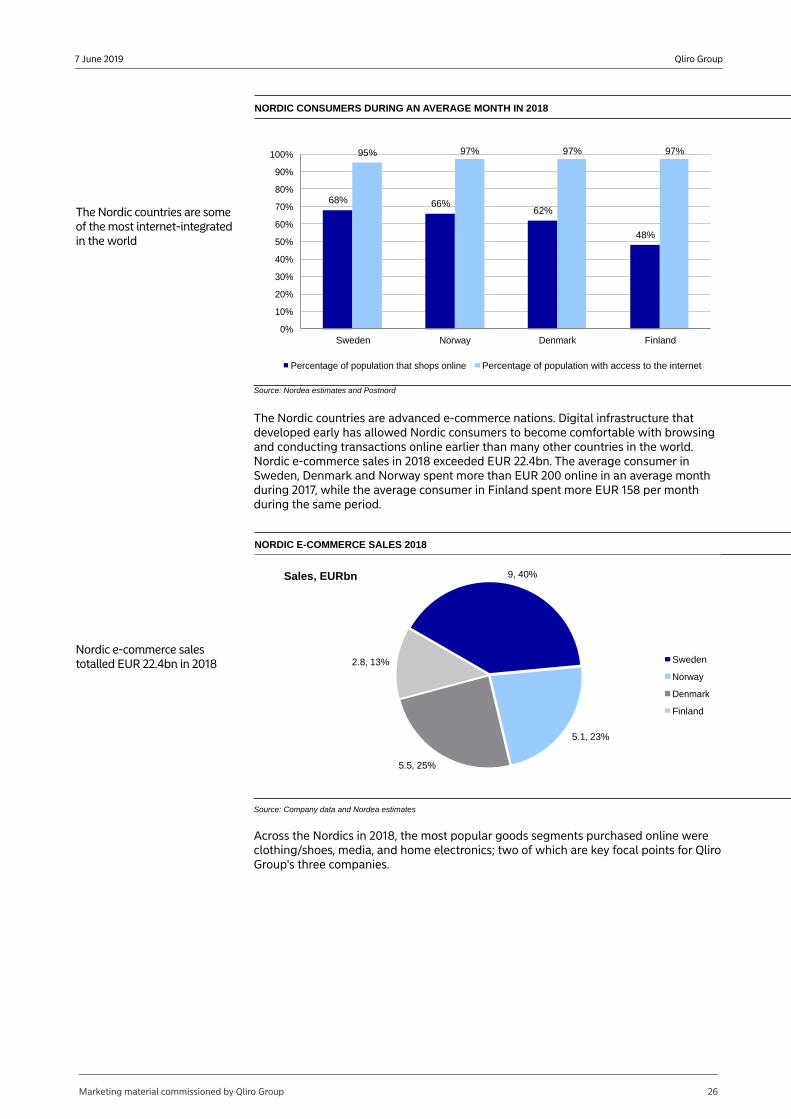
According to research from Postnord, the trend looks very similar in the Nordic countries, as more than 95% of the region's population has access to the internet. The same report shows that during an average month in 2018, around 61% of people in the Nordics aged 18-79 made some online purchases.
ONLINE SHOPPING HABITS: NORDIC CONSUMERS DURING AN AVERAGE MONTH IN 2018
The Nordic countries are some of the most internet-integrated in the world
68% 66%62%
48%
95% 97% 97% 97%
0%
10%
20%
30%
40%
50%
60%
70%
80%
90%
100%
Sweden Norway Denmark Finland
Percentage of population that shops online Percentage of population with access to the internet
Source: Postnord
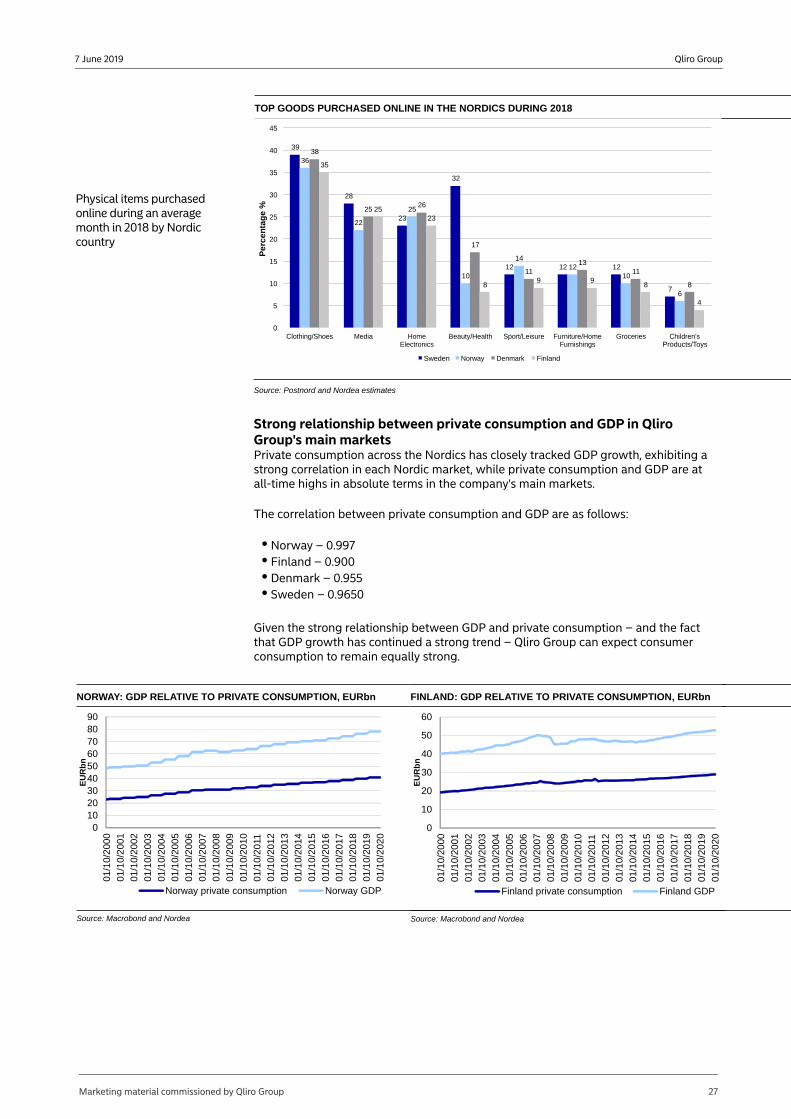
Across the Nordics in 2018, the most popular goods purchased online were clothing/shoes, media and home electronics, two of which are the key focal points of Qliro Group's companies CDON and Nelly, and both of these receive payment and financial services from QFS.
Physical items purchased online during an average month in 2018 by Nordic country
TOP GOODS PURCHASED ONLINE IN THE NORDICS DURING 2018, % BREAKDOWN
39
28
23
32
12 12 12
7
36
22
25
10
1412
10
6
38
2526
17
1113
11
8
35
2523
89 9
8
4
0
5
10
15
20
25
30
35
40
45
Clothing/Shoes Media HomeElectronics
Beauty/Health Sport/Leisure Furniture/HomeFurnishings
Groceries Children'sProducts/Toys
Pe
rce
nta
ge
%
Sweden Norway Denmark Finland
Source: Postnord
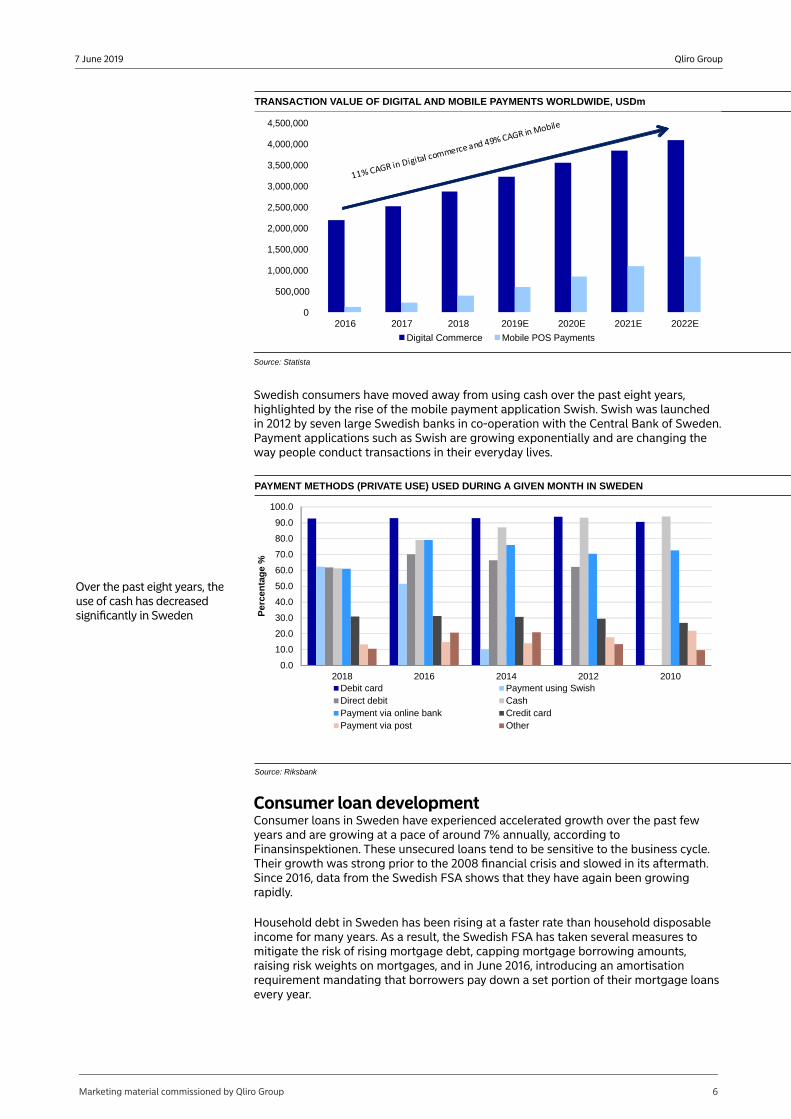
Growing consumer finance shaped by e-commerceOnline payments and consumer finance providers have been shaped by evolving e-commerce market conditions and are increasingly becoming more integrated into the online shopping experience. Mobile and digital payments are projected by Statista to grow at CAGRs of 49% and 11%, respectively, for 2018-22. This integration provides opportunities for consumer financing at the point of sale. The attractive credit market of unsecured consumer loans is on the rise across the Nordics. QFS's loan book is consistent with this, having increased by 49% in Q1 2019 y/y.
Marketing material commissioned by Qliro Group 5
Qliro Group7 June 2019
TRANSACTION VALUE OF DIGITAL AND MOBILE PAYMENTS WORLDWIDE, USDm
0
500,000
1,000,000
1,500,000
2,000,000
2,500,000
3,000,000
3,500,000
4,000,000
4,500,000
2016 2017 2018 2019E 2020E 2021E 2022E
Digital Commerce Mobile POS Payments
Source: Statista
Swedish consumers have moved away from using cash over the past eight years, highlighted by the rise of the mobile payment application Swish. Swish was launched in 2012 by seven large Swedish banks in co-operation with the Central Bank of Sweden. Payment applications such as Swish are growing exponentially and are changing the way people conduct transactions in their everyday lives.
PAYMENT METHODS (PRIVATE USE) USED DURING A GIVEN MONTH IN SWEDEN
Over the past eight years, the use of cash has decreased significantly in Sweden
0.0
10.0
20.0
30.0
40.0
50.0
60.0
70.0
80.0
90.0
100.0
2018 2016 2014 2012 2010
Per
cen
tag
e %
Debit card Payment using SwishDirect debit CashPayment via online bank Credit cardPayment via post Other
Source: Riksbank
Consumer loan developmentConsumer loans in Sweden have experienced accelerated growth over the past few years and are growing at a pace of around 7% annually, according to Finansinspektionen. These unsecured loans tend to be sensitive to the business cycle. Their growth was strong prior to the 2008 financial crisis and slowed in its aftermath. Since 2016, data from the Swedish FSA shows that they have again been growing rapidly.
Household debt in Sweden has been rising at a faster rate than household disposable income for many years. As a result, the Swedish FSA has taken several measures to mitigate the risk of rising mortgage debt, capping mortgage borrowing amounts, raising risk weights on mortgages, and in June 2016, introducing an amortisation requirement mandating that borrowers pay down a set portion of their mortgage loans every year.
Marketing material commissioned by Qliro Group 6
Qliro Group7 June 2019
These measures by the Swedish FSA help to ensure that if interest rates and unemployment were to rise, Swedish households' debt burdens would not cause household expenses to exceed budgets. Since 2016, after the FSA had implemented these new mortgage rules, consumer borrowing has increased at a significantly higher rate, tapering off at around a 7% annual growth rate as of January 2018. This does not automatically suggest causation, but the new regulations could definitely have something to do with the increased rates of consumer lending.
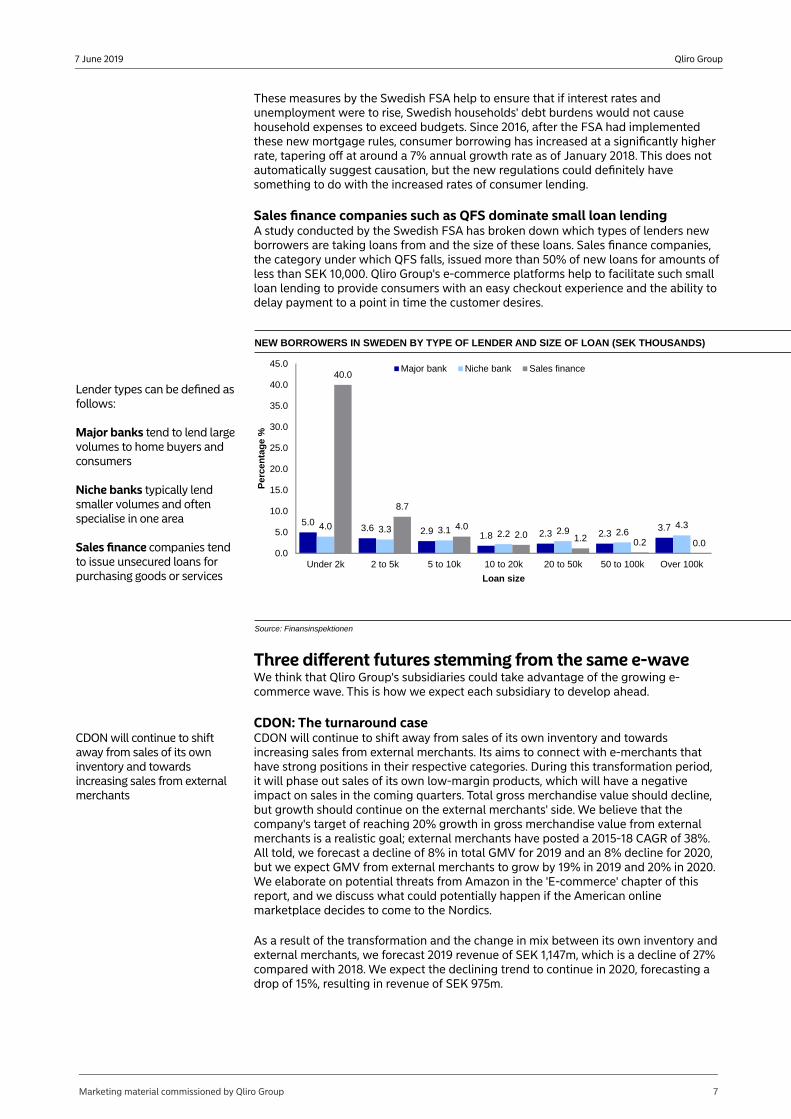
Sales finance companies such as QFS dominate small loan lendingA study conducted by the Swedish FSA has broken down which types of lenders new borrowers are taking loans from and the size of these loans. Sales finance companies, the category under which QFS falls, issued more than 50% of new loans for amounts of less than SEK 10,000. Qliro Group's e-commerce platforms help to facilitate such small loan lending to provide consumers with an easy checkout experience and the ability to delay payment to a point in time the customer desires.
NEW BORROWERS IN SWEDEN BY TYPE OF LENDER AND SIZE OF LOAN (SEK THOUSANDS)
Lender types can be defined as follows:
Major banks tend to lend large volumes to home buyers and consumers
Niche banks typically lend smaller volumes and often specialise in one area
Sales finance companies tend to issue unsecured loans for purchasing goods or services
5.03.6 2.9 1.8 2.3 2.3
3.74.0 3.3 3.1 2.2 2.9 2.64.3
40.0
8.7
4.02.0 1.2 0.2 0.0
0.0
5.0
10.0
15.0
20.0
25.0
30.0
35.0
40.0
45.0
Under 2k 2 to 5k 5 to 10k 10 to 20k 20 to 50k 50 to 100k Over 100k
Per
cen
tag
e %
Loan size
Major bank Niche bank Sales finance
Source: Finansinspektionen
Three different futures stemming from the same e-waveWe think that Qliro Group's subsidiaries could take advantage of the growing e-commerce wave. This is how we expect each subsidiary to develop ahead.
CDON: The turnaround caseCDON will continue to shift away from sales of its own inventory and towards increasing sales from external merchants
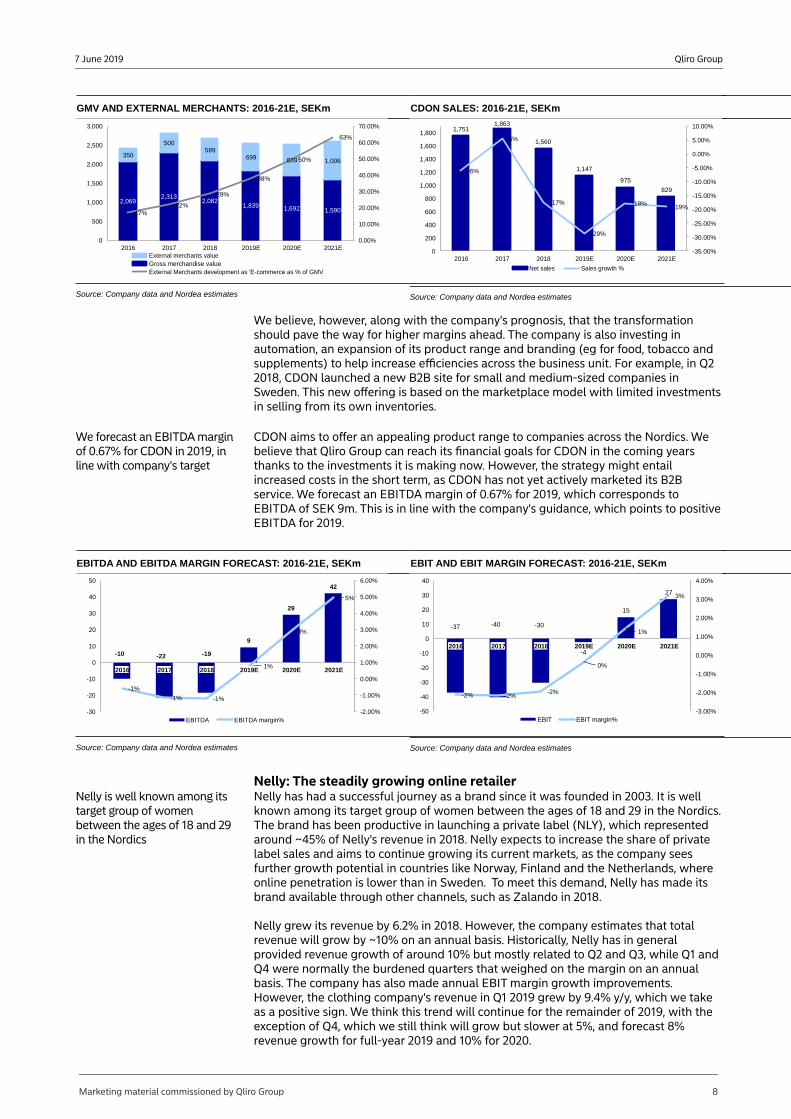
CDON will continue to shift away from sales of its own inventory and towards increasing sales from external merchants. Its aims to connect with e-merchants that have strong positions in their respective categories. During this transformation period, it will phase out sales of its own low-margin products, which will have a negative impact on sales in the coming quarters. Total gross merchandise value should decline, but growth should continue on the external merchants' side. We believe that the company's target of reaching 20% growth in gross merchandise value from external merchants is a realistic goal; external merchants have posted a 2015-18 CAGR of 38%. All told, we forecast a decline of 8% in total GMV for 2019 and an 8% decline for 2020, but we expect GMV from external merchants to grow by 19% in 2019 and 20% in 2020. We elaborate on potential threats from Amazon in the 'E-commerce' chapter of this report, and we discuss what could potentially happen if the American online marketplace decides to come to the Nordics.
As a result of the transformation and the change in mix between its own inventory and external merchants, we forecast 2019 revenue of SEK 1,147m, which is a decline of 27% compared with 2018. We expect the declining trend to continue in 2020, forecasting a drop of 15%, resulting in revenue of SEK 975m.
Marketing material commissioned by Qliro Group 7
Qliro Group7 June 2019
GMV AND EXTERNAL MERCHANTS: 2016-21E, SEKm
2,0692,313
2,0821,839 1,692 1,590
350
500589
699 839 1,006
17%22%
28%
38%
50%
63%
0.00%
10.00%
20.00%
30.00%
40.00%
50.00%
60.00%
70.00%
0
500
1,000
1,500
2,000
2,500
3,000
2016 2017 2018 2019E 2020E 2021EExternal merchants valueGross merchandise valueExternal Merchants development as 'E-commerce as % of GMV
Source: Company data and Nordea estimates
CDON SALES: 2016-21E, SEKm
1,7511,863
1,560
1,147
975
829
-6%
6%
-17%
-29%
-18% -19%
-35.00%
-30.00%
-25.00%
-20.00%
-15.00%
-10.00%
-5.00%
0.00%
5.00%
10.00%
0
200
400
600
800
1,000
1,200
1,400
1,600
1,800
2016 2017 2018 2019E 2020E 2021E
Net sales Sales growth %
Source: Company data and Nordea estimates
We believe, however, along with the company's prognosis, that the transformation should pave the way for higher margins ahead. The company is also investing in automation, an expansion of its product range and branding (eg for food, tobacco and supplements) to help increase efficiencies across the business unit. For example, in Q2 2018, CDON launched a new B2B site for small and medium-sized companies in Sweden. This new offering is based on the marketplace model with limited investments in selling from its own inventories.
We forecast an EBITDA margin of 0.67% for CDON in 2019, in line with company's target
CDON aims to offer an appealing product range to companies across the Nordics. We believe that Qliro Group can reach its financial goals for CDON in the coming years thanks to the investments it is making now. However, the strategy might entail increased costs in the short term, as CDON has not yet actively marketed its B2B service. We forecast an EBITDA margin of 0.67% for 2019, which corresponds to EBITDA of SEK 9m. This is in line with the company's guidance, which points to positive EBITDA for 2019.
EBITDA AND EBITDA MARGIN FORECAST: 2016-21E, SEKm
-10 -22 -19
9
29
42
-1%
-1% -1%
1%
3%
5%
-2.00%
-1.00%
0.00%
1.00%
2.00%
3.00%
4.00%
5.00%
6.00%
-30
-20
-10
0
10
20
30
40
50
2016 2017 2018 2019E 2020E 2021E
EBITDA EBITDA margin%
Source: Company data and Nordea estimates
EBIT AND EBIT MARGIN FORECAST: 2016-21E, SEKm
-37 -40 -30
-4
15
27
-2% -2%-2%
0%
1%
3%
-3.00%
-2.00%
-1.00%
0.00%
1.00%
2.00%
3.00%
4.00%
-50
-40
-30
-20
-10
0
10
20
30
40
2016 2017 2018 2019E 2020E 2021E
EBIT EBIT margin%
Source: Company data and Nordea estimates
Nelly: The steadily growing online retailerNelly is well known among its target group of women between the ages of 18 and 29 in the Nordics
Nelly has had a successful journey as a brand since it was founded in 2003. It is well known among its target group of women between the ages of 18 and 29 in the Nordics. The brand has been productive in launching a private label (NLY), which represented around ~45% of Nelly's revenue in 2018. Nelly expects to increase the share of private label sales and aims to continue growing its current markets, as the company sees further growth potential in countries like Norway, Finland and the Netherlands, where online penetration is lower than in Sweden. To meet this demand, Nelly has made its brand available through other channels, such as Zalando in 2018.
Nelly grew its revenue by 6.2% in 2018. However, the company estimates that total revenue will grow by ~10% on an annual basis. Historically, Nelly has in general provided revenue growth of around 10% but mostly related to Q2 and Q3, while Q1 and Q4 were normally the burdened quarters that weighed on the margin on an annual basis. The company has also made annual EBIT margin growth improvements. However, the clothing company's revenue in Q1 2019 grew by 9.4% y/y, which we take as a positive sign. We think this trend will continue for the remainder of 2019, with the exception of Q4, which we still think will grow but slower at 5%, and forecast 8% revenue growth for full-year 2019 and 10% for 2020.
Marketing material commissioned by Qliro Group 8
Qliro Group7 June 2019
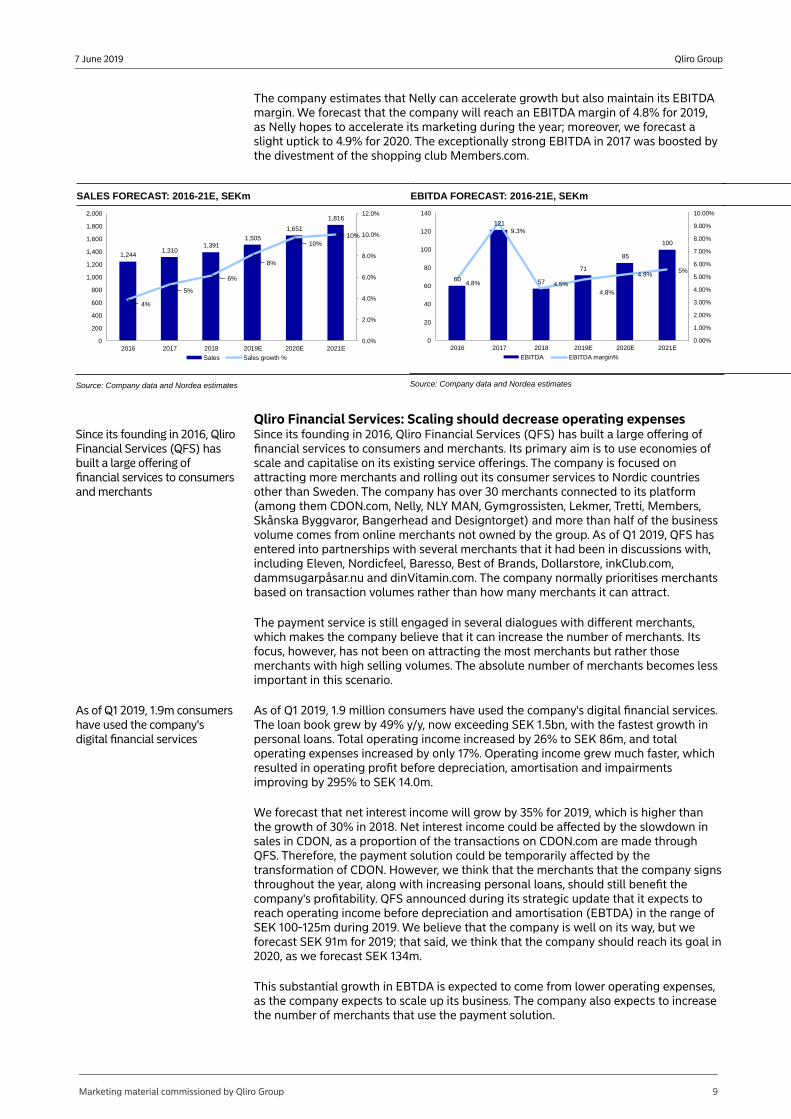
The company estimates that Nelly can accelerate growth but also maintain its EBITDA margin. We forecast that the company will reach an EBITDA margin of 4.8% for 2019, as Nelly hopes to accelerate its marketing during the year; moreover, we forecast a slight uptick to 4.9% for 2020. The exceptionally strong EBITDA in 2017 was boosted by the divestment of the shopping club Members.com.
SALES FORECAST: 2016-21E, SEKm
1,2441,310
1,3911,505
1,651
1,816
4%
5%
6%
8%
10%10%
0.0%
2.0%
4.0%
6.0%
8.0%
10.0%
12.0%
0
200
400
600
800
1,000
1,200
1,400
1,600
1,800
2,000
2016 2017 2018 2019E 2020E 2021E
Sales Sales growth %
Source: Company data and Nordea estimates
EBITDA FORECAST: 2016-21E, SEKm
60
121
57
71
85
100
4.8%
9.3%
4.5%4,8%
4.9%5%
0.00%
1.00%
2.00%
3.00%
4.00%
5.00%
6.00%
7.00%
8.00%
9.00%
10.00%
0
20
40
60
80
100
120
140
2016 2017 2018 2019E 2020E 2021E
EBITDA EBITDA margin%
Source: Company data and Nordea estimates
Qliro Financial Services: Scaling should decrease operating expensesSince its founding in 2016, Qliro Financial Services (QFS) has built a large offering of financial services to consumers and merchants
Since its founding in 2016, Qliro Financial Services (QFS) has built a large offering of financial services to consumers and merchants. Its primary aim is to use economies of scale and capitalise on its existing service offerings. The company is focused on attracting more merchants and rolling out its consumer services to Nordic countries other than Sweden. The company has over 30 merchants connected to its platform (among them CDON.com, Nelly, NLY MAN, Gymgrossisten, Lekmer, Tretti, Members, Skånska Byggvaror, Bangerhead and Designtorget) and more than half of the business volume comes from online merchants not owned by the group. As of Q1 2019, QFS has entered into partnerships with several merchants that it had been in discussions with, including Eleven, Nordicfeel, Baresso, Best of Brands, Dollarstore, inkClub.com, dammsugarpåsar.nu and dinVitamin.com. The company normally prioritises merchants based on transaction volumes rather than how many merchants it can attract.
The payment service is still engaged in several dialogues with different merchants, which makes the company believe that it can increase the number of merchants. Its focus, however, has not been on attracting the most merchants but rather those merchants with high selling volumes. The absolute number of merchants becomes less important in this scenario.
As of Q1 2019, 1.9m consumers have used the company's digital financial services
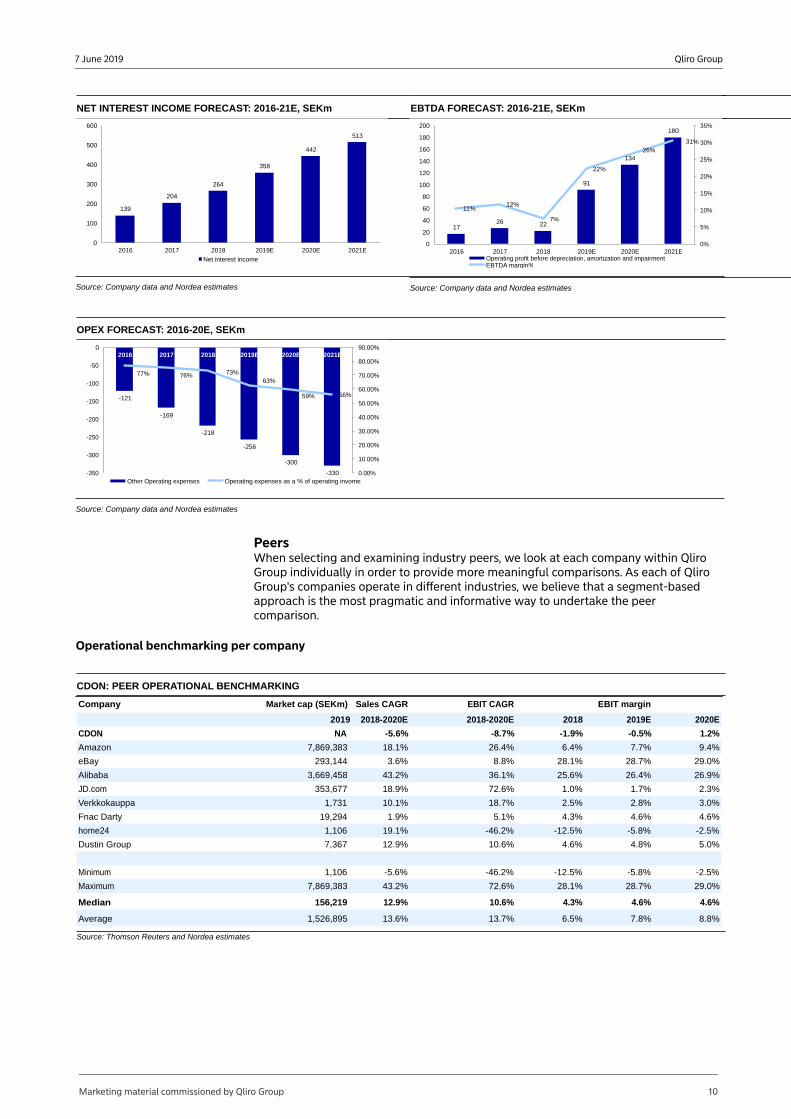
As of Q1 2019, 1.9 million consumers have used the company's digital financial services. The loan book grew by 49% y/y, now exceeding SEK 1.5bn, with the fastest growth in personal loans. Total operating income increased by 26% to SEK 86m, and total operating expenses increased by only 17%. Operating income grew much faster, which resulted in operating profit before depreciation, amortisation and impairments improving by 295% to SEK 14.0m.
We forecast that net interest income will grow by 35% for 2019, which is higher than the growth of 30% in 2018. Net interest income could be affected by the slowdown in sales in CDON, as a proportion of the transactions on CDON.com are made through QFS. Therefore, the payment solution could be temporarily affected by the transformation of CDON. However, we think that the merchants that the company signs throughout the year, along with increasing personal loans, should still benefit the company's profitability. QFS announced during its strategic update that it expects to reach operating income before depreciation and amortisation (EBTDA) in the range of SEK 100-125m during 2019. We believe that the company is well on its way, but we forecast SEK 91m for 2019; that said, we think that the company should reach its goal in 2020, as we forecast SEK 134m.
This substantial growth in EBTDA is expected to come from lower operating expenses, as the company expects to scale up its business. The company also expects to increase the number of merchants that use the payment solution.
Marketing material commissioned by Qliro Group 9
Qliro Group7 June 2019
NET INTEREST INCOME FORECAST: 2016-21E, SEKm
139
204
264
358
442
513
0
100
200
300
400
500
600
2016 2017 2018 2019E 2020E 2021E
Net interest income
Source: Company data and Nordea estimates
EBTDA FORECAST: 2016-21E, SEKm
1726 22
91
134
180
11%12%
7%
22%
26%31%
0%
5%
10%
15%
20%
25%
30%
35%
0
20
40
60
80
100
120
140
160
180
200
2016 2017 2018 2019E 2020E 2021EOperating profit before depreciation, amortization and impairmentEBTDA margin%
Source: Company data and Nordea estimates
OPEX FORECAST: 2016-20E, SEKm
-121
-169
-218
-256
-300
-330
77% 76% 73%63%
59% 56%
0.00%
10.00%
20.00%
30.00%
40.00%
50.00%
60.00%
70.00%
80.00%
90.00%
-350
-300
-250
-200
-150
-100
-50
02016 2017 2018 2019E 2020E 2021E
Other Operating expenses Operating expenses as a % of operating invome
Source: Company data and Nordea estimates
PeersWhen selecting and examining industry peers, we look at each company within Qliro Group individually in order to provide more meaningful comparisons. As each of Qliro Group's companies operate in different industries, we believe that a segment-based approach is the most pragmatic and informative way to undertake the peer comparison.
Operational benchmarking per company
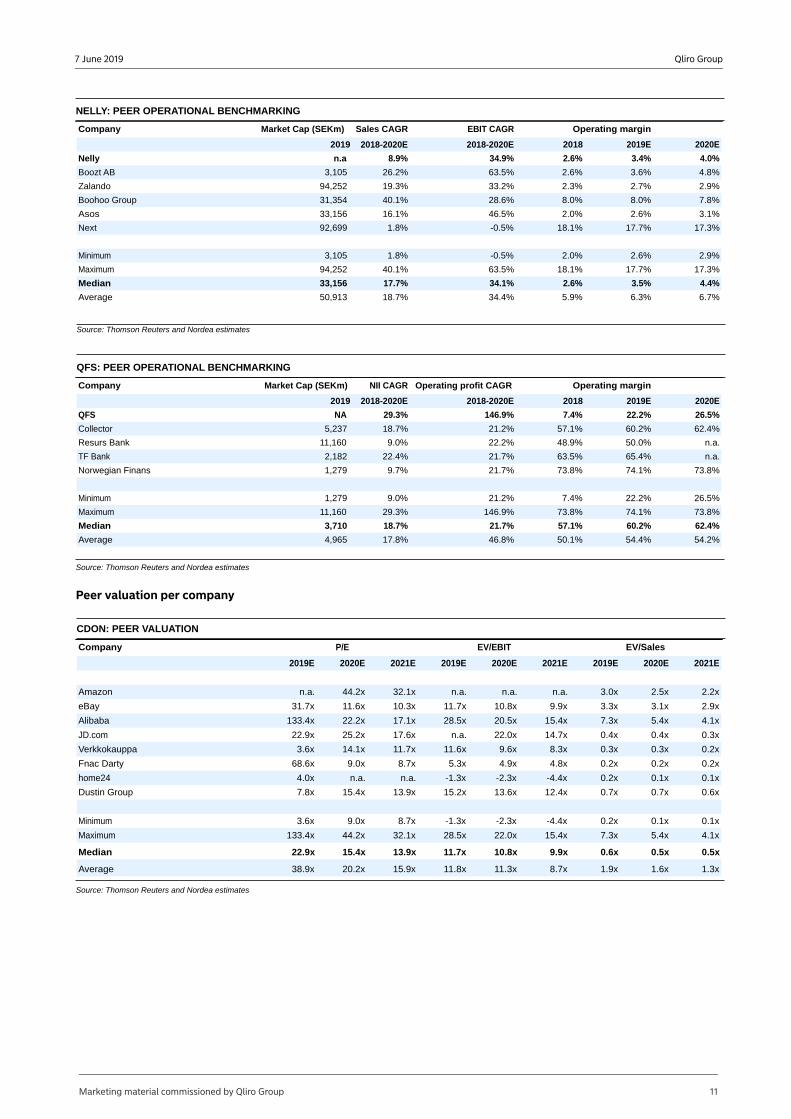
CDON: PEER OPERATIONAL BENCHMARKING
Company Market cap (SEKm) Sales CAGR EBIT CAGR EBIT margin
2019 2018-2020E 2018-2020E 2018 2019E 2020E
CDON NA -5.6% -8.7% -1.9% -0.5% 1.2%
Amazon 7,869,383 18.1% 26.4% 6.4% 7.7% 9.4%
eBay 293,144 3.6% 8.8% 28.1% 28.7% 29.0%
Alibaba 3,669,458 43.2% 36.1% 25.6% 26.4% 26.9%
JD.com 353,677 18.9% 72.6% 1.0% 1.7% 2.3%
Verkkokauppa 1,731 10.1% 18.7% 2.5% 2.8% 3.0%
Fnac Darty 19,294 1.9% 5.1% 4.3% 4.6% 4.6%
home24 1,106 19.1% -46.2% -12.5% -5.8% -2.5%
Dustin Group 7,367 12.9% 10.6% 4.6% 4.8% 5.0%
Minimum 1,106 -5.6% -46.2% -12.5% -5.8% -2.5%
Maximum 7,869,383 43.2% 72.6% 28.1% 28.7% 29.0%
Median 156,219 12.9% 10.6% 4.3% 4.6% 4.6%
Average 1,526,895 13.6% 13.7% 6.5% 7.8% 8.8%
Source: Thomson Reuters and Nordea estimates
Marketing material commissioned by Qliro Group 10
Qliro Group7 June 2019
NELLY: PEER OPERATIONAL BENCHMARKING
Company Market Cap (SEKm) Sales CAGR EBIT CAGR Operating margin
2019 2018-2020E 2018-2020E 2018 2019E 2020E
Nelly n.a 8.9% 34.9% 2.6% 3.4% 4.0%
Boozt AB 3,105 26.2% 63.5% 2.6% 3.6% 4.8%
Zalando 94,252 19.3% 33.2% 2.3% 2.7% 2.9%
Boohoo Group 31,354 40.1% 28.6% 8.0% 8.0% 7.8%
Asos 33,156 16.1% 46.5% 2.0% 2.6% 3.1%
Next 92,699 1.8% -0.5% 18.1% 17.7% 17.3%
Minimum 3,105 1.8% -0.5% 2.0% 2.6% 2.9%
Maximum 94,252 40.1% 63.5% 18.1% 17.7% 17.3%
Median 33,156 17.7% 34.1% 2.6% 3.5% 4.4%
Average 50,913 18.7% 34.4% 5.9% 6.3% 6.7%
Source: Thomson Reuters and Nordea estimates
QFS: PEER OPERATIONAL BENCHMARKING
Company Market Cap (SEKm) NII CAGR Operating profit CAGR Operating margin
2019 2018-2020E 2018-2020E 2018 2019E 2020E
QFS NA 29.3% 146.9% 7.4% 22.2% 26.5%
Collector 5,237 18.7% 21.2% 57.1% 60.2% 62.4%
Resurs Bank 11,160 9.0% 22.2% 48.9% 50.0% n.a.
TF Bank 2,182 22.4% 21.7% 63.5% 65.4% n.a.
Norwegian Finans 1,279 9.7% 21.7% 73.8% 74.1% 73.8%
Minimum 1,279 9.0% 21.2% 7.4% 22.2% 26.5%
Maximum 11,160 29.3% 146.9% 73.8% 74.1% 73.8%
Median 3,710 18.7% 21.7% 57.1% 60.2% 62.4%
Average 4,965 17.8% 46.8% 50.1% 54.4% 54.2%
Source: Thomson Reuters and Nordea estimates
Peer valuation per company
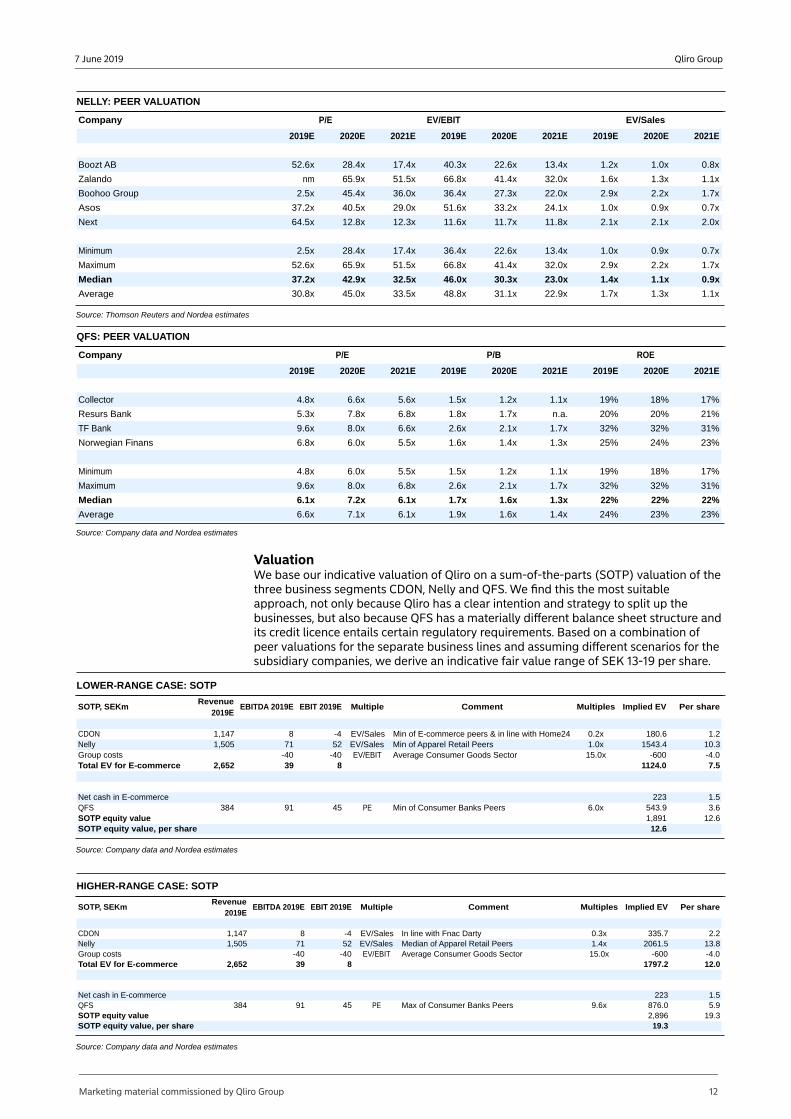
CDON: PEER VALUATION
Company P/E
2019E 2020E 2021E 2019E 2020E 2021E 2019E 2020E 2021E
Amazon n.a. 44.2x 32.1x n.a. n.a. n.a. 3.0x 2.5x 2.2x
eBay 31.7x 11.6x 10.3x 11.7x 10.8x 9.9x 3.3x 3.1x 2.9x
Alibaba 133.4x 22.2x 17.1x 28.5x 20.5x 15.4x 7.3x 5.4x 4.1x
JD.com 22.9x 25.2x 17.6x n.a. 22.0x 14.7x 0.4x 0.4x 0.3x
Verkkokauppa 3.6x 14.1x 11.7x 11.6x 9.6x 8.3x 0.3x 0.3x 0.2x
Fnac Darty 68.6x 9.0x 8.7x 5.3x 4.9x 4.8x 0.2x 0.2x 0.2x
home24 4.0x n.a. n.a. -1.3x -2.3x -4.4x 0.2x 0.1x 0.1x
Dustin Group 7.8x 15.4x 13.9x 15.2x 13.6x 12.4x 0.7x 0.7x 0.6x
Minimum 3.6x 9.0x 8.7x -1.3x -2.3x -4.4x 0.2x 0.1x 0.1x
Maximum 133.4x 44.2x 32.1x 28.5x 22.0x 15.4x 7.3x 5.4x 4.1x
Median 22.9x 15.4x 13.9x 11.7x 10.8x 9.9x 0.6x 0.5x 0.5x
Average 38.9x 20.2x 15.9x 11.8x 11.3x 8.7x 1.9x 1.6x 1.3x
EV/EBIT EV/Sales
Source: Thomson Reuters and Nordea estimates
Marketing material commissioned by Qliro Group 11
Qliro Group7 June 2019
NELLY: PEER VALUATION
Company P/E EV/EBIT EV/Sales
2019E 2020E 2021E 2019E 2020E 2021E 2019E 2020E 2021E
Boozt AB 52.6x 28.4x 17.4x 40.3x 22.6x 13.4x 1.2x 1.0x 0.8x
Zalando nm 65.9x 51.5x 66.8x 41.4x 32.0x 1.6x 1.3x 1.1x
Boohoo Group 2.5x 45.4x 36.0x 36.4x 27.3x 22.0x 2.9x 2.2x 1.7x
Asos 37.2x 40.5x 29.0x 51.6x 33.2x 24.1x 1.0x 0.9x 0.7x
Next 64.5x 12.8x 12.3x 11.6x 11.7x 11.8x 2.1x 2.1x 2.0x
Minimum 2.5x 28.4x 17.4x 36.4x 22.6x 13.4x 1.0x 0.9x 0.7x
Maximum 52.6x 65.9x 51.5x 66.8x 41.4x 32.0x 2.9x 2.2x 1.7x
Median 37.2x 42.9x 32.5x 46.0x 30.3x 23.0x 1.4x 1.1x 0.9x
Average 30.8x 45.0x 33.5x 48.8x 31.1x 22.9x 1.7x 1.3x 1.1x
Source: Thomson Reuters and Nordea estimates
QFS: PEER VALUATION
Company P/E P/B ROE
2019E 2020E 2021E 2019E 2020E 2021E 2019E 2020E 2021E
Collector 4.8x 6.6x 5.6x 1.5x 1.2x 1.1x 19% 18% 17%
Resurs Bank 5.3x 7.8x 6.8x 1.8x 1.7x n.a. 20% 20% 21%
TF Bank 9.6x 8.0x 6.6x 2.6x 2.1x 1.7x 32% 32% 31%
Norwegian Finans 6.8x 6.0x 5.5x 1.6x 1.4x 1.3x 25% 24% 23%
Minimum 4.8x 6.0x 5.5x 1.5x 1.2x 1.1x 19% 18% 17%
Maximum 9.6x 8.0x 6.8x 2.6x 2.1x 1.7x 32% 32% 31%
Median 6.1x 7.2x 6.1x 1.7x 1.6x 1.3x 22% 22% 22%
Average 6.6x 7.1x 6.1x 1.9x 1.6x 1.4x 24% 23% 23%
Source: Company data and Nordea estimates
ValuationWe base our indicative valuation of Qliro on a sum-of-the-parts (SOTP) valuation of the three business segments CDON, Nelly and QFS. We find this the most suitable approach, not only because Qliro has a clear intention and strategy to split up the businesses, but also because QFS has a materially different balance sheet structure and its credit licence entails certain regulatory requirements. Based on a combination of peer valuations for the separate business lines and assuming different scenarios for the subsidiary companies, we derive an indicative fair value range of SEK 13-19 per share.
LOWER-RANGE CASE: SOTP
SOTP, SEKmRevenue
2019EEBITDA 2019E EBIT 2019E Multiple Comment Multiples Implied EV Per share
CDON 1,147 8 -4 EV/Sales Min of E-commerce peers & in line with Home24 0.2x 180.6 1.2Nelly 1,505 71 52 EV/Sales Min of Apparel Retail Peers 1.0x 1543.4 10.3Group costs -40 -40 EV/EBIT Average Consumer Goods Sector 15.0x -600 -4.0Total EV for E-commerce 2,652 39 8 1124.0 7.5
Net cash in E-commerce 223 1.5QFS 384 91 45 PE Min of Consumer Banks Peers 6.0x 543.9 3.6SOTP equity value 1,891 12.6SOTP equity value, per share 12.6
Source: Company data and Nordea estimates
HIGHER-RANGE CASE: SOTP
SOTP, SEKmRevenue
2019EEBITDA 2019E EBIT 2019E Multiple Comment Multiples Implied EV Per share
CDON 1,147 8 -4 EV/Sales In line with Fnac Darty 0.3x 335.7 2.2Nelly 1,505 71 52 EV/Sales Median of Apparel Retail Peers 1.4x 2061.5 13.8Group costs -40 -40 EV/EBIT Average Consumer Goods Sector 15.0x -600 -4.0Total EV for E-commerce 2,652 39 8 1797.2 12.0
Net cash in E-commerce 223 1.5QFS 384 91 45 PE Max of Consumer Banks Peers 9.6x 876.0 5.9SOTP equity value 2,896 19.3SOTP equity value, per share 19.3
Source: Company data and Nordea estimates
Marketing material commissioned by Qliro Group 12
Qliro Group7 June 2019
RisksWe outline various risks that Qliro Group may face that could impact its future financial performance. We look at each company in the group individually, as Qliro Group's companies operate in different industries, each with their own specific risks.
CDON
The competitive landscape could become fiercer with the entry of new participants such as Amazon.The structural growth in e-commerce could prove more temporary than currently expected by the market. Inventory levels might become elevated if consumer preferences and demand shift, making the products less attractive.Investments in improving logistics might be required to keep up with consumer demand and preferences.
Nelly
New collections could be poorly received by consumers, leading to markdowns and inflated inventory levels.Salary inflation could put pressure on COGS and gross margins as products are sourced from low-wage countries.Increased competition could lead to pressured gross margins.Failure to attract and detect upcoming influencers in social media could hurt Nelly's ability to reach new generations of its target group.
QFS
The majority of volumes processed by QFS are still generated from group internal merchants. On a standalone basis, QFS could face challenges growing.Pricing power is low in the checkout process, as competition is high, while the product is quite standardised.New regulation on consumer finance could limit QFS's growth if it constrains access to credit.Capital adequacy requirements could rise as a result of regulatory decisions.
Marketing material commissioned by Qliro Group 13
Qliro Group7 June 2019
Company overviewFounded in 1999 as CDON Group, the company changed its name to Qliro Group in 2015. Qliro Group now operates an e-commerce platform primarily within Sweden, Denmark, Norway and Finland through three business segments: CDON Marketplace, Nelly and Qliro Financial Services. The company has recently narrowed its strategic focus and sold off its less fruitful business units. Qliro aims to make all three companies independent: CDON.COM aims to become the leading Nordic online marketplace, Nelly plans to strengthen its online fashion niche and Qliro Financial Services will further develop its financial services offering.
Qliro GroupQliro Group's renewed strategy focuses on its three pillar companies: Qliro Financial Services, Nelly and CDON.com
Qliro Group, the group that holds the marketplace CDON.COM, the online clothing company Nelly and the payment solution company Qliro Financial Services, is headquartered in Stockholm, Sweden and also holds offices in Malmö and Borås. The company employs a total of 691 people across all of its business areas and around the country. In 2018, the group posted SEK 3.2bn in net sales, received SEK 6.3m in orders, generated 212 million site visits, and served approximately three million customers across the Nordic region.
Company historyCDON.com, which was launched in 1999 as a Nordic e-commerce site, laid the foundations for the Qliro Group as it is today. A portfolio of companies was built by acquiring various online merchants. In 2004, Nelly was launched and then subsequently acquired by the group in 2007. NLY Man was introduced as a fashion e-tailer for men in 2014. During the same year, the company also created Qliro Financial Services (QFS), which now offers financial services to e-merchants and consumers throughout the Nordic region. In 2015, the firm changed its name from CDON Group to the Qliro Group. In January 2017, a new strategy focusing on Qliro Financial Services, Nelly and CDON Marketplace was introduced. Following this strategic change, Lekmer, Members.com, and Health and Sports Nutrition Group were all sold. In 2018 the company decided that the three remaining companies (QFS, Nelly and CDON) should be led separately and the plan is for them to be operationally independent by the second half of 2019.
QLIRO GROUP: KEY HISTORICAL EVENTS
Year Event
1999 CDON.COM was launched
2004 Nelly was launched
2007 Nelly was acquired by group
2010 CDON Group demerged from MTG and distributed via stock dividend to shareholders
2010 CDON Group listed on the Stockholm Stock Exchange
2013 New share issue
2013 External merchants are able to sell goods on CDON.COM
2014 New share issue
2014 Qliro Financial Services was established
2014 NLY Man was introduced
2015 Firm changes name from CDON Group to Qliro Group
2017 Three year senior unsecured bond issue takes place
2017 Qliro Financial Services became a credit market company under the supervision of the Swedish FSA
2017 Savings accounts and personal loans were launched in Sweden
2017 Full payment service launched in Norway
2018 New group strategy which focuses on separating QFS, Nelly and CDON into independent companies
Source: Company data and Nordea estimates
Marketing material commissioned by Qliro Group 14
Qliro Group7 June 2019
Corporate structureThe graph below illustrates Qliro Group's overall structure with the three main subsidiaries – Nelly (NLY Scandinavia AB), CDON.com (CDON AB) and Qliro Financial Services (QLIRO AB) – and Qliro Group Shared Services AB. The graph does not show the detailed organisational structure of the company, which also includes local subsidiaries.
Source: Company data and Nordea
Geography of operationsQliro Group operates primarily within the Nordics with a small portion of sales coming from other countries. Sweden is its main market, but it has made headway in Norway over the past year. Sales are recognised by country of sale, meaning the country in which the recipient is located.
GEOGRAPHICAL DISTRIBUTION OF NET SALES 2018
Split between Sweden, the rest of Nordics and rest of the World.
Sweden55%
Other Nordics40%
Rest of the World5%
Source: Company data and Nordea
Marketing material commissioned by Qliro Group 15
Qliro Group7 June 2019
The majority of sales still come from products, but services have increased vastly in the last two years, growing by 11% between 2017 and 2018. Products, on the other hand, decreased by 7% during the same period.
SALES PER TYPE OF INCOME, SEKm
2877.9 2996.7 2,780.6
280.6400.0
445.3
0
500
1,000
1,500
2,000
2,500
3,000
3,500
4,000
2016 2017 2018
SE
Km
Products Services
Source: Company data and Nordea
Potential changes ahead – the road to independenceA listing or sale of each of the companies along with structural transactions are a possibility, we believe
In June 2018, the group announced that it has a new strategic plan for the company and that it had decided to run Qliro Financial Services, CDON Marketplace and Nelly as three fully independent companies. The group has begun evaluating a listing or sale as well as potential structural transactions for all three companies. However, no definite outcome has materialised yet. The company expects the implementation of the strategy to be fully executed within the next 24 months at the latest.
CDON marketplace
Source: Company data
CDON.COM was launched in 1999 and is a Nordic online department store with over 1.8 million customers. Initially selling media products, the company has broadened its offering significantly and currently sells everything from electronics to clothing, shoes, sport and leisure items, mobile phones, books, games, furnishings and toys. It aims to provide good service and low prices on goods offered across the Nordics. CDON can be viewed as the 'local Amazon' for the Nordic region. CDON's strategy is to be the leading Nordic online marketplace, to expand the range of its product through external merchants, and to continuously strengthen and develop its brand.
Business modelCDON generates revenue from both sales of its own inventories and commissions from third-party e-merchants using its marketplace
CDON brands itself as the largest retailing warehouse in the Nordics. Its business model is based on two forms of revenue. Firstly, the company purchases products for its own inventories to be sold to consumers. These products are purchased mainly from well-known suppliers and recognisable brands. Secondly, the company allows external merchants to use its marketplace to sell merchandise and in turn the merchants pay commission based on their sales on CDON.COM.
Financial targets and road to 20% growth in gross merchandise valueManagement aims to grow the external gross merchandise value at a rate of above 20% per year and to achieve an EBITDA margin of above 3% of net sales per year
CDON Marketplace’s financial target is to achieve growth in external merchants’ gross merchandise value of over 20% per year and EBITDA of over 3% of net sales per year. The company estimates that the EBITDA will be positive for full-year 2019. CDON's GMV value grew by 18% between 2017 and 2018. The segment reported net sales of SEK 1,560m and an EBITDA of SEK -18m, which corresponds to a margin of -1.2%.
In 2018, Qliro Group adjusted its long-term targets for CDON to grow the external gross merchandise value above 20% per year and to achieve an EBITDA margin of above 3% of net sales per year. This adjustment is congruent with management's aim to phase out low-margin sales from its own inventory and scale up the offering from external merchants through drop shipments, utilising CDON's platform without maintaining their own inventory.
Marketing material commissioned by Qliro Group 16
Qliro Group7 June 2019
The company does not intend to eliminate its own inventory entirely, however, as some product categories are more profitable for the company to keep in stock, eg CD-ROM based entertainment or game consoles. While the CD-ROM based entertainment (films, games and music) market is decreasing at about 20-30% a year – largely being replaced by digital/streaming options – it is still a profitable business for the company. It is also a segment that is in consolidation mode, as most players are independent boutiques with low bargaining power. For CDON, this segment is decreasing by 10-15% per year but the company sees potential from having the largest assortment, as the number of distributors in the market is decreasing.
NellyNelly and NLY Man offer proprietary clothing lines along with selected external brands to supplement their offerings
Nelly offers fashion and beauty products for young women through Nelly.com and for men through NLY Man. The company offers its own brand, NLY, along with more than 200 other brands in its online store. It has strong brand recognition in the Nordics and leverages social media to target its main customer segment, 16-26 year old women.
Business model
Source: Company data
Nelly's business model relies on a core base of its own labels and designs, supplemented by a range of ~200 external brands. The clothing and accessories are purchased from manufacturers in China, the UK, Turkey and other countries, then sold primarily in the Nordics. Nelly's largest markets are Sweden and Norway, but outside the Nordics it is currently experiencing the fastest growth in the Netherlands. In 2018, Nelly's own brands accounted for 45% of sales, which was up from 43% in 2017. The inventory of products is transported and stored at the company's logistics centre in Falkenberg, Sweden, where the items are digitally marketed and subsequently sold at Nelly.com and NLYman.com
Management's financial targets and future focusManagement targets an organic annual growth rate of 10% and an EBITDA margin of at least 6%
Management's long-term target for Nelly is to achieve an organic growth rate of 10% per year for net sales. This target was increased from 8% as Nelly has a strong market position and so far successful growth strategy. Management aims to further strengthen the company's own brands and solidify its position through digital marketing and sales. It believes investments in brands, variety and logistics have created the right conditions for profitable growth. During 2018 the company reached sales growth of 6%, which amounted to sales of SEK 1,391m and EBITDA of SEK 56,8m, corresponding to a margin of 3%.
Qliro Financial Services (QFS)Loan book of SEK 1.5bn and ~5.1 million orders processed in 2018
Source: Company data
QFS provides financial services to merchants and consumers. The company leverages its e-commerce marketplace to offer credit and financing to its consumers but with time the company has also started to offer its services to external merchants. Consumers are offered several services, primarily safe payment options along with savings and borrowing opportunities. Merchants are offered a checkout solution with the most common forms of payment such as credit card, direct debit from Nordic banks, partial payment and invoices. QFS consists of the subsidiary Qliro AB, which became a credit market company under the supervision of the Swedish Financial Supervisory Authority in March 2017. QFS posted SEK 298m in operating income for 2018, increased its loan book by 45% to SEK 1.5bn, and processed ~5.1 million orders.
Business modelQFS's business model is based on offering a payment solution to e-merchants and benefiting from their transactions. Some of these transactions lead to partial and instalment payments, which add to a loan book that generates interest income for the company. Since the company's inception, more than 11.4 million transactions have been executed and SEK 10bn has been lent. The loan book is the main driver of revenue and profit. Credit from the partial and instalment payments can generate revenue for up to three years. This interest income earned is shared with the e-merchants.
Marketing material commissioned by Qliro Group 17
Qliro Group7 June 2019
QFS earns interest income on its loan book made up of primarily credit from partial and instalment payments
The company benefits from e-merchant volumes and has low customer acquisition costs due to the integrated nature of the online purchases and the offering of financing to the consumer. External merchants account for more than 40% of e-commerce volumes, with the remaining portion of 60% coming from CDON and Nelly in equal parts. In addition to payment credit, the company offers longer-term personal loans and savings accounts to consumers in the Swedish market. The company conducts data-driven credit testing when evaluating customers' creditworthiness and their potential to repay.
The company has largely launched its personal loan offering by targeting existing customers through its own channels, primarily via its mobile app, website and targeted email campaigns towards customers with which it already has a relationship. Over 95% of personal loan borrowers have had a previous relationship with QFS. The company conducts the credit scoring in an automated way, building on both internal and external data that is analysed in real time.
Management's financial targets and future focusManagement aims to achieve EBITDA of SEK 100-125m in 2019
In 2018, management set a new target for QFS – to achieve operating income before depreciation, amortisation and impairments of SEK 100-125m in 2019 (from previously higher target of SEK 150m). This target reduction is largely based on the management's belief that volumes will be negatively affected by the CDON Marketplace's transition, where it is phasing out sales from its own inventories and boosting sales from external merchants. QFS's operating income before depreciation, amortisation and impairments in 2018 amounted to SEK -15.4m.
QFS seeks to further develop products to broaden and strengthen its offering to consumers and e-merchants. For example, savings accounts and personal loans are currently only offered in Sweden, but management is entertaining rolling out this offering to all Nordic countries. Given the current product offering, the company believes it is large enough to handle considerable growth in the loan book without having to significantly increase its number of employees, which could create some economies of scale.
Marketing material commissioned by Qliro Group 18
Qliro Group7 June 2019
Executive managementThe structure of Qliro Group’s management was changed in 2018 following the company's new strategy to separate the three companies. For this to be achieved Qliro Group has appointed a CEO for each respective company. During 2018, Anna Ullman Sersé was appointed head of Nelly, and Carolina Brandtman was appointed head of Qliro Financial Services. Most recently, Kristoffer Väliharju was appointed CEO of CDON. The current team in place has significant experience in the e-commerce and financial services space.
Source: Company data
CEO and President: Marcus Lindqvist
Qliro Group experience: Took over as president and CEO in August 2016Born: 1970Background: Most recently, head of B2B Sweden & Products at Dustin. Formerly held senior management positions at Hewlett Packard and Dell in the Nordics.Education: Associate degree from FEI in StockholmEquity stake: 466,979 shares
Source: Company data
CFO: Mathias Pedersen
Qliro Group experience: Appointed CFO of Qliro Group in August 2016Born: 1971Background: Most recently, investment director at Kinnevik AB. Formerly held CFO positions at East Capital Group, East Capital Explorer and ETAC.Education: Holds a Master’s degree from the Stockholm School of Economics and completed the Program for Management Development at Harvard Business School.Equity stake: 240,000 shares
Source: Company data
CEO of CDON: Kristoffer Väliharju
Qliro Group experience: Appointed head of CDON in September 2018. Formerly COO and member of the CDON executive team.Born: 1975Background: Has previous leadership experience at Dustin as a sales manager and at Dell as a sales distribution manager in the Nordic region.Equity stake: 12,240 shares
Source: Company data
CEO of Qliro Financial Services: Carolina Brandtman
Qliro Group experience: Joined as CEO of Qliro Financial Services in December 2018.Born: 1975Background: Most recently, managing director at Santander Consumer Bank after it acquired GE Money, where she held various positions, the last one as chief risk officer.Education: Degree from University of Örebro and Central Queensland UniversityEquity stake: 11,415 shares
Source: Company data
CEO of Nelly: Anna Ullman Sersé
Qliro Group experience: Joined the group as head of business development in December 2016 and was appointed interim head of Nelly in April 2018Born: 1973Background: Most recently, Nordic lead for retail and marketing & content at Accenture InteractiveEducation: MSc in Law and Business Administration from Stockholm UniversityEquity stake: 34,944 shares
Marketing material commissioned by Qliro Group 19
Qliro Group7 June 2019
Board of directorsQliro Group’s board of directors consists of six members, all of whom are independent of the company and executive management. Four of the six board members are not independent of major shareholders, as they have connections to Rite Ventures and Kinnevik, the group’s two largest shareholders. Board elections took place in May 2018, which introduced board members Lennart Jacobsen and Andreas Bernström. Existing board member Christoffer Häggblom was elected chairman of the board. It is also worth noting that the chairman, Christoffer Häggblom, and board member Andreas Bernström both act as board members for companies that are in competition with Qliro Group like Verkkokauppa.com and Trustly, respectively.
Source: Company image
Chairman of the board: Christoffer Häggblom
Qliro Group affiliation: Mr Häggblom has been a member of the board of Qliro Group since May 2017 and has been chairman of the board since May 2018Born: 1981Background: Founder and managing partner of Rite Ventures and has 20 years of experience with technology growth companies. He currently serves as the chairman of the board of Verkkokauppa.com and is a member of the board at Lemonsoft and Acervo.Education: MSc in Finance from the Hanken School of Economics in HelsinkiIndependence: Independent of the company and executive management, but not independent of major shareholdersEquity stake (Rite Ventures): 10,321,494 shares
Source: Company image
Non-executive director: Lennart Jacobsen
Qliro Group affiliation: Mr Jacobsen has been a member of the board of Qliro Group since May 2018Born: 1966Background: Senior advisor, primarily within the banking industry across Europe. Previously, EVP head of retail banking at Nordea and worked at GE Capital, eventually ending his tenure as CEO of GE Money Bank Nordics. Education: MSc in Electrical Engineering and Telecommunications from KTH Royal Institute of TechnologyIndependence: Independent of the company and executive management and independent of major shareholdersEquity stake: 40,000 shares
Source: Company image
Non-executive director: Andreas Bernström
Qliro Group affiliation: Mr Bernström has been a member of the board since May 2018 Born: 1974Background: Currently investment director at Kinnevik and chairman of the board of Trustly (a fast-growing European fintech). Previously an industrial advisor to EQT on digital and TMT issues, CEO of Rebtel, managing director at TradeDoubler and then later COO. Founded and launched Sinch, a communications platform for iOS and Android developers which was later sold.Education: BA in Economics and French from Manchester University, MA in Finance from Webster UniversityIndependence: Independent of the company and executive management, but not independent of major shareholdersEquity stake: 0 shares
Source: Company image
Non-executive director: Erika Söderberg Johnson
Qliro Group affiliation: Ms Söderberg Johnson has been a member of the board since May 2017. She is the chairwoman of the audit committee.Born: 1970Background: CFO of Biotage. Previously served as CFO for Karo Bio, Affibody and Global Genomics. Also has experience in investment banking at SEB and is also a board member of Saab AB.Education: MSc in Economics from the Stockholm School of EconomicsIndependence: Independent of the company and executive management and independent of major shareholdersEquity stake: 1,300 shares
Marketing material commissioned by Qliro Group 20
Qliro Group7 June 2019
Source: Company image
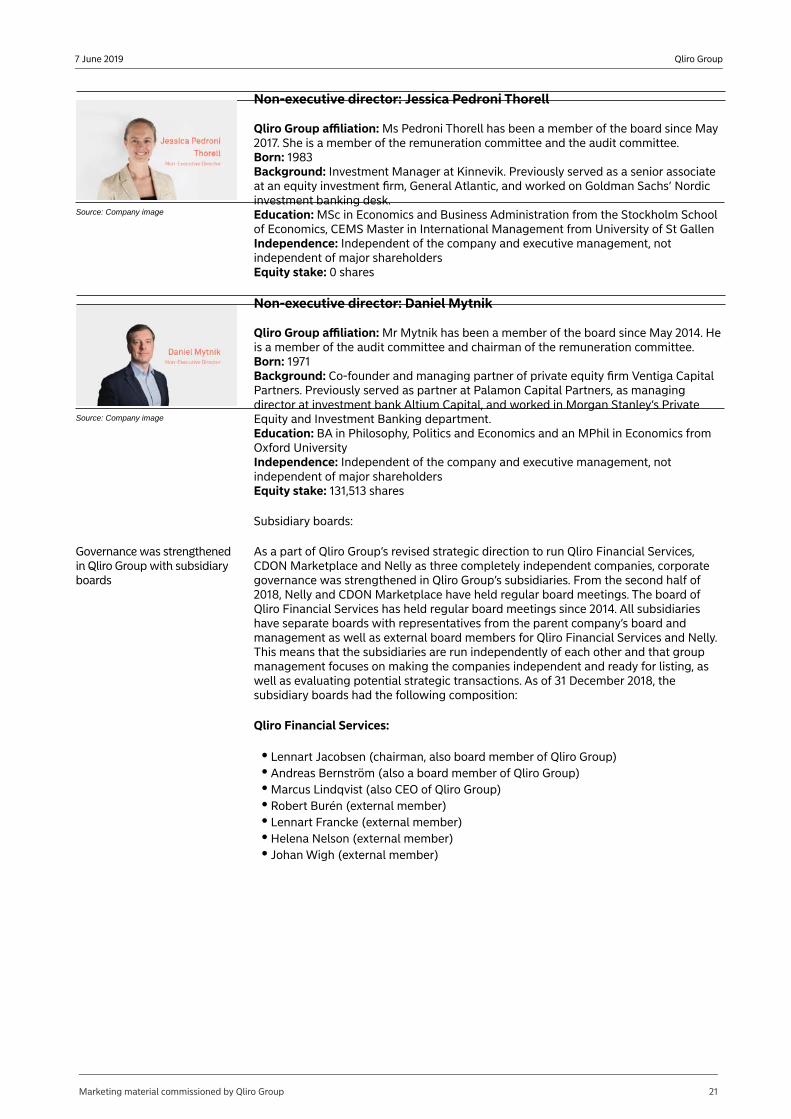
Non-executive director: Jessica Pedroni Thorell
Qliro Group affiliation: Ms Pedroni Thorell has been a member of the board since May 2017. She is a member of the remuneration committee and the audit committee.Born: 1983Background: Investment Manager at Kinnevik. Previously served as a senior associate at an equity investment firm, General Atlantic, and worked on Goldman Sachs’ Nordic investment banking desk.Education: MSc in Economics and Business Administration from the Stockholm School of Economics, CEMS Master in International Management from University of St GallenIndependence: Independent of the company and executive management, not independent of major shareholdersEquity stake: 0 shares
Source: Company image
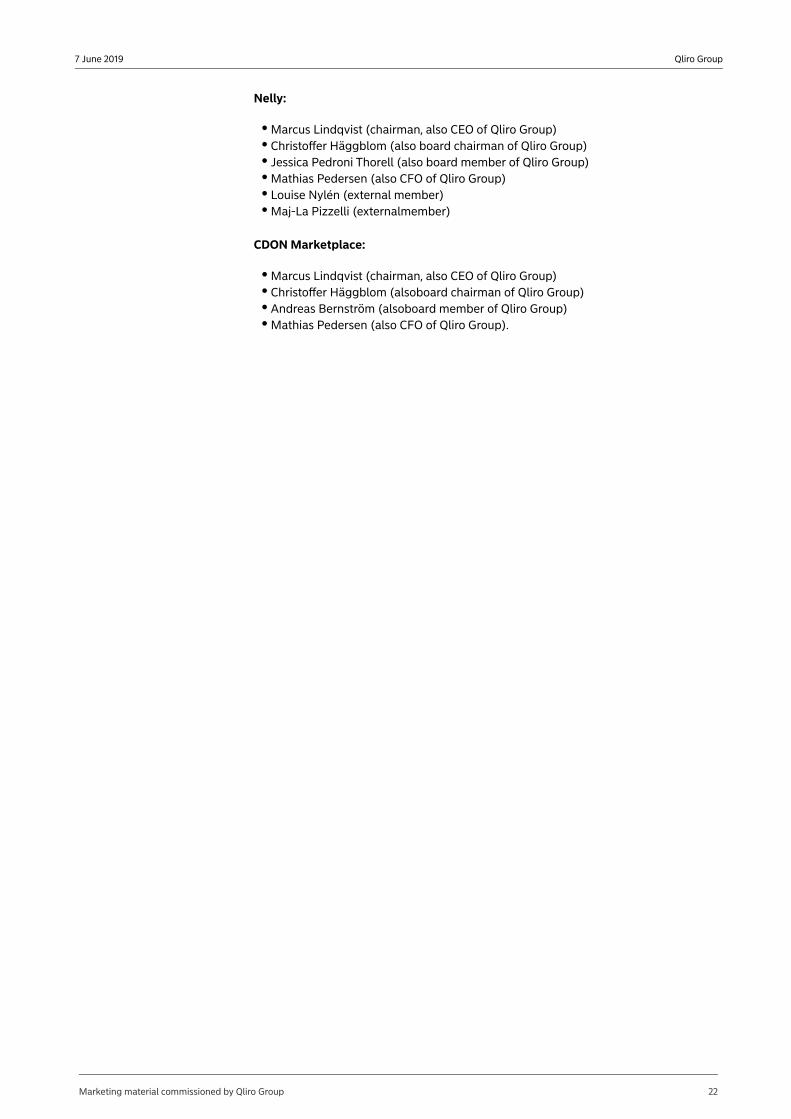
Non-executive director: Daniel Mytnik
Qliro Group affiliation: Mr Mytnik has been a member of the board since May 2014. He is a member of the audit committee and chairman of the remuneration committee.Born: 1971Background: Co-founder and managing partner of private equity firm Ventiga Capital Partners. Previously served as partner at Palamon Capital Partners, as managing director at investment bank Altium Capital, and worked in Morgan Stanley’s Private Equity and Investment Banking department.Education: BA in Philosophy, Politics and Economics and an MPhil in Economics from Oxford UniversityIndependence: Independent of the company and executive management, not independent of major shareholdersEquity stake: 131,513 shares
Subsidiary boards:
Governance was strengthened in Qliro Group with subsidiary boards
As a part of Qliro Group’s revised strategic direction to run Qliro Financial Services, CDON Marketplace and Nelly as three completely independent companies, corporate governance was strengthened in Qliro Group’s subsidiaries. From the second half of 2018, Nelly and CDON Marketplace have held regular board meetings. The board of Qliro Financial Services has held regular board meetings since 2014. All subsidiaries have separate boards with representatives from the parent company’s board and management as well as external board members for Qliro Financial Services and Nelly. This means that the subsidiaries are run independently of each other and that group management focuses on making the companies independent and ready for listing, as well as evaluating potential strategic transactions. As of 31 December 2018, the subsidiary boards had the following composition:
Qliro Financial Services:
Lennart Jacobsen (chairman, also board member of Qliro Group) Andreas Bernström (also a board member of Qliro Group)Marcus Lindqvist (also CEO of Qliro Group)Robert Burén (external member)Lennart Francke (external member)Helena Nelson (external member)Johan Wigh (external member)
Marketing material commissioned by Qliro Group 21
Qliro Group7 June 2019
Nelly:
Marcus Lindqvist (chairman, also CEO of Qliro Group)Christoffer Häggblom (also board chairman of Qliro Group)Jessica Pedroni Thorell (also board member of Qliro Group)Mathias Pedersen (also CFO of Qliro Group)Louise Nylén (external member)Maj-La Pizzelli (externalmember)
CDON Marketplace:
Marcus Lindqvist (chairman, also CEO of Qliro Group)Christoffer Häggblom (alsoboard chairman of Qliro Group)Andreas Bernström (alsoboard member of Qliro Group)Mathias Pedersen (also CFO of Qliro Group).
Marketing material commissioned by Qliro Group 22
Qliro Group7 June 2019
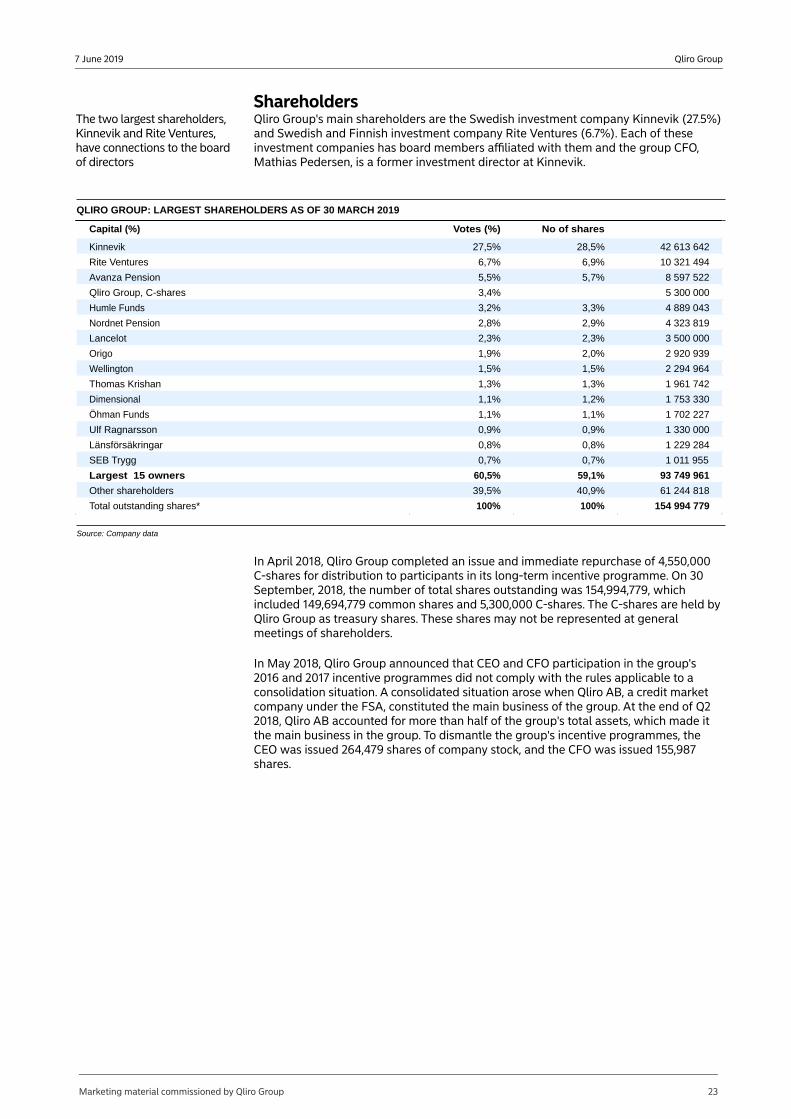
ShareholdersThe two largest shareholders, Kinnevik and Rite Ventures, have connections to the board of directors
Qliro Group's main shareholders are the Swedish investment company Kinnevik (27.5%) and Swedish and Finnish investment company Rite Ventures (6.7%). Each of these investment companies has board members affiliated with them and the group CFO, Mathias Pedersen, is a former investment director at Kinnevik.
QLIRO GROUP: LARGEST SHAREHOLDERS AS OF 30 MARCH 2019
Capital (%) Votes (%) No of shares
Kinnevik 27,5% 28,5% 42 613 642
Rite Ventures 6,7% 6,9% 10 321 494
Avanza Pension 5,5% 5,7% 8 597 522
Qliro Group, C-shares 3,4% 5 300 000
Humle Funds 3,2% 3,3% 4 889 043
Nordnet Pension 2,8% 2,9% 4 323 819
Lancelot 2,3% 2,3% 3 500 000
Origo 1,9% 2,0% 2 920 939
Wellington 1,5% 1,5% 2 294 964
Thomas Krishan 1,3% 1,3% 1 961 742
Dimensional 1,1% 1,2% 1 753 330
Öhman Funds 1,1% 1,1% 1 702 227
Ulf Ragnarsson 0,9% 0,9% 1 330 000
Länsförsäkringar 0,8% 0,8% 1 229 284
SEB Trygg 0,7% 0,7% 1 011 955
Largest 15 owners 60,5% 59,1% 93 749 961
Other shareholders 39,5% 40,9% 61 244 818
Total outstanding shares* 100% 100% 154 994 779
Source: Company data
In April 2018, Qliro Group completed an issue and immediate repurchase of 4,550,000 C-shares for distribution to participants in its long-term incentive programme. On 30 September, 2018, the number of total shares outstanding was 154,994,779, which included 149,694,779 common shares and 5,300,000 C-shares. The C-shares are held by Qliro Group as treasury shares. These shares may not be represented at general meetings of shareholders.
In May 2018, Qliro Group announced that CEO and CFO participation in the group's 2016 and 2017 incentive programmes did not comply with the rules applicable to a consolidation situation. A consolidated situation arose when Qliro AB, a credit market company under the FSA, constituted the main business of the group. At the end of Q2 2018, Qliro AB accounted for more than half of the group's total assets, which made it the main business in the group. To dismantle the group's incentive programmes, the CEO was issued 264,479 shares of company stock, and the CFO was issued 155,987 shares.
Marketing material commissioned by Qliro Group 23
Qliro Group7 June 2019
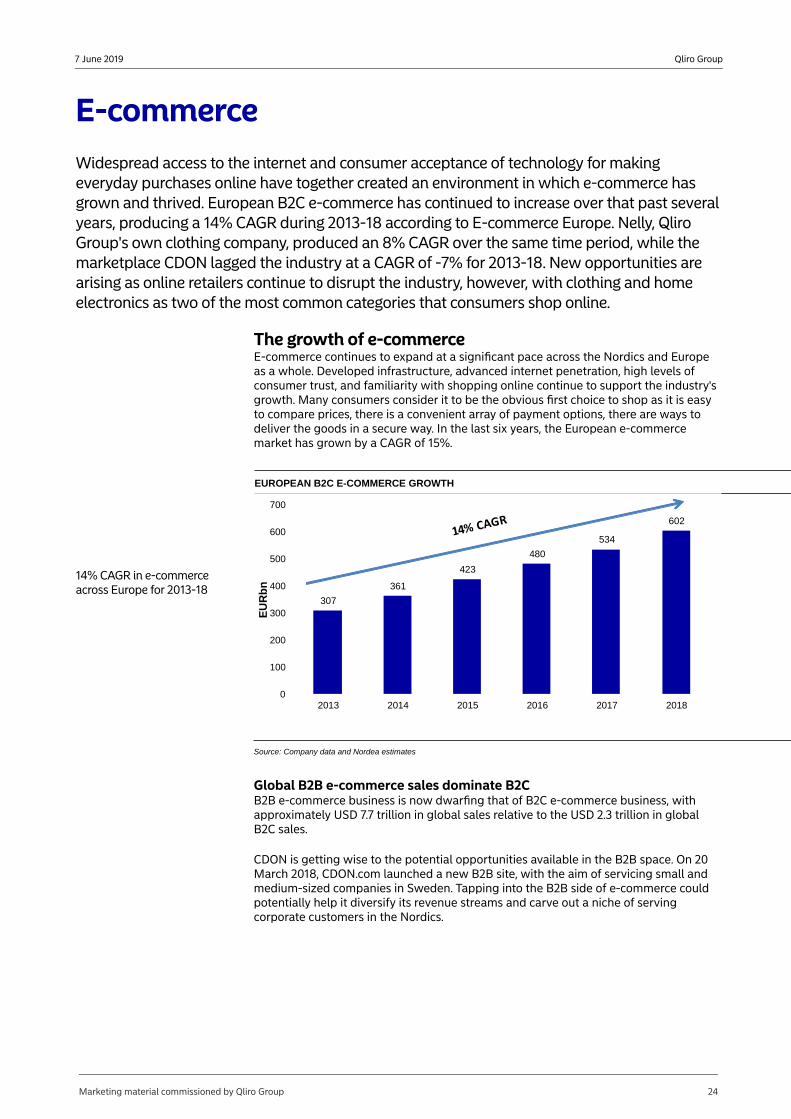
E-commerceWidespread access to the internet and consumer acceptance of technology for making everyday purchases online have together created an environment in which e-commerce has grown and thrived. European B2C e-commerce has continued to increase over that past several years, producing a 14% CAGR during 2013-18 according to E-commerce Europe. Nelly, Qliro Group's own clothing company, produced an 8% CAGR over the same time period, while the marketplace CDON lagged the industry at a CAGR of -7% for 2013-18. New opportunities are arising as online retailers continue to disrupt the industry, however, with clothing and home electronics as two of the most common categories that consumers shop online.
The growth of e-commerceE-commerce continues to expand at a significant pace across the Nordics and Europe as a whole. Developed infrastructure, advanced internet penetration, high levels of consumer trust, and familiarity with shopping online continue to support the industry's growth. Many consumers consider it to be the obvious first choice to shop as it is easy to compare prices, there is a convenient array of payment options, there are ways to deliver the goods in a secure way. In the last six years, the European e-commerce market has grown by a CAGR of 15%.
14% CAGR in e-commerce across Europe for 2013-18
EUROPEAN B2C E-COMMERCE GROWTH
307
361
423
480
534
602
0
100
200
300
400
500
600
700
2013 2014 2015 2016 2017 2018
EU
Rb
n
Source: Company data and Nordea estimates
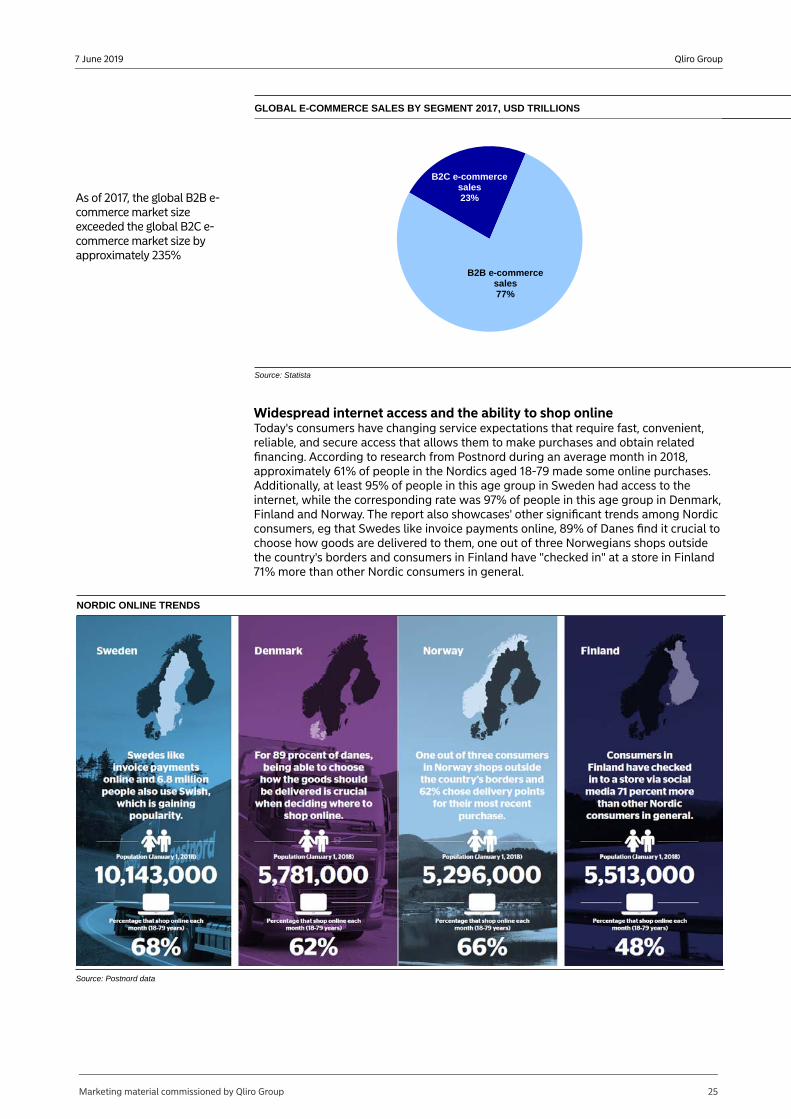
Global B2B e-commerce sales dominate B2CB2B e-commerce business is now dwarfing that of B2C e-commerce business, with approximately USD 7.7 trillion in global sales relative to the USD 2.3 trillion in global B2C sales.
CDON is getting wise to the potential opportunities available in the B2B space. On 20 March 2018, CDON.com launched a new B2B site, with the aim of servicing small and medium-sized companies in Sweden. Tapping into the B2B side of e-commerce could potentially help it diversify its revenue streams and carve out a niche of serving corporate customers in the Nordics.
Marketing material commissioned by Qliro Group 24
Qliro Group7 June 2019
GLOBAL E-COMMERCE SALES BY SEGMENT 2017, USD TRILLIONS
As of 2017, the global B2B e-commerce market size exceeded the global B2C e-commerce market size by approximately 235%
B2C e-commerce sales23%
B2B e-commerce sales77%
Source: Statista
Widespread internet access and the ability to shop onlineToday's consumers have changing service expectations that require fast, convenient, reliable, and secure access that allows them to make purchases and obtain related financing. According to research from Postnord during an average month in 2018, approximately 61% of people in the Nordics aged 18-79 made some online purchases. Additionally, at least 95% of people in this age group in Sweden had access to the internet, while the corresponding rate was 97% of people in this age group in Denmark, Finland and Norway. The report also showcases' other significant trends among Nordic consumers, eg that Swedes like invoice payments online, 89% of Danes find it crucial to choose how goods are delivered to them, one out of three Norwegians shops outside the country's borders and consumers in Finland have "checked in" at a store in Finland 71% more than other Nordic consumers in general.
NORDIC ONLINE TRENDS
Source: Postnord data
Marketing material commissioned by Qliro Group 25
Qliro Group7 June 2019
NORDIC CONSUMERS DURING AN AVERAGE MONTH IN 2018
The Nordic countries are some of the most internet-integrated in the world
68% 66%62%
48%
95% 97% 97% 97%
0%
10%
20%
30%
40%
50%
60%
70%
80%
90%
100%
Sweden Norway Denmark Finland
Percentage of population that shops online Percentage of population with access to the internet
Source: Nordea estimates and Postnord
The Nordic countries are advanced e-commerce nations. Digital infrastructure that developed early has allowed Nordic consumers to become comfortable with browsing and conducting transactions online earlier than many other countries in the world. Nordic e-commerce sales in 2018 exceeded EUR 22.4bn. The average consumer in Sweden, Denmark and Norway spent more than EUR 200 online in an average month during 2017, while the average consumer in Finland spent more EUR 158 per month during the same period.
Nordic e-commerce sales totalled EUR 22.4bn in 2018
NORDIC E-COMMERCE SALES 2018
9, 40%
5.1, 23%
5.5, 25%
2.8, 13%
Sales, EURbn
Sweden
Norway
Denmark
Finland
Source: Company data and Nordea estimates
Across the Nordics in 2018, the most popular goods segments purchased online were clothing/shoes, media, and home electronics; two of which are key focal points for Qliro Group's three companies.
Marketing material commissioned by Qliro Group 26
Qliro Group7 June 2019
Physical items purchased online during an average month in 2018 by Nordic country
TOP GOODS PURCHASED ONLINE IN THE NORDICS DURING 2018
39
28
23
32
12 12 12
7
36
22
25
10
1412
10
6
38
2526
17
1113
11
8
35
2523
89 9
8
4
0
5
10
15
20
25
30
35
40
45
Clothing/Shoes Media HomeElectronics
Beauty/Health Sport/Leisure Furniture/HomeFurnishings
Groceries Children'sProducts/Toys
Pe
rce
nta
ge
%
Sweden Norway Denmark Finland
Source: Postnord and Nordea estimates
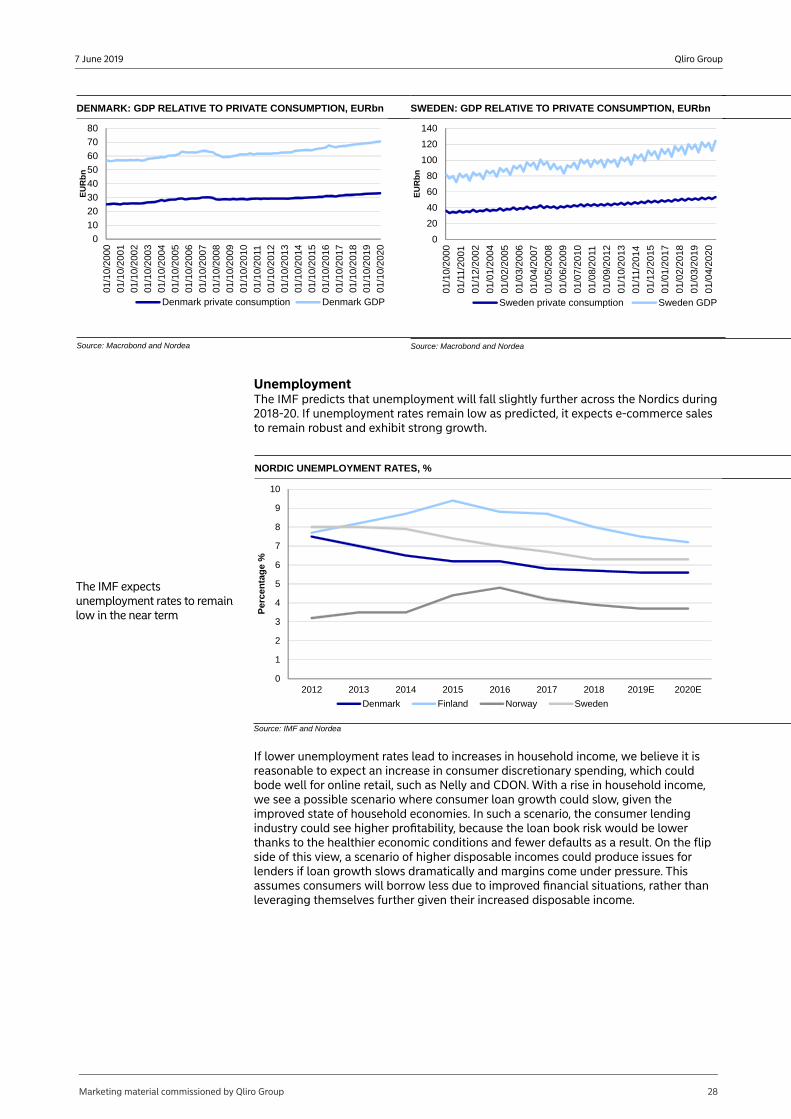
Strong relationship between private consumption and GDP in Qliro Group's main marketsPrivate consumption across the Nordics has closely tracked GDP growth, exhibiting a strong correlation in each Nordic market, while private consumption and GDP are at all-time highs in absolute terms in the company's main markets.
The correlation between private consumption and GDP are as follows:
Norway – 0.997Finland – 0.900Denmark – 0.955Sweden – 0.9650
Given the strong relationship between GDP and private consumption – and the fact that GDP growth has continued a strong trend – Qliro Group can expect consumer consumption to remain equally strong.
NORWAY: GDP RELATIVE TO PRIVATE CONSUMPTION, EURbn
0102030405060708090
01/1
0/2
000
01/1
0/2
001
01/1
0/2
002
01/1
0/2
003
01/1
0/2
004
01/1
0/2
005
01/1
0/2
006
01/1
0/2
007
01/1
0/2
008
01/1
0/2
009
01/1
0/2
010
01/1
0/2
011
01/1
0/2
012
01/1
0/2
013
01/1
0/2
014
01/1
0/2
015
01/1
0/2
016
01/1
0/2
017
01/1
0/2
018
01/1
0/2
019
01/1
0/2
020
EU
Rb
n
Norway private consumption Norway GDP
Source: Macrobond and Nordea
FINLAND: GDP RELATIVE TO PRIVATE CONSUMPTION, EURbn
0
10
20
30
40
50
60
01/1
0/20
00
01/1
0/20
01
01/1
0/20
02
01/1
0/20
03
01/1
0/20
04
01/1
0/20
05
01/1
0/20
06
01/1
0/20
07
01/1
0/20
08
01/1
0/20
09
01/1
0/20
10
01/1
0/20
11
01/1
0/20
12
01/1
0/20
13
01/1
0/20
14
01/1
0/20
15
01/1
0/20
16
01/1
0/20
17
01/1
0/20
18
01/1
0/20
19
01/1
0/20
20
EU
Rb
n
Finland private consumption Finland GDP
Source: Macrobond and Nordea
Marketing material commissioned by Qliro Group 27
Qliro Group7 June 2019
DENMARK: GDP RELATIVE TO PRIVATE CONSUMPTION, EURbn SWEDEN: GDP RELATIVE TO PRIVATE CONSUMPTION, EURbn
0
10
20
30
40
50
60
70
80
01/1
0/20
00
01/1
0/20
01
01/1
0/20
02
01/1
0/20
03
01/1
0/20
04
01/1
0/20
05
01/1
0/20
06
01/1
0/20
07
01/1
0/20
08
01/1
0/20
09
01/1
0/20
10
01/1
0/20
11
01/1
0/20
12
01/1
0/20
13
01/1
0/20
14
01/1
0/20
15
01/1
0/20
16
01/1
0/20
17
01/1
0/20
18
01/1
0/20
19
01/1
0/20
20
EU
Rb
n
Denmark private consumption Denmark GDP
Source: Macrobond and Nordea
0
20
40
60
80
100
120
140
01/1
0/20
00
01/1
1/20
01
01/1
2/20
02
01/0
1/20
04
01/0
2/20
05
01/0
3/20
06
01/0
4/20
07
01/0
5/20
08
01/0
6/20
09
01/0
7/20
10
01/0
8/20
11
01/0
9/20
12
01/1
0/20
13
01/1
1/20
14
01/1
2/20
15
01/0
1/20
17
01/0
2/20
18
01/0
3/20
19
01/0
4/20
20
EU
Rb
n
Sweden private consumption Sweden GDP
Source: Macrobond and Nordea
UnemploymentThe IMF predicts that unemployment will fall slightly further across the Nordics during 2018-20. If unemployment rates remain low as predicted, it expects e-commerce sales to remain robust and exhibit strong growth.
NORDIC UNEMPLOYMENT RATES, %
The IMF expects unemployment rates to remain low in the near term
0
1
2
3
4
5
6
7
8
9
10
2012 2013 2014 2015 2016 2017 2018 2019E 2020E
Per
cen
tag
e %
Denmark Finland Norway Sweden
Source: IMF and Nordea
If lower unemployment rates lead to increases in household income, we believe it is reasonable to expect an increase in consumer discretionary spending, which could bode well for online retail, such as Nelly and CDON. With a rise in household income, we see a possible scenario where consumer loan growth could slow, given the improved state of household economies. In such a scenario, the consumer lending industry could see higher profitability, because the loan book risk would be lower thanks to the healthier economic conditions and fewer defaults as a result. On the flip side of this view, a scenario of higher disposable incomes could produce issues for lenders if loan growth slows dramatically and margins come under pressure. This assumes consumers will borrow less due to improved financial situations, rather than leveraging themselves further given their increased disposable income.
Marketing material commissioned by Qliro Group 28
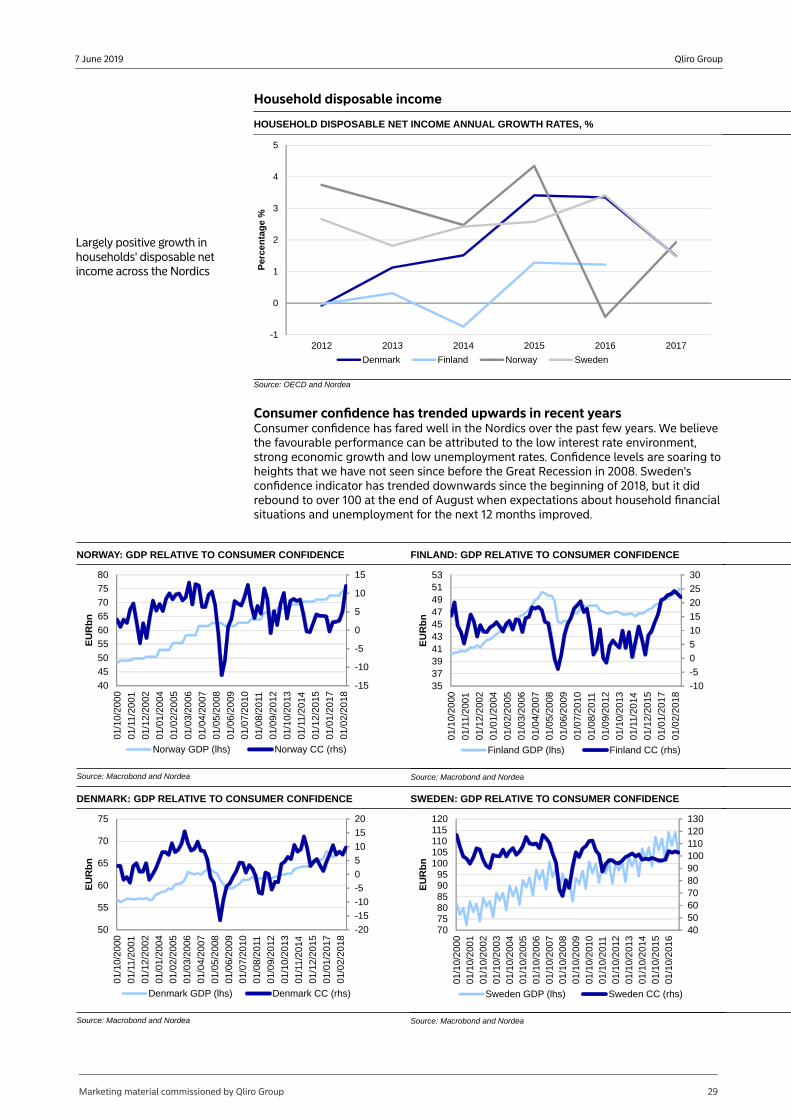
Qliro Group7 June 2019
Household disposable income
HOUSEHOLD DISPOSABLE NET INCOME ANNUAL GROWTH RATES, %
Largely positive growth in households' disposable net income across the Nordics
-1
0
1
2
3
4
5
2012 2013 2014 2015 2016 2017
Per
cen
tag
e %
Denmark Finland Norway Sweden
Source: OECD and Nordea
Consumer confidence has trended upwards in recent years Consumer confidence has fared well in the Nordics over the past few years. We believe the favourable performance can be attributed to the low interest rate environment, strong economic growth and low unemployment rates. Confidence levels are soaring to heights that we have not seen since before the Great Recession in 2008. Sweden's confidence indicator has trended downwards since the beginning of 2018, but it did rebound to over 100 at the end of August when expectations about household financial situations and unemployment for the next 12 months improved.
NORWAY: GDP RELATIVE TO CONSUMER CONFIDENCE FINLAND: GDP RELATIVE TO CONSUMER CONFIDENCE
-15
-10
-5
0
5
10
15
40
45
50
55
60
65
70
75
80
01/1
0/2
000
01/1
1/2
001
01/1
2/2
002
01/0
1/2
004
01/0
2/2
005
01/0
3/2
006
01/0
4/2
007
01/0
5/2
008
01/0
6/2
009
01/0
7/2
010
01/0
8/2
011
01/0
9/2
012
01/1
0/2
013
01/1
1/2
014
01/1
2/2
015
01/0
1/2
017
01/0
2/2
018
EU
Rb
n
Norway GDP (lhs) Norway CC (rhs)
Source: Macrobond and Nordea
-10
-5
0
5
10
15
20
25
30
35373941434547495153
01
/10/
2000
01
/11/
2001
01
/12/
2002
01
/01/
2004
01
/02/
2005
01
/03/
2006
01
/04/
2007
01
/05/
2008
01
/06/
2009
01
/07/
2010
01
/08/
2011
01
/09/
2012
01
/10/
2013
01
/11/
2014
01
/12/
2015
01
/01/
2017
01
/02/
2018
EU
Rb
n
Finland GDP (lhs) Finland CC (rhs)
Source: Macrobond and Nordea
DENMARK: GDP RELATIVE TO CONSUMER CONFIDENCE SWEDEN: GDP RELATIVE TO CONSUMER CONFIDENCE
-20
-15
-10
-5
0
5
10
15
20
50
55
60
65
70
75
01/1
0/20
00
01/1
1/2
001
01/1
2/20
02
01/0
1/20
04
01/0
2/20
05
01/0
3/20
06
01/0
4/20
07
01/0
5/20
08
01/0
6/20
09
01/0
7/20
10
01/0
8/20
11
01/0
9/20
12
01/1
0/20
13
01/1
1/2
014
01/1
2/20
15
01/0
1/20
17
01/0
2/20
18
EU
Rb
n
Denmark GDP (lhs) Denmark CC (rhs)
Source: Macrobond and Nordea
405060708090100110120130
707580859095
100105110115120
01/1
0/2
000
01/1
0/2
001
01/1
0/2
002
01/1
0/2
003
01/1
0/2
004
01/1
0/2
005
01/1
0/2
006
01/1
0/2
007
01/1
0/2
008
01/1
0/2
009
01/1
0/2
010
01/1
0/2
011
01/1
0/2
012
01/1
0/2
013
01/1
0/2
014
01/1
0/2
015
01/1
0/2
016
EU
Rb
n
Sweden GDP (lhs) Sweden CC (rhs)
Source: Macrobond and Nordea
Marketing material commissioned by Qliro Group 29
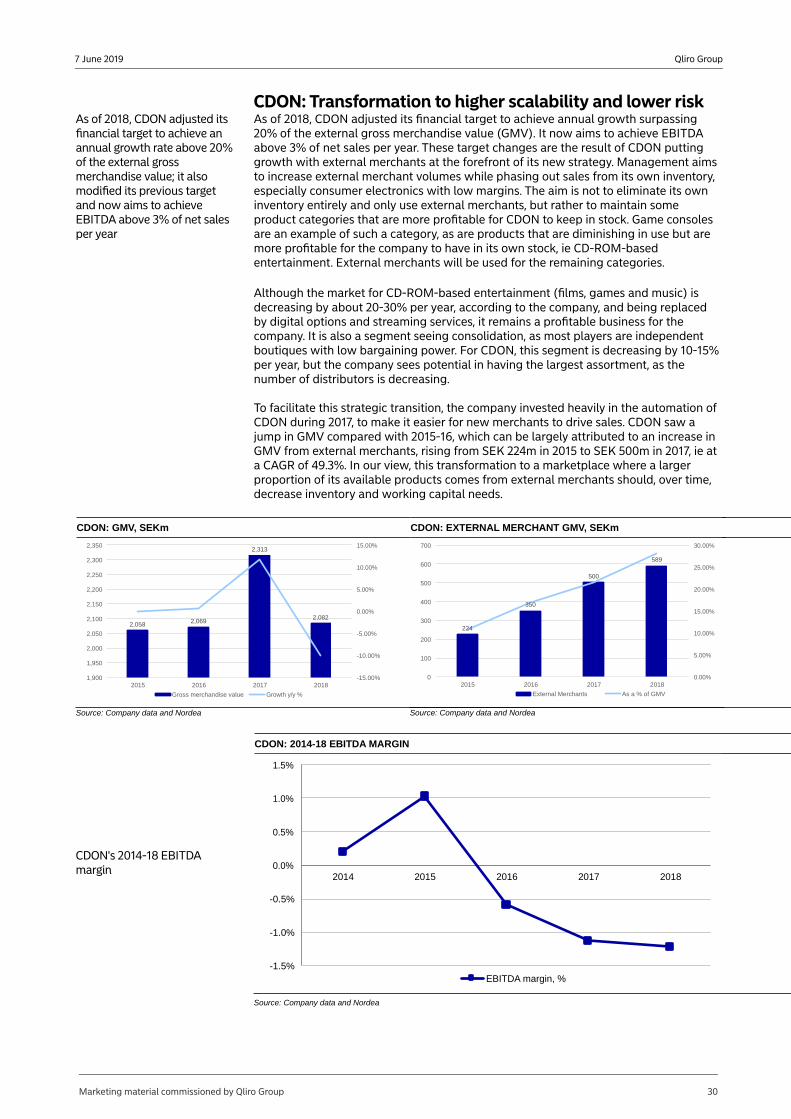
Qliro Group7 June 2019
CDON: Transformation to higher scalability and lower riskAs of 2018, CDON adjusted its financial target to achieve an annual growth rate above 20% of the external gross merchandise value; it also modified its previous target and now aims to achieve EBITDA above 3% of net sales per year
As of 2018, CDON adjusted its financial target to achieve annual growth surpassing 20% of the external gross merchandise value (GMV). It now aims to achieve EBITDA above 3% of net sales per year. These target changes are the result of CDON putting growth with external merchants at the forefront of its new strategy. Management aims to increase external merchant volumes while phasing out sales from its own inventory, especially consumer electronics with low margins. The aim is not to eliminate its own inventory entirely and only use external merchants, but rather to maintain some product categories that are more profitable for CDON to keep in stock. Game consoles are an example of such a category, as are products that are diminishing in use but are more profitable for the company to have in its own stock, ie CD-ROM-based entertainment. External merchants will be used for the remaining categories.
Although the market for CD-ROM-based entertainment (films, games and music) is decreasing by about 20-30% per year, according to the company, and being replaced by digital options and streaming services, it remains a profitable business for the company. It is also a segment seeing consolidation, as most players are independent boutiques with low bargaining power. For CDON, this segment is decreasing by 10-15% per year, but the company sees potential in having the largest assortment, as the number of distributors is decreasing.
To facilitate this strategic transition, the company invested heavily in the automation of CDON during 2017, to make it easier for new merchants to drive sales. CDON saw a jump in GMV compared with 2015-16, which can be largely attributed to an increase in GMV from external merchants, rising from SEK 224m in 2015 to SEK 500m in 2017, ie at a CAGR of 49.3%. In our view, this transformation to a marketplace where a larger proportion of its available products comes from external merchants should, over time, decrease inventory and working capital needs.
CDON: GMV, SEKm CDON: EXTERNAL MERCHANT GMV, SEKm
2,058 2,069
2,313
2,082
-15.00%
-10.00%
-5.00%
0.00%
5.00%
10.00%
15.00%
1,900
1,950
2,000
2,050
2,100
2,150
2,200
2,250
2,300
2,350
2015 2016 2017 2018
Gross merchandise value Growth y/y %
Source: Company data and Nordea
224
350
500
589
0.00%
5.00%
10.00%
15.00%
20.00%
25.00%
30.00%
0
100
200
300
400
500
600
700
2015 2016 2017 2018
External Merchants As a % of GMV
Source: Company data and Nordea
CDON's 2014-18 EBITDA margin
CDON: 2014-18 EBITDA MARGIN
-1.5%
-1.0%
-0.5%
0.0%
0.5%
1.0%
1.5%
2014 2015 2016 2017 2018
EBITDA margin, %
Source: Company data and Nordea
Marketing material commissioned by Qliro Group 30
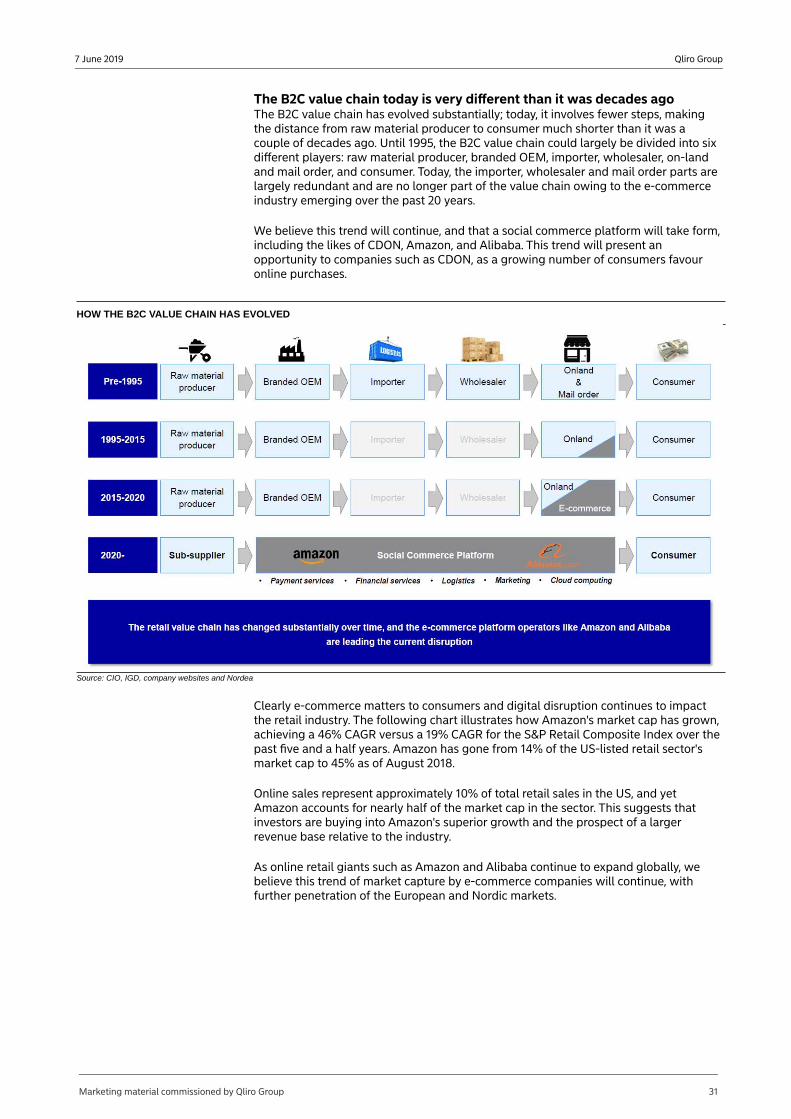
Qliro Group7 June 2019
The B2C value chain today is very different than it was decades agoThe B2C value chain has evolved substantially; today, it involves fewer steps, making the distance from raw material producer to consumer much shorter than it was a couple of decades ago. Until 1995, the B2C value chain could largely be divided into six different players: raw material producer, branded OEM, importer, wholesaler, on-land and mail order, and consumer. Today, the importer, wholesaler and mail order parts are largely redundant and are no longer part of the value chain owing to the e-commerce industry emerging over the past 20 years.
We believe this trend will continue, and that a social commerce platform will take form, including the likes of CDON, Amazon, and Alibaba. This trend will present an opportunity to companies such as CDON, as a growing number of consumers favour online purchases.
HOW THE B2C VALUE CHAIN HAS EVOLVED
Source: CIO, IGD, company websites and Nordea
Clearly e-commerce matters to consumers and digital disruption continues to impact the retail industry. The following chart illustrates how Amazon's market cap has grown, achieving a 46% CAGR versus a 19% CAGR for the S&P Retail Composite Index over the past five and a half years. Amazon has gone from 14% of the US-listed retail sector's market cap to 45% as of August 2018.
Online sales represent approximately 10% of total retail sales in the US, and yet Amazon accounts for nearly half of the market cap in the sector. This suggests that investors are buying into Amazon's superior growth and the prospect of a larger revenue base relative to the industry.
As online retail giants such as Amazon and Alibaba continue to expand globally, we believe this trend of market capture by e-commerce companies will continue, with further penetration of the European and Nordic markets.
Marketing material commissioned by Qliro Group 31
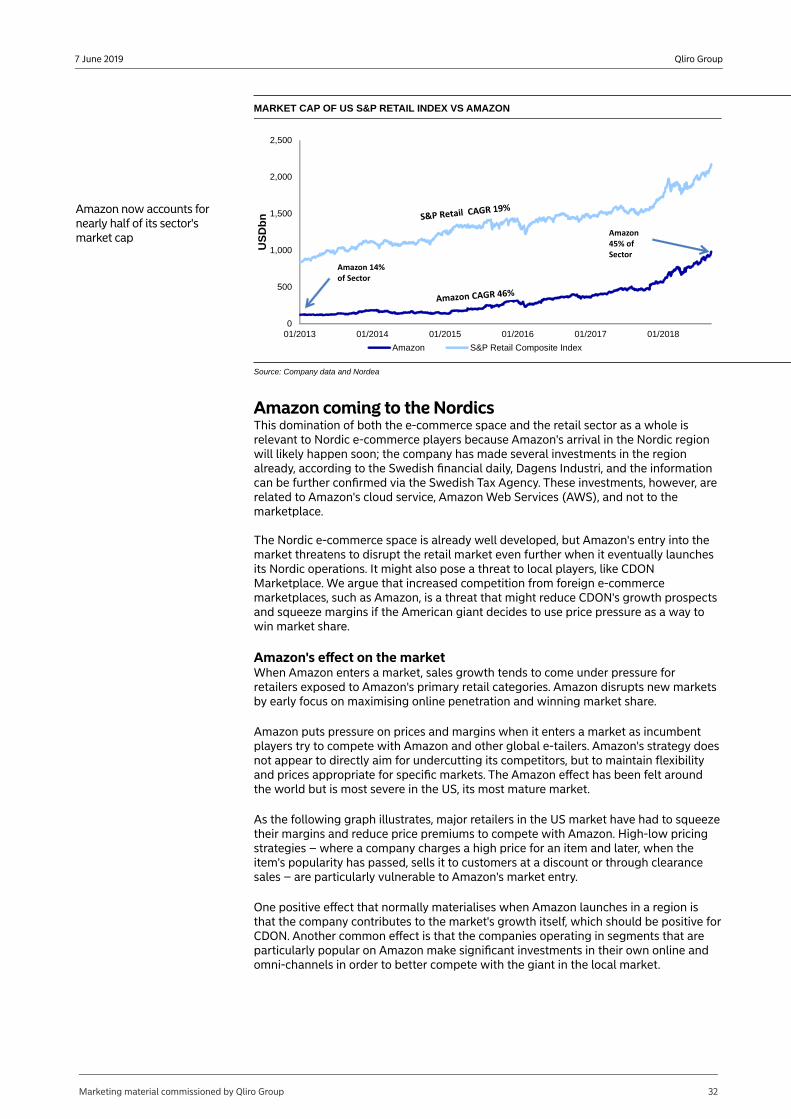
Qliro Group7 June 2019
MARKET CAP OF US S&P RETAIL INDEX VS AMAZON
Amazon now accounts for nearly half of its sector's market cap
0
500
1,000
1,500
2,000
2,500
01/2013 01/2014 01/2015 01/2016 01/2017 01/2018
US
Db
n
Amazon S&P Retail Composite Index
Amazon45% of Sector
Amazon 14% of Sector
Source: Company data and Nordea
Amazon coming to the NordicsThis domination of both the e-commerce space and the retail sector as a whole is relevant to Nordic e-commerce players because Amazon's arrival in the Nordic region will likely happen soon; the company has made several investments in the region already, according to the Swedish financial daily, Dagens Industri, and the information can be further confirmed via the Swedish Tax Agency. These investments, however, are related to Amazon's cloud service, Amazon Web Services (AWS), and not to the marketplace.
The Nordic e-commerce space is already well developed, but Amazon's entry into the market threatens to disrupt the retail market even further when it eventually launches its Nordic operations. It might also pose a threat to local players, like CDON Marketplace. We argue that increased competition from foreign e-commerce marketplaces, such as Amazon, is a threat that might reduce CDON's growth prospects and squeeze margins if the American giant decides to use price pressure as a way to win market share.
Amazon's effect on the marketWhen Amazon enters a market, sales growth tends to come under pressure for retailers exposed to Amazon's primary retail categories. Amazon disrupts new markets by early focus on maximising online penetration and winning market share.
Amazon puts pressure on prices and margins when it enters a market as incumbent players try to compete with Amazon and other global e-tailers. Amazon's strategy does not appear to directly aim for undercutting its competitors, but to maintain flexibility and prices appropriate for specific markets. The Amazon effect has been felt around the world but is most severe in the US, its most mature market.
As the following graph illustrates, major retailers in the US market have had to squeeze their margins and reduce price premiums to compete with Amazon. High-low pricing strategies – where a company charges a high price for an item and later, when the item's popularity has passed, sells it to customers at a discount or through clearance sales – are particularly vulnerable to Amazon's market entry.
One positive effect that normally materialises when Amazon launches in a region is that the company contributes to the market's growth itself, which should be positive for CDON. Another common effect is that the companies operating in segments that are particularly popular on Amazon make significant investments in their own online and omni-channels in order to better compete with the giant in the local market.
Marketing material commissioned by Qliro Group 32
Qliro Group7 June 2019
RETAILER PRICE PREMIUMS RELATIVE TO AMAZON'S PRICING AT THEIR PEAK AND CURRENT CONDITIONS
Large US retailers have cut price premiums relative to Amazon since their peaks to become more competitive
0%
5%
10%
15%
20%
25%
30%
35%
40%
Best Buy Dick's Sporting Goods Staples Office Depot
Peak Now
Source: Business Insider and Nordea
To combat Amazon, industry players often change their product range to specialise in private labels, along with key brands that have strong recognition. CDON's private label only represents a small proportion of sales and does not seem to be an area of focus, as CDON is more interested in expanding its external merchant offering. As an online marketplace that provides a platform for third-party merchants, CDON will be exposed to Amazon's potential presence in the Nordic region. Additionally, CDON's strategic focus is shifting away from selling from its own inventories and towards increasing the amount of third-party merchandise sold.
PRICING PRESSURE CAUSES POLARISATION OF RETAIL PROFITABILITY WHERE THERE ARE WINNERS AND LOSERS (PROFITABILITY IN NON-FOOD SALES)
The spread of operating margins between the upper quartile and lower quartile of firms operating in the non-food retail space has widened since 2000
Source: HUI – Det stora detaljhandelsskiftet and Nordea
Impact of Amazon in France: What could happenAn example of how a retailer can be affected by Amazon's market entry is the French retailer of technology products (IT, audio, TV) and editorial products (books, e-books, CD/CVCs, gaming) Fnac Darty. While Amazon has had a presence in France since 2000, the turning point in the retail industry came in 2008 when it introduced its Prime offering. This saw France's online retail penetration growth rise to ~1,000 bp from ~100 bp. The electronics and retail segment saw a material impact on its EBIT margin, as 70% of Amazon's EUR 2bn revenue in France came from the electronics category.
Fnac Darty saw pressure on its total revenue with LFL sales decreasing around 1% per year since 2013. Margins also saw a contraction of around 200 bp post-Amazon's shift to Prime. It took the company about five years to regain the same EBIT margin as it had following the launch of Amazon Prime. Fnac Darty's strategy following the Amazon Prime launch became to focus on service rather than price, according to the company.
Marketing material commissioned by Qliro Group 33
Qliro Group7 June 2019
FNAC DARTY: EBIT MARGIN, 2010-19
4%
2%
1.50%1.80%
2%2.30%
2.70%
3.60%
4.00%
4.50%
0%
1%
1%
2%
2%
3%
3%
4%
4%
5%
5%
FY10 FY11 FY12 FY13 FY14 FY15 FY16 FY17 FY18 FY19E
EBIT margin FNAC DARTY
Source: Company data
FNAC DARTY: LFL SALES GROWTH
-4.50%
-4.00%
-3.50%
-3.00%
-2.50%
-2.00%
-1.50%
-1.00%
-0.50%
0.00%
0.50%
1.00%
FY13 FY14 FY15 FY16 FY17 FY18 FY19E
LFL
Source: Company data
To compete with Amazon, the company started making significant investments in its own online channel. Online sales represented around 14% of the company's total sales in 2012 but grew to ~20% by 2018. Click-and-collect as a percentage of online sales has tripled since 2012 due to investments in website efficiency (checkout times, layout, etc) and a wide coverage of pickup points, particularly after the Darty acquisition (~120 Fnac stores in France, ~300 Darty). It also invested in a dedicated logistics platform and online stock-checking (key for click-and-collect) for one-hour pickup.
FNAC DARTY: ONLINE SALES AS A % OF TOTAL SALES
14%15%
16%17%
19%20%
21%
0%
10%
20%
30%
40%
50%
60%
FY12 FY13 FY14 FY15 FY16 FY18 FY19E0%
5%
10%
15%
20%
25%
Online % sales (LHS) Click & Collect (RHS)
Source: Company data
In 2014, the company launched its own subscription programme under the name Fnac+, much akin to Amazon Prime, where for EUR 49 per year, the customer receives next day delivery anywhere in France with no minimum purchase price. This has likely been instrumental in Fnac's ability to attract and keep customers. Investment in Fnac's website and logistics platform (pick-and-pack capabilities) has allowed it to offer one of the widest and fastest delivery options among major French retailers.
MAJOR RETAILERS IN FRANCE VS AMAZON DELIVERY OFFERING
Fnac Darty Boulanger Cultura Amazon
1 hour x x x x x
2 hours EUR 9.99 x x x x
3 hours EUR 9.99 EUR 9.99 x x x
1 day EUR 7.99 excl >30kg for EUR 9.99 Yes Yes EUR 7.99
2 days Yes Yes Yes Yes Yes
Evening delivery EUR 9.99 Paris, Lyon for EUR 29 x x Yes
Morning delivery x (Paris, North) Yes x x
Sunday delivery x Yes x x x
Same day delivery EUR 9.99 Yes x x Yes
Source: Company data
Marketing material commissioned by Qliro Group 34
Qliro Group7 June 2019
After about five years of price investment and price re-alignment between in-store and online, Fnac's average selling gap versus Amazon has improved to ~3% (versus ~10% five years ago). The above initiatives have allowed the company's EBIT margin to return to its previous record-high levels from 2012. It reported an EBIT margin of 4.5% in 2018 as well as an LFL increase of 0.4% y/y. According to industry feedback, the driving force behind Fnac's success is its ability to compete with Amazon outside of price, most notably through its Fnac+ programme.
This analysis suggests that Amazon has a significant impact on incumbent electronics retailer margins. That said, early signs of success at Fnac show that there is also room for incumbents to grow. We find that having a subscription offer is an important tool to attract and retain customers, something that also secures marketplace survival. Amazon Prime is one of the key competitive advantages Amazon has over incumbent retailers. By creating a similar or better offering, retailers not only marginalise Amazon's competitive advantage but also benefit from increased repeat purchases, transaction values and basket sizes. Second, we find that it is important to improve online capability. This is made through investments in website efficiency, leveraging on the existing store network and improving efficiency within existing logistics centres. Third, but not last, Fnac's experience indicated that retailers must improve not only their pricing relative to Amazon but also their perception through more effective marketing schemes or targeted promotional programmes.
CDON will find itself in a fight against Amazon
CDON's resilience to Amazon's arrivalConsumers in the Nordics already shop online using non-Nordic marketplaces. If Amazon and other large e-tailers establish themselves in the region, CDON will find itself in a fight against this polarisation phenomenon and could be outgunned by Amazon and larger players, making it more difficult to become profitable.
While Fnac Darty was both an e-retailer and a physical retailer, we find several similarities between the companies. Much like Fnac Darty, CDON was for a long time a leading destination for the purchasing of everyday items, from electronic products to children's books. In recent years, however, CDON has failed to differentiate itself enough from its competitors to keep a leading position in the eyes of consumers who are always comparing prices. CDON does not have a loyalty programme, but neither did Fnac Darty until Amazon launched its Prime offer in France. CDON also does not seem to have a standardised delivery method (eg next-day delivery), so deliveries are dependent on the type of product that the customer orders.
There are reasons to believe that CDON could face pressures similar to what the French retailer did, if Amazon were to enter the Swedish market. This means that CDON could see margin pressure of ~200 bp once Amazon launches its Nordic marketplace. In such a scenario, CDON would go from 1.24% in 2020E to -0.72% in 2021E. However, as Fnac Darty also has proved, Amazon's entry does not entirely rule out the Swedish marketplace but rather challenges positions once it has launched. Fnac Darty managed to make significant improvements in its operations thanks to investments in its own omni-channel, better logistics and improved pricing relative to Amazon. The company's capex-to-sales ratio increased from 2% to 4% over 2012-17.
If CDON follows that lead, we think that the Swedish marketplace could regain its EBIT margin by 2025E, estimating improvements of 50 bp per year.
Marketing material commissioned by Qliro Group 35
Qliro Group7 June 2019
EBIT MARGIN IMPACT IN 2020E-25E IN CASE OF AMAZON'S ENTRY WITH RECOVERY
1.24%
-0.72%
-0.21%
0.23%
0.80%
1.27%
-1.00%
-0.50%
0.00%
0.50%
1.00%
1.50%
2020E 2021E 2022E 2023E 2024E 2025E
EBIT margin 2020-2025
Source: Nordea estimates
A key differentiating factor for CDON has been the fact that the company charges merchants a lower commission at an estimated 10-12% versus Amazon's estimated 15%, which is a potential reason for customers to choose CDON over Amazon. The company also insists that it has good and more personal relationships with local merchants given that it is local. This is no guarantee of success, however, as merchants inevitably choose the platform that reaches the most customers.
There is a risk that the company never recovers and that the 200 bp hit will be permanent. In that case, given that CDON currently represents around 5% of Qliro Group's enterprise value, we estimate that the enterprise value would lose around SEK 115m (assuming no breakup).
EBIT MARGIN IMPACT IN 2020-25 IN CASE OF AMAZON'S ENTRY WITHOUT RECOVERY
1.24%
-0.72% -0.75% -0.76% -0.72% -0.68%
-1.00%
-0.50%
0.00%
0.50%
1.00%
1.50%
2020E 2021E 2022E 2023E 2024E 2025E
EBIT margin 2020-2025
Source: Nordea estimates
In our view, CDON could mitigate impacts by focusing on these areas:
Develop a subscription/loyalty programme that offers customers next-day (preferably) free delivery along with other benefits, such as campaigns and sales to attract and retain customers;Invest in the platform, website and efficiency, along with logistics; and,Improve relative pricing or choose a different assortment of products that does not compete with Amazon's products, and improve its perception through more effective marketing schemes or targeted promotional programmes.
Marketing material commissioned by Qliro Group 36
Qliro Group7 June 2019
External merchants entail less risk to CDONAs part of CDON's business model, external merchants are allowed to sell their products on CDON.com in exchange for a commission fee to CDON (which we estimate at around 13%). We see benefits for CDON, namely:
It puts less risk on CDON, as it entails a smaller inventory, decreasing its liquidity risk, among other things;With a smaller inventory, less capital is tied up in the company and less debt, resulting in higher ROE, all else being equal;It makes it easier for Qliro/CDON to close down a product line or exit the business entirely, as less capital is tied up in it; and,Lower inventory implies improvements in net working capital for the company.
We believe Qliro could benefit from continuing to focus on expanding the external merchant sales on CDON.com, especially if an Amazon entry is around the corner. Thanks to already having an established presence in the Nordics, CDON might, if it continues to focus on external merchant sales, gain a competitive advantage on all of the points listed above in relation to Amazon, as the global player has limited experience and few established relationships with local merchants in the Nordic market.
We argue that CDON's ambition to further expand its marketplace for external merchants while transitioning away from sales of its own inventories should not have a negative effect on GMV, as this is likely to remain steady or grow. A larger portion of GMV, however, would come from external merchants instead of CDON's inventory.
Nordic-tailored, one-stop shop opportunityOver the years, CDON has increased its product range significantly, arriving at today's diversified product mix that includes everything from books, films and shoes to electronics, beauty, tobacco (snus) and supplements. Essentially, CDON is turning into a one-stop shop. We believe that continuing down that path might have a positive impact on the business, for instance by increasing revenue. Several benefits of a physical one-stop shop are also applicable to e-commerce one-stop shops. In particular, we believe one big benefit in CDON's case is that it might help in building trust with its customers. This is largely because customers will make more purchases on CDON's website and thereby become more familiar with it. Moreover, we see potential if CDON starts to offer loyalty rewards or similar loyalty schemes to further enhance customer loyalty and improve customer relationships.
Source: Company website
Potential to expand further in the B2B marketOn 20 March 2018, CDON.com launched a new B2B site, with the aim of servicing small and medium-sized companies in Sweden. Its ambition is to have an attractive offering for corporate customers throughout the Nordics. Currently, the biggest Nordic player in the B2B market is Dustin, which estimates the Nordic market at SEK 100bn. We see potential here for CDON to further expand its B2B business. If CDON continues to focus part of its business on the B2B segment and manages to take more market share in that segment, we believe its revenue streams might continue to grow. A strong B2B business might serve as a competitive advantage versus Amazon, as the latter's strength currently is in its B2C segment.
Focus for 2019As part of its strategy, the company has decided to focus on the following goals during 2019:
Driving the transition to a marketplace; Attracting new e-merchants with strong positions in their categories; and,Leveraging investments in technology to improve efficiency.
Marketing material commissioned by Qliro Group 37
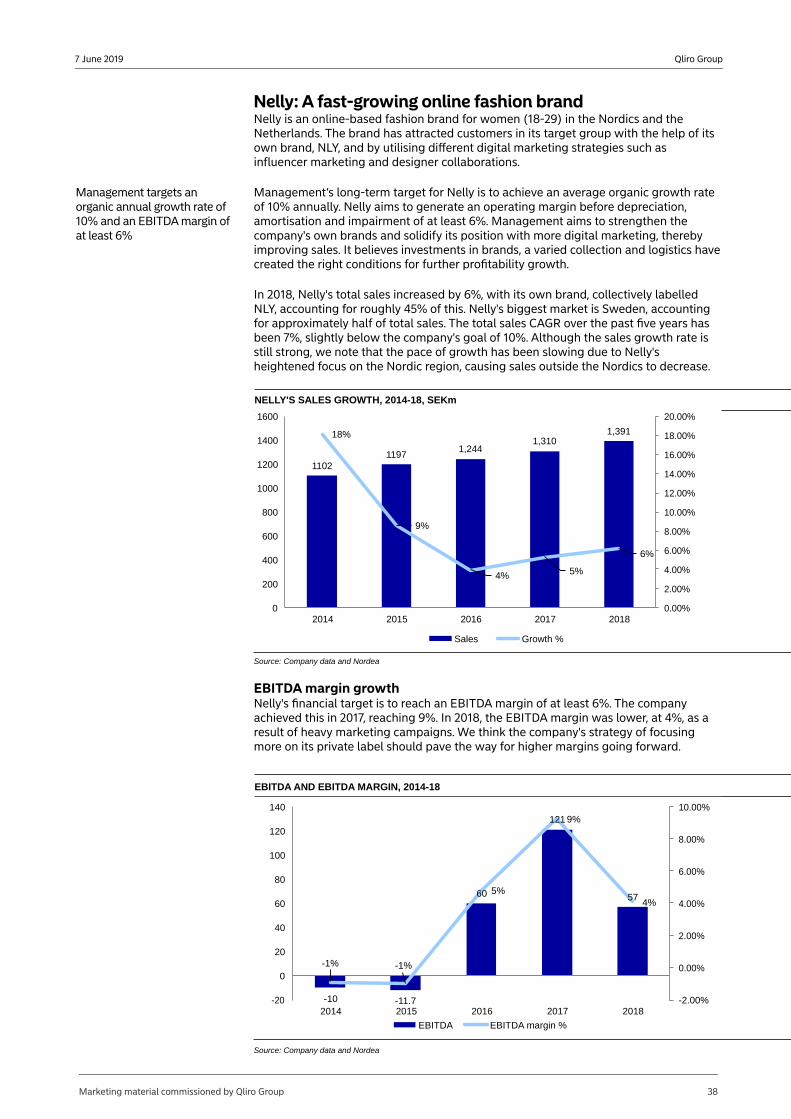
Qliro Group7 June 2019
Nelly: A fast-growing online fashion brandNelly is an online-based fashion brand for women (18-29) in the Nordics and the Netherlands. The brand has attracted customers in its target group with the help of its own brand, NLY, and by utilising different digital marketing strategies such as influencer marketing and designer collaborations.
Management targets an organic annual growth rate of 10% and an EBITDA margin of at least 6%
Management’s long-term target for Nelly is to achieve an average organic growth rate of 10% annually. Nelly aims to generate an operating margin before depreciation, amortisation and impairment of at least 6%. Management aims to strengthen the company's own brands and solidify its position with more digital marketing, thereby improving sales. It believes investments in brands, a varied collection and logistics have created the right conditions for further profitability growth.
In 2018, Nelly's total sales increased by 6%, with its own brand, collectively labelled NLY, accounting for roughly 45% of this. Nelly's biggest market is Sweden, accounting for approximately half of total sales. The total sales CAGR over the past five years has been 7%, slightly below the company's goal of 10%. Although the sales growth rate is still strong, we note that the pace of growth has been slowing due to Nelly's heightened focus on the Nordic region, causing sales outside the Nordics to decrease.
NELLY'S SALES GROWTH, 2014-18, SEKm
11021197
1,2441,310
1,39118%
9%
4% 5%
6%
0.00%
2.00%
4.00%
6.00%
8.00%
10.00%
12.00%
14.00%
16.00%
18.00%
20.00%
0
200
400
600
800
1000
1200
1400
1600
2014 2015 2016 2017 2018
Sales Growth %
Source: Company data and Nordea
EBITDA margin growthNelly's financial target is to reach an EBITDA margin of at least 6%. The company achieved this in 2017, reaching 9%. In 2018, the EBITDA margin was lower, at 4%, as a result of heavy marketing campaigns. We think the company's strategy of focusing more on its private label should pave the way for higher margins going forward.
EBITDA AND EBITDA MARGIN, 2014-18
-10 -11.7
60
121
57
-1% -1%
5%
9%
4%
-2.00%
0.00%
2.00%
4.00%
6.00%
8.00%
10.00%
-20
0
20
40
60
80
100
120
140
2014 2015 2016 2017 2018
EBITDA EBITDA margin %
Source: Company data and Nordea
Marketing material commissioned by Qliro Group 38
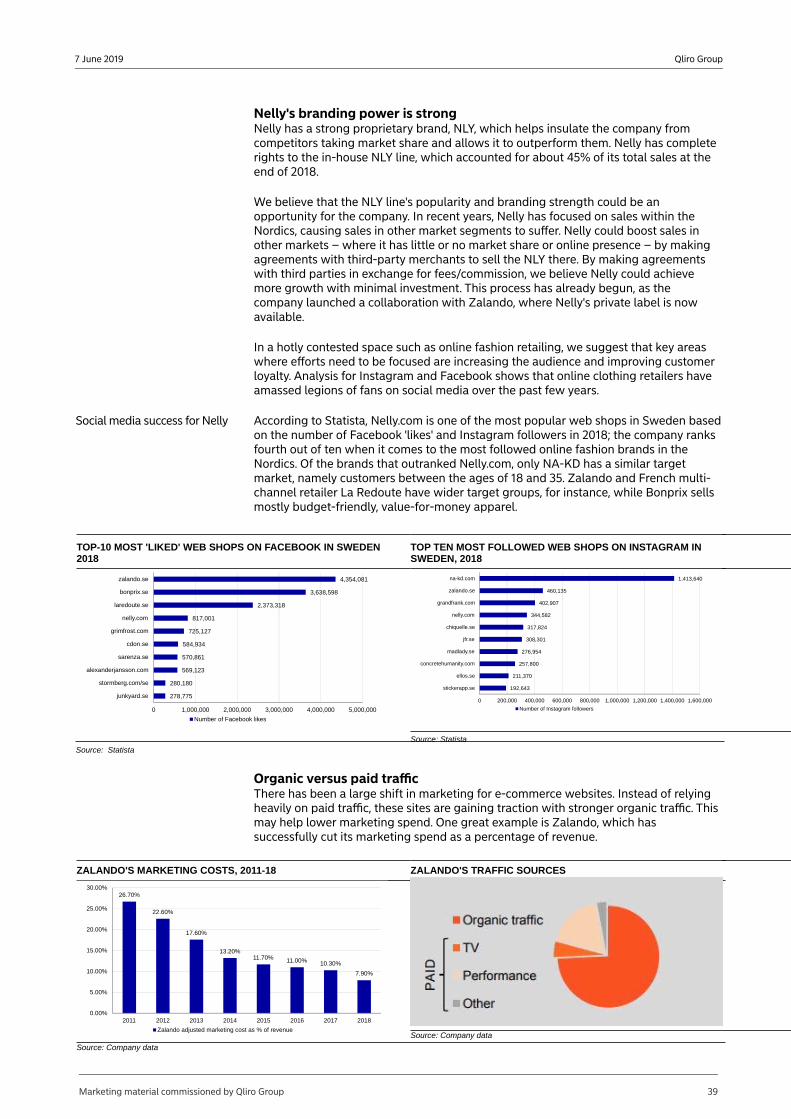
Qliro Group7 June 2019
Nelly's branding power is strong Nelly has a strong proprietary brand, NLY, which helps insulate the company from competitors taking market share and allows it to outperform them. Nelly has complete rights to the in-house NLY line, which accounted for about 45% of its total sales at the end of 2018.
We believe that the NLY line's popularity and branding strength could be an opportunity for the company. In recent years, Nelly has focused on sales within the Nordics, causing sales in other market segments to suffer. Nelly could boost sales in other markets – where it has little or no market share or online presence – by making agreements with third-party merchants to sell the NLY there. By making agreements with third parties in exchange for fees/commission, we believe Nelly could achieve more growth with minimal investment. This process has already begun, as the company launched a collaboration with Zalando, where Nelly's private label is now available.
In a hotly contested space such as online fashion retailing, we suggest that key areas where efforts need to be focused are increasing the audience and improving customer loyalty. Analysis for Instagram and Facebook shows that online clothing retailers have amassed legions of fans on social media over the past few years.
Social media success for Nelly According to Statista, Nelly.com is one of the most popular web shops in Sweden based on the number of Facebook 'likes' and Instagram followers in 2018; the company ranks fourth out of ten when it comes to the most followed online fashion brands in the Nordics. Of the brands that outranked Nelly.com, only NA-KD has a similar target market, namely customers between the ages of 18 and 35. Zalando and French multi-channel retailer La Redoute have wider target groups, for instance, while Bonprix sells mostly budget-friendly, value-for-money apparel.
TOP-10 MOST 'LIKED' WEB SHOPS ON FACEBOOK IN SWEDEN 2018
278,775
280,180
569,123
570,861
584,934
725,127
817,001
2,373,318
3,638,598
4,354,081
0 1,000,000 2,000,000 3,000,000 4,000,000 5,000,000
junkyard.se
stormberg.com/se
alexanderjansson.com
sarenza.se
cdon.se
grimfrost.com
nelly.com
laredoute.se
bonprix.se
zalando.se
Number of Facebook likes
Source: Statista
TOP TEN MOST FOLLOWED WEB SHOPS ON INSTAGRAM IN SWEDEN, 2018
192,643
211,370
257,800
276,954
308,301
317,824
344,582
402,907
460,135
1,413,640
0 200,000 400,000 600,000 800,000 1,000,000 1,200,000 1,400,000 1,600,000
stickerapp.se
ellos.se
concretehumanity.com
madlady.se
jfr.se
chiquelle.se
nelly.com
grandfrank.com
zalando.se
na-kd.com
Number of Instagram followers
Source: Statista
Organic versus paid trafficThere has been a large shift in marketing for e-commerce websites. Instead of relying heavily on paid traffic, these sites are gaining traction with stronger organic traffic. This may help lower marketing spend. One great example is Zalando, which has successfully cut its marketing spend as a percentage of revenue.
ZALANDO'S MARKETING COSTS, 2011-18
26.70%
22.60%
17.60%
13.20%11.70% 11.00% 10.30%
7.90%
0.00%
5.00%
10.00%
15.00%
20.00%
25.00%
30.00%
2011 2012 2013 2014 2015 2016 2017 2018
Zalando adjusted marketing cost as % of revenue
Source: Company data
ZALANDO'S TRAFFIC SOURCES
Source: Company data
Marketing material commissioned by Qliro Group 39
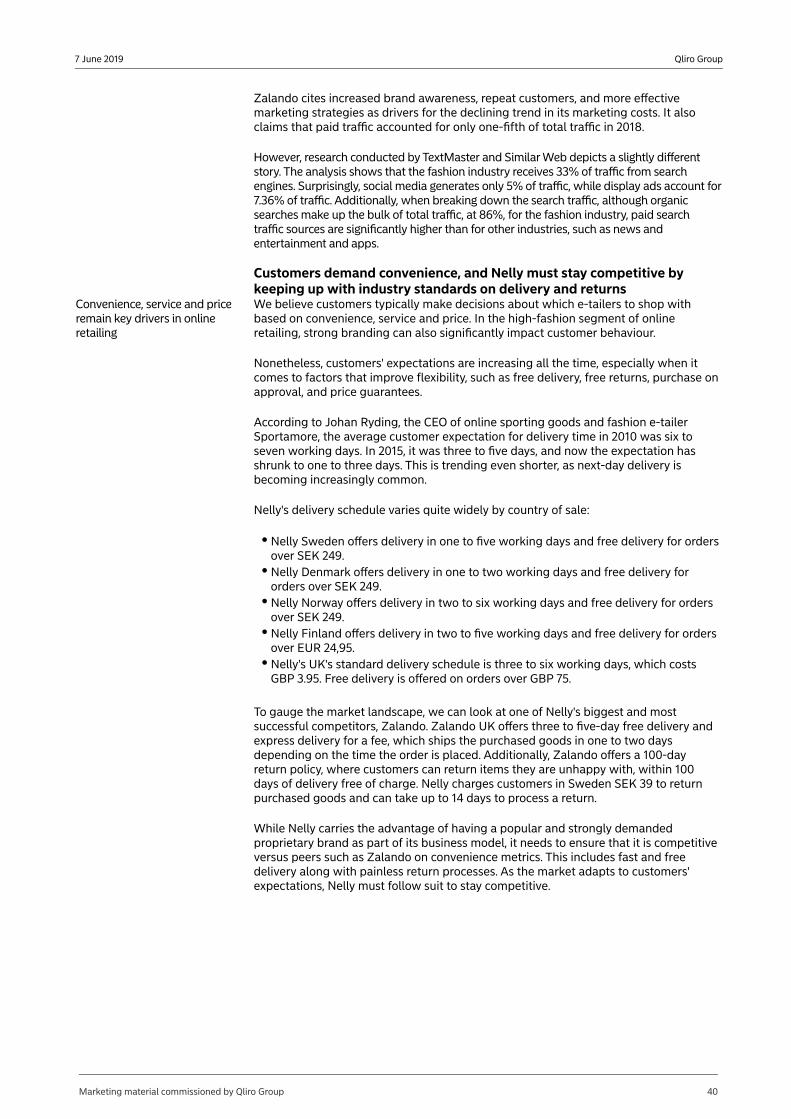
Qliro Group7 June 2019
Zalando cites increased brand awareness, repeat customers, and more effective marketing strategies as drivers for the declining trend in its marketing costs. It also claims that paid traffic accounted for only one-fifth of total traffic in 2018.
However, research conducted by TextMaster and Similar Web depicts a slightly different story. The analysis shows that the fashion industry receives 33% of traffic from search engines. Surprisingly, social media generates only 5% of traffic, while display ads account for 7.36% of traffic. Additionally, when breaking down the search traffic, although organic searches make up the bulk of total traffic, at 86%, for the fashion industry, paid search traffic sources are significantly higher than for other industries, such as news and entertainment and apps.
Customers demand convenience, and Nelly must stay competitive by keeping up with industry standards on delivery and returns
Convenience, service and price remain key drivers in online retailing
We believe customers typically make decisions about which e-tailers to shop with based on convenience, service and price. In the high-fashion segment of online retailing, strong branding can also significantly impact customer behaviour.
Nonetheless, customers' expectations are increasing all the time, especially when it comes to factors that improve flexibility, such as free delivery, free returns, purchase on approval, and price guarantees.
According to Johan Ryding, the CEO of online sporting goods and fashion e-tailer Sportamore, the average customer expectation for delivery time in 2010 was six to seven working days. In 2015, it was three to five days, and now the expectation has shrunk to one to three days. This is trending even shorter, as next-day delivery is becoming increasingly common.
Nelly's delivery schedule varies quite widely by country of sale:
Nelly Sweden offers delivery in one to five working days and free delivery for orders over SEK 249. Nelly Denmark offers delivery in one to two working days and free delivery for orders over SEK 249.Nelly Norway offers delivery in two to six working days and free delivery for orders over SEK 249.Nelly Finland offers delivery in two to five working days and free delivery for orders over EUR 24,95.Nelly's UK's standard delivery schedule is three to six working days, which costs GBP 3.95. Free delivery is offered on orders over GBP 75.
To gauge the market landscape, we can look at one of Nelly's biggest and most successful competitors, Zalando. Zalando UK offers three to five-day free delivery and express delivery for a fee, which ships the purchased goods in one to two days depending on the time the order is placed. Additionally, Zalando offers a 100-day return policy, where customers can return items they are unhappy with, within 100 days of delivery free of charge. Nelly charges customers in Sweden SEK 39 to return purchased goods and can take up to 14 days to process a return.
While Nelly carries the advantage of having a popular and strongly demanded proprietary brand as part of its business model, it needs to ensure that it is competitive versus peers such as Zalando on convenience metrics. This includes fast and free delivery along with painless return processes. As the market adapts to customers' expectations, Nelly must follow suit to stay competitive.
Marketing material commissioned by Qliro Group 40
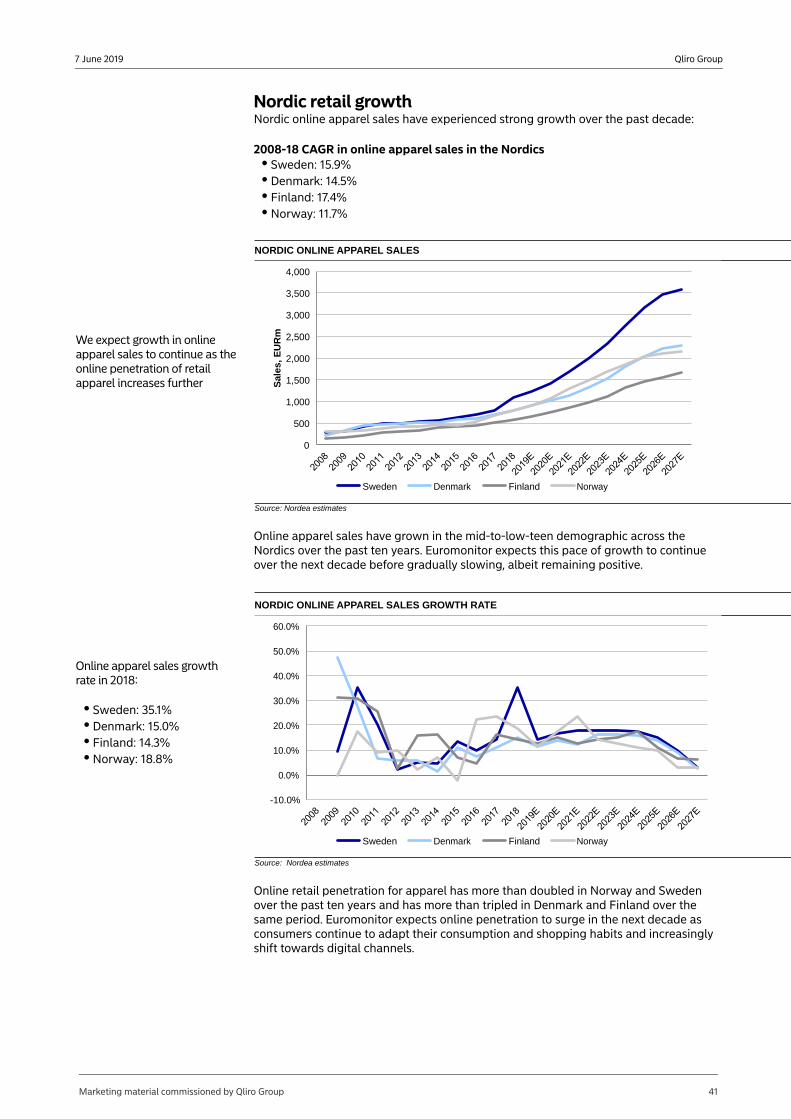
Qliro Group7 June 2019
Nordic retail growthNordic online apparel sales have experienced strong growth over the past decade:
2008-18 CAGR in online apparel sales in the Nordics
Sweden: 15.9% Denmark: 14.5%Finland: 17.4%Norway: 11.7%
NORDIC ONLINE APPAREL SALES
We expect growth in online apparel sales to continue as the online penetration of retail apparel increases further
0
500
1,000
1,500
2,000
2,500
3,000
3,500
4,000S
ales
, EU
Rm
Sweden Denmark Finland Norway
Source: Nordea estimates
Online apparel sales have grown in the mid-to-low-teen demographic across the Nordics over the past ten years. Euromonitor expects this pace of growth to continue over the next decade before gradually slowing, albeit remaining positive.
NORDIC ONLINE APPAREL SALES GROWTH RATE
Online apparel sales growth rate in 2018:
Sweden: 35.1% Denmark: 15.0%Finland: 14.3%Norway: 18.8%
-10.0%
0.0%
10.0%
20.0%
30.0%
40.0%
50.0%
60.0%
Sweden Denmark Finland Norway
Source: Nordea estimates
Online retail penetration for apparel has more than doubled in Norway and Sweden over the past ten years and has more than tripled in Denmark and Finland over the same period. Euromonitor expects online penetration to surge in the next decade as consumers continue to adapt their consumption and shopping habits and increasingly shift towards digital channels.
Marketing material commissioned by Qliro Group 41
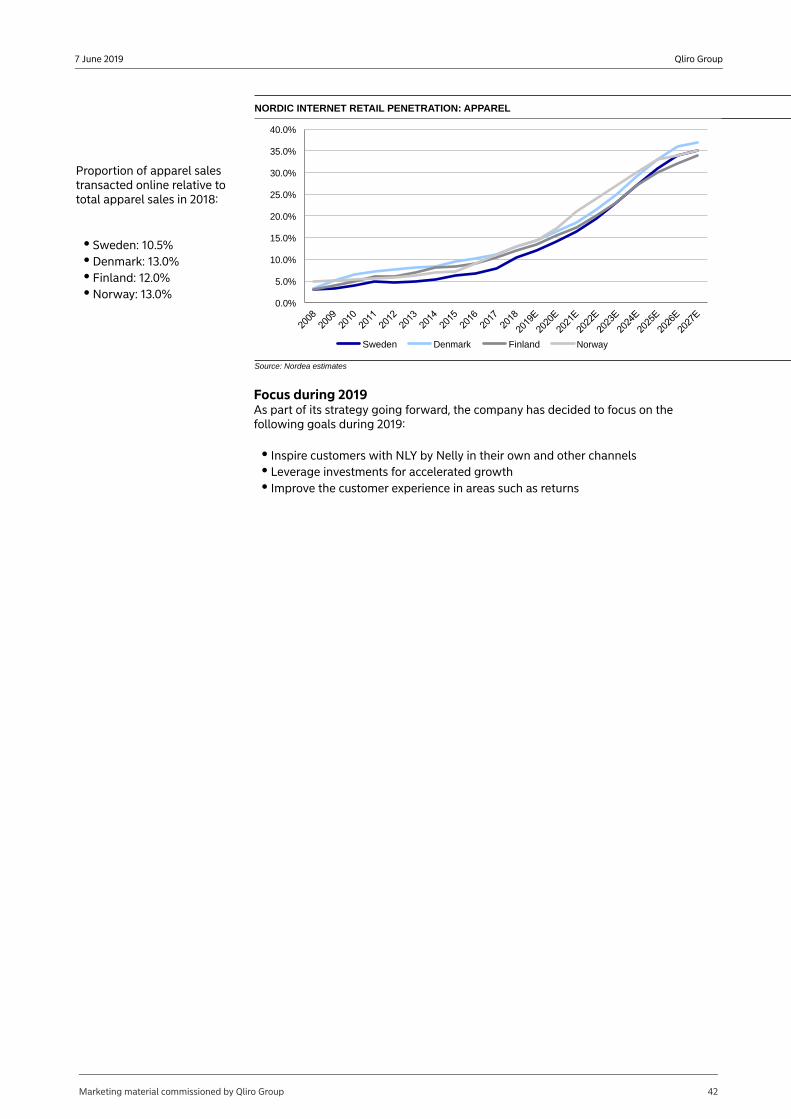
Qliro Group7 June 2019
NORDIC INTERNET RETAIL PENETRATION: APPAREL
Proportion of apparel sales transacted online relative to total apparel sales in 2018:
Sweden: 10.5% Denmark: 13.0%Finland: 12.0%Norway: 13.0%
0.0%
5.0%
10.0%
15.0%
20.0%
25.0%
30.0%
35.0%
40.0%
Sweden Denmark Finland Norway
Source: Nordea estimates
Focus during 2019As part of its strategy going forward, the company has decided to focus on the following goals during 2019:
Inspire customers with NLY by Nelly in their own and other channelsLeverage investments for accelerated growthImprove the customer experience in areas such as returns
Marketing material commissioned by Qliro Group 42
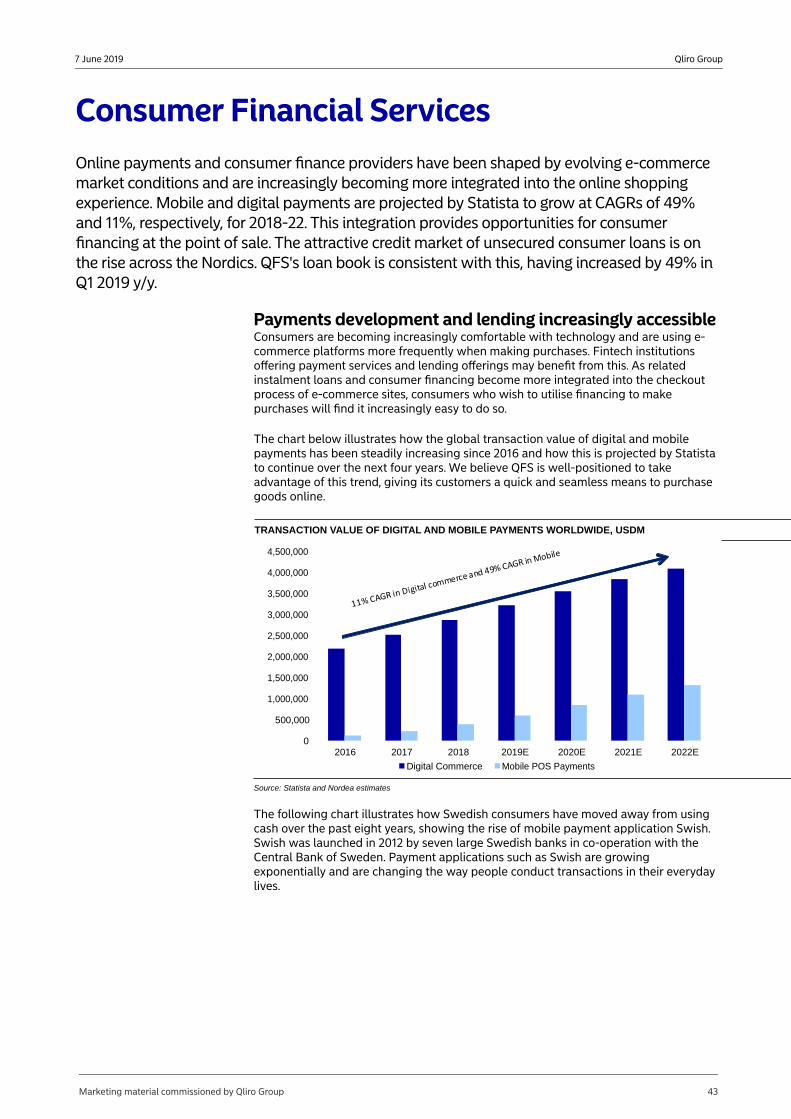
Qliro Group7 June 2019
Consumer Financial ServicesOnline payments and consumer finance providers have been shaped by evolving e-commerce market conditions and are increasingly becoming more integrated into the online shopping experience. Mobile and digital payments are projected by Statista to grow at CAGRs of 49% and 11%, respectively, for 2018-22. This integration provides opportunities for consumer financing at the point of sale. The attractive credit market of unsecured consumer loans is on the rise across the Nordics. QFS's loan book is consistent with this, having increased by 49% in Q1 2019 y/y.
Payments development and lending increasingly accessibleConsumers are becoming increasingly comfortable with technology and are using e-commerce platforms more frequently when making purchases. Fintech institutions offering payment services and lending offerings may benefit from this. As related instalment loans and consumer financing become more integrated into the checkout process of e-commerce sites, consumers who wish to utilise financing to make purchases will find it increasingly easy to do so.
The chart below illustrates how the global transaction value of digital and mobile payments has been steadily increasing since 2016 and how this is projected by Statista to continue over the next four years. We believe QFS is well-positioned to take advantage of this trend, giving its customers a quick and seamless means to purchase goods online.
TRANSACTION VALUE OF DIGITAL AND MOBILE PAYMENTS WORLDWIDE, USDM
0
500,000
1,000,000
1,500,000
2,000,000
2,500,000
3,000,000
3,500,000
4,000,000
4,500,000
2016 2017 2018 2019E 2020E 2021E 2022E
Digital Commerce Mobile POS Payments
Source: Statista and Nordea estimates
The following chart illustrates how Swedish consumers have moved away from using cash over the past eight years, showing the rise of mobile payment application Swish. Swish was launched in 2012 by seven large Swedish banks in co-operation with the Central Bank of Sweden. Payment applications such as Swish are growing exponentially and are changing the way people conduct transactions in their everyday lives.
Marketing material commissioned by Qliro Group 43
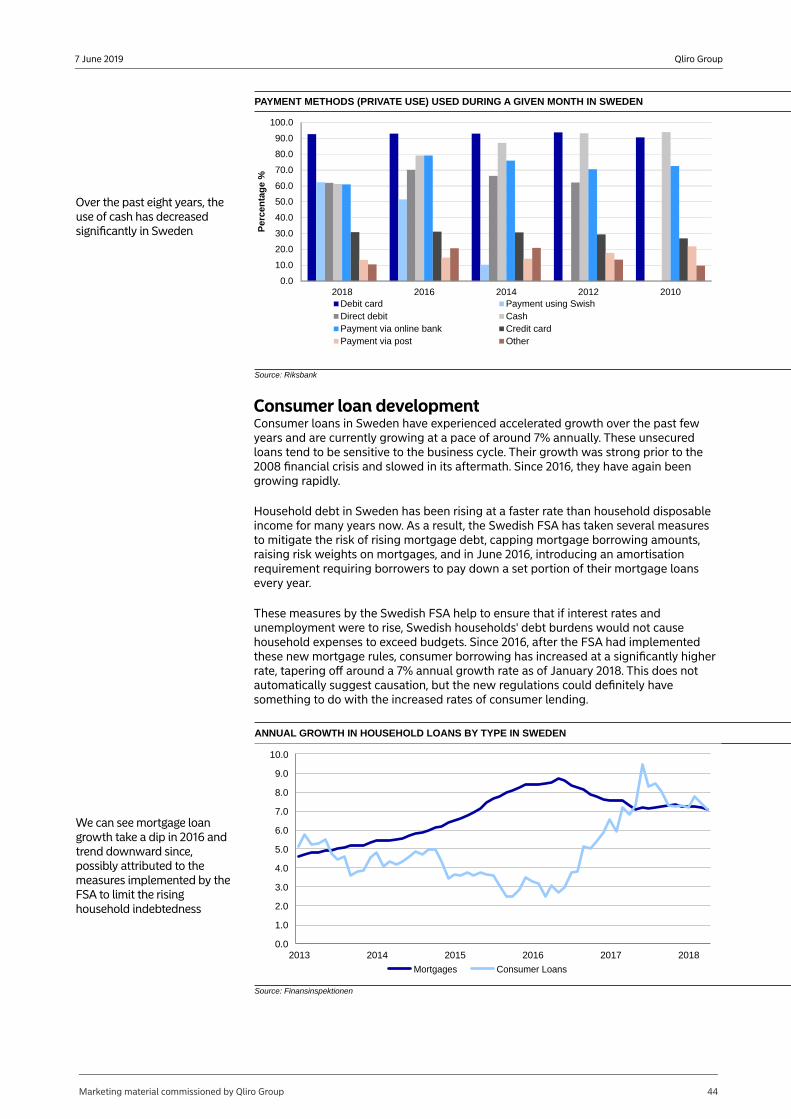
Qliro Group7 June 2019
PAYMENT METHODS (PRIVATE USE) USED DURING A GIVEN MONTH IN SWEDEN
Over the past eight years, the use of cash has decreased significantly in Sweden
0.0
10.0
20.0
30.0
40.0
50.0
60.0
70.0
80.0
90.0
100.0
2018 2016 2014 2012 2010
Per
cen
tag
e %
Debit card Payment using SwishDirect debit CashPayment via online bank Credit cardPayment via post Other
Source: Riksbank
Consumer loan developmentConsumer loans in Sweden have experienced accelerated growth over the past few years and are currently growing at a pace of around 7% annually. These unsecured loans tend to be sensitive to the business cycle. Their growth was strong prior to the 2008 financial crisis and slowed in its aftermath. Since 2016, they have again been growing rapidly.
Household debt in Sweden has been rising at a faster rate than household disposable income for many years now. As a result, the Swedish FSA has taken several measures to mitigate the risk of rising mortgage debt, capping mortgage borrowing amounts, raising risk weights on mortgages, and in June 2016, introducing an amortisation requirement requiring borrowers to pay down a set portion of their mortgage loans every year.
These measures by the Swedish FSA help to ensure that if interest rates and unemployment were to rise, Swedish households' debt burdens would not cause household expenses to exceed budgets. Since 2016, after the FSA had implemented these new mortgage rules, consumer borrowing has increased at a significantly higher rate, tapering off around a 7% annual growth rate as of January 2018. This does not automatically suggest causation, but the new regulations could definitely have something to do with the increased rates of consumer lending.
ANNUAL GROWTH IN HOUSEHOLD LOANS BY TYPE IN SWEDEN
We can see mortgage loan growth take a dip in 2016 and trend downward since, possibly attributed to the measures implemented by the FSA to limit the rising household indebtedness
0.0
1.0
2.0
3.0
4.0
5.0
6.0
7.0
8.0
9.0
10.0
2013 2014 2015 2016 2017 2018
Mortgages Consumer Loans
Source: Finansinspektionen
Marketing material commissioned by Qliro Group 44
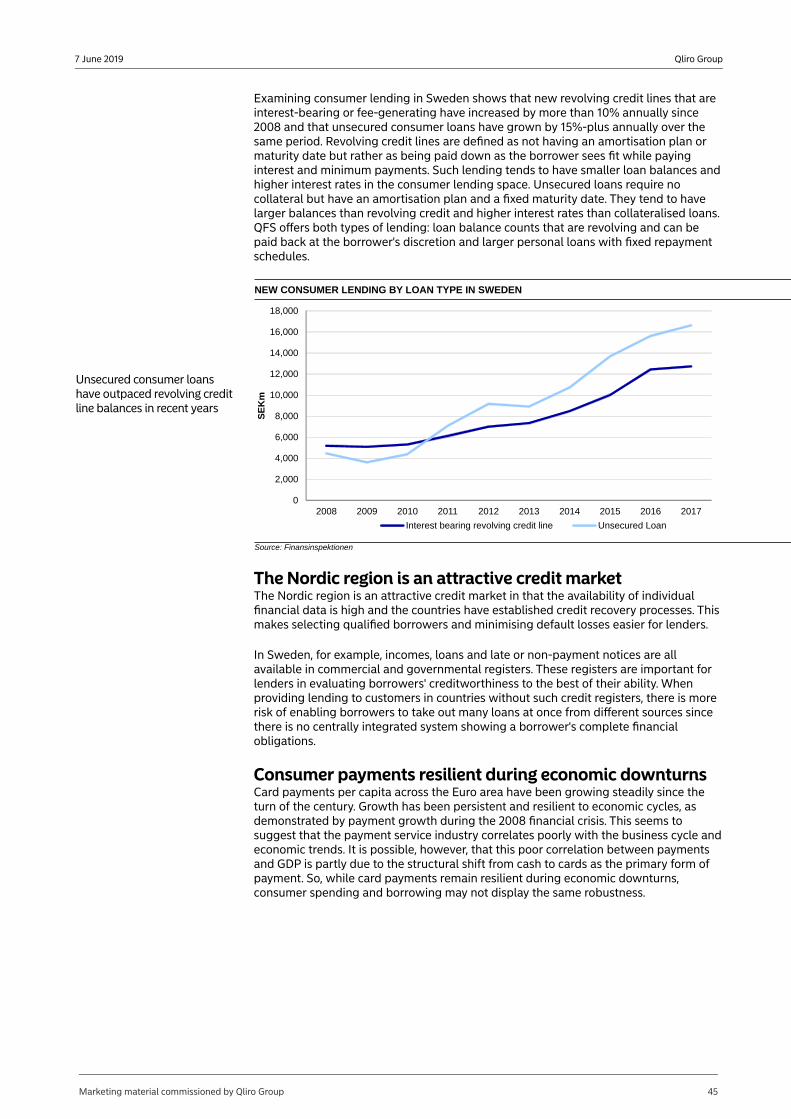
Qliro Group7 June 2019
Examining consumer lending in Sweden shows that new revolving credit lines that are interest-bearing or fee-generating have increased by more than 10% annually since 2008 and that unsecured consumer loans have grown by 15%-plus annually over the same period. Revolving credit lines are defined as not having an amortisation plan or maturity date but rather as being paid down as the borrower sees fit while paying interest and minimum payments. Such lending tends to have smaller loan balances and higher interest rates in the consumer lending space. Unsecured loans require no collateral but have an amortisation plan and a fixed maturity date. They tend to have larger balances than revolving credit and higher interest rates than collateralised loans. QFS offers both types of lending: loan balance counts that are revolving and can be paid back at the borrower's discretion and larger personal loans with fixed repayment schedules.
NEW CONSUMER LENDING BY LOAN TYPE IN SWEDEN
Unsecured consumer loans have outpaced revolving credit line balances in recent years
0
2,000
4,000
6,000
8,000
10,000
12,000
14,000
16,000
18,000
2008 2009 2010 2011 2012 2013 2014 2015 2016 2017
SE
Km
Interest bearing revolving credit line Unsecured Loan
Source: Finansinspektionen
The Nordic region is an attractive credit market The Nordic region is an attractive credit market in that the availability of individual financial data is high and the countries have established credit recovery processes. This makes selecting qualified borrowers and minimising default losses easier for lenders.
In Sweden, for example, incomes, loans and late or non-payment notices are all available in commercial and governmental registers. These registers are important for lenders in evaluating borrowers' creditworthiness to the best of their ability. When providing lending to customers in countries without such credit registers, there is more risk of enabling borrowers to take out many loans at once from different sources since there is no centrally integrated system showing a borrower's complete financial obligations.
Consumer payments resilient during economic downturnsCard payments per capita across the Euro area have been growing steadily since the turn of the century. Growth has been persistent and resilient to economic cycles, as demonstrated by payment growth during the 2008 financial crisis. This seems to suggest that the payment service industry correlates poorly with the business cycle and economic trends. It is possible, however, that this poor correlation between payments and GDP is partly due to the structural shift from cash to cards as the primary form of payment. So, while card payments remain resilient during economic downturns, consumer spending and borrowing may not display the same robustness.
Marketing material commissioned by Qliro Group 45
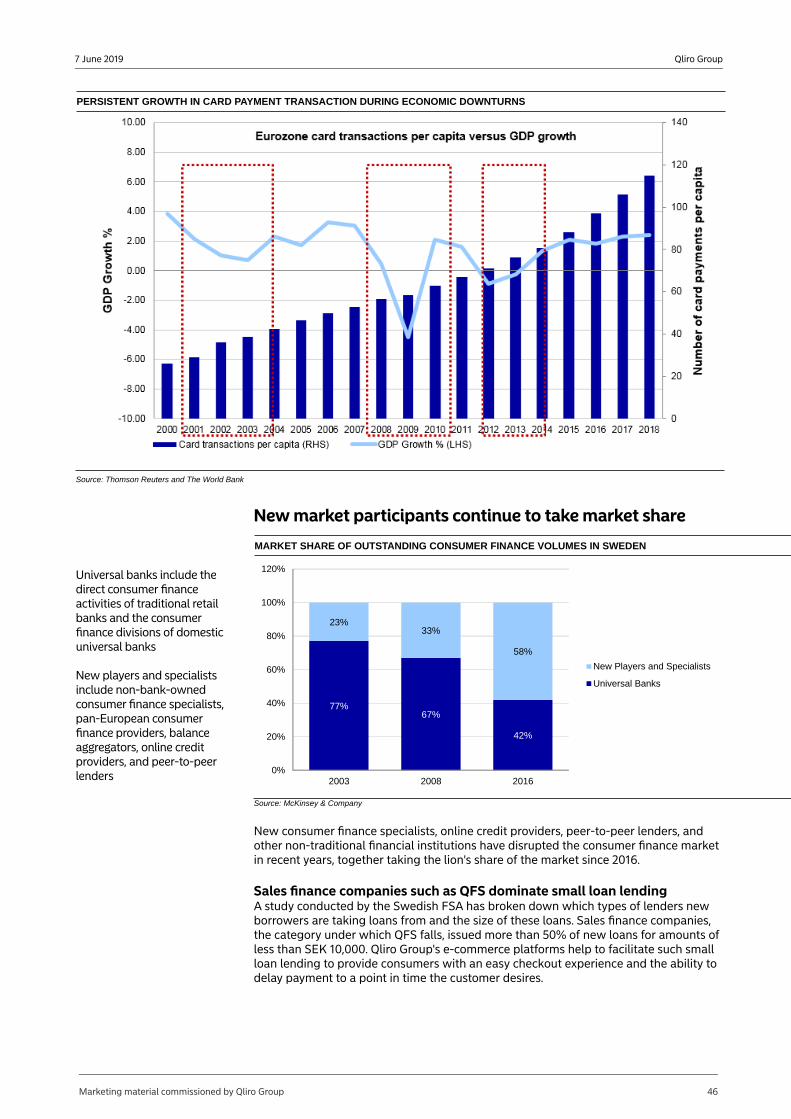
Qliro Group7 June 2019
PERSISTENT GROWTH IN CARD PAYMENT TRANSACTION DURING ECONOMIC DOWNTURNS
Source: Thomson Reuters and The World Bank
New market participants continue to take market share
MARKET SHARE OF OUTSTANDING CONSUMER FINANCE VOLUMES IN SWEDEN
Universal banks include the direct consumer finance activities of traditional retail banks and the consumer finance divisions of domestic universal banks
New players and specialists include non-bank-owned consumer finance specialists, pan-European consumer finance providers, balance aggregators, online credit providers, and peer-to-peer lenders
77%67%
42%
23%33%
58%
0%
20%
40%
60%
80%
100%
120%
2003 2008 2016
New Players and Specialists
Universal Banks
Source: McKinsey & Company
New consumer finance specialists, online credit providers, peer-to-peer lenders, and other non-traditional financial institutions have disrupted the consumer finance market in recent years, together taking the lion's share of the market since 2016.
Sales finance companies such as QFS dominate small loan lendingA study conducted by the Swedish FSA has broken down which types of lenders new borrowers are taking loans from and the size of these loans. Sales finance companies, the category under which QFS falls, issued more than 50% of new loans for amounts of less than SEK 10,000. Qliro Group's e-commerce platforms help to facilitate such small loan lending to provide consumers with an easy checkout experience and the ability to delay payment to a point in time the customer desires.
Marketing material commissioned by Qliro Group 46
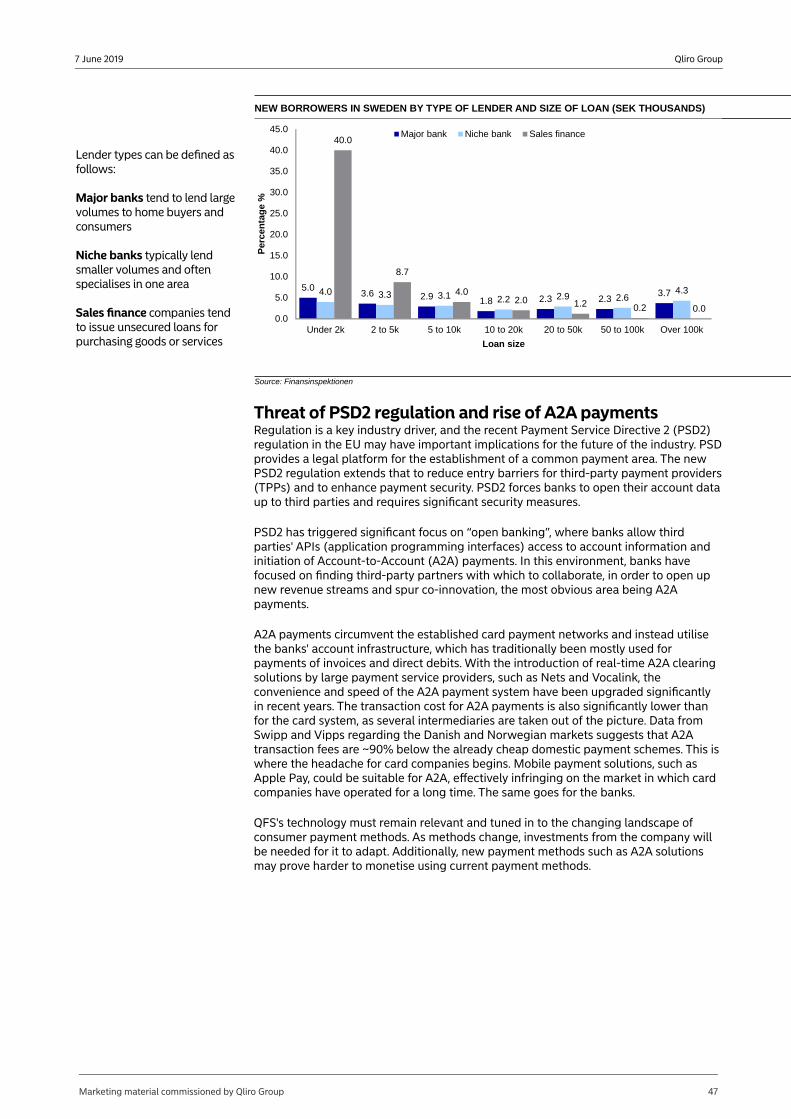
Qliro Group7 June 2019
NEW BORROWERS IN SWEDEN BY TYPE OF LENDER AND SIZE OF LOAN (SEK THOUSANDS)
Lender types can be defined as follows:
Major banks tend to lend large volumes to home buyers and consumers
Niche banks typically lend smaller volumes and often specialises in one area
Sales finance companies tend to issue unsecured loans for purchasing goods or services
5.03.6 2.9 1.8 2.3 2.3
3.74.0 3.3 3.1 2.2 2.9 2.64.3
40.0
8.7
4.02.0 1.2 0.2 0.0
0.0
5.0
10.0
15.0
20.0
25.0
30.0
35.0
40.0
45.0
Under 2k 2 to 5k 5 to 10k 10 to 20k 20 to 50k 50 to 100k Over 100k
Per
cen
tag
e %
Loan size
Major bank Niche bank Sales finance
Source: Finansinspektionen
Threat of PSD2 regulation and rise of A2A paymentsRegulation is a key industry driver, and the recent Payment Service Directive 2 (PSD2) regulation in the EU may have important implications for the future of the industry. PSD provides a legal platform for the establishment of a common payment area. The new PSD2 regulation extends that to reduce entry barriers for third-party payment providers (TPPs) and to enhance payment security. PSD2 forces banks to open their account data up to third parties and requires significant security measures.
PSD2 has triggered significant focus on “open banking”, where banks allow third parties' APIs (application programming interfaces) access to account information and initiation of Account-to-Account (A2A) payments. In this environment, banks have focused on finding third-party partners with which to collaborate, in order to open up new revenue streams and spur co-innovation, the most obvious area being A2A payments.
A2A payments circumvent the established card payment networks and instead utilise the banks' account infrastructure, which has traditionally been mostly used for payments of invoices and direct debits. With the introduction of real-time A2A clearing solutions by large payment service providers, such as Nets and Vocalink, the convenience and speed of the A2A payment system have been upgraded significantly in recent years. The transaction cost for A2A payments is also significantly lower than for the card system, as several intermediaries are taken out of the picture. Data from Swipp and Vipps regarding the Danish and Norwegian markets suggests that A2A transaction fees are ~90% below the already cheap domestic payment schemes. This is where the headache for card companies begins. Mobile payment solutions, such as Apple Pay, could be suitable for A2A, effectively infringing on the market in which card companies have operated for a long time. The same goes for the banks.
QFS's technology must remain relevant and tuned in to the changing landscape of consumer payment methods. As methods change, investments from the company will be needed for it to adapt. Additionally, new payment methods such as A2A solutions may prove harder to monetise using current payment methods.
Marketing material commissioned by Qliro Group 47
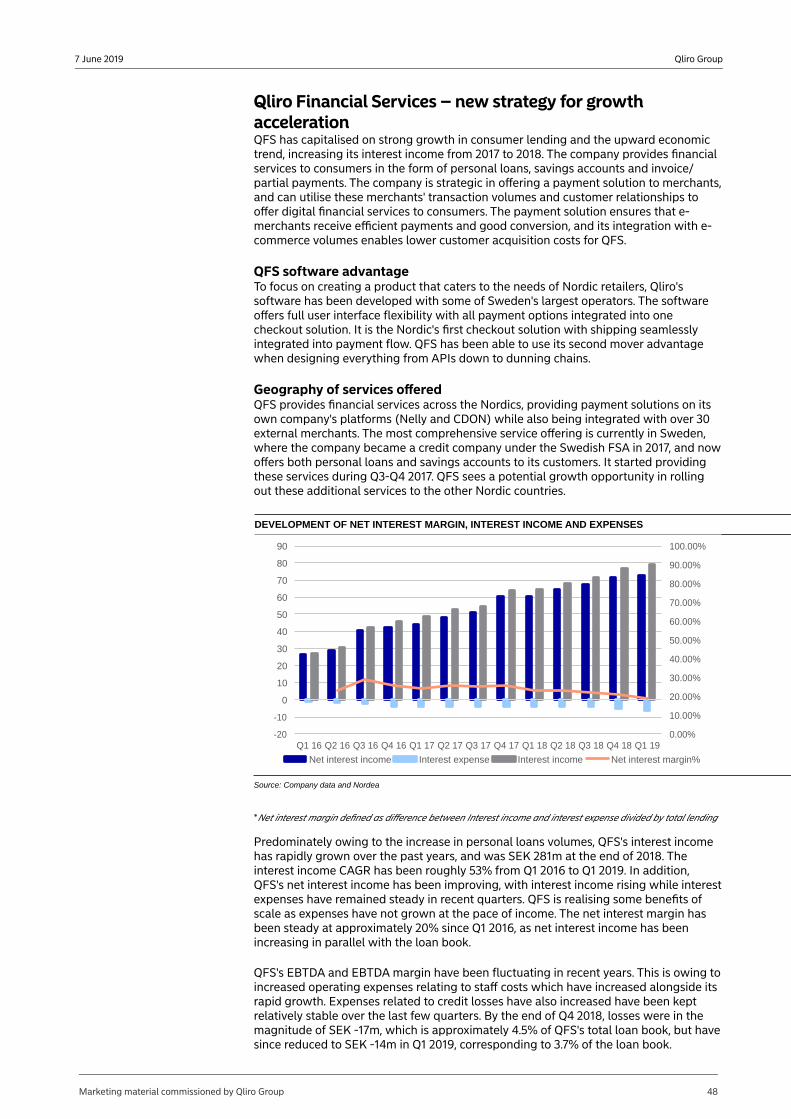
Qliro Group7 June 2019
Qliro Financial Services – new strategy for growth accelerationQFS has capitalised on strong growth in consumer lending and the upward economic trend, increasing its interest income from 2017 to 2018. The company provides financial services to consumers in the form of personal loans, savings accounts and invoice/partial payments. The company is strategic in offering a payment solution to merchants, and can utilise these merchants' transaction volumes and customer relationships to offer digital financial services to consumers. The payment solution ensures that e-merchants receive efficient payments and good conversion, and its integration with e-commerce volumes enables lower customer acquisition costs for QFS.
QFS software advantage To focus on creating a product that caters to the needs of Nordic retailers, Qliro's software has been developed with some of Sweden's largest operators. The software offers full user interface flexibility with all payment options integrated into one checkout solution. It is the Nordic's first checkout solution with shipping seamlessly integrated into payment flow. QFS has been able to use its second mover advantage when designing everything from APIs down to dunning chains.
Geography of services offeredQFS provides financial services across the Nordics, providing payment solutions on its own company's platforms (Nelly and CDON) while also being integrated with over 30 external merchants. The most comprehensive service offering is currently in Sweden, where the company became a credit company under the Swedish FSA in 2017, and now offers both personal loans and savings accounts to its customers. It started providing these services during Q3-Q4 2017. QFS sees a potential growth opportunity in rolling out these additional services to the other Nordic countries.
DEVELOPMENT OF NET INTEREST MARGIN, INTEREST INCOME AND EXPENSES
0.00%
10.00%
20.00%
30.00%
40.00%
50.00%
60.00%
70.00%
80.00%
90.00%
100.00%
-20
-10
0
10
20
30
40
50
60
70
80
90
Q1 16 Q2 16 Q3 16 Q4 16 Q1 17 Q2 17 Q3 17 Q4 17 Q1 18 Q2 18 Q3 18 Q4 18 Q1 19
Net interest income Interest expense Interest income Net interest margin%
Source: Company data and Nordea
*Net interest margin defined as difference between Interest income and interest expense divided by total lending
Predominately owing to the increase in personal loans volumes, QFS's interest income has rapidly grown over the past years, and was SEK 281m at the end of 2018. The interest income CAGR has been roughly 53% from Q1 2016 to Q1 2019. In addition, QFS's net interest income has been improving, with interest income rising while interest expenses have remained steady in recent quarters. QFS is realising some benefits of scale as expenses have not grown at the pace of income. The net interest margin has been steady at approximately 20% since Q1 2016, as net interest income has been increasing in parallel with the loan book.
QFS's EBTDA and EBTDA margin have been fluctuating in recent years. This is owing to increased operating expenses relating to staff costs which have increased alongside its rapid growth. Expenses related to credit losses have also increased have been kept relatively stable over the last few quarters. By the end of Q4 2018, losses were in the magnitude of SEK -17m, which is approximately 4.5% of QFS's total loan book, but have since reduced to SEK -14m in Q1 2019, corresponding to 3.7% of the loan book.
Marketing material commissioned by Qliro Group 48
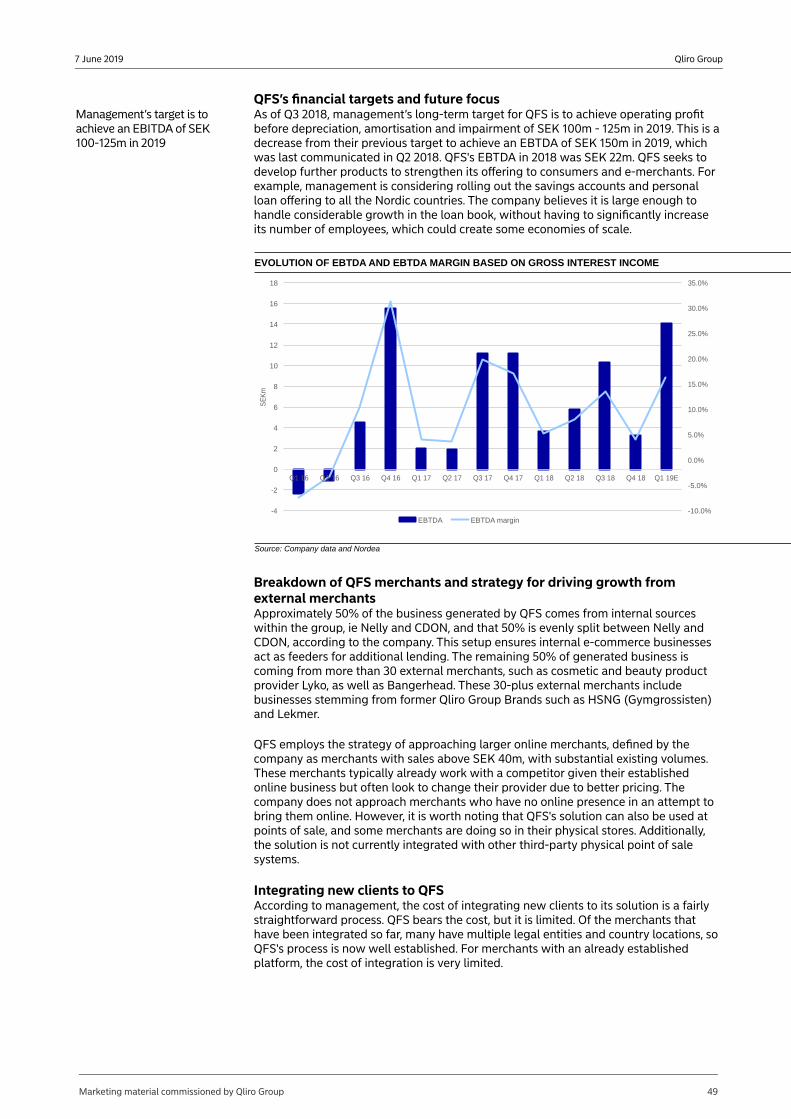
Qliro Group7 June 2019
QFS’s financial targets and future focusManagement’s target is to achieve an EBITDA of SEK 100-125m in 2019
As of Q3 2018, management’s long-term target for QFS is to achieve operating profit before depreciation, amortisation and impairment of SEK 100m - 125m in 2019. This is a decrease from their previous target to achieve an EBTDA of SEK 150m in 2019, which was last communicated in Q2 2018. QFS's EBTDA in 2018 was SEK 22m. QFS seeks to develop further products to strengthen its offering to consumers and e-merchants. For example, management is considering rolling out the savings accounts and personal loan offering to all the Nordic countries. The company believes it is large enough to handle considerable growth in the loan book, without having to significantly increase its number of employees, which could create some economies of scale.
EVOLUTION OF EBTDA AND EBTDA MARGIN BASED ON GROSS INTEREST INCOME
-10.0%
-5.0%
0.0%
5.0%
10.0%
15.0%
20.0%
25.0%
30.0%
35.0%
-4
-2
0
2
4
6
8
10
12
14
16
18
Q1 16 Q2 16 Q3 16 Q4 16 Q1 17 Q2 17 Q3 17 Q4 17 Q1 18 Q2 18 Q3 18 Q4 18 Q1 19E
SE
Km
EBTDA EBTDA margin
Source: Company data and Nordea
Breakdown of QFS merchants and strategy for driving growth from external merchantsApproximately 50% of the business generated by QFS comes from internal sources within the group, ie Nelly and CDON, and that 50% is evenly split between Nelly and CDON, according to the company. This setup ensures internal e-commerce businesses act as feeders for additional lending. The remaining 50% of generated business is coming from more than 30 external merchants, such as cosmetic and beauty product provider Lyko, as well as Bangerhead. These 30-plus external merchants include businesses stemming from former Qliro Group Brands such as HSNG (Gymgrossisten) and Lekmer.
QFS employs the strategy of approaching larger online merchants, defined by the company as merchants with sales above SEK 40m, with substantial existing volumes. These merchants typically already work with a competitor given their established online business but often look to change their provider due to better pricing. The company does not approach merchants who have no online presence in an attempt to bring them online. However, it is worth noting that QFS's solution can also be used at points of sale, and some merchants are doing so in their physical stores. Additionally, the solution is not currently integrated with other third-party physical point of sale systems.
Integrating new clients to QFSAccording to management, the cost of integrating new clients to its solution is a fairly straightforward process. QFS bears the cost, but it is limited. Of the merchants that have been integrated so far, many have multiple legal entities and country locations, so QFS's process is now well established. For merchants with an already established platform, the cost of integration is very limited.
Marketing material commissioned by Qliro Group 49
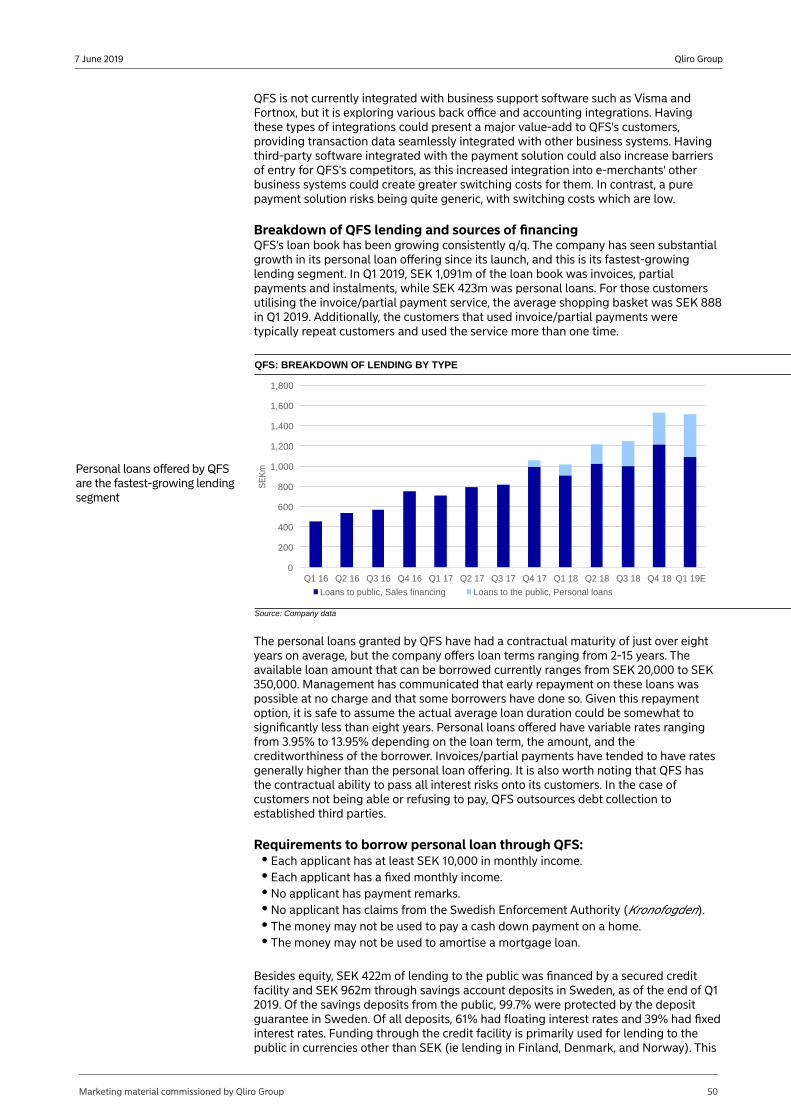
Qliro Group7 June 2019
QFS is not currently integrated with business support software such as Visma and Fortnox, but it is exploring various back office and accounting integrations. Having these types of integrations could present a major value-add to QFS's customers, providing transaction data seamlessly integrated with other business systems. Having third-party software integrated with the payment solution could also increase barriers of entry for QFS's competitors, as this increased integration into e-merchants' other business systems could create greater switching costs for them. In contrast, a pure payment solution risks being quite generic, with switching costs which are low.
Breakdown of QFS lending and sources of financing QFS’s loan book has been growing consistently q/q. The company has seen substantial growth in its personal loan offering since its launch, and this is its fastest-growing lending segment. In Q1 2019, SEK 1,091m of the loan book was invoices, partial payments and instalments, while SEK 423m was personal loans. For those customers utilising the invoice/partial payment service, the average shopping basket was SEK 888 in Q1 2019. Additionally, the customers that used invoice/partial payments were typically repeat customers and used the service more than one time.
QFS: BREAKDOWN OF LENDING BY TYPE
Personal loans offered by QFS are the fastest-growing lending segment
0
200
400
600
800
1,000
1,200
1,400
1,600
1,800
Q1 16 Q2 16 Q3 16 Q4 16 Q1 17 Q2 17 Q3 17 Q4 17 Q1 18 Q2 18 Q3 18 Q4 18 Q1 19E
SE
Km
Loans to public, Sales financing Loans to the public, Personal loans
Source: Company data
The personal loans granted by QFS have had a contractual maturity of just over eight years on average, but the company offers loan terms ranging from 2-15 years. The available loan amount that can be borrowed currently ranges from SEK 20,000 to SEK 350,000. Management has communicated that early repayment on these loans was possible at no charge and that some borrowers have done so. Given this repayment option, it is safe to assume the actual average loan duration could be somewhat to significantly less than eight years. Personal loans offered have variable rates ranging from 3.95% to 13.95% depending on the loan term, the amount, and the creditworthiness of the borrower. Invoices/partial payments have tended to have rates generally higher than the personal loan offering. It is also worth noting that QFS has the contractual ability to pass all interest risks onto its customers. In the case of customers not being able or refusing to pay, QFS outsources debt collection to established third parties.
Requirements to borrow personal loan through QFS:
Each applicant has at least SEK 10,000 in monthly income.Each applicant has a fixed monthly income.No applicant has payment remarks.No applicant has claims from the Swedish Enforcement Authority (Kronofogden).The money may not be used to pay a cash down payment on a home.The money may not be used to amortise a mortgage loan.
Besides equity, SEK 422m of lending to the public was financed by a secured credit facility and SEK 962m through savings account deposits in Sweden, as of the end of Q1 2019. Of the savings deposits from the public, 99.7% were protected by the deposit guarantee in Sweden. Of all deposits, 61% had floating interest rates and 39% had fixed interest rates. Funding through the credit facility is primarily used for lending to the public in currencies other than SEK (ie lending in Finland, Denmark, and Norway). This
Marketing material commissioned by Qliro Group 50
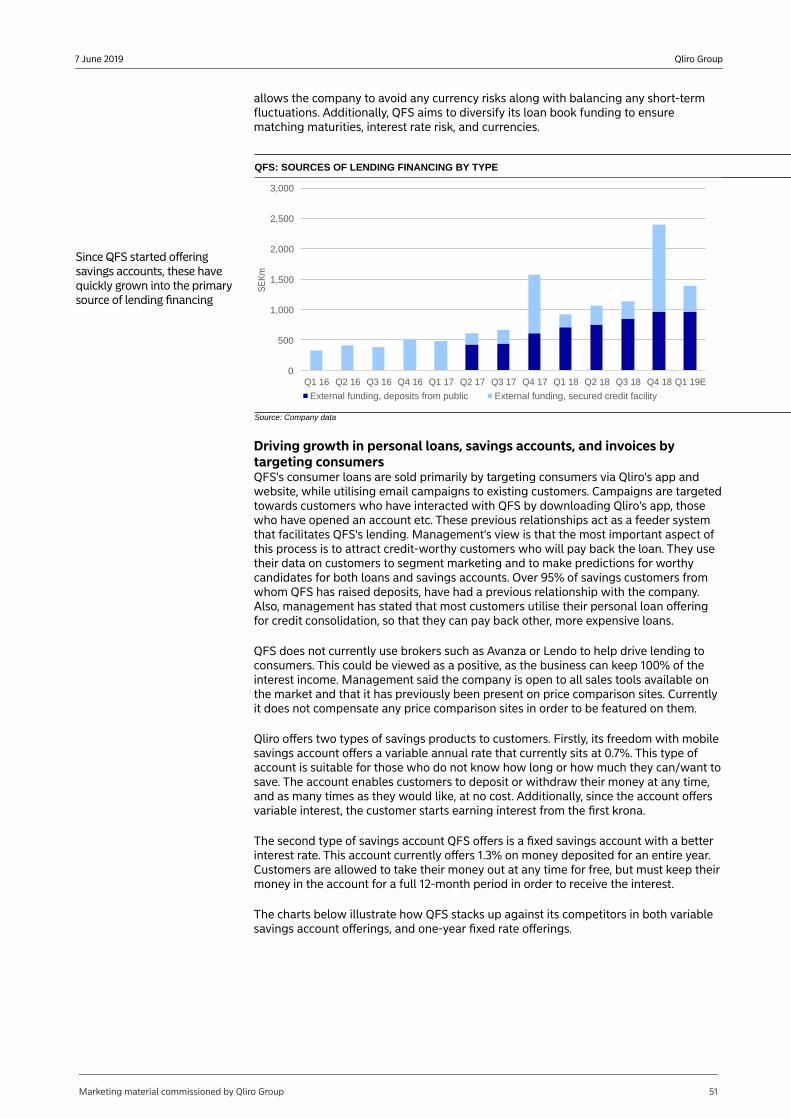
Qliro Group7 June 2019
allows the company to avoid any currency risks along with balancing any short-term fluctuations. Additionally, QFS aims to diversify its loan book funding to ensure matching maturities, interest rate risk, and currencies.
QFS: SOURCES OF LENDING FINANCING BY TYPE
Since QFS started offering savings accounts, these have quickly grown into the primary source of lending financing
0
500
1,000
1,500
2,000
2,500
3,000
Q1 16 Q2 16 Q3 16 Q4 16 Q1 17 Q2 17 Q3 17 Q4 17 Q1 18 Q2 18 Q3 18 Q4 18 Q1 19E
SE
Km
External funding, deposits from public External funding, secured credit facility
Source: Company data
Driving growth in personal loans, savings accounts, and invoices by targeting consumersQFS's consumer loans are sold primarily by targeting consumers via Qliro's app and website, while utilising email campaigns to existing customers. Campaigns are targeted towards customers who have interacted with QFS by downloading Qliro's app, those who have opened an account etc. These previous relationships act as a feeder system that facilitates QFS's lending. Management's view is that the most important aspect of this process is to attract credit-worthy customers who will pay back the loan. They use their data on customers to segment marketing and to make predictions for worthy candidates for both loans and savings accounts. Over 95% of savings customers from whom QFS has raised deposits, have had a previous relationship with the company. Also, management has stated that most customers utilise their personal loan offering for credit consolidation, so that they can pay back other, more expensive loans.
QFS does not currently use brokers such as Avanza or Lendo to help drive lending to consumers. This could be viewed as a positive, as the business can keep 100% of the interest income. Management said the company is open to all sales tools available on the market and that it has previously been present on price comparison sites. Currently it does not compensate any price comparison sites in order to be featured on them.
Qliro offers two types of savings products to customers. Firstly, its freedom with mobile savings account offers a variable annual rate that currently sits at 0.7%. This type of account is suitable for those who do not know how long or how much they can/want to save. The account enables customers to deposit or withdraw their money at any time, and as many times as they would like, at no cost. Additionally, since the account offers variable interest, the customer starts earning interest from the first krona.
The second type of savings account QFS offers is a fixed savings account with a better interest rate. This account currently offers 1.3% on money deposited for an entire year. Customers are allowed to take their money out at any time for free, but must keep their money in the account for a full 12-month period in order to receive the interest.
The charts below illustrate how QFS stacks up against its competitors in both variable savings account offerings, and one-year fixed rate offerings.
Marketing material commissioned by Qliro Group 51
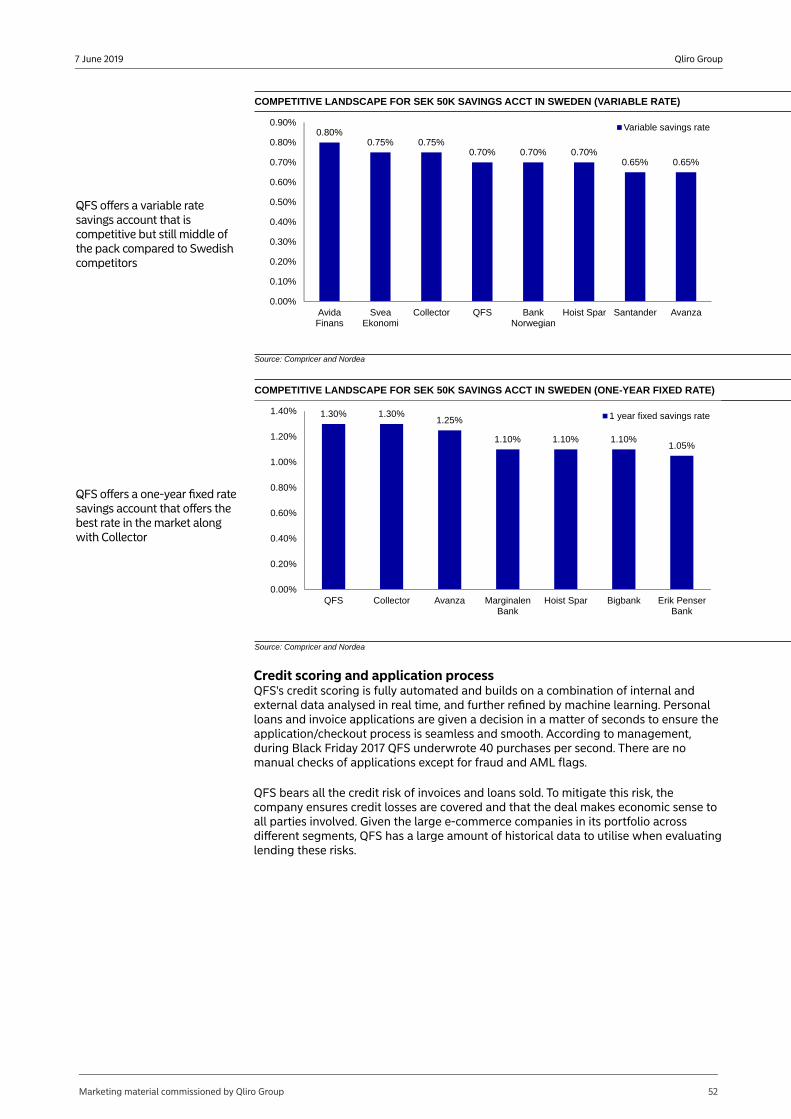
Qliro Group7 June 2019
COMPETITIVE LANDSCAPE FOR SEK 50K SAVINGS ACCT IN SWEDEN (VARIABLE RATE)
QFS offers a variable rate savings account that is competitive but still middle of the pack compared to Swedish competitors
0.80%0.75% 0.75%
0.70% 0.70% 0.70%0.65% 0.65%
0.00%
0.10%
0.20%
0.30%
0.40%
0.50%
0.60%
0.70%
0.80%
0.90%
AvidaFinans
SveaEkonomi
Collector QFS BankNorwegian
Hoist Spar Santander Avanza
Variable savings rate
Source: Compricer and Nordea
COMPETITIVE LANDSCAPE FOR SEK 50K SAVINGS ACCT IN SWEDEN (ONE-YEAR FIXED RATE)
QFS offers a one-year fixed rate savings account that offers the best rate in the market along with Collector
1.30% 1.30%1.25%
1.10% 1.10% 1.10%1.05%
0.00%
0.20%
0.40%
0.60%
0.80%
1.00%
1.20%
1.40%
QFS Collector Avanza MarginalenBank
Hoist Spar Bigbank Erik PenserBank
1 year fixed savings rate
Source: Compricer and Nordea
Credit scoring and application processQFS's credit scoring is fully automated and builds on a combination of internal and external data analysed in real time, and further refined by machine learning. Personal loans and invoice applications are given a decision in a matter of seconds to ensure the application/checkout process is seamless and smooth. According to management, during Black Friday 2017 QFS underwrote 40 purchases per second. There are no manual checks of applications except for fraud and AML flags.
QFS bears all the credit risk of invoices and loans sold. To mitigate this risk, the company ensures credit losses are covered and that the deal makes economic sense to all parties involved. Given the large e-commerce companies in its portfolio across different segments, QFS has a large amount of historical data to utilise when evaluating lending these risks.
Marketing material commissioned by Qliro Group 52
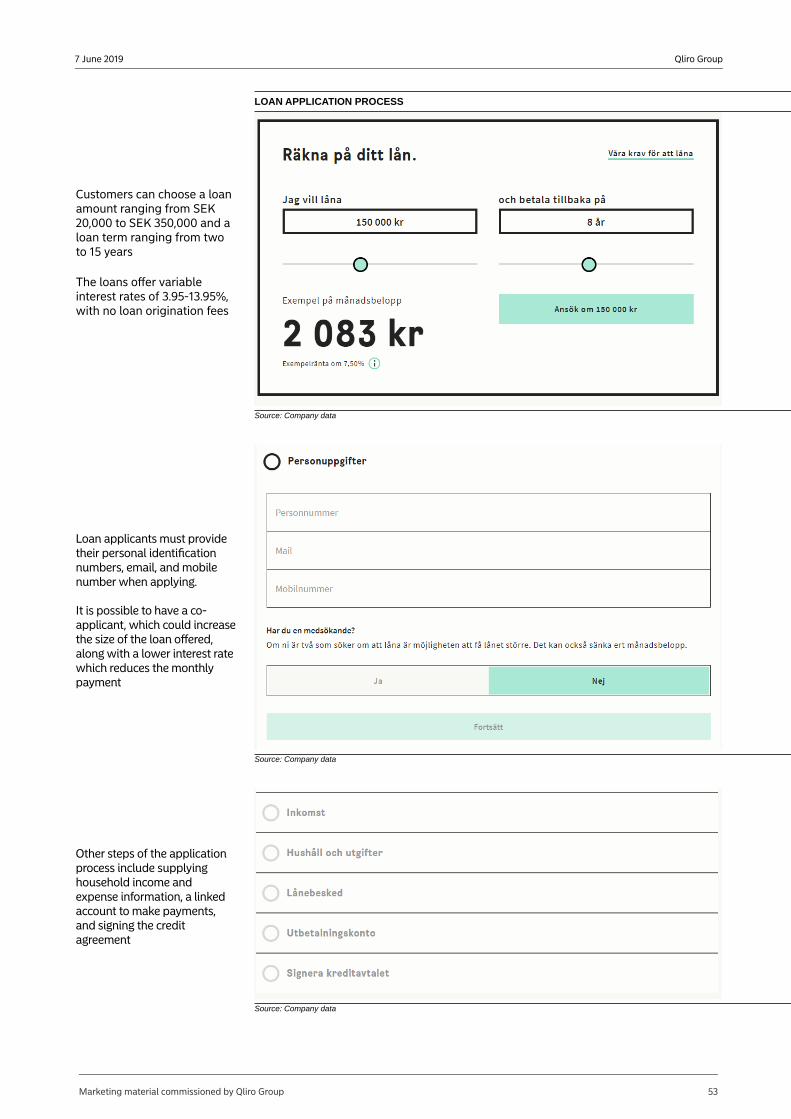
Qliro Group7 June 2019
LOAN APPLICATION PROCESS
Customers can choose a loan amount ranging from SEK 20,000 to SEK 350,000 and a loan term ranging from two to 15 years
The loans offer variable interest rates of 3.95-13.95%, with no loan origination fees
Source: Company data
Loan applicants must provide their personal identification numbers, email, and mobile number when applying.
It is possible to have a co-applicant, which could increase the size of the loan offered, along with a lower interest rate which reduces the monthly payment
Source: Company data
Other steps of the application process include supplying household income and expense information, a linked account to make payments, and signing the credit agreement
Source: Company data
Marketing material commissioned by Qliro Group 53
Qliro Group7 June 2019
When deciding to make a loan, QFS uses credit information collected from UC. UC is Sweden's leading business and credit reference agency, gathering and processing consumer information so that lending companies can make intelligent decisions. If approved, borrowers are notified via e-mail or post.
Focus during 2019As part of its strategy going forward, the company has decided to focus on the following goals during 2019:
Attract more external merchantsGrow the loan book, especially in personal loansDemonstrate the scalability of the business
Marketing material commissioned by Qliro Group 54
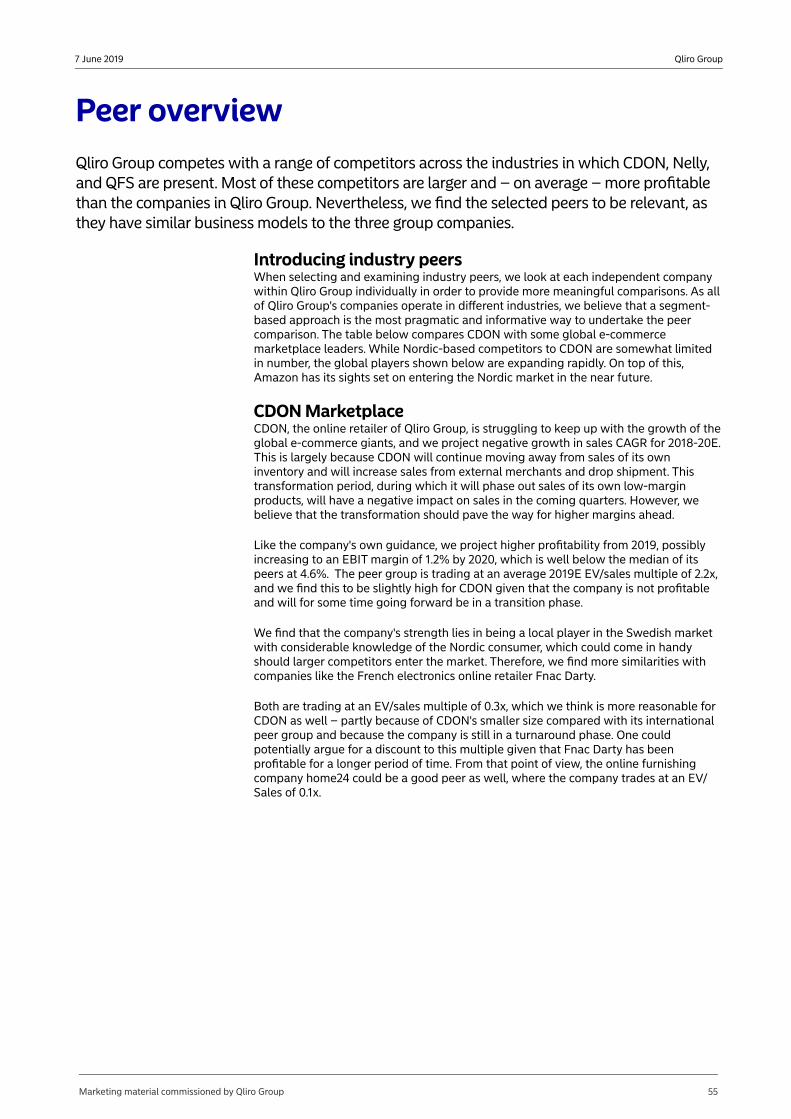
Qliro Group7 June 2019
Peer overviewQliro Group competes with a range of competitors across the industries in which CDON, Nelly, and QFS are present. Most of these competitors are larger and – on average – more profitable than the companies in Qliro Group. Nevertheless, we find the selected peers to be relevant, as they have similar business models to the three group companies.
Introducing industry peers When selecting and examining industry peers, we look at each independent company within Qliro Group individually in order to provide more meaningful comparisons. As all of Qliro Group's companies operate in different industries, we believe that a segment-based approach is the most pragmatic and informative way to undertake the peer comparison. The table below compares CDON with some global e-commerce marketplace leaders. While Nordic-based competitors to CDON are somewhat limited in number, the global players shown below are expanding rapidly. On top of this, Amazon has its sights set on entering the Nordic market in the near future.
CDON Marketplace CDON, the online retailer of Qliro Group, is struggling to keep up with the growth of the global e-commerce giants, and we project negative growth in sales CAGR for 2018-20E. This is largely because CDON will continue moving away from sales of its own inventory and will increase sales from external merchants and drop shipment. This transformation period, during which it will phase out sales of its own low-margin products, will have a negative impact on sales in the coming quarters. However, we believe that the transformation should pave the way for higher margins ahead.
Like the company's own guidance, we project higher profitability from 2019, possibly increasing to an EBIT margin of 1.2% by 2020, which is well below the median of its peers at 4.6%. The peer group is trading at an average 2019E EV/sales multiple of 2.2x, and we find this to be slightly high for CDON given that the company is not profitable and will for some time going forward be in a transition phase.
We find that the company's strength lies in being a local player in the Swedish market with considerable knowledge of the Nordic consumer, which could come in handy should larger competitors enter the market. Therefore, we find more similarities with companies like the French electronics online retailer Fnac Darty.
Both are trading at an EV/sales multiple of 0.3x, which we think is more reasonable for CDON as well – partly because of CDON's smaller size compared with its international peer group and because the company is still in a turnaround phase. One could potentially argue for a discount to this multiple given that Fnac Darty has been profitable for a longer period of time. From that point of view, the online furnishing company home24 could be a good peer as well, where the company trades at an EV/Sales of 0.1x.
Marketing material commissioned by Qliro Group 55
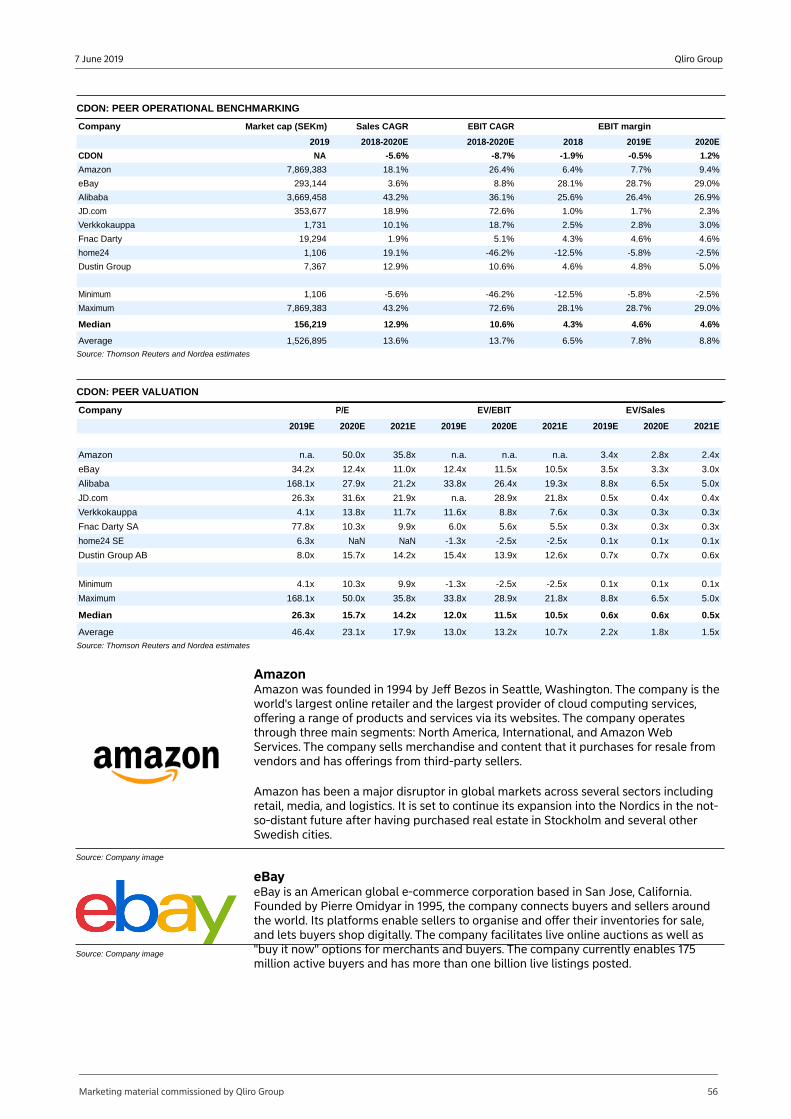
Qliro Group7 June 2019
CDON: PEER OPERATIONAL BENCHMARKING
Company Market cap (SEKm) Sales CAGR EBIT CAGR EBIT margin
2019 2018-2020E 2018-2020E 2018 2019E 2020E
CDON NA -5.6% -8.7% -1.9% -0.5% 1.2%
Amazon 7,869,383 18.1% 26.4% 6.4% 7.7% 9.4%
eBay 293,144 3.6% 8.8% 28.1% 28.7% 29.0%
Alibaba 3,669,458 43.2% 36.1% 25.6% 26.4% 26.9%
JD.com 353,677 18.9% 72.6% 1.0% 1.7% 2.3%
Verkkokauppa 1,731 10.1% 18.7% 2.5% 2.8% 3.0%
Fnac Darty 19,294 1.9% 5.1% 4.3% 4.6% 4.6%
home24 1,106 19.1% -46.2% -12.5% -5.8% -2.5%
Dustin Group 7,367 12.9% 10.6% 4.6% 4.8% 5.0%
Minimum 1,106 -5.6% -46.2% -12.5% -5.8% -2.5%
Maximum 7,869,383 43.2% 72.6% 28.1% 28.7% 29.0%
Median 156,219 12.9% 10.6% 4.3% 4.6% 4.6%
Average 1,526,895 13.6% 13.7% 6.5% 7.8% 8.8%
Source: Thomson Reuters and Nordea estimates
CDON: PEER VALUATION
Company P/E
2019E 2020E 2021E 2019E 2020E 2021E 2019E 2020E 2021E
Amazon n.a. 50.0x 35.8x n.a. n.a. n.a. 3.4x 2.8x 2.4x
eBay 34.2x 12.4x 11.0x 12.4x 11.5x 10.5x 3.5x 3.3x 3.0x
Alibaba 168.1x 27.9x 21.2x 33.8x 26.4x 19.3x 8.8x 6.5x 5.0x
JD.com 26.3x 31.6x 21.9x n.a. 28.9x 21.8x 0.5x 0.4x 0.4x
Verkkokauppa 4.1x 13.8x 11.7x 11.6x 8.8x 7.6x 0.3x 0.3x 0.3x
Fnac Darty SA 77.8x 10.3x 9.9x 6.0x 5.6x 5.5x 0.3x 0.3x 0.3x
home24 SE 6.3x NaN NaN -1.3x -2.5x -2.5x 0.1x 0.1x 0.1x
Dustin Group AB 8.0x 15.7x 14.2x 15.4x 13.9x 12.6x 0.7x 0.7x 0.6x
Minimum 4.1x 10.3x 9.9x -1.3x -2.5x -2.5x 0.1x 0.1x 0.1x
Maximum 168.1x 50.0x 35.8x 33.8x 28.9x 21.8x 8.8x 6.5x 5.0x
Median 26.3x 15.7x 14.2x 12.0x 11.5x 10.5x 0.6x 0.6x 0.5x
Average 46.4x 23.1x 17.9x 13.0x 13.2x 10.7x 2.2x 1.8x 1.5x
EV/EBIT EV/Sales
Source: Thomson Reuters and Nordea estimates
Source: Company image
AmazonAmazon was founded in 1994 by Jeff Bezos in Seattle, Washington. The company is the world's largest online retailer and the largest provider of cloud computing services, offering a range of products and services via its websites. The company operates through three main segments: North America, International, and Amazon Web Services. The company sells merchandise and content that it purchases for resale from vendors and has offerings from third-party sellers.
Amazon has been a major disruptor in global markets across several sectors including retail, media, and logistics. It is set to continue its expansion into the Nordics in the not-so-distant future after having purchased real estate in Stockholm and several other Swedish cities.
Source: Company image
eBayeBay is an American global e-commerce corporation based in San Jose, California. Founded by Pierre Omidyar in 1995, the company connects buyers and sellers around the world. Its platforms enable sellers to organise and offer their inventories for sale, and lets buyers shop digitally. The company facilitates live online auctions as well as "buy it now" options for merchants and buyers. The company currently enables 175 million active buyers and has more than one billion live listings posted.
Marketing material commissioned by Qliro Group 56
Qliro Group7 June 2019
Source: Company image
AlibabaAlibaba Group was founded in 1999 by Jack Ma in Hangzhou, China. The company is primarily engaged in online and mobile commerce by providing an offering of products and services along with technology that enables e-merchants to sell and operate internationally via digital channels. Its business comprises core commerce, cloud computing, digital media and entertainment, and innovation initiatives. Additionally, the group owns a 33% stake in Ant Financial, the financial services company that provides payment and financial solutions to consumers and merchants on its platforms.
Source: Company image
JD.comJD.com, which is also known as Jingdong, is a Chinese e-commerce company that was founded in 1998 and is headquartered in Beijing. It is China's largest online retailer and the country's biggest overall retailer. The company has more than 300 million active annual customers and 500-plus warehouses. It posted net revenue of USD 55.7bn in 2017 and achieved average annual revenue growth of 44.2% during 2014-17.
Source: Company image
VerkkokauppaVerkkokauppa.com Oyj is Finland's largest, most well-known and most visited online retailer, offering more than 65,000 different items in 25 major categories. The company sells products through its four megastores and at 2,500 pickup locations in Finland; it also offers home delivery and installation. The company was established in 1992 and it has over 550 employees in four locations. It sells computers, mobile phones, digital cameras, navigators, white and brown goods, tools, toys, accessories, components, and computers. The company also has over 250 private-label brands and over 1,000 private-label products. The company is perhaps CDON's closest listed peer in the Nordics, with revenue of EUR 478m in 2018. 12% of this represents share of sale online, which corresponds to EUR ~58m. The online store received around 57 million store visits in 2018. Rite Ventures, which is one of the main shareholders in Qliro, is one of the shareholders in Verkkokauppa.
Source: Company image
Fnac DartyFnac Darty SA operates as an omni-channel retailer in household appliances, electronics, and entertainment products in France-Switzerland, Iberian Peninsula, and Benelux. It also provides editorial products, such as hard copy and digital and household appliances. As of October 18 2018, the company owned and franchised a network of 758 stores. The company was formerly known as Groupe Fnac société anonyme. Fnac Darty was founded in 1954 and is headquartered in Ivry-sur-Seine, France.
Source: Company image
DustinThe Dustin Group offers online IT products and services in Sweden, Denmark, Finland, Norway, and the Netherlands. It operates through three segments: small and medium-sized businesses, large corporates, public sector, and business to consumer. The company sells hardware, software, and related services and solutions. It sells its products through the online platform and relationship and consultative selling under the Dustin brand. The company was founded in 1984 and is headquartered in Nacka Strand, Sweden.
Marketing material commissioned by Qliro Group 57
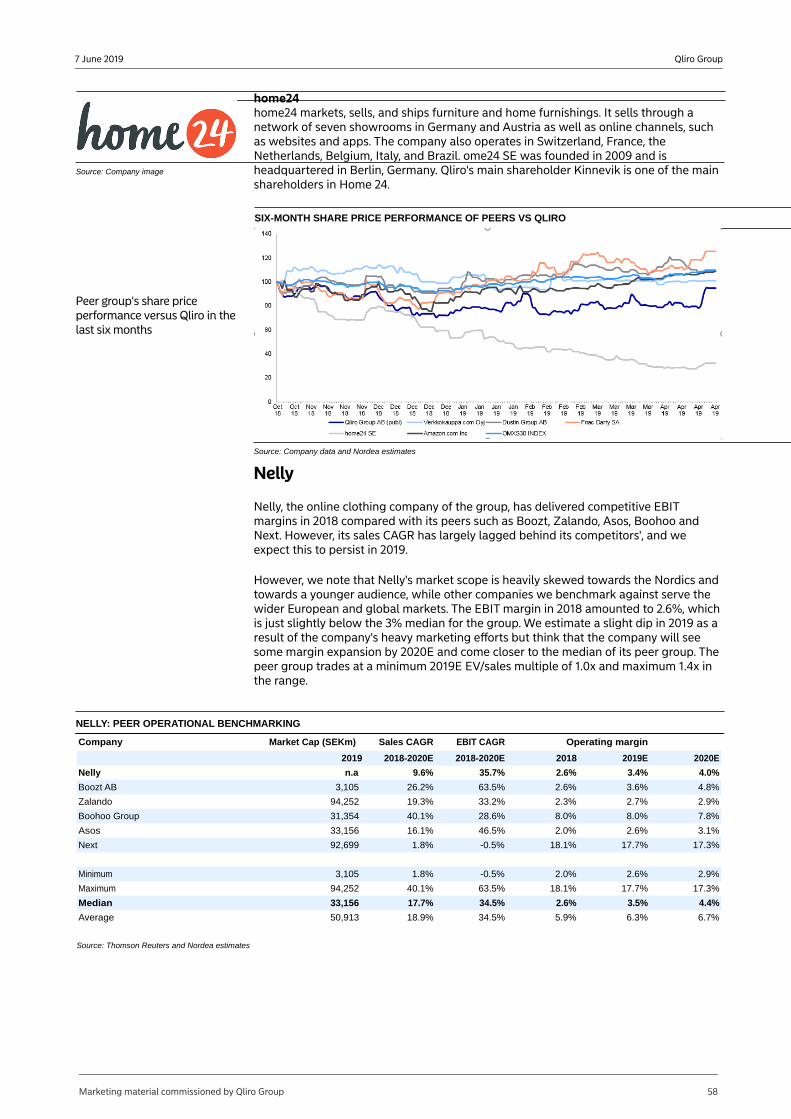
Qliro Group7 June 2019
Source: Company image
home24 home24 markets, sells, and ships furniture and home furnishings. It sells through a network of seven showrooms in Germany and Austria as well as online channels, such as websites and apps. The company also operates in Switzerland, France, the Netherlands, Belgium, Italy, and Brazil. ome24 SE was founded in 2009 and is headquartered in Berlin, Germany. Qliro's main shareholder Kinnevik is one of the main shareholders in Home 24.
Peer group's share price performance versus Qliro in the last six months
SIX-MONTH SHARE PRICE PERFORMANCE OF PEERS VS QLIRO
Source: Company data and Nordea estimates
Nelly
Nelly, the online clothing company of the group, has delivered competitive EBIT margins in 2018 compared with its peers such as Boozt, Zalando, Asos, Boohoo and Next. However, its sales CAGR has largely lagged behind its competitors', and we expect this to persist in 2019.
However, we note that Nelly's market scope is heavily skewed towards the Nordics and towards a younger audience, while other companies we benchmark against serve the wider European and global markets. The EBIT margin in 2018 amounted to 2.6%, which is just slightly below the 3% median for the group. We estimate a slight dip in 2019 as a result of the company's heavy marketing efforts but think that the company will see some margin expansion by 2020E and come closer to the median of its peer group. The peer group trades at a minimum 2019E EV/sales multiple of 1.0x and maximum 1.4x in the range.
NELLY: PEER OPERATIONAL BENCHMARKING
Company Market Cap (SEKm) Sales CAGR EBIT CAGR Operating margin
2019 2018-2020E 2018-2020E 2018 2019E 2020E
Nelly n.a 9.6% 35.7% 2.6% 3.4% 4.0%
Boozt AB 3,105 26.2% 63.5% 2.6% 3.6% 4.8%
Zalando 94,252 19.3% 33.2% 2.3% 2.7% 2.9%
Boohoo Group 31,354 40.1% 28.6% 8.0% 8.0% 7.8%
Asos 33,156 16.1% 46.5% 2.0% 2.6% 3.1%
Next 92,699 1.8% -0.5% 18.1% 17.7% 17.3%
Minimum 3,105 1.8% -0.5% 2.0% 2.6% 2.9%
Maximum 94,252 40.1% 63.5% 18.1% 17.7% 17.3%
Median 33,156 17.7% 34.5% 2.6% 3.5% 4.4%
Average 50,913 18.9% 34.5% 5.9% 6.3% 6.7%
Source: Thomson Reuters and Nordea estimates
Marketing material commissioned by Qliro Group 58
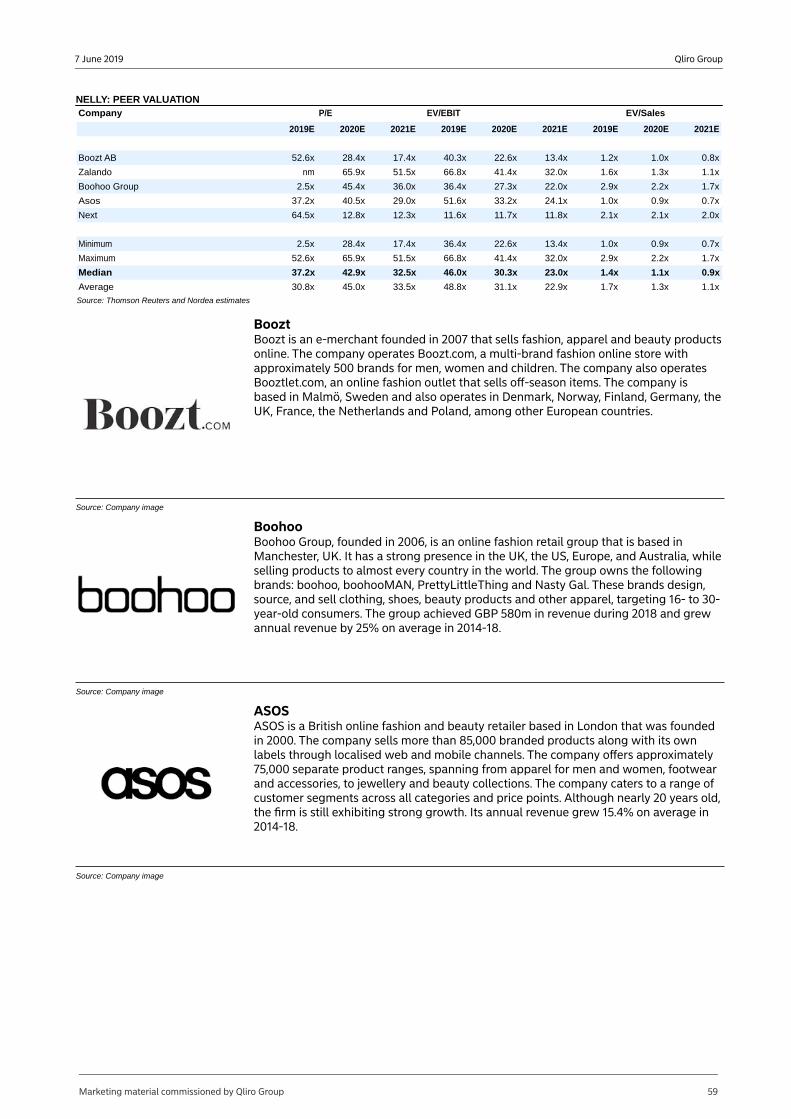
Qliro Group7 June 2019
NELLY: PEER VALUATIONCompany P/E EV/EBIT EV/Sales
2019E 2020E 2021E 2019E 2020E 2021E 2019E 2020E 2021E
Boozt AB 52.6x 28.4x 17.4x 40.3x 22.6x 13.4x 1.2x 1.0x 0.8x
Zalando nm 65.9x 51.5x 66.8x 41.4x 32.0x 1.6x 1.3x 1.1x
Boohoo Group 2.5x 45.4x 36.0x 36.4x 27.3x 22.0x 2.9x 2.2x 1.7x
Asos 37.2x 40.5x 29.0x 51.6x 33.2x 24.1x 1.0x 0.9x 0.7x
Next 64.5x 12.8x 12.3x 11.6x 11.7x 11.8x 2.1x 2.1x 2.0x
Minimum 2.5x 28.4x 17.4x 36.4x 22.6x 13.4x 1.0x 0.9x 0.7x
Maximum 52.6x 65.9x 51.5x 66.8x 41.4x 32.0x 2.9x 2.2x 1.7x
Median 37.2x 42.9x 32.5x 46.0x 30.3x 23.0x 1.4x 1.1x 0.9x
Average 30.8x 45.0x 33.5x 48.8x 31.1x 22.9x 1.7x 1.3x 1.1x
Source: Thomson Reuters and Nordea estimates
Source: Company image
BooztBoozt is an e-merchant founded in 2007 that sells fashion, apparel and beauty products online. The company operates Boozt.com, a multi-brand fashion online store with approximately 500 brands for men, women and children. The company also operates Booztlet.com, an online fashion outlet that sells off-season items. The company is based in Malmö, Sweden and also operates in Denmark, Norway, Finland, Germany, the UK, France, the Netherlands and Poland, among other European countries.
Source: Company image
BoohooBoohoo Group, founded in 2006, is an online fashion retail group that is based in Manchester, UK. It has a strong presence in the UK, the US, Europe, and Australia, while selling products to almost every country in the world. The group owns the following brands: boohoo, boohooMAN, PrettyLittleThing and Nasty Gal. These brands design, source, and sell clothing, shoes, beauty products and other apparel, targeting 16- to 30-year-old consumers. The group achieved GBP 580m in revenue during 2018 and grew annual revenue by 25% on average in 2014-18.
Source: Company image
ASOSASOS is a British online fashion and beauty retailer based in London that was founded in 2000. The company sells more than 85,000 branded products along with its own labels through localised web and mobile channels. The company offers approximately 75,000 separate product ranges, spanning from apparel for men and women, footwear and accessories, to jewellery and beauty collections. The company caters to a range of customer segments across all categories and price points. Although nearly 20 years old, the firm is still exhibiting strong growth. Its annual revenue grew 15.4% on average in 2014-18.
Marketing material commissioned by Qliro Group 59
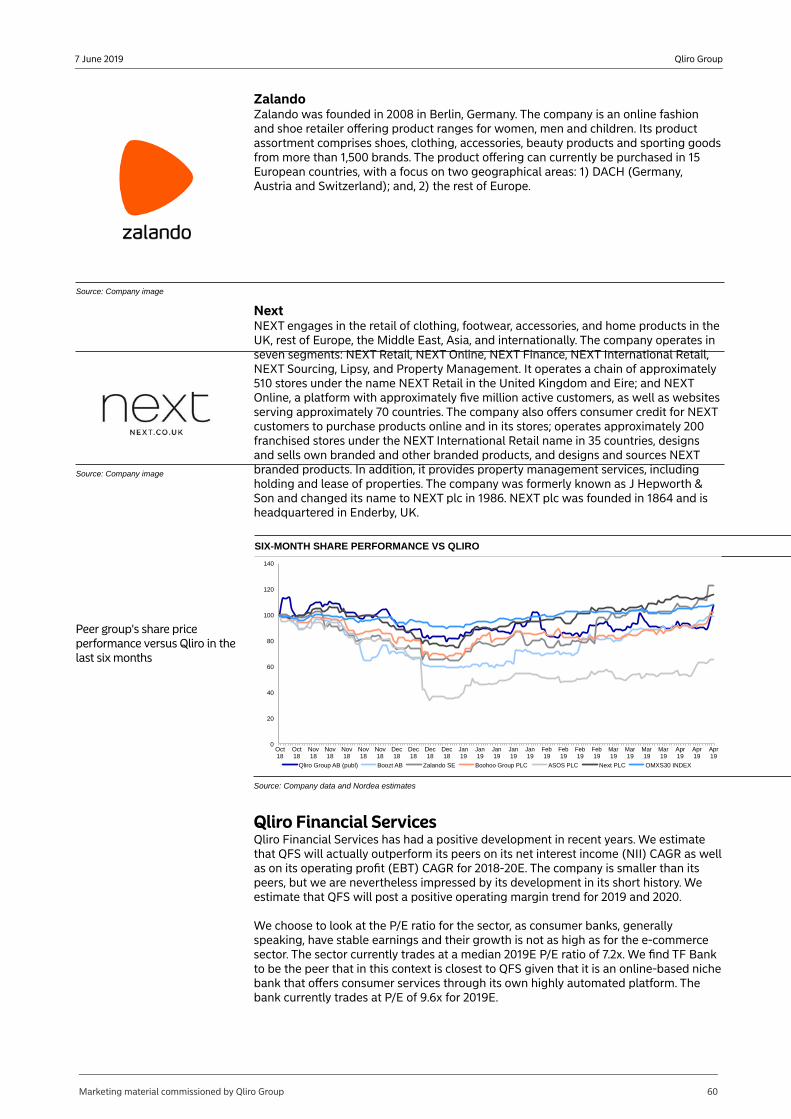
Qliro Group7 June 2019
Source: Company image
Zalando Zalando was founded in 2008 in Berlin, Germany. The company is an online fashion and shoe retailer offering product ranges for women, men and children. Its product assortment comprises shoes, clothing, accessories, beauty products and sporting goods from more than 1,500 brands. The product offering can currently be purchased in 15 European countries, with a focus on two geographical areas: 1) DACH (Germany, Austria and Switzerland); and, 2) the rest of Europe.
Source: Company image
NextNEXT engages in the retail of clothing, footwear, accessories, and home products in the UK, rest of Europe, the Middle East, Asia, and internationally. The company operates in seven segments: NEXT Retail, NEXT Online, NEXT Finance, NEXT International Retail, NEXT Sourcing, Lipsy, and Property Management. It operates a chain of approximately 510 stores under the name NEXT Retail in the United Kingdom and Eire; and NEXT Online, a platform with approximately five million active customers, as well as websites serving approximately 70 countries. The company also offers consumer credit for NEXT customers to purchase products online and in its stores; operates approximately 200 franchised stores under the NEXT International Retail name in 35 countries, designs and sells own branded and other branded products, and designs and sources NEXT branded products. In addition, it provides property management services, including holding and lease of properties. The company was formerly known as J Hepworth & Son and changed its name to NEXT plc in 1986. NEXT plc was founded in 1864 and is headquartered in Enderby, UK.
Peer group's share price performance versus Qliro in the last six months
SIX-MONTH SHARE PERFORMANCE VS QLIRO
0
20
40
60
80
100
120
140
Oct18
Oct18
Nov18
Nov18
Nov18
Nov18
Nov18
Dec18
Dec18
Dec18
Dec18
Jan19
Jan19
Jan19
Jan19
Jan19
Feb19
Feb19
Feb19
Feb19
Mar19
Mar19
Mar19
Mar19
Apr19
Apr19
Apr19
Qliro Group AB (publ) Boozt AB Zalando SE Boohoo Group PLC ASOS PLC Next PLC OMXS30 INDEX
Source: Company data and Nordea estimates
Qliro Financial ServicesQliro Financial Services has had a positive development in recent years. We estimate that QFS will actually outperform its peers on its net interest income (NII) CAGR as well as on its operating profit (EBT) CAGR for 2018-20E. The company is smaller than its peers, but we are nevertheless impressed by its development in its short history. We estimate that QFS will post a positive operating margin trend for 2019 and 2020.
We choose to look at the P/E ratio for the sector, as consumer banks, generally speaking, have stable earnings and their growth is not as high as for the e-commerce sector. The sector currently trades at a median 2019E P/E ratio of 7.2x. We find TF Bank to be the peer that in this context is closest to QFS given that it is an online-based niche bank that offers consumer services through its own highly automated platform. The bank currently trades at P/E of 9.6x for 2019E.
Marketing material commissioned by Qliro Group 60
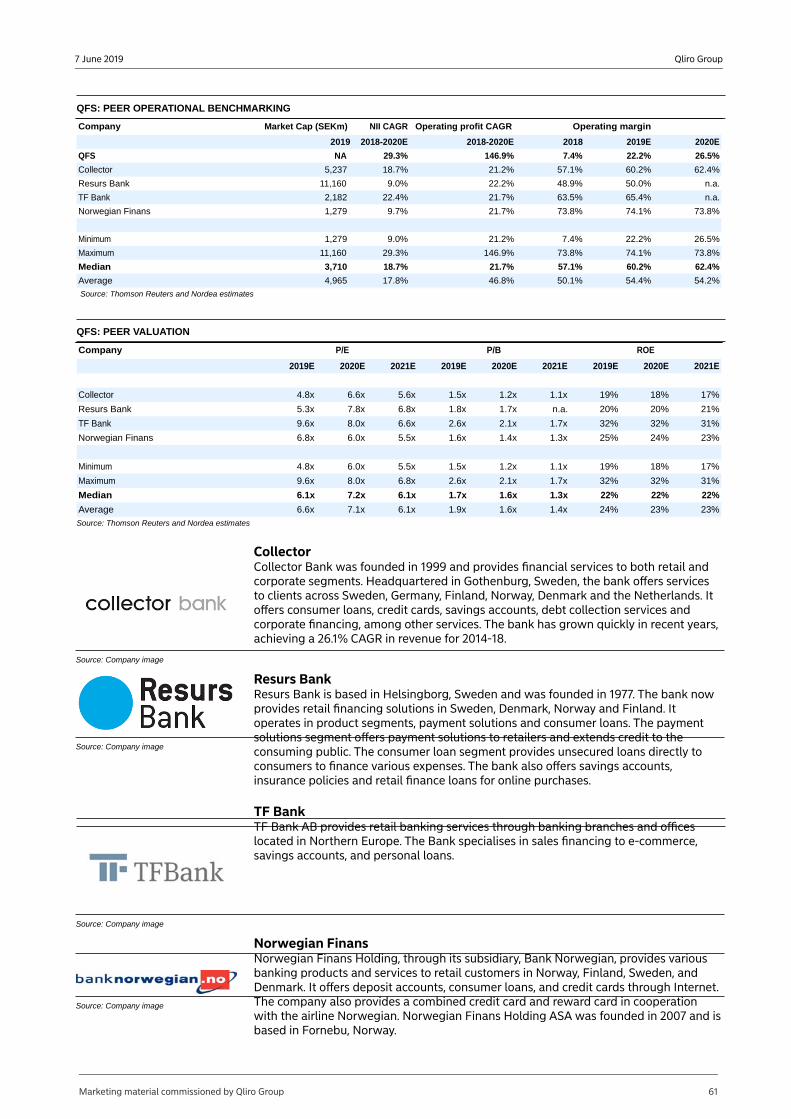
Qliro Group7 June 2019
QFS: PEER OPERATIONAL BENCHMARKING
Company Market Cap (SEKm) NII CAGR Operating profit CAGR Operating margin
2019 2018-2020E 2018-2020E 2018 2019E 2020E
QFS NA 29.3% 146.9% 7.4% 22.2% 26.5%
Collector 5,237 18.7% 21.2% 57.1% 60.2% 62.4%
Resurs Bank 11,160 9.0% 22.2% 48.9% 50.0% n.a.
TF Bank 2,182 22.4% 21.7% 63.5% 65.4% n.a.
Norwegian Finans 1,279 9.7% 21.7% 73.8% 74.1% 73.8%
Minimum 1,279 9.0% 21.2% 7.4% 22.2% 26.5%
Maximum 11,160 29.3% 146.9% 73.8% 74.1% 73.8%
Median 3,710 18.7% 21.7% 57.1% 60.2% 62.4%
Average 4,965 17.8% 46.8% 50.1% 54.4% 54.2%
Source: Thomson Reuters and Nordea estimates
QFS: PEER VALUATION
Company P/E P/B ROE
2019E 2020E 2021E 2019E 2020E 2021E 2019E 2020E 2021E
Collector 4.8x 6.6x 5.6x 1.5x 1.2x 1.1x 19% 18% 17%
Resurs Bank 5.3x 7.8x 6.8x 1.8x 1.7x n.a. 20% 20% 21%
TF Bank 9.6x 8.0x 6.6x 2.6x 2.1x 1.7x 32% 32% 31%
Norwegian Finans 6.8x 6.0x 5.5x 1.6x 1.4x 1.3x 25% 24% 23%
Minimum 4.8x 6.0x 5.5x 1.5x 1.2x 1.1x 19% 18% 17%
Maximum 9.6x 8.0x 6.8x 2.6x 2.1x 1.7x 32% 32% 31%
Median 6.1x 7.2x 6.1x 1.7x 1.6x 1.3x 22% 22% 22%
Average 6.6x 7.1x 6.1x 1.9x 1.6x 1.4x 24% 23% 23%
Source: Thomson Reuters and Nordea estimates
Source: Company image
CollectorCollector Bank was founded in 1999 and provides financial services to both retail and corporate segments. Headquartered in Gothenburg, Sweden, the bank offers services to clients across Sweden, Germany, Finland, Norway, Denmark and the Netherlands. It offers consumer loans, credit cards, savings accounts, debt collection services and corporate financing, among other services. The bank has grown quickly in recent years, achieving a 26.1% CAGR in revenue for 2014-18.
Source: Company image
Resurs BankResurs Bank is based in Helsingborg, Sweden and was founded in 1977. The bank now provides retail financing solutions in Sweden, Denmark, Norway and Finland. It operates in product segments, payment solutions and consumer loans. The payment solutions segment offers payment solutions to retailers and extends credit to the consuming public. The consumer loan segment provides unsecured loans directly to consumers to finance various expenses. The bank also offers savings accounts, insurance policies and retail finance loans for online purchases.
Source: Company image
TF BankTF Bank AB provides retail banking services through banking branches and offices located in Northern Europe. The Bank specialises in sales financing to e-commerce, savings accounts, and personal loans.
Source: Company image
Norwegian FinansNorwegian Finans Holding, through its subsidiary, Bank Norwegian, provides various banking products and services to retail customers in Norway, Finland, Sweden, and Denmark. It offers deposit accounts, consumer loans, and credit cards through Internet. The company also provides a combined credit card and reward card in cooperation with the airline Norwegian. Norwegian Finans Holding ASA was founded in 2007 and is based in Fornebu, Norway.
Marketing material commissioned by Qliro Group 61
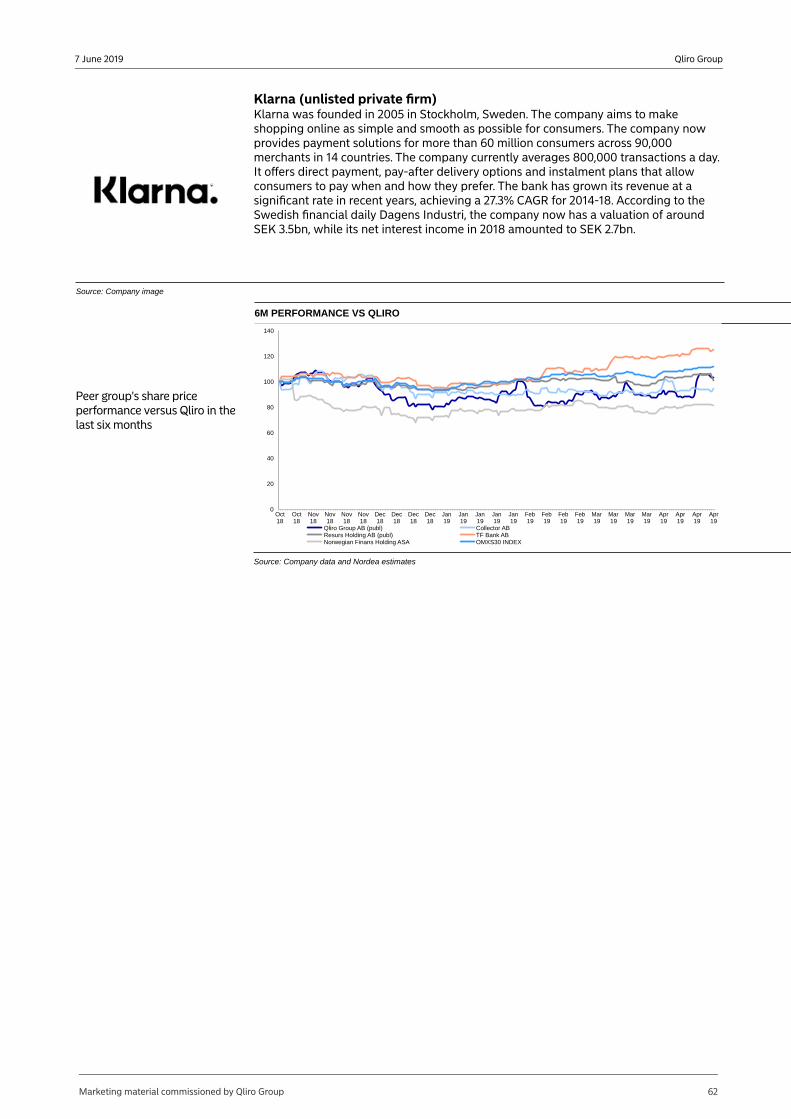
Qliro Group7 June 2019
Source: Company image
Klarna (unlisted private firm)Klarna was founded in 2005 in Stockholm, Sweden. The company aims to make shopping online as simple and smooth as possible for consumers. The company now provides payment solutions for more than 60 million consumers across 90,000 merchants in 14 countries. The company currently averages 800,000 transactions a day. It offers direct payment, pay-after delivery options and instalment plans that allow consumers to pay when and how they prefer. The bank has grown its revenue at a significant rate in recent years, achieving a 27.3% CAGR for 2014-18. According to the Swedish financial daily Dagens Industri, the company now has a valuation of around SEK 3.5bn, while its net interest income in 2018 amounted to SEK 2.7bn.
Peer group's share price performance versus Qliro in the last six months
6M PERFORMANCE VS QLIRO
0
20
40
60
80
100
120
140
Oct18
Oct18
Nov18
Nov18
Nov18
Nov18
Dec18
Dec18
Dec18
Dec18
Jan19
Jan19
Jan19
Jan19
Jan19
Feb19
Feb19
Feb19
Feb19
Mar19
Mar19
Mar19
Mar19
Apr19
Apr19
Apr19
Apr19
Qliro Group AB (publ) Collector ABResurs Holding AB (publ) TF Bank ABNorwegian Finans Holding ASA OMXS30 INDEX
Source: Company data and Nordea estimates
Marketing material commissioned by Qliro Group 62
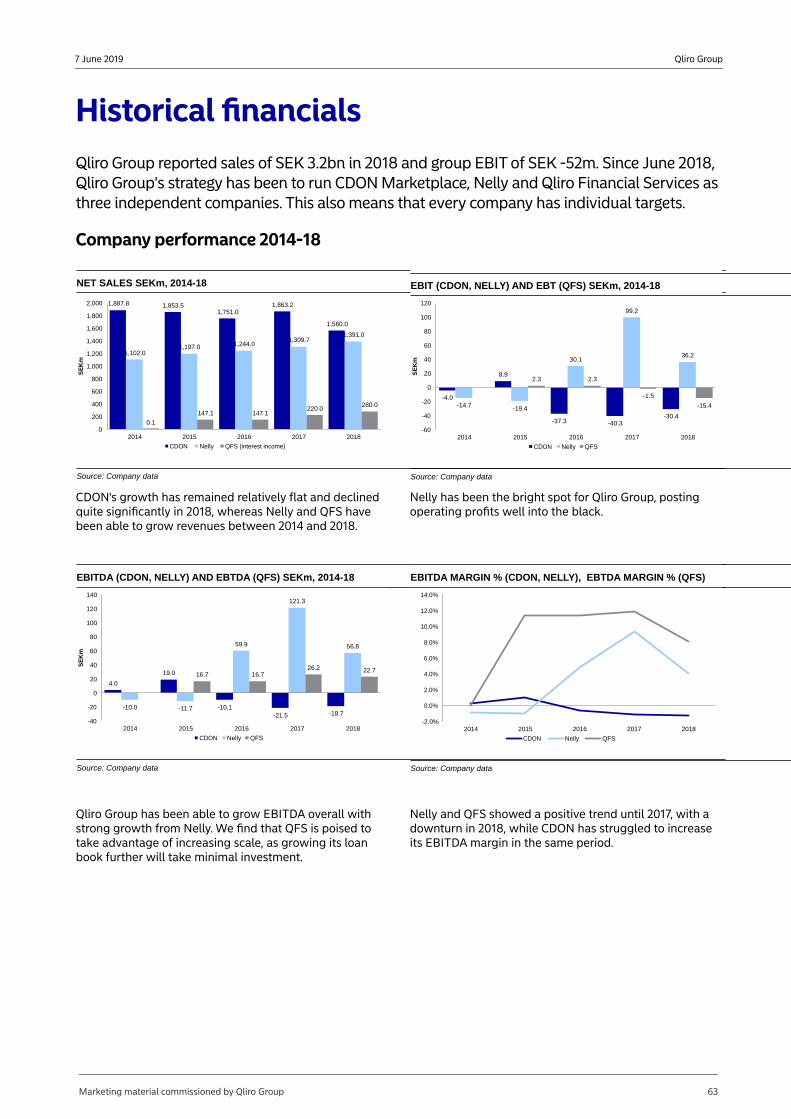
Qliro Group7 June 2019
Historical financialsQliro Group reported sales of SEK 3.2bn in 2018 and group EBIT of SEK -52m. Since June 2018, Qliro Group's strategy has been to run CDON Marketplace, Nelly and Qliro Financial Services as three independent companies. This also means that every company has individual targets.
Company performance 2014-18
NET SALES SEKm, 2014-18 EBIT (CDON, NELLY) AND EBT (QFS) SEKm, 2014-18
1,887.8 1,853.51,751.0
1,863.2
1,560.0
1,102.01,197.0 1,244.0
1,309.71,391.0
0.1
147.1 147.1220.0
280.0
0
200
400
600
800
1,000
1,200
1,400
1,600
1,800
2,000
2014 2015 2016 2017 2018
SE
Km
CDON Nelly QFS (interest income)
Source: Company data
-4.0
8.9
-37.3 -40.3-30.4
-14.7 -19.4
30.1
99.2
36.2
2.3 2.3
-1.5
-15.4
-60
-40
-20
0
20
40
60
80
100
120
2014 2015 2016 2017 2018
SE
Km
CDON Nelly QFS
Source: Company data
CDON's growth has remained relatively flat and declined quite significantly in 2018, whereas Nelly and QFS have been able to grow revenues between 2014 and 2018.
Nelly has been the bright spot for Qliro Group, posting operating profits well into the black.
EBITDA (CDON, NELLY) AND EBTDA (QFS) SEKm, 2014-18 EBITDA MARGIN % (CDON, NELLY), EBTDA MARGIN % (QFS)
4.0
19.0
-10.1-21.5 -18.7
-10.0 -11.7
59.9
121.3
56.8
16.7 16.726.2 22.7
-40
-20
0
20
40
60
80
100
120
140
2014 2015 2016 2017 2018
SE
Km
CDON Nelly QFS
Source: Company data
-2.0%
0.0%
2.0%
4.0%
6.0%
8.0%
10.0%
12.0%
14.0%
2014 2015 2016 2017 2018
CDON Nelly QFS
Source: Company data
Qliro Group has been able to grow EBITDA overall with strong growth from Nelly. We find that QFS is poised to take advantage of increasing scale, as growing its loan book further will take minimal investment.
Nelly and QFS showed a positive trend until 2017, with a downturn in 2018, while CDON has struggled to increase its EBITDA margin in the same period.
Marketing material commissioned by Qliro Group 63
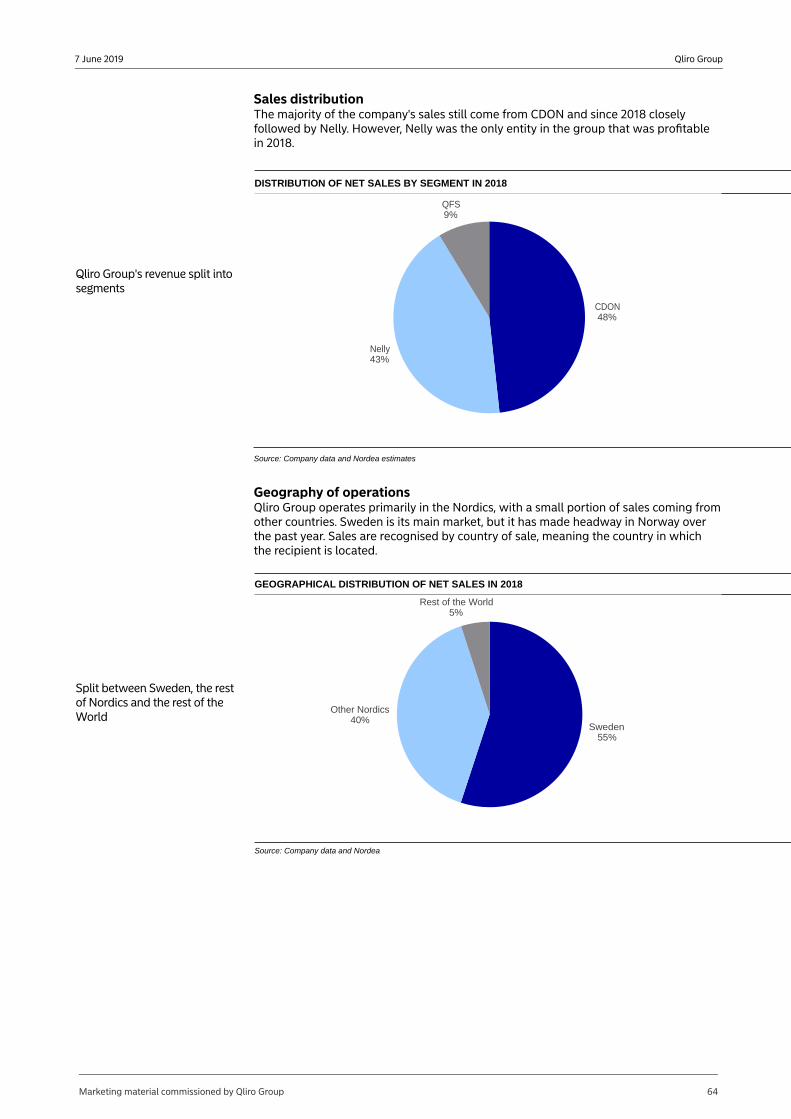
Qliro Group7 June 2019
Sales distributionThe majority of the company's sales still come from CDON and since 2018 closely followed by Nelly. However, Nelly was the only entity in the group that was profitable in 2018.
Qliro Group's revenue split into segments
DISTRIBUTION OF NET SALES BY SEGMENT IN 2018
CDON48%
Nelly43%
QFS9%
Source: Company data and Nordea estimates
Geography of operationsQliro Group operates primarily in the Nordics, with a small portion of sales coming from other countries. Sweden is its main market, but it has made headway in Norway over the past year. Sales are recognised by country of sale, meaning the country in which the recipient is located.
GEOGRAPHICAL DISTRIBUTION OF NET SALES IN 2018
Split between Sweden, the rest of Nordics and the rest of the World
Sweden55%
Other Nordics40%
Rest of the World5%
Source: Company data and Nordea
Marketing material commissioned by Qliro Group 64

Qliro Group7 June 2019
Type of salesThe majority of sales still comes from products, but services have increased vastly in the past two years, growing by 11% between 2017 and 2018. Products, on the other hand, decreased by 7% during the same period.
SALES PER TYPE OF INCOME, SEKm
2877.9 2996.7 2,780.6
280.6400.0
445.3
0
500
1,000
1,500
2,000
2,500
3,000
3,500
4,000
2016 2017 2018
SE
Km
Products Services
Source: Company data
CDON MarketplaceCDON Marketplace is still in a transition phase, whereby it is increasing the number of external merchants, supplemented by sales from its own inventories. During 2018, external merchants' sales rose by 18% to SEK 589m. The external merchants and drop shipments (delivery directly to the customer from the supplier) accounted for 42% of total sales in the marketplace.
GROSS MERCHANDISE VALUE AND GROWTH 2015-18, SEKm
2,058 2,0692,313
2,082
224 350
500589
11%
17%
22%
28%
0.00%
5.00%
10.00%
15.00%
20.00%
25.00%
30.00%
0
500
1,000
1,500
2,000
2,500
3,000
2015 2016 2017 2018
Gross merchandise value External merchants value
External Merchants development %
Source: Company data
SALES AND SALES GROWTH 2015-18, SEKm
1,854
1,751
1,863
1,560-2%
-6%
6%
-16%
2015 2016 2017 2018-20.00%
-15.00%
-10.00%
-5.00%
0.00%
5.00%
10.00%
1,200
1,300
1,400
1,500
1,600
1,700
1,800
1,900
Net sales Sales growth %
Source: Company data
EBITDA AND EBITDA MARGIN 2015-18, SEKm and %
19-10
-22
-19
1%
-1%
-1%
-1%
-1.50%
-1.00%
-0.50%
0.00%
0.50%
1.00%
1.50%
-25
-20
-15
-10
-5
0
5
10
15
20
25
2015 2016 2017 2018
EBITDA EBITDA margin%
Source: Company data
EBIT AND EBIT MARGIN 2015-18, SEKm and %
9
-37 -40 -30
0%
-2% -2%-2%
-2.50%
-2.00%
-1.50%
-1.00%
-0.50%
0.00%
0.50%
1.00%
-50
-40
-30
-20
-10
0
10
20
2015 2016 2017 2018
EBIT Series2
Source: Company data
Marketing material commissioned by Qliro Group 65
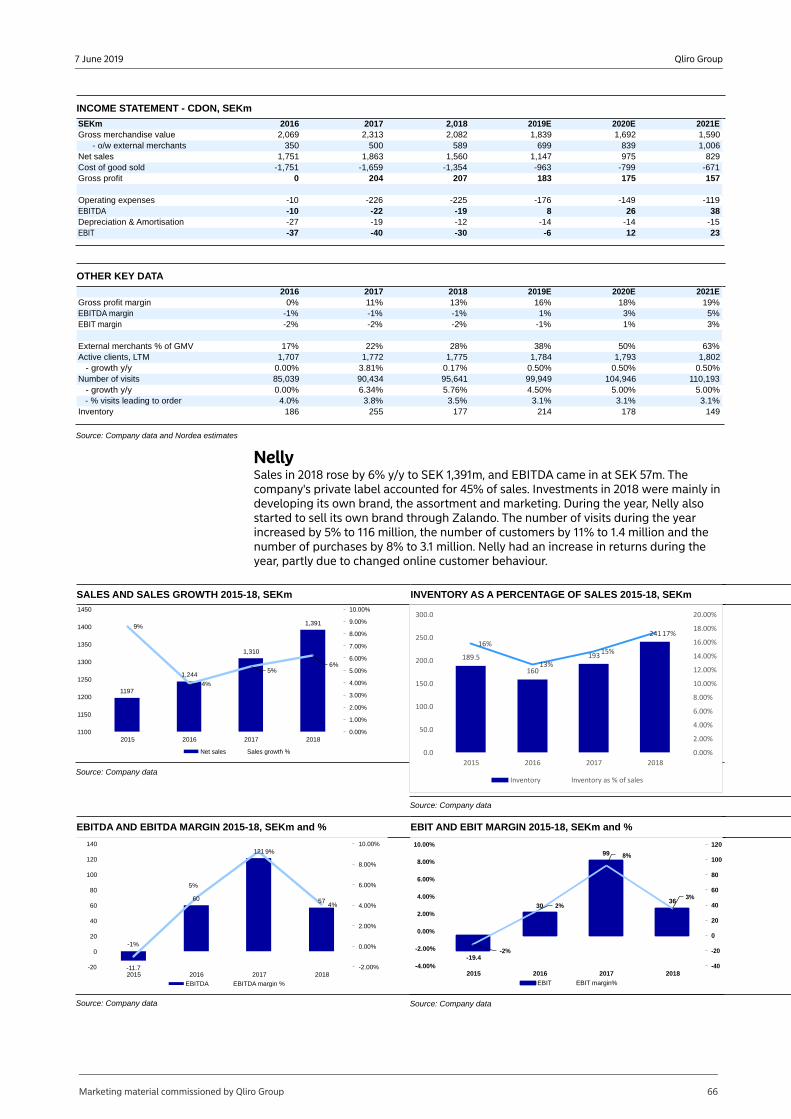
Qliro Group7 June 2019
INCOME STATEMENT - CDON, SEKm
SEKm 2016 2017 2,018 2019E 2020E 2021EGross merchandise value 2,069 2,313 2,082 1,839 1,692 1,590
- o/w external merchants 350 500 589 699 839 1,006Net sales 1,751 1,863 1,560 1,147 975 829Cost of good sold -1,751 -1,659 -1,354 -963 -799 -671Gross profit 0 204 207 183 175 157
Operating expenses -10 -226 -225 -176 -149 -119EBITDA -10 -22 -19 8 26 38Depreciation & Amortisation -27 -19 -12 -14 -14 -15EBIT -37 -40 -30 -6 12 23
OTHER KEY DATA
2016 2017 2018 2019E 2020E 2021EGross profit margin 0% 11% 13% 16% 18% 19%EBITDA margin -1% -1% -1% 1% 3% 5%EBIT margin -2% -2% -2% -1% 1% 3%
External merchants % of GMV 17% 22% 28% 38% 50% 63%Active clients, LTM 1,707 1,772 1,775 1,784 1,793 1,802
- growth y/y 0.00% 3.81% 0.17% 0.50% 0.50% 0.50%Number of visits 85,039 90,434 95,641 99,949 104,946 110,193
- growth y/y 0.00% 6.34% 5.76% 4.50% 5.00% 5.00%- % visits leading to order 4.0% 3.8% 3.5% 3.1% 3.1% 3.1%
Inventory 186 255 177 214 178 149
Source: Company data and Nordea estimates
NellySales in 2018 rose by 6% y/y to SEK 1,391m, and EBITDA came in at SEK 57m. The company's private label accounted for 45% of sales. Investments in 2018 were mainly in developing its own brand, the assortment and marketing. During the year, Nelly also started to sell its own brand through Zalando. The number of visits during the year increased by 5% to 116 million, the number of customers by 11% to 1.4 million and the number of purchases by 8% to 3.1 million. Nelly had an increase in returns during the year, partly due to changed online customer behaviour.
SALES AND SALES GROWTH 2015-18, SEKm
1197
1,244
1,310
1,3919%
4%
5%6%
0.00%
1.00%
2.00%
3.00%
4.00%
5.00%
6.00%
7.00%
8.00%
9.00%
10.00%
1100
1150
1200
1250
1300
1350
1400
1450
2015 2016 2017 2018
Net sales Sales growth %
Source: Company data
INVENTORY AS A PERCENTAGE OF SALES 2015-18, SEKm
189.5
160
193
241
16%
13%
15%
17%
0.00%
2.00%
4.00%
6.00%
8.00%
10.00%
12.00%
14.00%
16.00%
18.00%
20.00%
0.0
50.0
100.0
150.0
200.0
250.0
300.0
2015 2016 2017 2018
Inventory Inventory as % of sales
Source: Company data
EBITDA AND EBITDA MARGIN 2015-18, SEKm and %
-11.7
60
121
57
-1%
5%
9%
4%
-2.00%
0.00%
2.00%
4.00%
6.00%
8.00%
10.00%
-20
0
20
40
60
80
100
120
140
2015 2016 2017 2018
EBITDA EBITDA margin %
Source: Company data
EBIT AND EBIT MARGIN 2015-18, SEKm and %
-19.4
30
99
36
-2%
2%
8%
3%
-40
-20
0
20
40
60
80
100
120
-4.00%
-2.00%
0.00%
2.00%
4.00%
6.00%
8.00%
10.00%
2015 2016 2017 2018
EBIT EBIT margin%
Source: Company data
Marketing material commissioned by Qliro Group 66
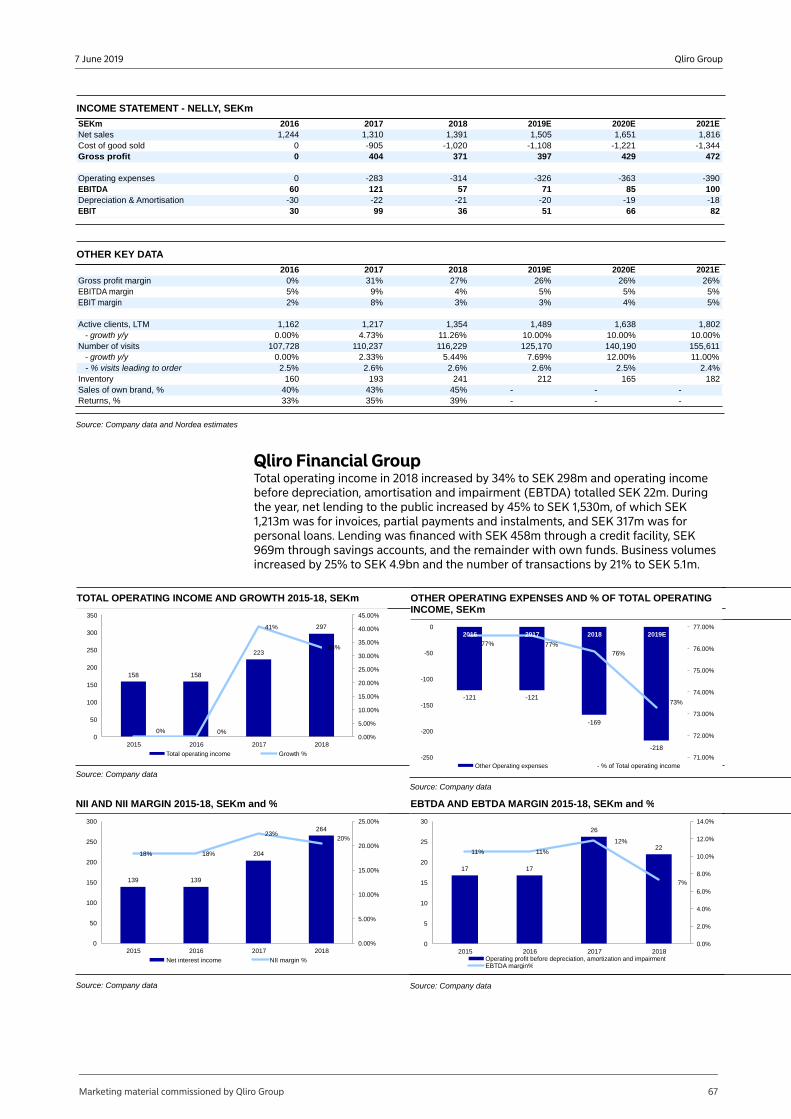
Qliro Group7 June 2019
INCOME STATEMENT - NELLY, SEKm
SEKm 2016 2017 2018 2019E 2020E 2021ENet sales 1,244 1,310 1,391 1,505 1,651 1,816Cost of good sold 0 -905 -1,020 -1,108 -1,221 -1,344Gross profit 0 404 371 397 429 472
Operating expenses 0 -283 -314 -326 -363 -390EBITDA 60 121 57 71 85 100Depreciation & Amortisation -30 -22 -21 -20 -19 -18EBIT 30 99 36 51 66 82
OTHER KEY DATA
2016 2017 2018 2019E 2020E 2021EGross profit margin 0% 31% 27% 26% 26% 26%EBITDA margin 5% 9% 4% 5% 5% 5%EBIT margin 2% 8% 3% 3% 4% 5%
Active clients, LTM 1,162 1,217 1,354 1,489 1,638 1,802- growth y/y 0.00% 4.73% 11.26% 10.00% 10.00% 10.00%
Number of visits 107,728 110,237 116,229 125,170 140,190 155,611- growth y/y 0.00% 2.33% 5.44% 7.69% 12.00% 11.00%- % visits leading to order 2.5% 2.6% 2.6% 2.6% 2.5% 2.4%
Inventory 160 193 241 212 165 182Sales of own brand, % 40% 43% 45% - - -Returns, % 33% 35% 39% - - -
Source: Company data and Nordea estimates
Qliro Financial GroupTotal operating income in 2018 increased by 34% to SEK 298m and operating income before depreciation, amortisation and impairment (EBTDA) totalled SEK 22m. During the year, net lending to the public increased by 45% to SEK 1,530m, of which SEK 1,213m was for invoices, partial payments and instalments, and SEK 317m was for personal loans. Lending was financed with SEK 458m through a credit facility, SEK 969m through savings accounts, and the remainder with own funds. Business volumes increased by 25% to SEK 4.9bn and the number of transactions by 21% to SEK 5.1m.
TOTAL OPERATING INCOME AND GROWTH 2015-18, SEKm
158 158
223
297
0% 0%
41%
33%
0.00%
5.00%
10.00%
15.00%
20.00%
25.00%
30.00%
35.00%
40.00%
45.00%
0
50
100
150
200
250
300
350
2015 2016 2017 2018
Total operating income Growth %
Source: Company data
OTHER OPERATING EXPENSES AND % OF TOTAL OPERATING INCOME, SEKm
-121 -121
-169
-218
77% 77%76%
73%
71.00%
72.00%
73.00%
74.00%
75.00%
76.00%
77.00%
-250
-200
-150
-100
-50
02016 2017 2018 2019E
Other Operating expenses - % of Total operating income
Source: Company data
NII AND NII MARGIN 2015-18, SEKm and %
139 139
204
264
18% 18%
23%20%
0.00%
5.00%
10.00%
15.00%
20.00%
25.00%
0
50
100
150
200
250
300
2015 2016 2017 2018
Net interest income NII margin %
Source: Company data
EBTDA AND EBTDA MARGIN 2015-18, SEKm and %
17 17
26
2211% 11%
12%
7%
0.0%
2.0%
4.0%
6.0%
8.0%
10.0%
12.0%
14.0%
0
5
10
15
20
25
30
2015 2016 2017 2018Operating profit before depreciation, amortization and impairmentEBTDA margin%
Source: Company data
Marketing material commissioned by Qliro Group 67
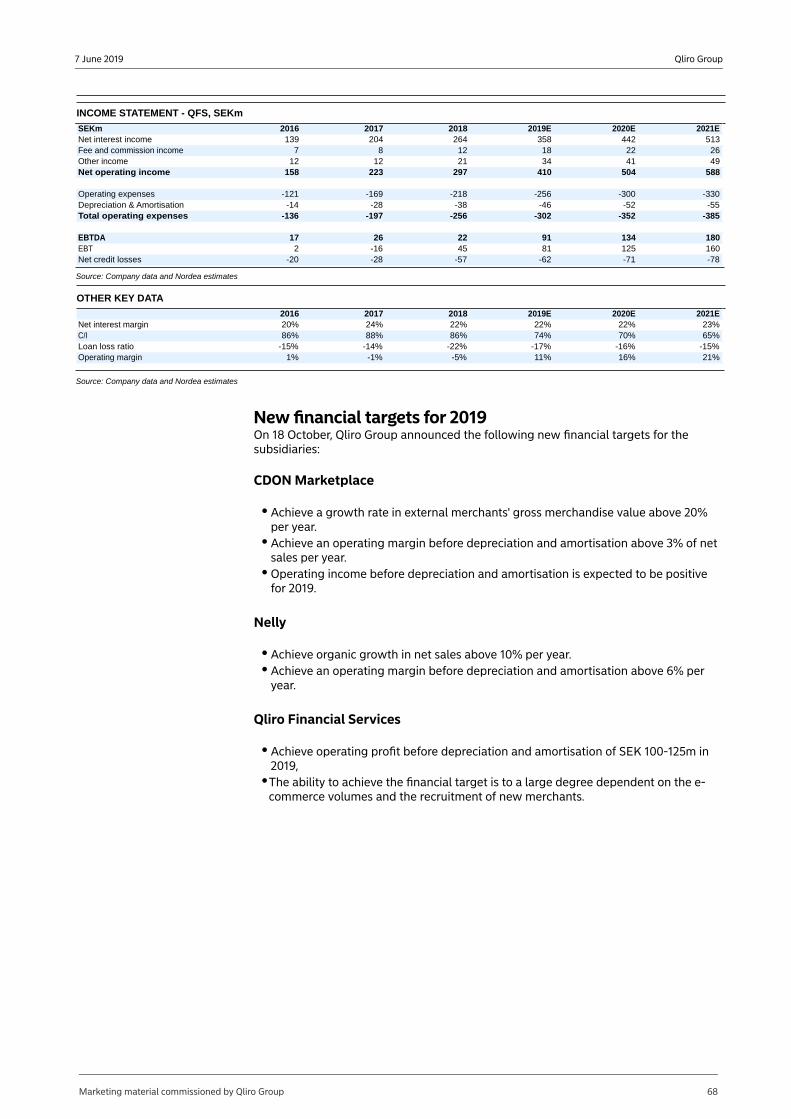
Qliro Group7 June 2019
INCOME STATEMENT - QFS, SEKm
SEKm 2016 2017 2018 2019E 2020E 2021ENet interest income 139 204 264 358 442 513Fee and commission income 7 8 12 18 22 26Other income 12 12 21 34 41 49Net operating income 158 223 297 410 504 588
Operating expenses -121 -169 -218 -256 -300 -330Depreciation & Amortisation -14 -28 -38 -46 -52 -55Total operating expenses -136 -197 -256 -302 -352 -385
EBTDA 17 26 22 91 134 180EBT 2 -16 45 81 125 160Net credit losses -20 -28 -57 -62 -71 -78
Source: Company data and Nordea estimates
OTHER KEY DATA
2016 2017 2018 2019E 2020E 2021ENet interest margin 20% 24% 22% 22% 22% 23%C/I 86% 88% 86% 74% 70% 65%Loan loss ratio -15% -14% -22% -17% -16% -15%Operating margin 1% -1% -5% 11% 16% 21%
Source: Company data and Nordea estimates
New financial targets for 2019On 18 October, Qliro Group announced the following new financial targets for the subsidiaries:
CDON Marketplace
Achieve a growth rate in external merchants' gross merchandise value above 20% per year.Achieve an operating margin before depreciation and amortisation above 3% of net sales per year.Operating income before depreciation and amortisation is expected to be positive for 2019.
Nelly
Achieve organic growth in net sales above 10% per year.Achieve an operating margin before depreciation and amortisation above 6% per year.
Qliro Financial Services
Achieve operating profit before depreciation and amortisation of SEK 100-125m in 2019,The ability to achieve the financial target is to a large degree dependent on the e-commerce volumes and the recruitment of new merchants.
Marketing material commissioned by Qliro Group 68
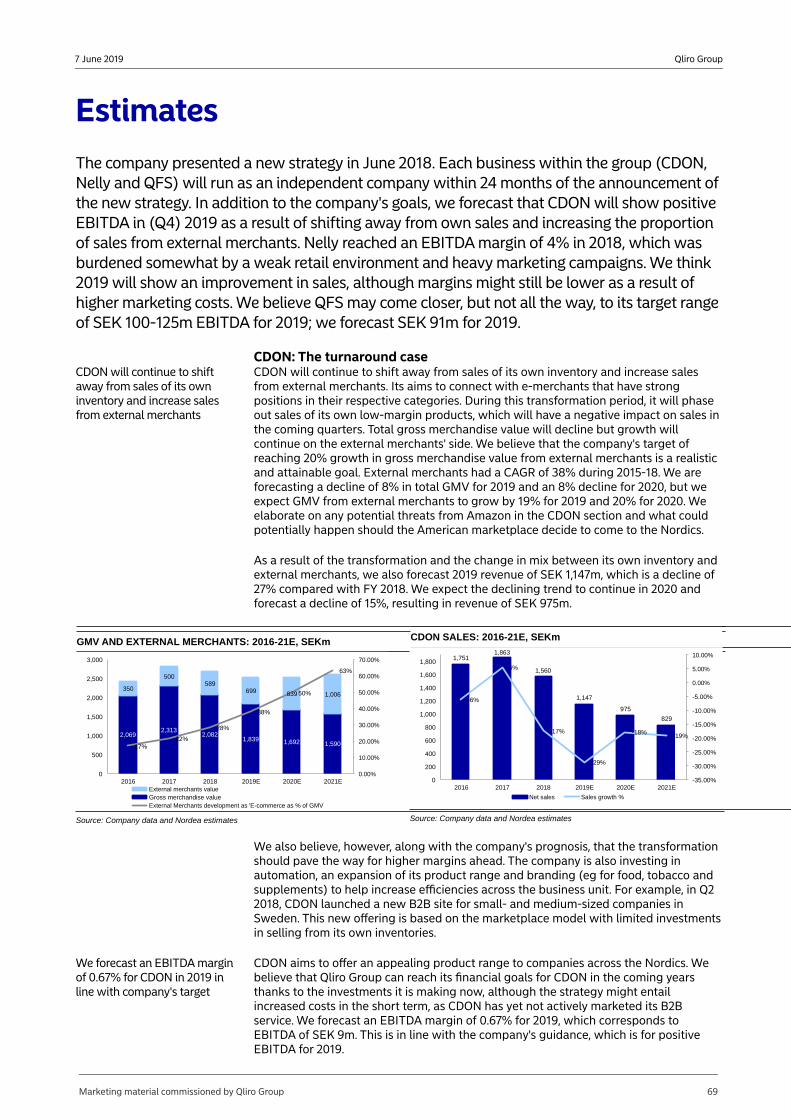
Qliro Group7 June 2019
EstimatesThe company presented a new strategy in June 2018. Each business within the group (CDON, Nelly and QFS) will run as an independent company within 24 months of the announcement of the new strategy. In addition to the company's goals, we forecast that CDON will show positive EBITDA in (Q4) 2019 as a result of shifting away from own sales and increasing the proportion of sales from external merchants. Nelly reached an EBITDA margin of 4% in 2018, which was burdened somewhat by a weak retail environment and heavy marketing campaigns. We think 2019 will show an improvement in sales, although margins might still be lower as a result of higher marketing costs. We believe QFS may come closer, but not all the way, to its target range of SEK 100-125m EBITDA for 2019; we forecast SEK 91m for 2019.
CDON: The turnaround caseCDON will continue to shift away from sales of its own inventory and increase sales from external merchants
CDON will continue to shift away from sales of its own inventory and increase sales from external merchants. Its aims to connect with e-merchants that have strong positions in their respective categories. During this transformation period, it will phase out sales of its own low-margin products, which will have a negative impact on sales in the coming quarters. Total gross merchandise value will decline but growth will continue on the external merchants' side. We believe that the company's target of reaching 20% growth in gross merchandise value from external merchants is a realistic and attainable goal. External merchants had a CAGR of 38% during 2015-18. We are forecasting a decline of 8% in total GMV for 2019 and an 8% decline for 2020, but we expect GMV from external merchants to grow by 19% for 2019 and 20% for 2020. We elaborate on any potential threats from Amazon in the CDON section and what could potentially happen should the American marketplace decide to come to the Nordics.
As a result of the transformation and the change in mix between its own inventory and external merchants, we also forecast 2019 revenue of SEK 1,147m, which is a decline of 27% compared with FY 2018. We expect the declining trend to continue in 2020 and forecast a decline of 15%, resulting in revenue of SEK 975m.
GMV AND EXTERNAL MERCHANTS: 2016-21E, SEKm
2,0692,313
2,0821,839 1,692 1,590
350
500589
699 839 1,006
17%22%
28%
38%
50%
63%
0.00%
10.00%
20.00%
30.00%
40.00%
50.00%
60.00%
70.00%
0
500
1,000
1,500
2,000
2,500
3,000
2016 2017 2018 2019E 2020E 2021EExternal merchants valueGross merchandise valueExternal Merchants development as 'E-commerce as % of GMV
Source: Company data and Nordea estimates
CDON SALES: 2016-21E, SEKm
1,7511,863
1,560
1,147
975
829
-6%
6%
-17%
-29%
-18% -19%
-35.00%
-30.00%
-25.00%
-20.00%
-15.00%
-10.00%
-5.00%
0.00%
5.00%
10.00%
0
200
400
600
800
1,000
1,200
1,400
1,600
1,800
2016 2017 2018 2019E 2020E 2021E
Net sales Sales growth %
Source: Company data and Nordea estimates
We also believe, however, along with the company's prognosis, that the transformation should pave the way for higher margins ahead. The company is also investing in automation, an expansion of its product range and branding (eg for food, tobacco and supplements) to help increase efficiencies across the business unit. For example, in Q2 2018, CDON launched a new B2B site for small- and medium-sized companies in Sweden. This new offering is based on the marketplace model with limited investments in selling from its own inventories.
We forecast an EBITDA margin of 0.67% for CDON in 2019 in line with company's target
CDON aims to offer an appealing product range to companies across the Nordics. We believe that Qliro Group can reach its financial goals for CDON in the coming years thanks to the investments it is making now, although the strategy might entail increased costs in the short term, as CDON has yet not actively marketed its B2B service. We forecast an EBITDA margin of 0.67% for 2019, which corresponds to EBITDA of SEK 9m. This is in line with the company's guidance, which is for positive EBITDA for 2019.
Marketing material commissioned by Qliro Group 69
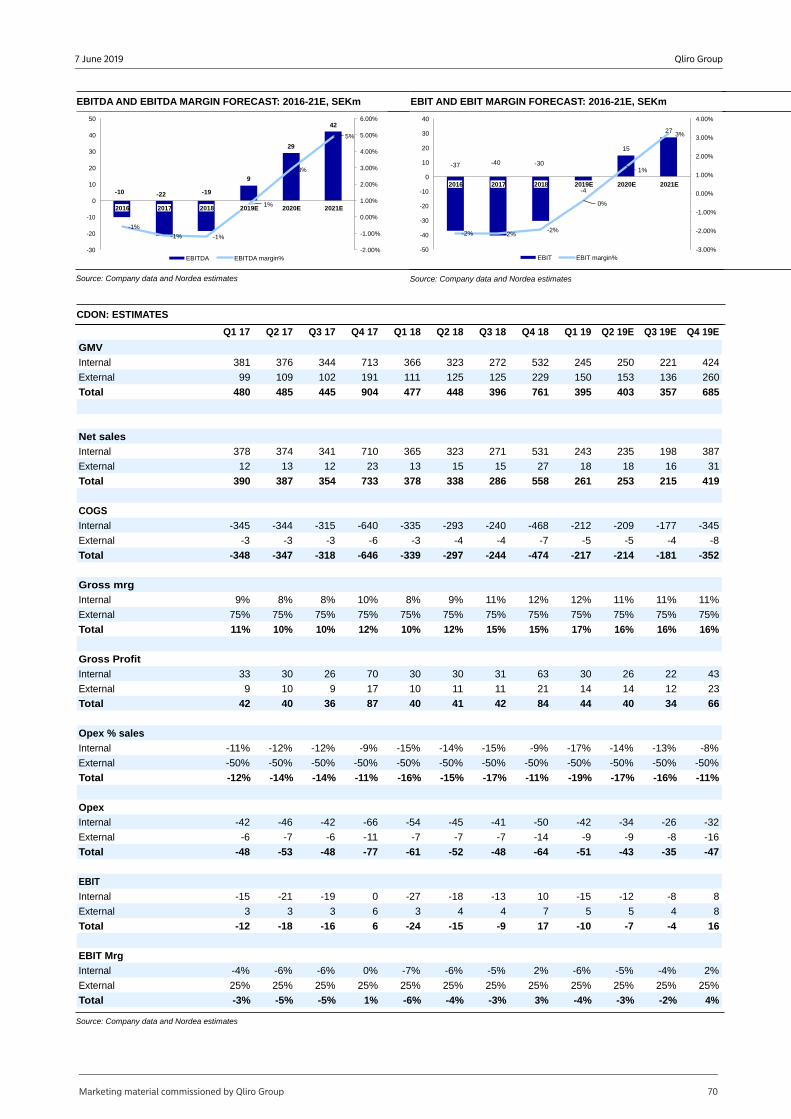
Qliro Group7 June 2019
EBITDA AND EBITDA MARGIN FORECAST: 2016-21E, SEKm
-10 -22 -19
9
29
42
-1%
-1% -1%
1%
3%
5%
-2.00%
-1.00%
0.00%
1.00%
2.00%
3.00%
4.00%
5.00%
6.00%
-30
-20
-10
0
10
20
30
40
50
2016 2017 2018 2019E 2020E 2021E
EBITDA EBITDA margin%
Source: Company data and Nordea estimates
EBIT AND EBIT MARGIN FORECAST: 2016-21E, SEKm
-37 -40 -30
-4
15
27
-2% -2%-2%
0%
1%
3%
-3.00%
-2.00%
-1.00%
0.00%
1.00%
2.00%
3.00%
4.00%
-50
-40
-30
-20
-10
0
10
20
30
40
2016 2017 2018 2019E 2020E 2021E
EBIT EBIT margin%
Source: Company data and Nordea estimates
CDON: ESTIMATES
Q1 17 Q2 17 Q3 17 Q4 17 Q1 18 Q2 18 Q3 18 Q4 18 Q1 19 Q2 19E Q3 19E Q4 19E
GMV
Internal 381 376 344 713 366 323 272 532 245 250 221 424
External 99 109 102 191 111 125 125 229 150 153 136 260
Total 480 485 445 904 477 448 396 761 395 403 357 685
Net sales
Internal 378 374 341 710 365 323 271 531 243 235 198 387
External 12 13 12 23 13 15 15 27 18 18 16 31
Total 390 387 354 733 378 338 286 558 261 253 215 419
COGS
Internal -345 -344 -315 -640 -335 -293 -240 -468 -212 -209 -177 -345
External -3 -3 -3 -6 -3 -4 -4 -7 -5 -5 -4 -8
Total -348 -347 -318 -646 -339 -297 -244 -474 -217 -214 -181 -352
Gross mrg
Internal 9% 8% 8% 10% 8% 9% 11% 12% 12% 11% 11% 11%
External 75% 75% 75% 75% 75% 75% 75% 75% 75% 75% 75% 75%
Total 11% 10% 10% 12% 10% 12% 15% 15% 17% 16% 16% 16%
Gross Profit
Internal 33 30 26 70 30 30 31 63 30 26 22 43
External 9 10 9 17 10 11 11 21 14 14 12 23
Total 42 40 36 87 40 41 42 84 44 40 34 66
Opex % sales
Internal -11% -12% -12% -9% -15% -14% -15% -9% -17% -14% -13% -8%
External -50% -50% -50% -50% -50% -50% -50% -50% -50% -50% -50% -50%
Total -12% -14% -14% -11% -16% -15% -17% -11% -19% -17% -16% -11%
Opex
Internal -42 -46 -42 -66 -54 -45 -41 -50 -42 -34 -26 -32
External -6 -7 -6 -11 -7 -7 -7 -14 -9 -9 -8 -16
Total -48 -53 -48 -77 -61 -52 -48 -64 -51 -43 -35 -47
EBIT
Internal -15 -21 -19 0 -27 -18 -13 10 -15 -12 -8 8
External 3 3 3 6 3 4 4 7 5 5 4 8
Total -12 -18 -16 6 -24 -15 -9 17 -10 -7 -4 16
EBIT Mrg
Internal -4% -6% -6% 0% -7% -6% -5% 2% -6% -5% -4% 2%
External 25% 25% 25% 25% 25% 25% 25% 25% 25% 25% 25% 25%
Total -3% -5% -5% 1% -6% -4% -3% 3% -4% -3% -2% 4%
Source: Company data and Nordea estimates
Marketing material commissioned by Qliro Group 70
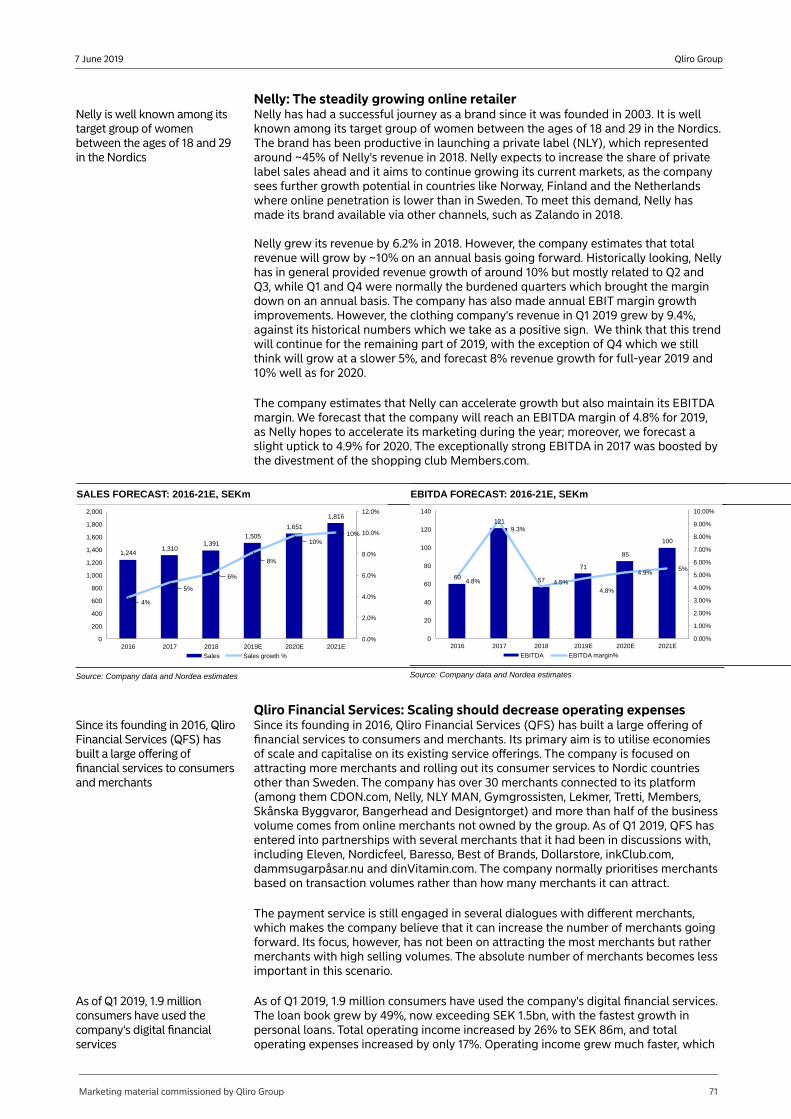
Qliro Group7 June 2019
Nelly: The steadily growing online retailerNelly is well known among its target group of women between the ages of 18 and 29 in the Nordics
Nelly has had a successful journey as a brand since it was founded in 2003. It is well known among its target group of women between the ages of 18 and 29 in the Nordics. The brand has been productive in launching a private label (NLY), which represented around ~45% of Nelly's revenue in 2018. Nelly expects to increase the share of private label sales ahead and it aims to continue growing its current markets, as the company sees further growth potential in countries like Norway, Finland and the Netherlands where online penetration is lower than in Sweden. To meet this demand, Nelly has made its brand available via other channels, such as Zalando in 2018.
Nelly grew its revenue by 6.2% in 2018. However, the company estimates that total revenue will grow by ~10% on an annual basis going forward. Historically looking, Nelly has in general provided revenue growth of around 10% but mostly related to Q2 and Q3, while Q1 and Q4 were normally the burdened quarters which brought the margin down on an annual basis. The company has also made annual EBIT margin growth improvements. However, the clothing company's revenue in Q1 2019 grew by 9.4%, against its historical numbers which we take as a positive sign. We think that this trend will continue for the remaining part of 2019, with the exception of Q4 which we still think will grow at a slower 5%, and forecast 8% revenue growth for full-year 2019 and 10% well as for 2020.
The company estimates that Nelly can accelerate growth but also maintain its EBITDA margin. We forecast that the company will reach an EBITDA margin of 4.8% for 2019, as Nelly hopes to accelerate its marketing during the year; moreover, we forecast a slight uptick to 4.9% for 2020. The exceptionally strong EBITDA in 2017 was boosted by the divestment of the shopping club Members.com.
SALES FORECAST: 2016-21E, SEKm
1,2441,310
1,3911,505
1,651
1,816
4%
5%
6%
8%
10%10%
0.0%
2.0%
4.0%
6.0%
8.0%
10.0%
12.0%
0
200
400
600
800
1,000
1,200
1,400
1,600
1,800
2,000
2016 2017 2018 2019E 2020E 2021E
Sales Sales growth %
Source: Company data and Nordea estimates
EBITDA FORECAST: 2016-21E, SEKm
60
121
57
71
85
100
4.8%
9.3%
4.5%4,8%
4.9%5%
0.00%
1.00%
2.00%
3.00%
4.00%
5.00%
6.00%
7.00%
8.00%
9.00%
10.00%
0
20
40
60
80
100
120
140
2016 2017 2018 2019E 2020E 2021E
EBITDA EBITDA margin%
Source: Company data and Nordea estimates
Qliro Financial Services: Scaling should decrease operating expensesSince its founding in 2016, Qliro Financial Services (QFS) has built a large offering of financial services to consumers and merchants
Since its founding in 2016, Qliro Financial Services (QFS) has built a large offering of financial services to consumers and merchants. Its primary aim is to utilise economies of scale and capitalise on its existing service offerings. The company is focused on attracting more merchants and rolling out its consumer services to Nordic countries other than Sweden. The company has over 30 merchants connected to its platform (among them CDON.com, Nelly, NLY MAN, Gymgrossisten, Lekmer, Tretti, Members, Skånska Byggvaror, Bangerhead and Designtorget) and more than half of the business volume comes from online merchants not owned by the group. As of Q1 2019, QFS has entered into partnerships with several merchants that it had been in discussions with, including Eleven, Nordicfeel, Baresso, Best of Brands, Dollarstore, inkClub.com, dammsugarpåsar.nu and dinVitamin.com. The company normally prioritises merchants based on transaction volumes rather than how many merchants it can attract.
The payment service is still engaged in several dialogues with different merchants, which makes the company believe that it can increase the number of merchants going forward. Its focus, however, has not been on attracting the most merchants but rather merchants with high selling volumes. The absolute number of merchants becomes less important in this scenario.
As of Q1 2019, 1.9 million consumers have used the company's digital financial services
As of Q1 2019, 1.9 million consumers have used the company's digital financial services. The loan book grew by 49%, now exceeding SEK 1.5bn, with the fastest growth in personal loans. Total operating income increased by 26% to SEK 86m, and total operating expenses increased by only 17%. Operating income grew much faster, which
Marketing material commissioned by Qliro Group 71
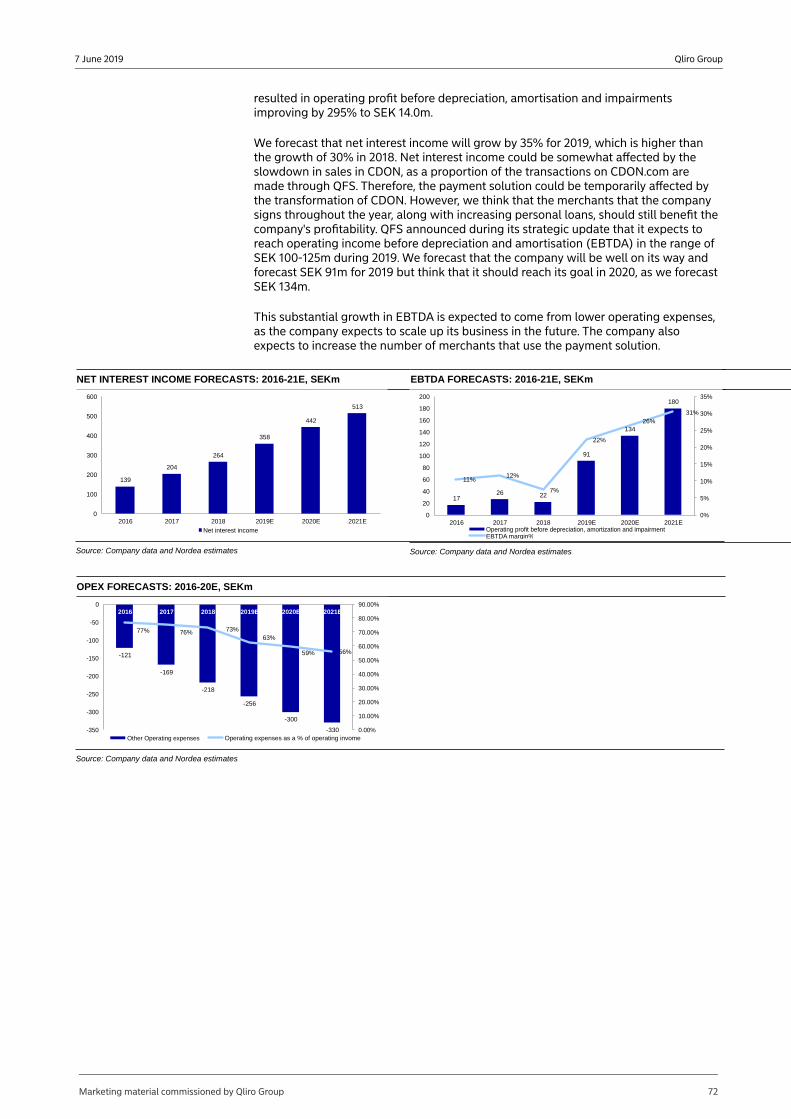
Qliro Group7 June 2019
resulted in operating profit before depreciation, amortisation and impairments improving by 295% to SEK 14.0m.
We forecast that net interest income will grow by 35% for 2019, which is higher than the growth of 30% in 2018. Net interest income could be somewhat affected by the slowdown in sales in CDON, as a proportion of the transactions on CDON.com are made through QFS. Therefore, the payment solution could be temporarily affected by the transformation of CDON. However, we think that the merchants that the company signs throughout the year, along with increasing personal loans, should still benefit the company's profitability. QFS announced during its strategic update that it expects to reach operating income before depreciation and amortisation (EBTDA) in the range of SEK 100-125m during 2019. We forecast that the company will be well on its way and forecast SEK 91m for 2019 but think that it should reach its goal in 2020, as we forecast SEK 134m.
This substantial growth in EBTDA is expected to come from lower operating expenses, as the company expects to scale up its business in the future. The company also expects to increase the number of merchants that use the payment solution.
NET INTEREST INCOME FORECASTS: 2016-21E, SEKm
139
204
264
358
442
513
0
100
200
300
400
500
600
2016 2017 2018 2019E 2020E 2021E
Net interest income
Source: Company data and Nordea estimates
EBTDA FORECASTS: 2016-21E, SEKm
1726 22
91
134
180
11%12%
7%
22%
26%31%
0%
5%
10%
15%
20%
25%
30%
35%
0
20
40
60
80
100
120
140
160
180
200
2016 2017 2018 2019E 2020E 2021EOperating profit before depreciation, amortization and impairmentEBTDA margin%
Source: Company data and Nordea estimates
OPEX FORECASTS: 2016-20E, SEKm
-121
-169
-218
-256
-300
-330
77% 76% 73%63%
59% 56%
0.00%
10.00%
20.00%
30.00%
40.00%
50.00%
60.00%
70.00%
80.00%
90.00%
-350
-300
-250
-200
-150
-100
-50
02016 2017 2018 2019E 2020E 2021E
Other Operating expenses Operating expenses as a % of operating invome
Source: Company data and Nordea estimates
Marketing material commissioned by Qliro Group 72
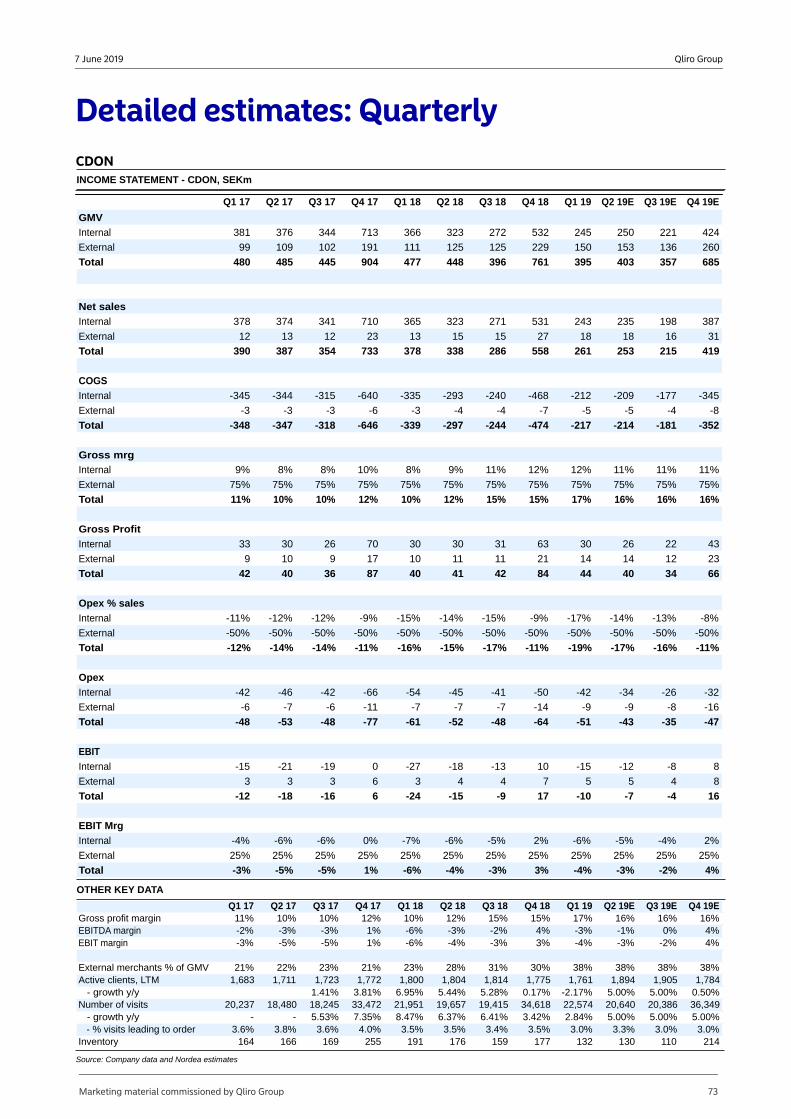
Qliro Group7 June 2019
Detailed estimates: QuarterlyCDONINCOME STATEMENT - CDON, SEKm
Q1 17 Q2 17 Q3 17 Q4 17 Q1 18 Q2 18 Q3 18 Q4 18 Q1 19 Q2 19E Q3 19E Q4 19E
GMV
Internal 381 376 344 713 366 323 272 532 245 250 221 424
External 99 109 102 191 111 125 125 229 150 153 136 260
Total 480 485 445 904 477 448 396 761 395 403 357 685
Net sales
Internal 378 374 341 710 365 323 271 531 243 235 198 387
External 12 13 12 23 13 15 15 27 18 18 16 31
Total 390 387 354 733 378 338 286 558 261 253 215 419
COGS
Internal -345 -344 -315 -640 -335 -293 -240 -468 -212 -209 -177 -345
External -3 -3 -3 -6 -3 -4 -4 -7 -5 -5 -4 -8
Total -348 -347 -318 -646 -339 -297 -244 -474 -217 -214 -181 -352
Gross mrg
Internal 9% 8% 8% 10% 8% 9% 11% 12% 12% 11% 11% 11%
External 75% 75% 75% 75% 75% 75% 75% 75% 75% 75% 75% 75%
Total 11% 10% 10% 12% 10% 12% 15% 15% 17% 16% 16% 16%
Gross Profit
Internal 33 30 26 70 30 30 31 63 30 26 22 43
External 9 10 9 17 10 11 11 21 14 14 12 23
Total 42 40 36 87 40 41 42 84 44 40 34 66
Opex % sales
Internal -11% -12% -12% -9% -15% -14% -15% -9% -17% -14% -13% -8%
External -50% -50% -50% -50% -50% -50% -50% -50% -50% -50% -50% -50%
Total -12% -14% -14% -11% -16% -15% -17% -11% -19% -17% -16% -11%
Opex
Internal -42 -46 -42 -66 -54 -45 -41 -50 -42 -34 -26 -32
External -6 -7 -6 -11 -7 -7 -7 -14 -9 -9 -8 -16
Total -48 -53 -48 -77 -61 -52 -48 -64 -51 -43 -35 -47
EBIT
Internal -15 -21 -19 0 -27 -18 -13 10 -15 -12 -8 8
External 3 3 3 6 3 4 4 7 5 5 4 8
Total -12 -18 -16 6 -24 -15 -9 17 -10 -7 -4 16
EBIT Mrg
Internal -4% -6% -6% 0% -7% -6% -5% 2% -6% -5% -4% 2%
External 25% 25% 25% 25% 25% 25% 25% 25% 25% 25% 25% 25%
Total -3% -5% -5% 1% -6% -4% -3% 3% -4% -3% -2% 4%
OTHER KEY DATA
Q1 17 Q2 17 Q3 17 Q4 17 Q1 18 Q2 18 Q3 18 Q4 18 Q1 19 Q2 19E Q3 19E Q4 19EGross profit margin 11% 10% 10% 12% 10% 12% 15% 15% 17% 16% 16% 16%EBITDA margin -2% -3% -3% 1% -6% -3% -2% 4% -3% -1% 0% 4%EBIT margin -3% -5% -5% 1% -6% -4% -3% 3% -4% -3% -2% 4%
External merchants % of GMV 21% 22% 23% 21% 23% 28% 31% 30% 38% 38% 38% 38%Active clients, LTM 1,683 1,711 1,723 1,772 1,800 1,804 1,814 1,775 1,761 1,894 1,905 1,784
- growth y/y 1.41% 3.81% 6.95% 5.44% 5.28% 0.17% -2.17% 5.00% 5.00% 0.50%Number of visits 20,237 18,480 18,245 33,472 21,951 19,657 19,415 34,618 22,574 20,640 20,386 36,349
- growth y/y - - 5.53% 7.35% 8.47% 6.37% 6.41% 3.42% 2.84% 5.00% 5.00% 5.00%- % visits leading to order 3.6% 3.8% 3.6% 4.0% 3.5% 3.5% 3.4% 3.5% 3.0% 3.3% 3.0% 3.0%
Inventory 164 166 169 255 191 176 159 177 132 130 110 214
Source: Company data and Nordea estimates
Marketing material commissioned by Qliro Group 73
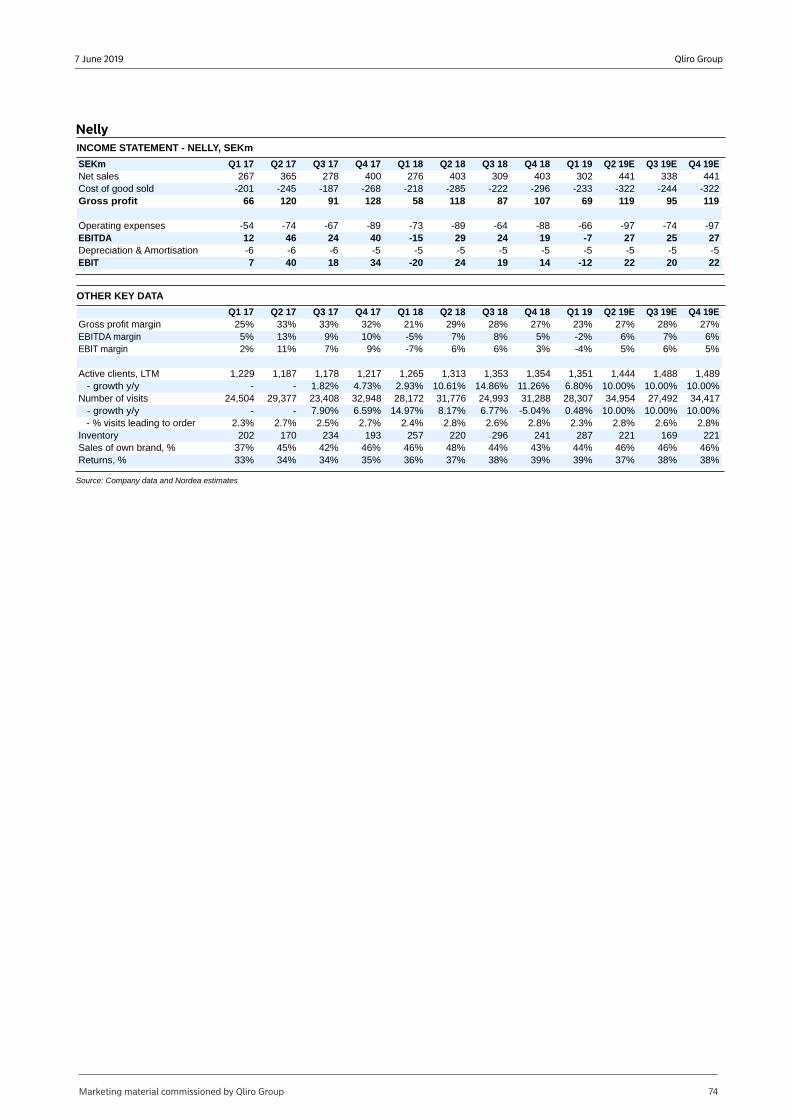
Qliro Group7 June 2019
NellyINCOME STATEMENT - NELLY, SEKm
SEKm Q1 17 Q2 17 Q3 17 Q4 17 Q1 18 Q2 18 Q3 18 Q4 18 Q1 19 Q2 19E Q3 19E Q4 19ENet sales 267 365 278 400 276 403 309 403 302 441 338 441Cost of good sold -201 -245 -187 -268 -218 -285 -222 -296 -233 -322 -244 -322Gross profit 66 120 91 128 58 118 87 107 69 119 95 119
Operating expenses -54 -74 -67 -89 -73 -89 -64 -88 -66 -97 -74 -97EBITDA 12 46 24 40 -15 29 24 19 -7 27 25 27Depreciation & Amortisation -6 -6 -6 -5 -5 -5 -5 -5 -5 -5 -5 -5EBIT 7 40 18 34 -20 24 19 14 -12 22 20 22
OTHER KEY DATA
Q1 17 Q2 17 Q3 17 Q4 17 Q1 18 Q2 18 Q3 18 Q4 18 Q1 19 Q2 19E Q3 19E Q4 19EGross profit margin 25% 33% 33% 32% 21% 29% 28% 27% 23% 27% 28% 27%EBITDA margin 5% 13% 9% 10% -5% 7% 8% 5% -2% 6% 7% 6%EBIT margin 2% 11% 7% 9% -7% 6% 6% 3% -4% 5% 6% 5%
Active clients, LTM 1,229 1,187 1,178 1,217 1,265 1,313 1,353 1,354 1,351 1,444 1,488 1,489- growth y/y - - 1.82% 4.73% 2.93% 10.61% 14.86% 11.26% 6.80% 10.00% 10.00% 10.00%
Number of visits 24,504 29,377 23,408 32,948 28,172 31,776 24,993 31,288 28,307 34,954 27,492 34,417- growth y/y - - 7.90% 6.59% 14.97% 8.17% 6.77% -5.04% 0.48% 10.00% 10.00% 10.00%- % visits leading to order 2.3% 2.7% 2.5% 2.7% 2.4% 2.8% 2.6% 2.8% 2.3% 2.8% 2.6% 2.8%
Inventory 202 170 234 193 257 220 296 241 287 221 169 221Sales of own brand, % 37% 45% 42% 46% 46% 48% 44% 43% 44% 46% 46% 46%Returns, % 33% 34% 34% 35% 36% 37% 38% 39% 39% 37% 38% 38%
Source: Company data and Nordea estimates
Marketing material commissioned by Qliro Group 74
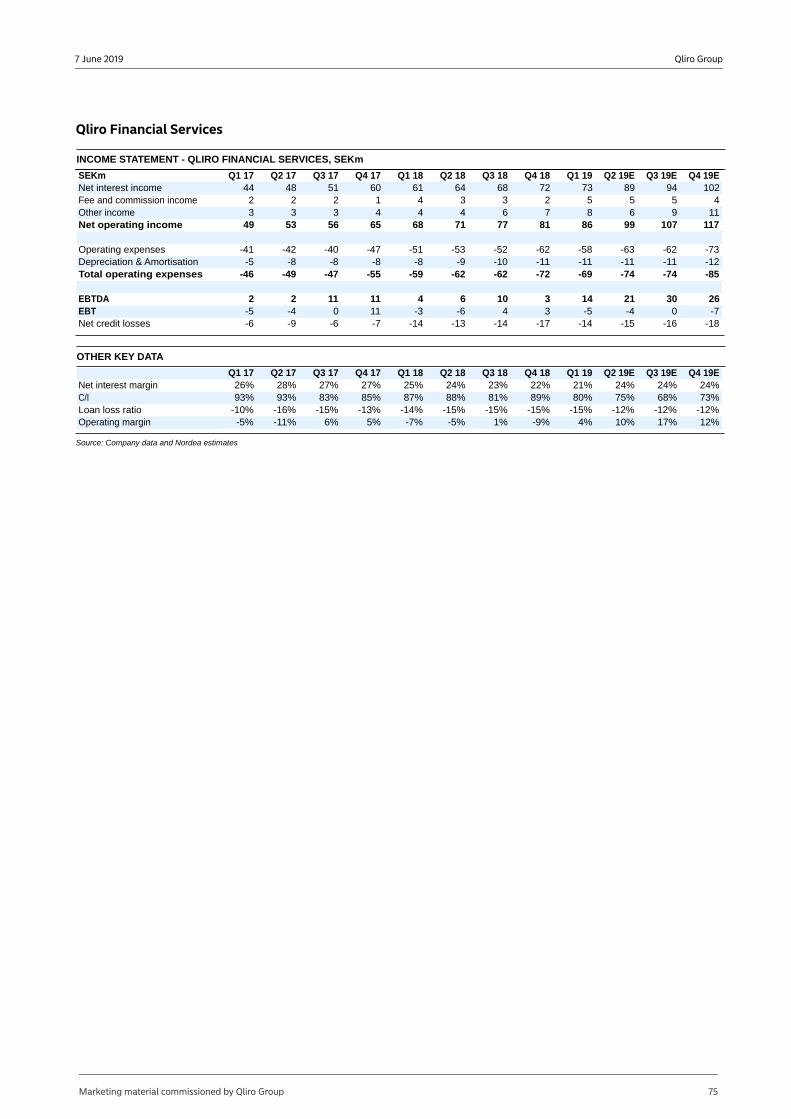
Qliro Group7 June 2019
Qliro Financial Services
INCOME STATEMENT - QLIRO FINANCIAL SERVICES, SEKm
SEKm Q1 17 Q2 17 Q3 17 Q4 17 Q1 18 Q2 18 Q3 18 Q4 18 Q1 19 Q2 19E Q3 19E Q4 19ENet interest income 44 48 51 60 61 64 68 72 73 89 94 102Fee and commission income 2 2 2 1 4 3 3 2 5 5 5 4Other income 3 3 3 4 4 4 6 7 8 6 9 11Net operating income 49 53 56 65 68 71 77 81 86 99 107 117
Operating expenses -41 -42 -40 -47 -51 -53 -52 -62 -58 -63 -62 -73Depreciation & Amortisation -5 -8 -8 -8 -8 -9 -10 -11 -11 -11 -11 -12Total operating expenses -46 -49 -47 -55 -59 -62 -62 -72 -69 -74 -74 -85
EBTDA 2 2 11 11 4 6 10 3 14 21 30 26EBT -5 -4 0 11 -3 -6 4 3 -5 -4 0 -7Net credit losses -6 -9 -6 -7 -14 -13 -14 -17 -14 -15 -16 -18
OTHER KEY DATA
Q1 17 Q2 17 Q3 17 Q4 17 Q1 18 Q2 18 Q3 18 Q4 18 Q1 19 Q2 19E Q3 19E Q4 19ENet interest margin 26% 28% 27% 27% 25% 24% 23% 22% 21% 24% 24% 24%C/I 93% 93% 83% 85% 87% 88% 81% 89% 80% 75% 68% 73%Loan loss ratio -10% -16% -15% -13% -14% -15% -15% -15% -15% -12% -12% -12%Operating margin -5% -11% 6% 5% -7% -5% 1% -9% 4% 10% 17% 12%
Source: Company data and Nordea estimates
Marketing material commissioned by Qliro Group 75
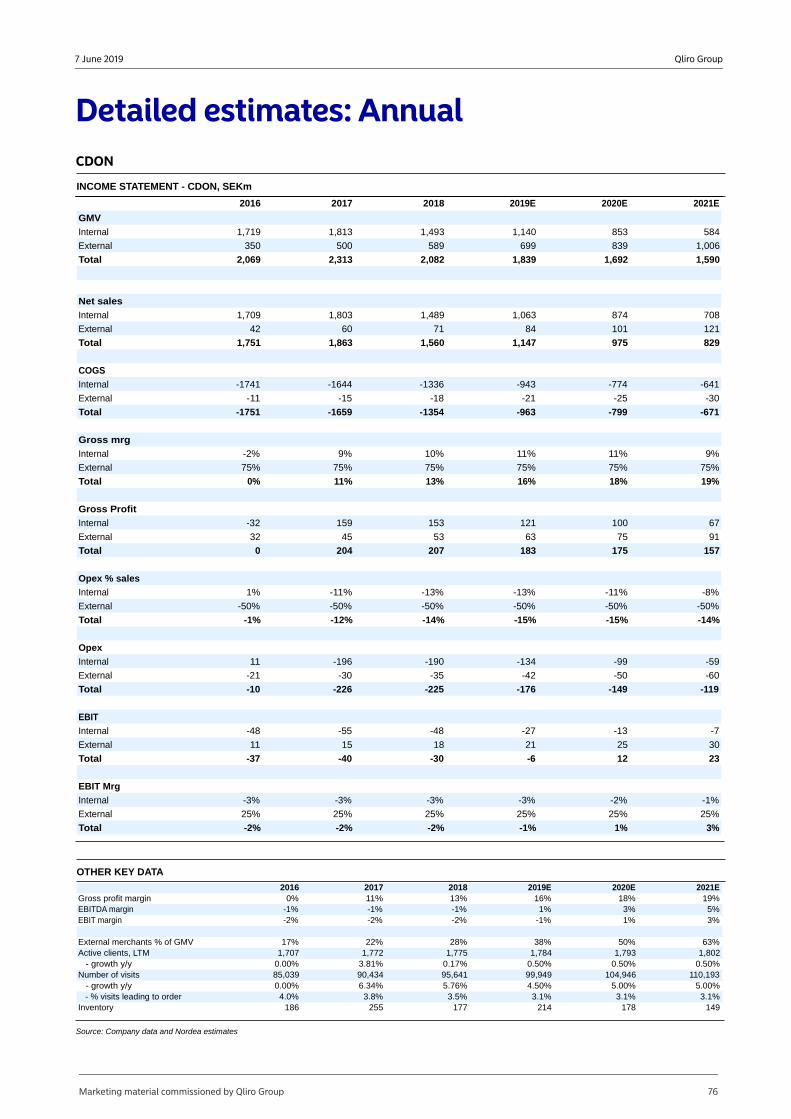
Qliro Group7 June 2019
Detailed estimates: AnnualCDON
INCOME STATEMENT - CDON, SEKm
2016 2017 2018 2019E 2020E 2021E
GMV
Internal 1,719 1,813 1,493 1,140 853 584
External 350 500 589 699 839 1,006
Total 2,069 2,313 2,082 1,839 1,692 1,590
Net sales
Internal 1,709 1,803 1,489 1,063 874 708
External 42 60 71 84 101 121
Total 1,751 1,863 1,560 1,147 975 829
COGS
Internal -1741 -1644 -1336 -943 -774 -641
External -11 -15 -18 -21 -25 -30
Total -1751 -1659 -1354 -963 -799 -671
Gross mrg
Internal -2% 9% 10% 11% 11% 9%
External 75% 75% 75% 75% 75% 75%
Total 0% 11% 13% 16% 18% 19%
Gross Profit
Internal -32 159 153 121 100 67
External 32 45 53 63 75 91
Total 0 204 207 183 175 157
Opex % sales
Internal 1% -11% -13% -13% -11% -8%
External -50% -50% -50% -50% -50% -50%
Total -1% -12% -14% -15% -15% -14%
Opex
Internal 11 -196 -190 -134 -99 -59
External -21 -30 -35 -42 -50 -60
Total -10 -226 -225 -176 -149 -119
EBIT
Internal -48 -55 -48 -27 -13 -7
External 11 15 18 21 25 30
Total -37 -40 -30 -6 12 23
EBIT Mrg
Internal -3% -3% -3% -3% -2% -1%
External 25% 25% 25% 25% 25% 25%
Total -2% -2% -2% -1% 1% 3%
OTHER KEY DATA
2016 2017 2018 2019E 2020E 2021EGross profit margin 0% 11% 13% 16% 18% 19%EBITDA margin -1% -1% -1% 1% 3% 5%EBIT margin -2% -2% -2% -1% 1% 3%
External merchants % of GMV 17% 22% 28% 38% 50% 63%Active clients, LTM 1,707 1,772 1,775 1,784 1,793 1,802
- growth y/y 0.00% 3.81% 0.17% 0.50% 0.50% 0.50%Number of visits 85,039 90,434 95,641 99,949 104,946 110,193
- growth y/y 0.00% 6.34% 5.76% 4.50% 5.00% 5.00%- % visits leading to order 4.0% 3.8% 3.5% 3.1% 3.1% 3.1%
Inventory 186 255 177 214 178 149
Source: Company data and Nordea estimates
Marketing material commissioned by Qliro Group 76
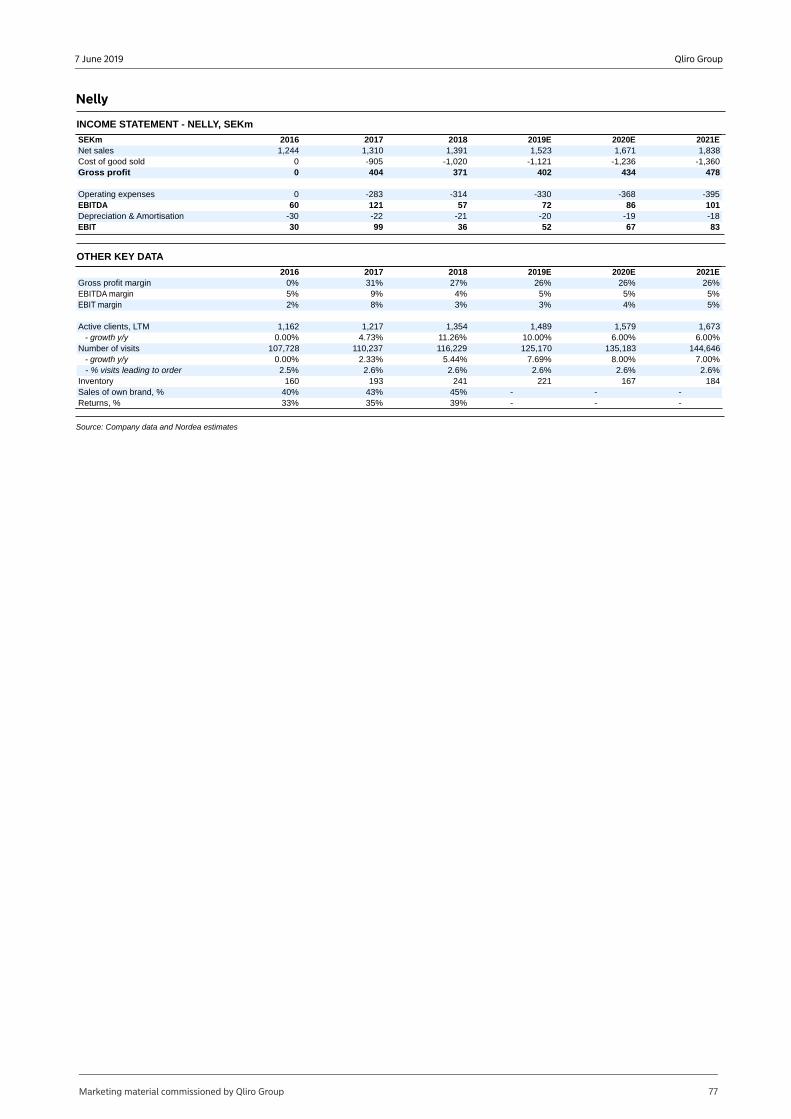
Qliro Group7 June 2019
Nelly
INCOME STATEMENT - NELLY, SEKm
SEKm 2016 2017 2018 2019E 2020E 2021ENet sales 1,244 1,310 1,391 1,523 1,671 1,838Cost of good sold 0 -905 -1,020 -1,121 -1,236 -1,360Gross profit 0 404 371 402 434 478
Operating expenses 0 -283 -314 -330 -368 -395EBITDA 60 121 57 72 86 101Depreciation & Amortisation -30 -22 -21 -20 -19 -18EBIT 30 99 36 52 67 83
OTHER KEY DATA
2016 2017 2018 2019E 2020E 2021EGross profit margin 0% 31% 27% 26% 26% 26%EBITDA margin 5% 9% 4% 5% 5% 5%EBIT margin 2% 8% 3% 3% 4% 5%
Active clients, LTM 1,162 1,217 1,354 1,489 1,579 1,673- growth y/y 0.00% 4.73% 11.26% 10.00% 6.00% 6.00%
Number of visits 107,728 110,237 116,229 125,170 135,183 144,646- growth y/y 0.00% 2.33% 5.44% 7.69% 8.00% 7.00%- % visits leading to order 2.5% 2.6% 2.6% 2.6% 2.6% 2.6%
Inventory 160 193 241 221 167 184Sales of own brand, % 40% 43% 45% - - -Returns, % 33% 35% 39% - - -
Source: Company data and Nordea estimates
Marketing material commissioned by Qliro Group 77
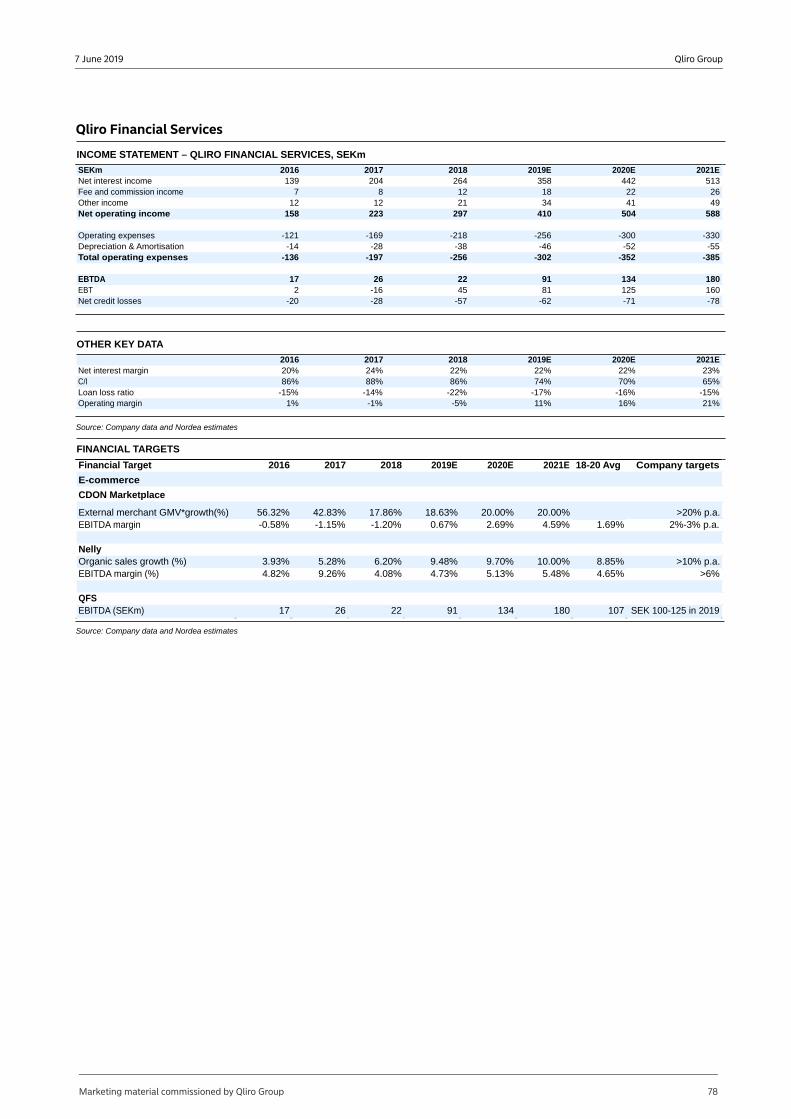
Qliro Group7 June 2019
Qliro Financial Services
INCOME STATEMENT – QLIRO FINANCIAL SERVICES, SEKm
SEKm 2016 2017 2018 2019E 2020E 2021ENet interest income 139 204 264 358 442 513Fee and commission income 7 8 12 18 22 26Other income 12 12 21 34 41 49Net operating income 158 223 297 410 504 588
Operating expenses -121 -169 -218 -256 -300 -330Depreciation & Amortisation -14 -28 -38 -46 -52 -55Total operating expenses -136 -197 -256 -302 -352 -385
EBTDA 17 26 22 91 134 180EBT 2 -16 45 81 125 160Net credit losses -20 -28 -57 -62 -71 -78
OTHER KEY DATA
2016 2017 2018 2019E 2020E 2021ENet interest margin 20% 24% 22% 22% 22% 23%C/I 86% 88% 86% 74% 70% 65%Loan loss ratio -15% -14% -22% -17% -16% -15%Operating margin 1% -1% -5% 11% 16% 21%
Source: Company data and Nordea estimates
FINANCIAL TARGETS
Financial Target 2016 2017 2018 2019E 2020E 2021E 18-20 Avg Company targets
E-commerce
CDON Marketplace
External merchant GMV*growth(%) 56.32% 42.83% 17.86% 18.63% 20.00% 20.00% >20% p.a.EBITDA margin -0.58% -1.15% -1.20% 0.67% 2.69% 4.59% 1.69% 2%-3% p.a.
NellyOrganic sales growth (%) 3.93% 5.28% 6.20% 9.48% 9.70% 10.00% 8.85% >10% p.a.EBITDA margin (%) 4.82% 9.26% 4.08% 4.73% 5.13% 5.48% 4.65% >6%
QFSEBITDA (SEKm) 17 26 22 91 134 180 107 SEK 100-125 in 2019
Source: Company data and Nordea estimates
Marketing material commissioned by Qliro Group 78
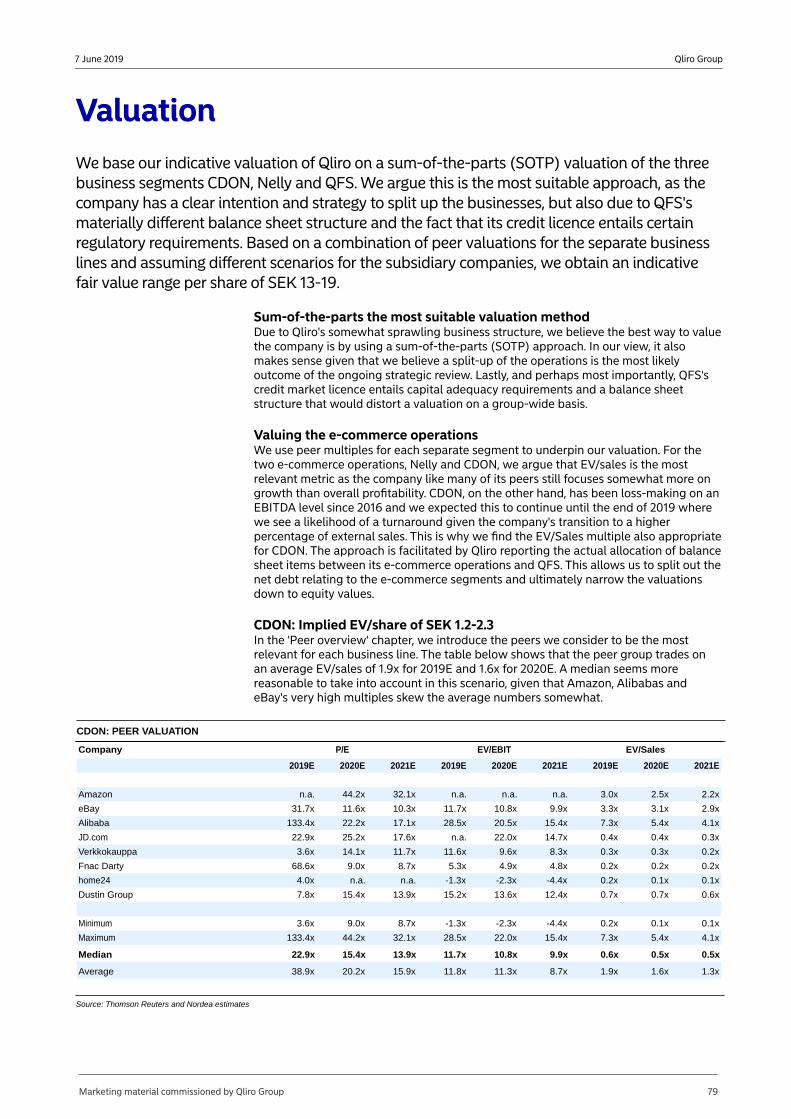
Qliro Group7 June 2019
ValuationWe base our indicative valuation of Qliro on a sum-of-the-parts (SOTP) valuation of the three business segments CDON, Nelly and QFS. We argue this is the most suitable approach, as the company has a clear intention and strategy to split up the businesses, but also due to QFS's materially different balance sheet structure and the fact that its credit licence entails certain regulatory requirements. Based on a combination of peer valuations for the separate business lines and assuming different scenarios for the subsidiary companies, we obtain an indicative fair value range per share of SEK 13-19.
Sum-of-the-parts the most suitable valuation methodDue to Qliro's somewhat sprawling business structure, we believe the best way to value the company is by using a sum-of-the-parts (SOTP) approach. In our view, it also makes sense given that we believe a split-up of the operations is the most likely outcome of the ongoing strategic review. Lastly, and perhaps most importantly, QFS's credit market licence entails capital adequacy requirements and a balance sheet structure that would distort a valuation on a group-wide basis.
Valuing the e-commerce operationsWe use peer multiples for each separate segment to underpin our valuation. For the two e-commerce operations, Nelly and CDON, we argue that EV/sales is the most relevant metric as the company like many of its peers still focuses somewhat more on growth than overall profitability. CDON, on the other hand, has been loss-making on an EBITDA level since 2016 and we expected this to continue until the end of 2019 where we see a likelihood of a turnaround given the company's transition to a higher percentage of external sales. This is why we find the EV/Sales multiple also appropriate for CDON. The approach is facilitated by Qliro reporting the actual allocation of balance sheet items between its e-commerce operations and QFS. This allows us to split out the net debt relating to the e-commerce segments and ultimately narrow the valuations down to equity values.
CDON: Implied EV/share of SEK 1.2-2.3 In the 'Peer overview' chapter, we introduce the peers we consider to be the most relevant for each business line. The table below shows that the peer group trades on an average EV/sales of 1.9x for 2019E and 1.6x for 2020E. A median seems more reasonable to take into account in this scenario, given that Amazon, Alibabas and eBay's very high multiples skew the average numbers somewhat.
CDON: PEER VALUATION
Company P/E
2019E 2020E 2021E 2019E 2020E 2021E 2019E 2020E 2021E
Amazon n.a. 44.2x 32.1x n.a. n.a. n.a. 3.0x 2.5x 2.2x
eBay 31.7x 11.6x 10.3x 11.7x 10.8x 9.9x 3.3x 3.1x 2.9x
Alibaba 133.4x 22.2x 17.1x 28.5x 20.5x 15.4x 7.3x 5.4x 4.1x
JD.com 22.9x 25.2x 17.6x n.a. 22.0x 14.7x 0.4x 0.4x 0.3x
Verkkokauppa 3.6x 14.1x 11.7x 11.6x 9.6x 8.3x 0.3x 0.3x 0.2x
Fnac Darty 68.6x 9.0x 8.7x 5.3x 4.9x 4.8x 0.2x 0.2x 0.2x
home24 4.0x n.a. n.a. -1.3x -2.3x -4.4x 0.2x 0.1x 0.1x
Dustin Group 7.8x 15.4x 13.9x 15.2x 13.6x 12.4x 0.7x 0.7x 0.6x
Minimum 3.6x 9.0x 8.7x -1.3x -2.3x -4.4x 0.2x 0.1x 0.1x
Maximum 133.4x 44.2x 32.1x 28.5x 22.0x 15.4x 7.3x 5.4x 4.1x
Median 22.9x 15.4x 13.9x 11.7x 10.8x 9.9x 0.6x 0.5x 0.5x
Average 38.9x 20.2x 15.9x 11.8x 11.3x 8.7x 1.9x 1.6x 1.3x
EV/EBIT EV/Sales
Source: Thomson Reuters and Nordea estimates
Marketing material commissioned by Qliro Group 79
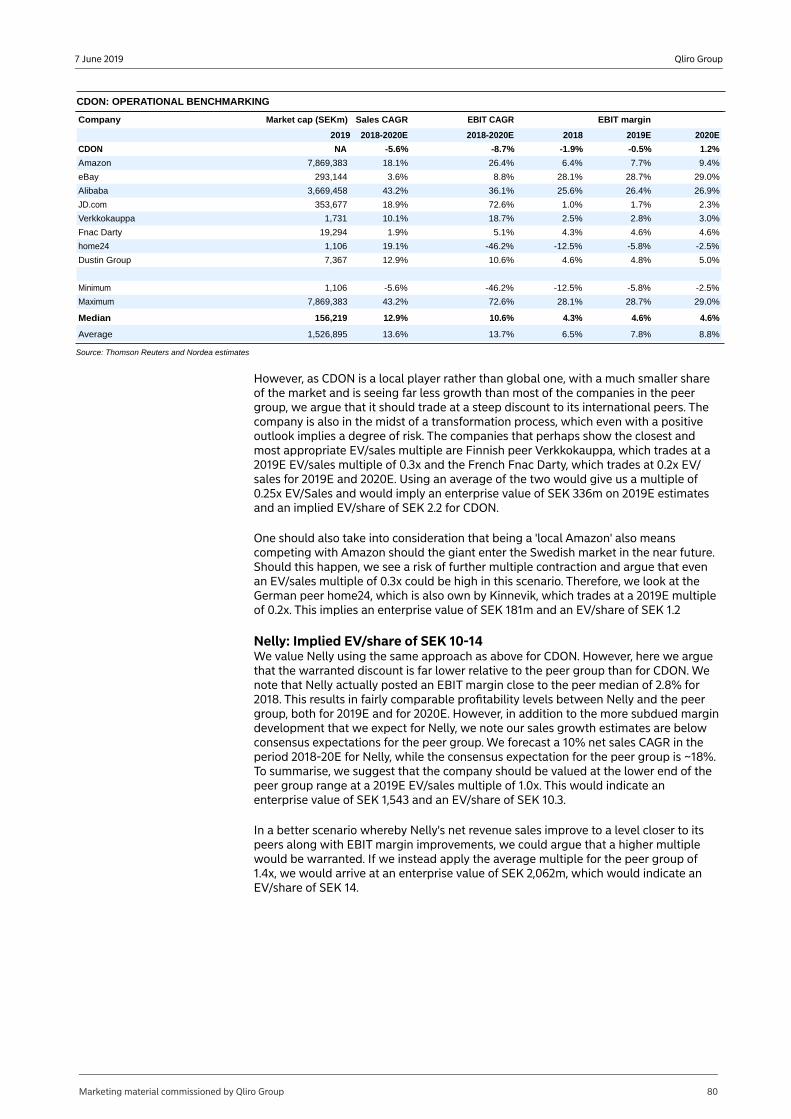
Qliro Group7 June 2019
CDON: OPERATIONAL BENCHMARKING
Company Market cap (SEKm) Sales CAGR EBIT CAGR EBIT margin
2019 2018-2020E 2018-2020E 2018 2019E 2020E
CDON NA -5.6% -8.7% -1.9% -0.5% 1.2%
Amazon 7,869,383 18.1% 26.4% 6.4% 7.7% 9.4%
eBay 293,144 3.6% 8.8% 28.1% 28.7% 29.0%
Alibaba 3,669,458 43.2% 36.1% 25.6% 26.4% 26.9%
JD.com 353,677 18.9% 72.6% 1.0% 1.7% 2.3%
Verkkokauppa 1,731 10.1% 18.7% 2.5% 2.8% 3.0%
Fnac Darty 19,294 1.9% 5.1% 4.3% 4.6% 4.6%
home24 1,106 19.1% -46.2% -12.5% -5.8% -2.5%
Dustin Group 7,367 12.9% 10.6% 4.6% 4.8% 5.0%
Minimum 1,106 -5.6% -46.2% -12.5% -5.8% -2.5%
Maximum 7,869,383 43.2% 72.6% 28.1% 28.7% 29.0%
Median 156,219 12.9% 10.6% 4.3% 4.6% 4.6%
Average 1,526,895 13.6% 13.7% 6.5% 7.8% 8.8%
Source: Thomson Reuters and Nordea estimates
However, as CDON is a local player rather than global one, with a much smaller share of the market and is seeing far less growth than most of the companies in the peer group, we argue that it should trade at a steep discount to its international peers. The company is also in the midst of a transformation process, which even with a positive outlook implies a degree of risk. The companies that perhaps show the closest and most appropriate EV/sales multiple are Finnish peer Verkkokauppa, which trades at a 2019E EV/sales multiple of 0.3x and the French Fnac Darty, which trades at 0.2x EV/sales for 2019E and 2020E. Using an average of the two would give us a multiple of 0.25x EV/Sales and would imply an enterprise value of SEK 336m on 2019E estimates and an implied EV/share of SEK 2.2 for CDON.
One should also take into consideration that being a 'local Amazon' also means competing with Amazon should the giant enter the Swedish market in the near future. Should this happen, we see a risk of further multiple contraction and argue that even an EV/sales multiple of 0.3x could be high in this scenario. Therefore, we look at the German peer home24, which is also own by Kinnevik, which trades at a 2019E multiple of 0.2x. This implies an enterprise value of SEK 181m and an EV/share of SEK 1.2
Nelly: Implied EV/share of SEK 10-14We value Nelly using the same approach as above for CDON. However, here we argue that the warranted discount is far lower relative to the peer group than for CDON. We note that Nelly actually posted an EBIT margin close to the peer median of 2.8% for 2018. This results in fairly comparable profitability levels between Nelly and the peer group, both for 2019E and for 2020E. However, in addition to the more subdued margin development that we expect for Nelly, we note our sales growth estimates are below consensus expectations for the peer group. We forecast a 10% net sales CAGR in the period 2018-20E for Nelly, while the consensus expectation for the peer group is ~18%. To summarise, we suggest that the company should be valued at the lower end of the peer group range at a 2019E EV/sales multiple of 1.0x. This would indicate an enterprise value of SEK 1,543 and an EV/share of SEK 10.3.
In a better scenario whereby Nelly's net revenue sales improve to a level closer to its peers along with EBIT margin improvements, we could argue that a higher multiple would be warranted. If we instead apply the average multiple for the peer group of 1.4x, we would arrive at an enterprise value of SEK 2,062m, which would indicate an EV/share of SEK 14.
Marketing material commissioned by Qliro Group 80
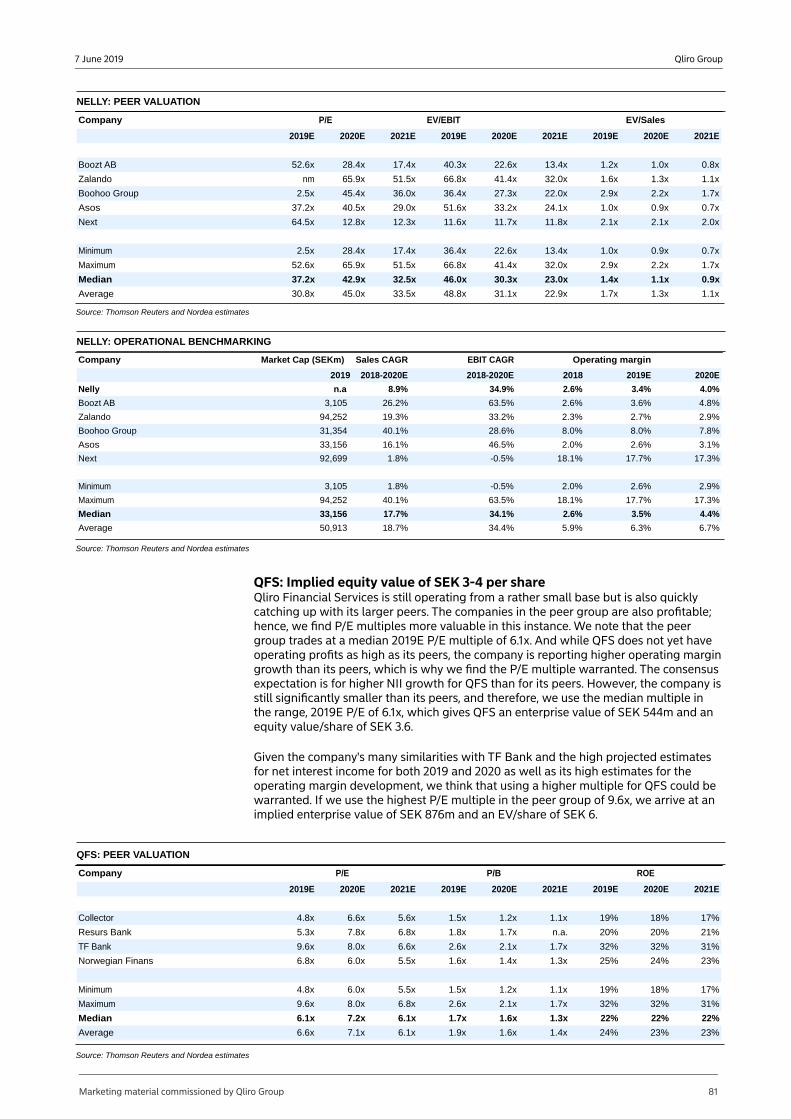
Qliro Group7 June 2019
NELLY: PEER VALUATION
Company P/E EV/EBIT EV/Sales
2019E 2020E 2021E 2019E 2020E 2021E 2019E 2020E 2021E
Boozt AB 52.6x 28.4x 17.4x 40.3x 22.6x 13.4x 1.2x 1.0x 0.8x
Zalando nm 65.9x 51.5x 66.8x 41.4x 32.0x 1.6x 1.3x 1.1x
Boohoo Group 2.5x 45.4x 36.0x 36.4x 27.3x 22.0x 2.9x 2.2x 1.7x
Asos 37.2x 40.5x 29.0x 51.6x 33.2x 24.1x 1.0x 0.9x 0.7x
Next 64.5x 12.8x 12.3x 11.6x 11.7x 11.8x 2.1x 2.1x 2.0x
Minimum 2.5x 28.4x 17.4x 36.4x 22.6x 13.4x 1.0x 0.9x 0.7x
Maximum 52.6x 65.9x 51.5x 66.8x 41.4x 32.0x 2.9x 2.2x 1.7x
Median 37.2x 42.9x 32.5x 46.0x 30.3x 23.0x 1.4x 1.1x 0.9x
Average 30.8x 45.0x 33.5x 48.8x 31.1x 22.9x 1.7x 1.3x 1.1x
Source: Thomson Reuters and Nordea estimates
NELLY: OPERATIONAL BENCHMARKING
Company Market Cap (SEKm) Sales CAGR EBIT CAGR Operating margin
2019 2018-2020E 2018-2020E 2018 2019E 2020E
Nelly n.a 8.9% 34.9% 2.6% 3.4% 4.0%
Boozt AB 3,105 26.2% 63.5% 2.6% 3.6% 4.8%
Zalando 94,252 19.3% 33.2% 2.3% 2.7% 2.9%
Boohoo Group 31,354 40.1% 28.6% 8.0% 8.0% 7.8%
Asos 33,156 16.1% 46.5% 2.0% 2.6% 3.1%
Next 92,699 1.8% -0.5% 18.1% 17.7% 17.3%
Minimum 3,105 1.8% -0.5% 2.0% 2.6% 2.9%
Maximum 94,252 40.1% 63.5% 18.1% 17.7% 17.3%
Median 33,156 17.7% 34.1% 2.6% 3.5% 4.4%
Average 50,913 18.7% 34.4% 5.9% 6.3% 6.7%
Source: Thomson Reuters and Nordea estimates
QFS: Implied equity value of SEK 3-4 per shareQliro Financial Services is still operating from a rather small base but is also quickly catching up with its larger peers. The companies in the peer group are also profitable; hence, we find P/E multiples more valuable in this instance. We note that the peer group trades at a median 2019E P/E multiple of 6.1x. And while QFS does not yet have operating profits as high as its peers, the company is reporting higher operating margin growth than its peers, which is why we find the P/E multiple warranted. The consensus expectation is for higher NII growth for QFS than for its peers. However, the company is still significantly smaller than its peers, and therefore, we use the median multiple in the range, 2019E P/E of 6.1x, which gives QFS an enterprise value of SEK 544m and an equity value/share of SEK 3.6.
Given the company's many similarities with TF Bank and the high projected estimates for net interest income for both 2019 and 2020 as well as its high estimates for the operating margin development, we think that using a higher multiple for QFS could be warranted. If we use the highest P/E multiple in the peer group of 9.6x, we arrive at an implied enterprise value of SEK 876m and an EV/share of SEK 6.
QFS: PEER VALUATION
Company P/E P/B ROE
2019E 2020E 2021E 2019E 2020E 2021E 2019E 2020E 2021E
Collector 4.8x 6.6x 5.6x 1.5x 1.2x 1.1x 19% 18% 17%
Resurs Bank 5.3x 7.8x 6.8x 1.8x 1.7x n.a. 20% 20% 21%
TF Bank 9.6x 8.0x 6.6x 2.6x 2.1x 1.7x 32% 32% 31%
Norwegian Finans 6.8x 6.0x 5.5x 1.6x 1.4x 1.3x 25% 24% 23%
Minimum 4.8x 6.0x 5.5x 1.5x 1.2x 1.1x 19% 18% 17%
Maximum 9.6x 8.0x 6.8x 2.6x 2.1x 1.7x 32% 32% 31%
Median 6.1x 7.2x 6.1x 1.7x 1.6x 1.3x 22% 22% 22%
Average 6.6x 7.1x 6.1x 1.9x 1.6x 1.4x 24% 23% 23%
Source: Thomson Reuters and Nordea estimates
Marketing material commissioned by Qliro Group 81
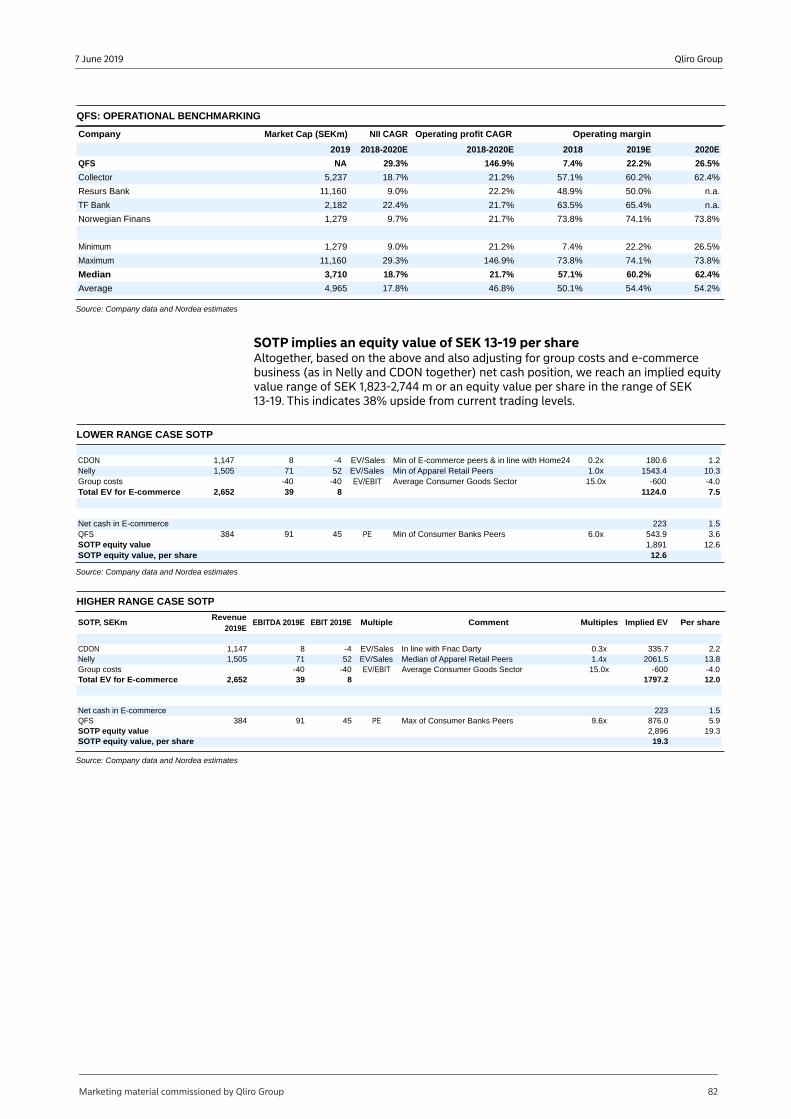
Qliro Group7 June 2019
QFS: OPERATIONAL BENCHMARKING
Company Market Cap (SEKm) NII CAGR Operating profit CAGR Operating margin
2019 2018-2020E 2018-2020E 2018 2019E 2020E
QFS NA 29.3% 146.9% 7.4% 22.2% 26.5%
Collector 5,237 18.7% 21.2% 57.1% 60.2% 62.4%
Resurs Bank 11,160 9.0% 22.2% 48.9% 50.0% n.a.
TF Bank 2,182 22.4% 21.7% 63.5% 65.4% n.a.
Norwegian Finans 1,279 9.7% 21.7% 73.8% 74.1% 73.8%
Minimum 1,279 9.0% 21.2% 7.4% 22.2% 26.5%
Maximum 11,160 29.3% 146.9% 73.8% 74.1% 73.8%
Median 3,710 18.7% 21.7% 57.1% 60.2% 62.4%
Average 4,965 17.8% 46.8% 50.1% 54.4% 54.2%
Source: Company data and Nordea estimates
SOTP implies an equity value of SEK 13-19 per share Altogether, based on the above and also adjusting for group costs and e-commerce business (as in Nelly and CDON together) net cash position, we reach an implied equity value range of SEK 1,823-2,744 m or an equity value per share in the range of SEK 13-19. This indicates 38% upside from current trading levels.
LOWER RANGE CASE SOTP
CDON 1,147 8 -4 EV/Sales Min of E-commerce peers & in line with Home24 0.2x 180.6 1.2Nelly 1,505 71 52 EV/Sales Min of Apparel Retail Peers 1.0x 1543.4 10.3Group costs -40 -40 EV/EBIT Average Consumer Goods Sector 15.0x -600 -4.0Total EV for E-commerce 2,652 39 8 1124.0 7.5
Net cash in E-commerce 223 1.5QFS 384 91 45 PE Min of Consumer Banks Peers 6.0x 543.9 3.6SOTP equity value 1,891 12.6SOTP equity value, per share 12.6
Source: Company data and Nordea estimates
HIGHER RANGE CASE SOTP
SOTP, SEKmRevenue
2019EEBITDA 2019E EBIT 2019E Multiple Comment Multiples Implied EV Per share
CDON 1,147 8 -4 EV/Sales In line with Fnac Darty 0.3x 335.7 2.2Nelly 1,505 71 52 EV/Sales Median of Apparel Retail Peers 1.4x 2061.5 13.8Group costs -40 -40 EV/EBIT Average Consumer Goods Sector 15.0x -600 -4.0Total EV for E-commerce 2,652 39 8 1797.2 12.0
Net cash in E-commerce 223 1.5QFS 384 91 45 PE Max of Consumer Banks Peers 9.6x 876.0 5.9SOTP equity value 2,896 19.3SOTP equity value, per share 19.3
Source: Company data and Nordea estimates
Marketing material commissioned by Qliro Group 82
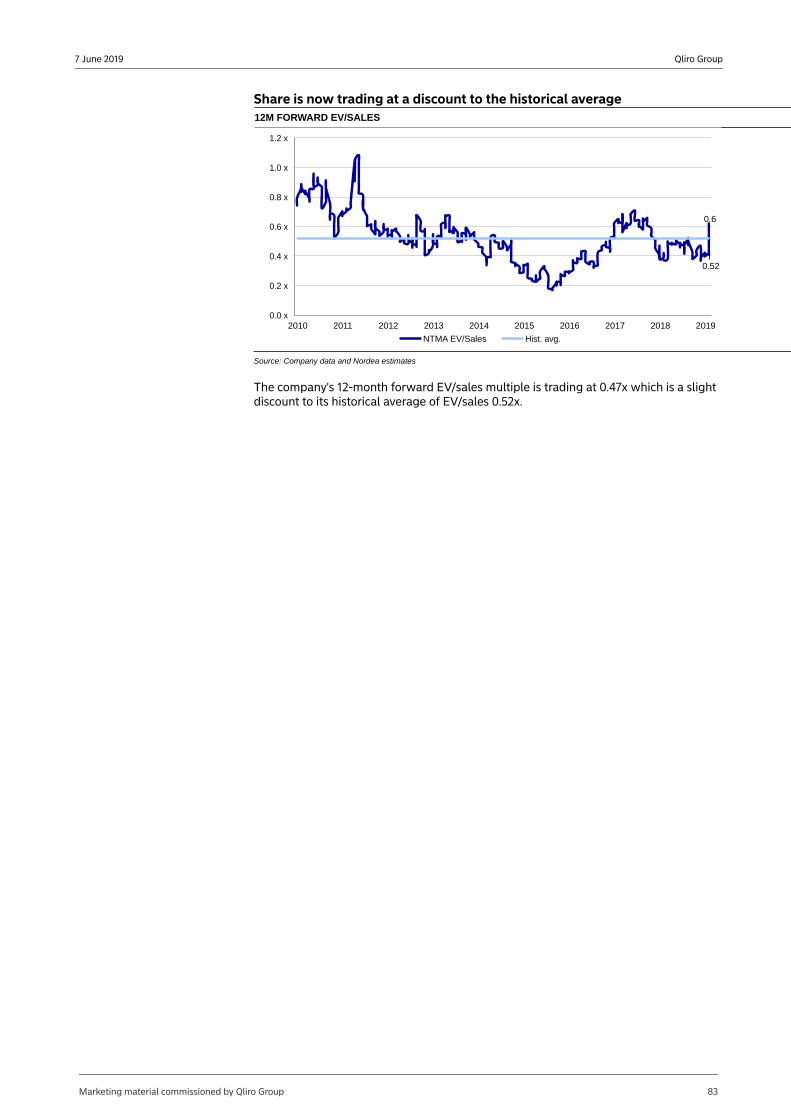
Qliro Group7 June 2019
Share is now trading at a discount to the historical average12M FORWARD EV/SALES
0.6
0.52
0.0 x
0.2 x
0.4 x
0.6 x
0.8 x
1.0 x
1.2 x
2010 2011 2012 2013 2014 2015 2016 2017 2018 2019
NTMA EV/Sales Hist. avg.
Source: Company data and Nordea estimates
The company's 12-month forward EV/sales multiple is trading at 0.47x which is a slight discount to its historical average of EV/sales 0.52x.
Marketing material commissioned by Qliro Group 83
Qliro Group7 June 2019
Risks factorsIn this section, we outline various risks that Qliro Group may face that could impact its future financial performance. We look at each company in the group individually, as Qliro Group's companies operate in different industries, each with their own specific risks. The purpose of this section is not to provide a comprehensive picture of all risks, but rather to highlight the risks wefind most relevant.
CDON
The competitive landscape could become fiercer with the entry of new participants such as Amazon.The structural growth in e-commerce could prove more temporary than currently expected by the market. CDON is likely exposed to overall swings in GDP and consumer confidence. FX swings could affect the import prices of many products offered by CDON. Return rates could increase and thereby adversely affect handling and administration expenses. Inventory levels might become elevated if consumer preference and demand shift and make the products less attractive.Investments in improving logistics might be required to keep up with consumer demand and preferences.
Nelly
New collections could be poorly received by consumers, leading to markdowns and inflated inventory levels.Salary inflation could put pressure on COGS and gross margins as products are sourced from low-wage countries.Owing to its scale, Nelly might lack the resources to keep tight control of suppliers' adherence to labour law in developing countries from where its merchandise is sourced. This could result in negative ESG publicity if exploitation is later revealed.Increased competition could lead to pressured gross margins.Failure to attract and detect upcoming influencers in social media could hurt Nelly's ability to reach new generations of its target group.Lower demand for its own brand could result in fewer visits to the site overall, making Nelly more vulnerable to competition, as we view its own brand as an important USP. Exposure to swings in raw material costs such as cotton.Exposure to the overall macroeconomic trends in its operating countries.
QFS
The majority of volumes processed by QFS are still generated from group internal merchants. On a standalone basis, QFS could face challenges growing.Pricing power is low in the checkout process, as competition is high, while the product is quite standardised.New regulation on consumer finance could limit QFS's growth if it constrains access to credit.Capital adequacy requirement could rise as a result of regulatory decisions.There is tail risk with regards to the rapid growth in consumer loans.Increased deployment of brokers by consumers could pressure QFS's margins indirectly, although this is only a marginal direct channel for QFS to source clients.Underperformance in sales by its core merchants would also directly impact QFS.The technology could become obsolete or require investment in new capabilities if consumer payment methods change.New payment methods such as account-to-account solutions (Swish, etc) may prove harder to monetise.
Marketing material commissioned by Qliro Group 84
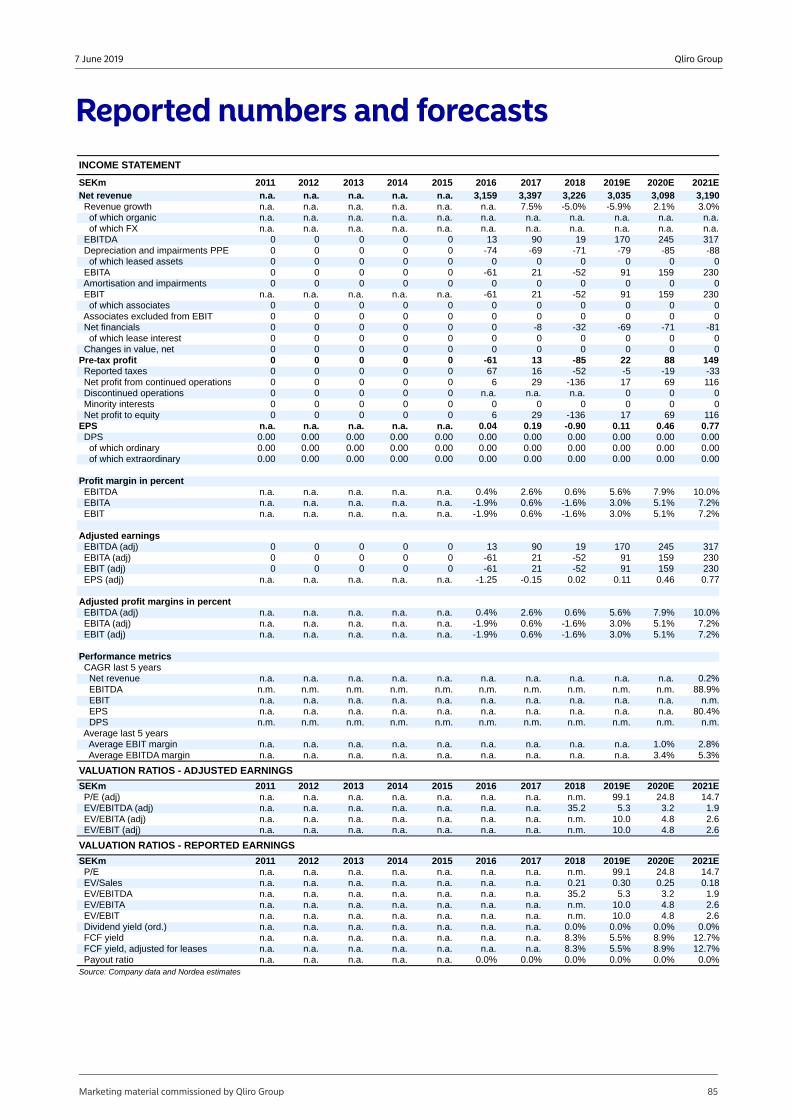
Qliro Group7 June 2019
Reported numbers and forecastsINCOME STATEMENT
2021E2020E2019E20182017201620152014201320122011SEKm3,1903,0983,0353,2263,3973,159n.a.n.a.n.a.n.a.n.a.Net revenue3.0%2.1%-5.9%-5.0%7.5%n.a.n.a.n.a.n.a.n.a.n.a.Revenue growthn.a.n.a.n.a.n.a.n.a.n.a.n.a.n.a.n.a.n.a.n.a.of which organicn.a.n.a.n.a.n.a.n.a.n.a.n.a.n.a.n.a.n.a.n.a.of which FX31724517019901300000EBITDA-88-85-79-71-69-7400000Depreciation and impairments PPE
00000000000of which leased assets23015991-5221-6100000EBITA
00000000000Amortisation and impairments23015991-5221-61n.a.n.a.n.a.n.a.n.a.EBIT
00000000000of which associates00000000000Associates excluded from EBIT
-81-71-69-32-8000000Net financials00000000000of which lease interest00000000000Changes in value, net
1498822-8513-6100000Pre-tax profit-33-19-5-52166700000Reported taxes1166917-13629600000Net profit from continued operations
000n.a.n.a.n.a.00000Discontinued operations00000000000Minority interests
1166917-13629600000Net profit to equity0.770.460.11-0.900.190.04n.a.n.a.n.a.n.a.n.a.EPS0.000.000.000.000.000.000.000.000.000.000.00DPS0.000.000.000.000.000.000.000.000.000.000.00of which ordinary0.000.000.000.000.000.000.000.000.000.000.00of which extraordinary
Profit margin in percent10.0%7.9%5.6%0.6%2.6%0.4%n.a.n.a.n.a.n.a.n.a.EBITDA7.2%5.1%3.0%-1.6%0.6%-1.9%n.a.n.a.n.a.n.a.n.a.EBITA7.2%5.1%3.0%-1.6%0.6%-1.9%n.a.n.a.n.a.n.a.n.a.EBIT
Adjusted earnings31724517019901300000EBITDA (adj)23015991-5221-6100000EBITA (adj)23015991-5221-6100000EBIT (adj)0.770.460.110.02-0.15-1.25n.a.n.a.n.a.n.a.n.a.EPS (adj)
Adjusted profit margins in percent10.0%7.9%5.6%0.6%2.6%0.4%n.a.n.a.n.a.n.a.n.a.EBITDA (adj)7.2%5.1%3.0%-1.6%0.6%-1.9%n.a.n.a.n.a.n.a.n.a.EBITA (adj)7.2%5.1%3.0%-1.6%0.6%-1.9%n.a.n.a.n.a.n.a.n.a.EBIT (adj)
Performance metricsCAGR last 5 years
0.2%n.a.n.a.n.a.n.a.n.a.n.a.n.a.n.a.n.a.n.a.Net revenue88.9%n.m.n.m.n.m.n.m.n.m.n.m.n.m.n.m.n.m.n.m.EBITDA
n.m.n.a.n.a.n.a.n.a.n.a.n.a.n.a.n.a.n.a.n.a.EBIT80.4%n.a.n.a.n.a.n.a.n.a.n.a.n.a.n.a.n.a.n.a.EPS
n.m.n.m.n.m.n.m.n.m.n.m.n.m.n.m.n.m.n.m.n.m.DPSAverage last 5 years
2.8%1.0%n.a.n.a.n.a.n.a.n.a.n.a.n.a.n.a.n.a.Average EBIT margin5.3%3.4%n.a.n.a.n.a.n.a.n.a.n.a.n.a.n.a.n.a.Average EBITDA margin
VALUATION RATIOS - ADJUSTED EARNINGS
2021E2020E2019E20182017201620152014201320122011SEKm14.724.899.1n.m.n.a.n.a.n.a.n.a.n.a.n.a.n.a.P/E (adj)1.93.25.335.2n.a.n.a.n.a.n.a.n.a.n.a.n.a.EV/EBITDA (adj)2.64.810.0n.m.n.a.n.a.n.a.n.a.n.a.n.a.n.a.EV/EBITA (adj)2.64.810.0n.m.n.a.n.a.n.a.n.a.n.a.n.a.n.a.EV/EBIT (adj)
VALUATION RATIOS - REPORTED EARNINGS
2021E2020E2019E20182017201620152014201320122011SEKm14.724.899.1n.m.n.a.n.a.n.a.n.a.n.a.n.a.n.a.P/E0.180.250.300.21n.a.n.a.n.a.n.a.n.a.n.a.n.a.EV/Sales1.93.25.335.2n.a.n.a.n.a.n.a.n.a.n.a.n.a.EV/EBITDA2.64.810.0n.m.n.a.n.a.n.a.n.a.n.a.n.a.n.a.EV/EBITA2.64.810.0n.m.n.a.n.a.n.a.n.a.n.a.n.a.n.a.EV/EBIT
0.0%0.0%0.0%0.0%n.a.n.a.n.a.n.a.n.a.n.a.n.a.Dividend yield (ord.)12.7%8.9%5.5%8.3%n.a.n.a.n.a.n.a.n.a.n.a.n.a.FCF yield12.7%8.9%5.5%8.3%n.a.n.a.n.a.n.a.n.a.n.a.n.a.FCF yield, adjusted for leases0.0%0.0%0.0%0.0%0.0%0.0%n.a.n.a.n.a.n.a.n.a.Payout ratio
Source: Company data and Nordea estimates
Marketing material commissioned by Qliro Group 85
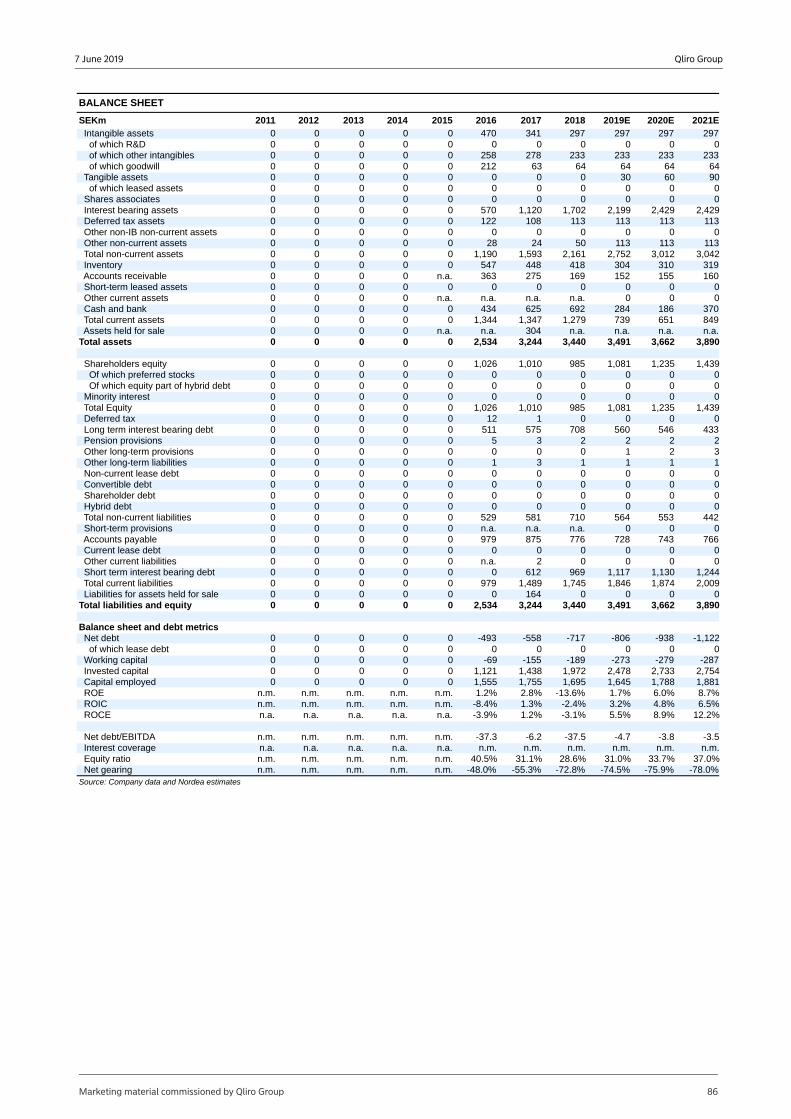
Qliro Group7 June 2019
BALANCE SHEET
2021E2020E2019E20182017201620152014201320122011SEKm29729729729734147000000Intangible assets
00000000000of which R&D23323323323327825800000of which other intangibles
646464646321200000of which goodwill90603000000000Tangible assets00000000000of which leased assets00000000000Shares associates
2,4292,4292,1991,7021,12057000000Interest bearing assets11311311311310812200000Deferred tax assets
00000000000Other non-IB non-current assets11311311350242800000Other non-current assets
3,0423,0122,7522,1611,5931,19000000Total non-current assets31931030441844854700000Inventory160155152169275363n.a.0000Accounts receivable
00000000000Short-term leased assets000n.a.n.a.n.a.n.a.0000Other current assets
37018628469262543400000Cash and bank8496517391,2791,3471,34400000Total current assetsn.a.n.a.n.a.n.a.304n.a.n.a.0000Assets held for sale
3,8903,6623,4913,4403,2442,53400000Total assets
1,4391,2351,0819851,0101,02600000Shareholders equity00000000000Of which preferred stocks00000000000Of which equity part of hybrid debt00000000000Minority interest
1,4391,2351,0819851,0101,02600000Total Equity000011200000Deferred tax
43354656070857551100000Long term interest bearing debt22223500000Pension provisions32100000000Other long-term provisions11113100000Other long-term liabilities00000000000Non-current lease debt00000000000Convertible debt00000000000Shareholder debt00000000000Hybrid debt
44255356471058152900000Total non-current liabilities000n.a.n.a.n.a.00000Short-term provisions
76674372877687597900000Accounts payable00000000000Current lease debt00002n.a.00000Other current liabilities
1,2441,1301,117969612000000Short term interest bearing debt2,0091,8741,8461,7451,48997900000Total current liabilities
0000164000000Liabilities for assets held for sale3,8903,6623,4913,4403,2442,53400000Total liabilities and equity
Balance sheet and debt metrics-1,122-938-806-717-558-49300000Net debt
00000000000of which lease debt-287-279-273-189-155-6900000Working capital
2,7542,7332,4781,9721,4381,12100000Invested capital1,8811,7881,6451,6951,7551,55500000Capital employed8.7%6.0%1.7%-13.6%2.8%1.2%n.m.n.m.n.m.n.m.n.m.ROE6.5%4.8%3.2%-2.4%1.3%-8.4%n.m.n.m.n.m.n.m.n.m.ROIC
12.2%8.9%5.5%-3.1%1.2%-3.9%n.a.n.a.n.a.n.a.n.a.ROCE
-3.5-3.8-4.7-37.5-6.2-37.3n.m.n.m.n.m.n.m.n.m.Net debt/EBITDAn.m.n.m.n.m.n.m.n.m.n.m.n.a.n.a.n.a.n.a.n.a.Interest coverage
37.0%33.7%31.0%28.6%31.1%40.5%n.m.n.m.n.m.n.m.n.m.Equity ratio-78.0%-75.9%-74.5%-72.8%-55.3%-48.0%n.m.n.m.n.m.n.m.n.m.Net gearing
Source: Company data and Nordea estimates
Marketing material commissioned by Qliro Group 86
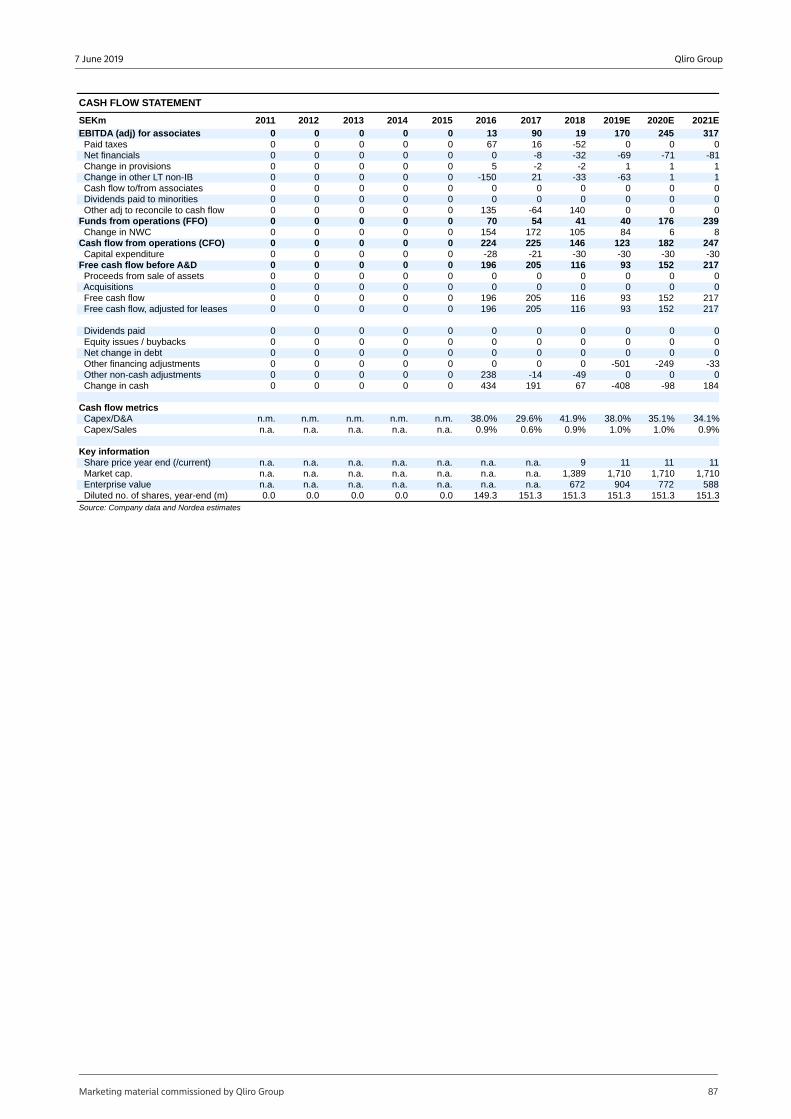
Qliro Group7 June 2019
CASH FLOW STATEMENT
2021E2020E2019E20182017201620152014201320122011SEKm31724517019901300000EBITDA (adj) for associates
000-52166700000Paid taxes-81-71-69-32-8000000Net financials
111-2-2500000Change in provisions11-63-3321-15000000Change in other LT non-IB00000000000Cash flow to/from associates00000000000Dividends paid to minorities000140-6413500000Other adj to reconcile to cash flow
2391764041547000000Funds from operations (FFO)868410517215400000Change in NWC
24718212314622522400000Cash flow from operations (CFO)-30-30-30-30-21-2800000Capital expenditure
2171529311620519600000Free cash flow before A&D00000000000Proceeds from sale of assets00000000000Acquisitions
2171529311620519600000Free cash flow2171529311620519600000Free cash flow, adjusted for leases
00000000000Dividends paid00000000000Equity issues / buybacks00000000000Net change in debt
-33-249-50100000000Other financing adjustments000-49-1423800000Other non-cash adjustments
184-98-4086719143400000Change in cash
Cash flow metrics34.1%35.1%38.0%41.9%29.6%38.0%n.m.n.m.n.m.n.m.n.m.Capex/D&A0.9%1.0%1.0%0.9%0.6%0.9%n.a.n.a.n.a.n.a.n.a.Capex/Sales
Key information1111119n.a.n.a.n.a.n.a.n.a.n.a.n.a.Share price year end (/current)
1,7101,7101,7101,389n.a.n.a.n.a.n.a.n.a.n.a.n.a.Market cap.588772904672n.a.n.a.n.a.n.a.n.a.n.a.n.a.Enterprise value
151.3151.3151.3151.3151.3149.30.00.00.00.00.0Diluted no. of shares, year-end (m)Source: Company data and Nordea estimates
Marketing material commissioned by Qliro Group 87
Qliro Group7 June 2019
Disclaimer and legal disclosuresOrigin of the reportThis publication or report originates from: Nordea Bank Abp, including its branches Nordea Danmark, Filial af Nordea Bank Abp, Finland, Nordea Bank Abp, filial i Norge and Nordea Bank Abp, filial i Sverige (together "Nordea") acting through their unit Nordea Markets.
Nordea Bank Abp is supervised by the European Central Bank and the Finnish Financial Supervisory Authority and the branches are supervised by the European Central Bank and the Finnish Financial Supervisory Authority and the Financial Supervisory Authorities in their respective countries.
Content of reportThis report has been prepared solely by Nordea Markets.
Opinions or suggestions from Nordea Markets credit and equity research may deviate from one another or from opinions presented by other departments in Nordea. This may typically be the result of differing time horizons, methodologies, contexts or other factors.
The information provided herein is not intended to constitute and does not constitute investment advice nor is the information intended as an offer or solicitation for the purchase or sale of any financial instrument. The information contained herein has no regard to the specific investment objectives, the financial situation or particular needs of any particular recipient. Relevant and specific professional advice should always be obtained before making any investment or credit decision
Opinions or ratings are based on one or more methods of valuation, for instance cash flow analysis, use of multiples, behavioural technical analyses of underlying market movements in combination with considerations of the market situation and the time horizon. Key assumptions of forecasts or ratings in research cited or reproduced appear in the research material from the named sources. The date of publication appears from the research material cited or reproduced. Opinions and estimates may be updated in subsequent versions of the report, provided that the relevant company/issuer is treated anew in such later versions of the report.
Validity of the reportAll opinions and estimates in this report are, regardless of source, given in good faith, and may only be valid as of the stated date of this report and are subject to changewithout notice.
No individual investment or tax adviceThe report is intended only to provide general and preliminary information to investors and shall not be construed as the basis for any investment decision. This report has been prepared by Nordea Markets as general information for private use of investors to whom the report has been distributed, but it is not intended as a personal recommendation of particular financial instruments or strategies and thus it does not provide individually tailored investment advice, and does not take into account the individual investor's particular financial situation, existing holdings or liabilities, investment knowledge and experience, investment objective and horizon or risk profile and preferences. The investor must particularly ensure the suitability of an investment as regards his/her financial and fiscal situation and investment objectives. The investor bears the risk of losses in connection with an investment.
Before acting on any information in this report, it is recommendable to consult (without being limited to) one's financial, legal, tax, accounting, or regulatory advisor in any relevant jurisdiction.
The information contained in this report does not constitute advice on the tax consequences of making any particular investment decision. Each investor shall make his/her own appraisal of the tax and other financial merits of his/her investment.
SourcesThis report may be based on or contain information, such as opinions, estimates and valuations which emanate from: Nordea Markets' analysts or representatives, publicly available information, information from other units of Nordea, or other named sources.
To the extent this publication or report is based on or contain information emanating from other sources ("Other Sources") than Nordea Markets ("External Information"), Nordea Markets has deemed the Other Sources to be reliable but neither Nordea, others associated or affiliated with Nordea nor any other person, do guarantee the accuracy, adequacy or completeness of the External Information.
Limitation of liabilityNordea or other associated and affiliated companies assume no liability as regards to any investment, divestment or retention decision taken by the investor on the basis of this report. In no event will Nordea or other associated and affiliated companies be liable for direct, indirect or incidental, special or consequential damages (regardless ofwhether being considered as foreseeable or not) resulting from the information in this report.
Risk informationThe risk of investing in certain financial instruments, including those mentioned in this report , is generally high, as their market value is exposed to a lot of different factors such as the operational and financial conditions of the relevant company, growth prospects, change in interest rates, the economic and political environment, foreign exchange rates, shifts in market sentiments etc. Where an investment or security is denominated in a different currency to the investor's currency of reference, changes in rates of exchange may have an adverse effect on the value, price or income of or from that investment to the investor. Past performance is not a guide to future performance. Estimates of future performance are based on assumptions that may not be realized. When investing in individual shares, the investor may lose all or part of the investments.
Conflicts of interestReaders of this document should note that Nordea Markets has received remuneration from the company mentioned in this document for the production of the report. The remuneration is not dependent on the content of the report.
Nordea, affiliates or staff in Nordea, may perform services for, solicit business from, hold long or short positions in, or otherwise be interested in the investments (including derivatives) of any company mentioned in the report.
To limit possible conflicts of interest and counter the abuse of inside knowledge, the analysts of Nordea Markets are subject to internal rules on sound ethical conduct, the management of inside information, handling of unpublished research material, contact with other units of Nordea and personal account dealing. The internal rules have been prepared in accordance with applicable legislation and relevant industry standards. The object of the internal rules is for example to ensure that no analyst will abuse or cause others to abuse confidential information. It is the policy of Nordea Markets that no link exists between revenues from capital markets activities and individual analyst remuneration. Nordea and the branches are members of national stockbrokers' associations in each of the countries in which Nordea has head offices. Internal rules have been developed in accordance with recommendations issued by the stockbrokers associations. This material has been prepared following the Nordea Conflict of Interest Policy, which may be viewed at www.nordea.com/mifid.
Distribution restrictionsThe securities referred to in this report may not be eligible for sale in some jurisdictions. This report is not intended for, and must not be distributed to private customers in the UK or the US. This research report is intended only for, and may be distributed only to, accredited investors, expert investors or institutional investors in Singapore who maycontact Nordea Bank, Singapore Branch of 138 Market Street, #09-01 CapitaGreen, Singapore 048946.
This report may be distributed by Nordea Bank Luxembourg S.A., 562 rue de Neudorf, L-2015 Luxembourg which is subject to the supervision of the Commission de Surveillance du Secteur Financier.
This publication or report may be distributed by Nordea Bank Abp Singapore Branch, which is subject to the supervision of the European Central Bank, the Finnish Financial Supervisory Authority and the Monetary Authority of Singapore.
This publication or report may be distributed in the UK to institutional investors by Nordea Bank Abp London Branch of 6th Floor, 5 Aldermanbury Square, London, EC2V 7AZ, which is under supervision of the European Central Bank, Finanssivalvonta (Financial Supervisory Authority) in Finland and subject to limited regulation by the Financial Conduct Authority and Prudential Regulation Authority in the United Kingdom. Details about the extent of our regulation by the Financial Conduct Authority and Prudential Regulation Authority are available from us on request.
This report may not be mechanically duplicated, photocopied or otherwise reproduced, in full or in part, under applicable copyright laws.
Marketing material commissioned by Qliro Group 88
Qliro Group7 June 2019
Analyst ShareholdingNordea Markets analysts do not hold shares in the companies that they cover.No holdings or other affiliations by analysts or associates.
Market-making obligations and other significant financial interestNordea Markets has no market-making obligations in Qliro Group.
Fair value sensitivityWe calculate our fair values by weighting DCF, DDM, SOTP, asset-based and other standard valuation methods. When applicable, we set a 12-month target price by applying an appropriate premium/discount and/or other relevant adjustment to our fair value to reflect the share price potential we see within the coming 12 months. Our fair values are sensitive to changes in valuation assumptions, of which growth, margins, tax rates, working capital ratios, investment-to-sales ratios and cost of capital are typically the most sensitive. It should be noted that our fair values would change by a disproportionate factor if changes are made to any or all valuation assumptions, owing to the non-linear nature of the standard valuation models applied (mentioned above). As a consequence of the standard valuation models we apply, changes of 1-2 percentage points in any single valuation assumption can change the derived fair value by as much as 30% or more. Dividend payouts are included in the target price. All research is produced on an ad hoc basis and will be updated when the circumstances require it.
Investment banking transactionsIn view of Nordea’s position in its markets readers should assume that the bank may currently or may in the coming three months and beyond be providing or seeking to provide confidential investment banking services to the company/companies
Marketing MaterialThis research report should be considered marketing material, as it has been commissioned and paid for by the subject company, and has not been prepared in accordance with the regulations designed to promote the independence of investment research and it is not subject to any legal prohibition on dealing ahead of the dissemination of the report. However, Nordea Markets analysts are according to internal policies not allowed to hold shares in the companies/sectors that they cover.
Where applicable, recommendation changes are available at: https://research.nordea.com/compliance#equity-changes.
Issuer Review
This report has been reviewed, for the purpose of verification of fact or sequence of facts, by the Issuer of the relevant financial instruments mentioned in the report prior to publication. No Nordea recommendations or target prices have, however, been disclosed to the issuer. The review has led to changes of facts in the report.
Completion Date
06 Jun 2019, 20:14 CET
Nordea Bank Abp Nordea Bank Abp, filial i Sverige Nordea Danmark, Filial af Nordea Nordea Bank Abp, filial i NorgeBank Abp, Finland
Nordea Markets Division,Research
Nordea Markets Division,Research
Nordea Markets Division,Research
Nordea Markets Division,Research
Visiting address:Aleksis Kiven katu 7, Helsinki
Visiting address:Smålandsgatan 17
Visiting address:Grønjordsvej 10
Visiting address:Essendropsgate 7
FI-00020 Nordea SE-105 71 Stockholm DK-2300 Copenhagen S N-0107 OsloFinland Sweden Denmark Norway
Tel: +358 9 1651 Tel: +46 8 614 7000 Tel: +45 3333 3333 Tel: +47 2248 5000Fax: +358 9 165 59710 Fax: +46 8 534 911 60 Fax: +45 3333 1520 Fax: +47 2256 8650
Reg.no. 2858394-9Satamaradankatu 5Helsinki
Marketing material commissioned by Qliro Group 89
Related Documents