PROJECT DESIGN DOCUMENT FORM (CDM PDD) - Version 03.1 CDM – Executive Board page 1 This template shall not be altered. It shall be completed without modifying/adding headings or logo, format or font. CLEAN DEVELOPMENT MECHANISM PROJECT DESIGN DOCUMENT FORM (CDM-PDD) Version 03 - in effect as of: 28 July 2006 CONTENTS A. General description of project activity B. Application of a baseline and monitoring methodology C. Duration of the project activity / crediting period D. Environmental impacts E. Stakeholders’ comments Annexes Annex 1: Contact information on participants in the project activity Annex 2: Information reg arding public funding Annex 3: Baseline information Annex 4: Monitoring plan

Welcome message from author
This document is posted to help you gain knowledge. Please leave a comment to let me know what you think about it! Share it to your friends and learn new things together.
Transcript
8/8/2019 Qi Qi Har Wind Farm
http://slidepdf.com/reader/full/qi-qi-har-wind-farm 1/53
PROJECT DESIGN DOCUMENT FORM (CDM PDD) - Version 03.1
CDM – Executive Board page 1
This template shall not be altered. It shall be completed without modifying/adding headings or logo, format orfont.
CLEAN DEVELOPMENT MECHANISM
PROJECT DESIGN DOCUMENT FORM (CDM-PDD)
Version 03 - in effect as of: 28 July 2006
CONTENTS
A. General description of project activity
B. Application of a baseline and monitoring methodology
C. Duration of the project activity / crediting period
D. Environmental impacts
E. Stakeholders’ comments
Annexes
Annex 1: Contact information on participants in the project activity
Annex 2: Information regarding public funding
Annex 3: Baseline information
Annex 4: Monitoring plan
8/8/2019 Qi Qi Har Wind Farm
http://slidepdf.com/reader/full/qi-qi-har-wind-farm 2/53
PROJECT DESIGN DOCUMENT FORM (CDM PDD) - Version 03.1
CDM – Executive Board page 2
This template shall not be altered. It shall be completed without modifying/adding headings or logo, format orfont.
SECTION A. General description of project activity
A.1 Title of the project activity:
Project title: Guohua Qiqihaer Fuyu 1st Stage Wind Farm Project
PDD version: 3.0
Completion date PDD:15/08/2007
Revision History:
Version 1.0: First draft
Version 2.0: Second draft, editorial changes
Version 3.0: Amendments in response to validation
A.2. Description of the project activity:
Description and purpose of the project activity
The Guohua Qiqihaer Fuyu 1st Stage Wind Farm Project involves the construction of a wind farm in
Fuyu County of Qiqihaer City in the West of Heilongjiang Province in the North East of China.
The main objective of the project is to generate power from clean renewable wind power in
Heilongjiang Province and contribute to the sustainability of power generation of the North East
China Grid. The wind farm will have a total installed capacity of 49.5 MW. The project consists of
the installation and operation of 33 domestically produced wind turbines with an individual capacity
of 1500 kW.
The project’s expected effective operating hours amount to 2026 hrs/year. The expected net annual
power supply to the grid is 100 million kWh. The project will be connected to the Fuyu County grid
via an on-site step-up transformer station that connects to Beijiao 110 kV transformer station. This
transformer station is linked to the Heilongjiang Provincial Grid, which is part of the North East
China Grid.
This project fits with the Chinese government objective to make the energy sector in general and the
power sector in particular more sustainable through the stimulation of wind power
Contribution to sustainable development
The project activity’s contributions to sustainable development are:
• Reducing the dependence on exhaustible fossil fuels for power generation;
• Reducing air pollution by replacing coal-fired power plants with clean, renewable power;
• Reducing the adverse health impacts from air pollution;
• Reducing the emissions of greenhouse gases, to combat global climate change;
• Contributing to local economic development through employment creation.
8/8/2019 Qi Qi Har Wind Farm
http://slidepdf.com/reader/full/qi-qi-har-wind-farm 3/53
PROJECT DESIGN DOCUMENT FORM (CDM PDD) - Version 03.1
CDM – Executive Board page 3
This template shall not be altered. It shall be completed without modifying/adding headings or logo, format orfont.
A.3. Project participants:
The parties involved in the project are shown in Table A.1:
Table A.1 Project participants
Name of Party
involved (*) ((host)
indicates a host Party)
Private and/or public entity(ies) project participants (*) (as
applicable)
The Party involved wishes
to be considered as project
participant (Yes/No)
China (host)Private entity: Guohua (Qiqihaer) Wind Power Co.,
Ltd. *No
Japan Private entity: Mitsui & Co., Ltd.* No
For more detailed contact information on participants in the project activities, please refer to Annex 1.
A.4. Technical description of the project activity:
A.4.1. Location of the project activity:
A.4.1.1. Host Party(ies):
Country: People’s Republic of China
A.4.1.2. Region/State/Province etc.:
Region: Heilongjiang Province
A.4.1.3. City/Town/Community etc:
City / County: Qiqihaer City / Fuyu County
A.4.1.4. Detail of physical location, including information allowing the
unique identification of this project activity (maximum one page):
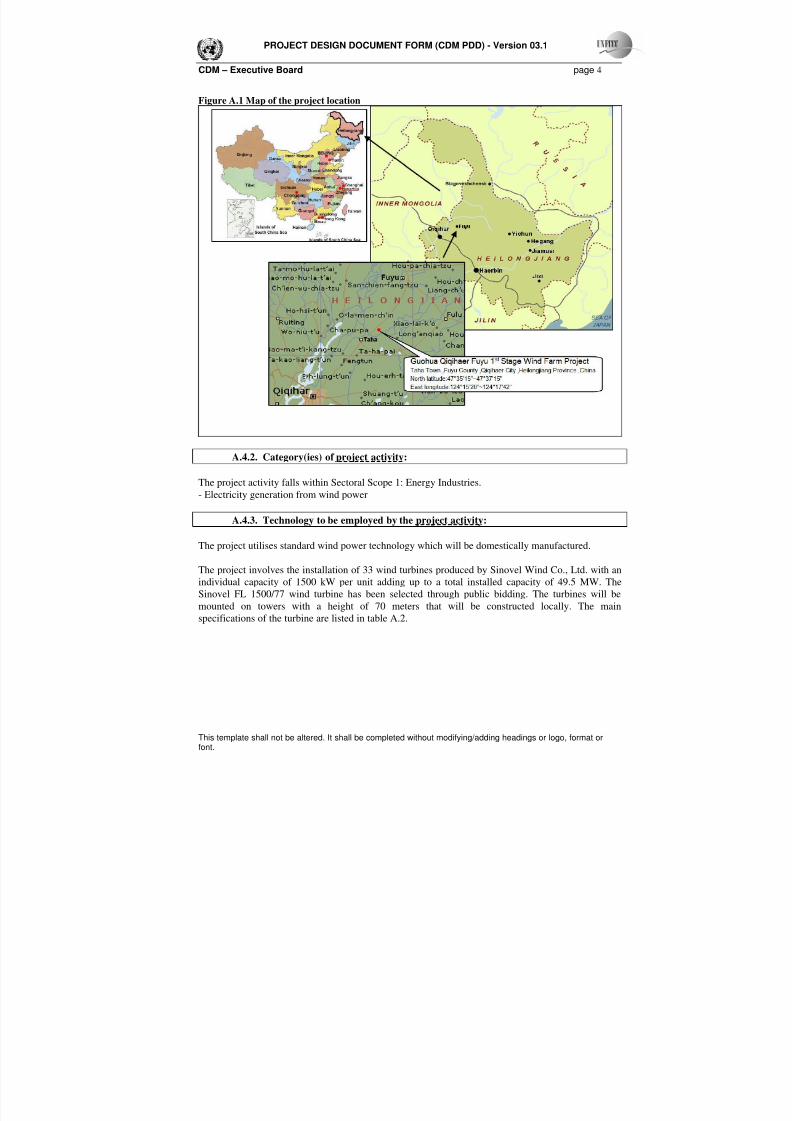
The project site is located in Fuyu County of the administrative region of Qiqihaer City in
Heilongjiang Province in the Northeast of China. The site location’s approximate coordinates are east
longitude of 124°15'20" ~ 124°17'42" and north latitude of 47°35'15" ~ 47°37'15". The lay-out of thewind farm consists of 33 turbines that are positioned to take optimal advantage of the prevailing wind.
Figure A.1 shows the location of the project.
8/8/2019 Qi Qi Har Wind Farm
http://slidepdf.com/reader/full/qi-qi-har-wind-farm 4/53
PROJECT DESIGN DOCUMENT FORM (CDM PDD) - Version 03.1
CDM – Executive Board page 4
This template shall not be altered. It shall be completed without modifying/adding headings or logo, format orfont.
Figure A.1 Map of the project location
A.4.2. Category(ies) of project activity:
The project activity falls within Sectoral Scope 1: Energy Industries.
- Electricity generation from wind power
A.4.3. Technology to be employed by the project activity:
The project utilises standard wind power technology which will be domestically manufactured.
The project involves the installation of 33 wind turbines produced by Sinovel Wind Co., Ltd. with an
individual capacity of 1500 kW per unit adding up to a total installed capacity of 49.5 MW. The
Sinovel FL 1500/77 wind turbine has been selected through public bidding. The turbines will be
mounted on towers with a height of 70 meters that will be constructed locally. The main
specifications of the turbine are listed in table A.2.
8/8/2019 Qi Qi Har Wind Farm
http://slidepdf.com/reader/full/qi-qi-har-wind-farm 5/53
PROJECT DESIGN DOCUMENT FORM (CDM PDD) - Version 03.1
CDM – Executive Board page 5
This template shall not be altered. It shall be completed without modifying/adding headings or logo, format orfont.
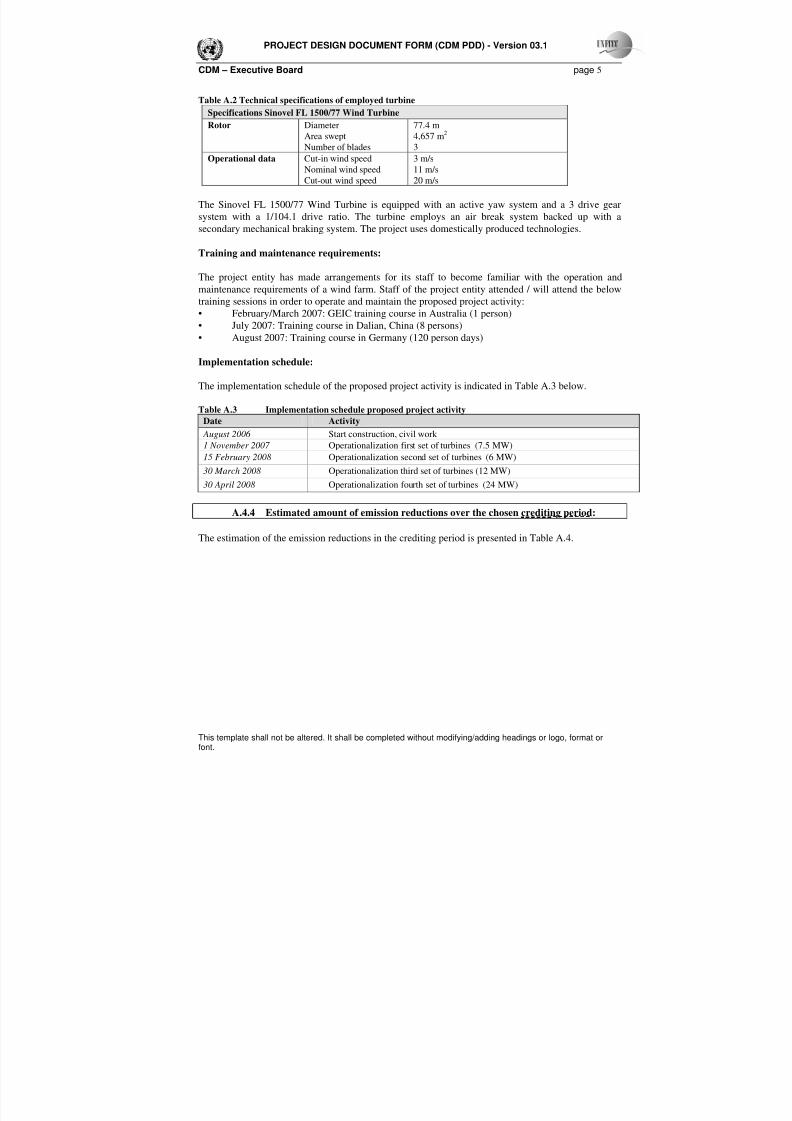
Table A.2 Technical specifications of employed turbine
Specifications Sinovel FL 1500/77 Wind Turbine
Rotor Diameter
Area sweptNumber of blades
77.4 m
4,657 m2
3
Operational data Cut-in wind speed Nominal wind speed Cut-out wind speed
3 m/s
11 m/s
20 m/s
The Sinovel FL 1500/77 Wind Turbine is equipped with an active yaw system and a 3 drive gear
system with a 1/104.1 drive ratio. The turbine employs an air break system backed up with a
secondary mechanical braking system. The project uses domestically produced technologies.
Training and maintenance requirements:
The project entity has made arrangements for its staff to become familiar with the operation andmaintenance requirements of a wind farm. Staff of the project entity attended / will attend the below
training sessions in order to operate and maintain the proposed project activity:
• February/March 2007: GEIC training course in Australia (1 person)
• July 2007: Training course in Dalian, China (8 persons)
• August 2007: Training course in Germany (120 person days)
Implementation schedule:
The implementation schedule of the proposed project activity is indicated in Table A.3 below.
Table A.3 Implementation schedule proposed project activity
Date Activity
August 2006 Start construction, civil work
1 November 2007 Operationalization first set of turbines (7.5 MW)
15 February 2008 Operationalization second set of turbines (6 MW)
30 March 2008 Operationalization third set of turbines (12 MW)
30 April 2008 Operationalization fourth set of turbines (24 MW)
A.4.4 Estimated amount of emission reductions over the chosen crediting period:
The estimation of the emission reductions in the crediting period is presented in Table A.4.
8/8/2019 Qi Qi Har Wind Farm
http://slidepdf.com/reader/full/qi-qi-har-wind-farm 6/53
PROJECT DESIGN DOCUMENT FORM (CDM PDD) - Version 03.1
CDM – Executive Board page 6
This template shall not be altered. It shall be completed without modifying/adding headings or logo, format orfont.
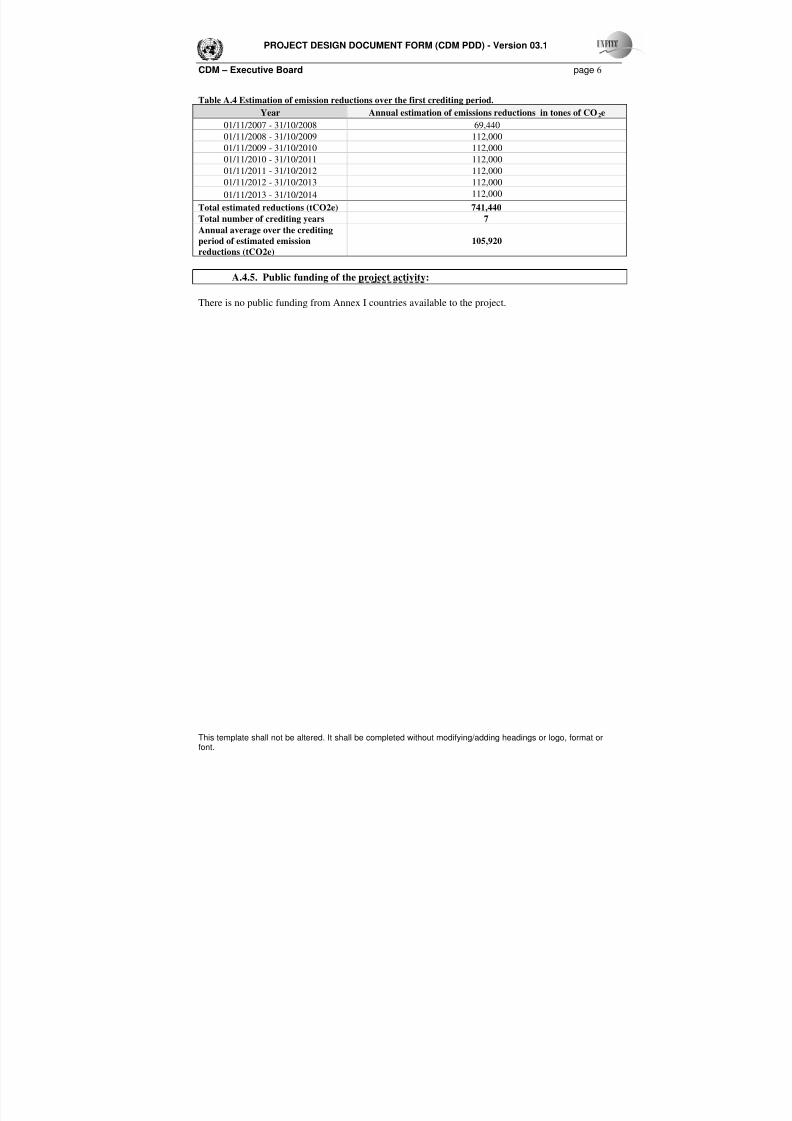
Table A.4 Estimation of emission reductions over the first crediting period.
Year Annual estimation of emissions reductions in tones of CO2e
01/11/2007 - 31/10/2008 69,440
01/11/2008 - 31/10/2009 112,00001/11/2009 - 31/10/2010 112,000
01/11/2010 - 31/10/2011 112,000
01/11/2011 - 31/10/2012 112,000
01/11/2012 - 31/10/2013 112,000
01/11/2013 - 31/10/2014 112,000
Total estimated reductions (tCO2e) 741,440
Total number of crediting years 7
Annual average over the crediting
period of estimated emission
reductions (tCO2e)
105,920
A.4.5. Public funding of the project activity:
There is no public funding from Annex I countries available to the project.
8/8/2019 Qi Qi Har Wind Farm
http://slidepdf.com/reader/full/qi-qi-har-wind-farm 7/53
PROJECT DESIGN DOCUMENT FORM (CDM PDD) - Version 03.1
CDM – Executive Board page 7
This template shall not be altered. It shall be completed without modifying/adding headings or logo, format orfont.
SECTION B. Application of a baseline and monitoring methodology
B.1. Title and reference of the approved baseline and monitoring methodology applied to theproject activity:
Baseline methodology:
Approved consolidated baseline methodology ACM0002 (Version 6): “Consolidated baseline
methodology for grid-connected electricity generation from renewable sources”.
The methodology draws upon:
• Tool for the Demonstration and Assessment of Additionality (Version 03).
Monitoring methodology:
Approved consolidated monitoring methodology ACM0002 (Version 6): “Consolidated monitoring
methodology for zero-emissions grid-connected electricity generation from renewable sources”.
Reference: UNFCCC website: http://cdm.unfccc.int/methodologies/PAmethodologies/approved.html
B.2 Justification of the choice of the methodology and why it is applicable to the project
activity:
The baseline methodology ACM0002 is applicable to the proposed project, because the project meetsall the applicability criteria stated in the methodology:
• The proposed project is a grid-connected renewable power generation project.
• The project is a capacity addition from a renewable energy source, i.e. wind resources.
• The project does not involve an on-site switch from fossil fuels to a renewable source.
• The geographic and system boundaries for the relevant electricity grid, the North East China
Power Grid, can be clearly identified and information on the characteristics of the grid is
available.
• The methodology will be used in conjunction with the approved consolidated monitoring
methodology ACM0002 (Consolidated monitoring methodology for grid-connected electricity
generation from renewable sources).
The latest version of ACM0002 (version 6) has been applied.
B.3. Description of the sources and gases included in the project boundary
The project’s boundary is the North East China Power grid. The sources and gases included in the
project boundary are described in Table B.1 as below:

8/8/2019 Qi Qi Har Wind Farm
http://slidepdf.com/reader/full/qi-qi-har-wind-farm 8/53
PROJECT DESIGN DOCUMENT FORM (CDM PDD) - Version 03.1
CDM – Executive Board page 8
This template shall not be altered. It shall be completed without modifying/adding headings or logo, format orfont.
Table B.1 Inclusion of gases and sources in the calculation of the emission reductions
Source Gas Included? Justification / explanation
CO2 Yes Included as per the ACM0002 methodology
CH4 No Excluded as per ACM0002.
B a s e l i n
eFossil fuel-fired Power
plants connected to theNorth East China Power
grid N2O No Excluded as per ACM0002.
CO2 No The project activity is a wind power generation
project which will not create emissions itself.
CH4 No The project activity is a wind power generation
project which will not create emissions itself.
P r o j e c t A c t i v i t y Guohua Qiqihaer Fuyu
1st
stage Wind Farm
Project
N2O No The project activity is a wind power generation
project which will not create emissions itself.
In line with the methodology, the only greenhouse gas accounted for in the calculation of the emission
reductions is CO2. The project’s spatial boundary is the Guohua Qiqihaer Fuyu 1st Stage Wind FarmProject and the North East China Power Grid as defined below. The project is connected through
Beijiao transformer station to the Heilongjiang Provincial Power Grid (See also figure B.1.).
According to the ACM0002 (version 6) methodology, the relevant grid definition should be based on
the following considerations:
1. Use the delineation of grid boundaries as provided by the DNA of the host country if available; or
2. Use, where DNA guidance is not available, the following definition of boundary:
In large countries with layered dispatch system (e.g. state/provincial/regional/national) the regional
grid definition should be used.
According to above requirements, the regional grid is selected as the project boundary.
The project is connected to the Heilongjiang Provincial Power Grid through the Beijiao transformer
station1. The Heilongjiang Power Grid is part of the North East China Power grid (illustrated in figure
B.1), which includes the Heilongjiang, Jilin and Liaoning Provincial Power Grids.
1 See also section B.7.2 for a diagram of the project’s connection to the grid.

8/8/2019 Qi Qi Har Wind Farm
http://slidepdf.com/reader/full/qi-qi-har-wind-farm 9/53
PROJECT DESIGN DOCUMENT FORM (CDM PDD) - Version 03.1
CDM – Executive Board page 9
This template shall not be altered. It shall be completed without modifying/adding headings or logo, format orfont.
Figure B.1 North East China Power Grid
In agreement with the methodology, leakage (arising from power plant construction, fuel handling,
etc.) is ignored. The project participants also do not claim emission reductions resulting from a
reduction of these emissions under the baseline level.
B.4. Description of how the baseline scenario is identified and description of the identified
baseline scenario:
The baseline methodology ACM0002 only applies to grid connected renewable projects and is only
applicable if the most likely baseline scenario is electricity production from existing and future grid-
connected power plants. This section discusses the plausible baseline scenarios, and selects the
baseline scenario on the basis of a barrier analysis. More information can be found in Section B.5
1. Identification of alternatives to the project activity consistent with current laws and regulations
8/8/2019 Qi Qi Har Wind Farm
http://slidepdf.com/reader/full/qi-qi-har-wind-farm 10/53
PROJECT DESIGN DOCUMENT FORM (CDM PDD) - Version 03.1
CDM – Executive Board page 10
This template shall not be altered. It shall be completed without modifying/adding headings or logo, format orfont.
Under the current circumstances of the Chinese power sector there are four plausible alternatives to
the project activity. These four plausible alternatives are:
Scenario 1: Continuation of current practice - power supply is provided from grid
Under this scenario the increased demand for power on the North East China Power Grid would be
met by newly installed capacity connected to the grid according to business as usual, which means
predominantly through new coal fired plants.
Scenario 2: Fossil fuel-fired power generation resulting in the same amount of power delivery to
the grid.
Since wind power generally has a capacity factor of no more than 30%, while the capacity factor of a
fossil fuel power plant is much higher (at least double), an equivalent fossil fuel plant would be of the
order of 25MW.
Scenario 3: The proposed wind power project activity, without the support of CDM
This means the development of the Guohua Qiqihaer Fuyu 1st Stage Wind Farm Project without the
support of CDM.
Scenario 4: Power generation from other renewable power sources (hydropower in the context
of Heilongjiang Province)
Since grid connected hydropower is the only renewable technology with investment returns
comparable to those of wind developments, this alternative refers to hydropower plant of equivalent
capacity.
2. Justification of the selection of the baseline scenario
We explain below the selection of the baseline scenario and conclude that Scenario 1, i.e.
Continuation of current practice - power supply is provided from grid, is selected as the baseline
scenario.
Scenario 2 is not applicable because it does not comply with prevailing laws and regulations, which
prohibit the construction of coal-fired power plants with capacity below 135 MW in areas served by
the regional or provincial grid. Because 25 MW is less then 135 MW, this scenario has been
eliminated.
Scenario 3: Barriers to the development of wind power in China are well documented, well known
and presented in detail in Section B5. The project has an IRR of 6.35%, which is below the 8%
benchmark for projects in the power industry as formulated in the Interim Rules on Economic
Assessment of Electrical Engineering Retrofit Projects (see also section B.5). Therefore, the project
without the CDM cannot be considered as part of the baseline.
Scenario 4 is not applicable because of major barriers to hydropower development as most suitable
location for hydropower station development have already been occupied and new hydro power
projects face equivalent investment return as that for a wind power project . Therefore scenario 4 is
not applicable and is eliminated.

8/8/2019 Qi Qi Har Wind Farm
http://slidepdf.com/reader/full/qi-qi-har-wind-farm 11/53
PROJECT DESIGN DOCUMENT FORM (CDM PDD) - Version 03.1
CDM – Executive Board page 11
This template shall not be altered. It shall be completed without modifying/adding headings or logo, format orfont.
Scenario 1 is therefore selected as the project baseline. Thus, the baseline scenario of the Guohua
Qiqihaer Fuyu 1st Stage Wind Farm Project is the continued operation of the existing power plants
and the addition of new generation sources to meet electricity demand.
B.5. Description of how the anthropogenic emissions of GHG by sources are reduced below
those that would have occurred in the absence of the registered CDM project activity
(assessment and demonstration of additionality):
The additionality of the project activity is demonstrated using the steps described in the ‘Tool for the
demonstration and assessment of additionality’ (version 03). See UNFCC website:
http://cdm.unfccc.int/methodologies/PAmethodologies/AdditionalityTools/Additionality_tool.pdf
Step 1. Identification of alternatives to the project activity consistent with current laws and
regulations
Sub-step 1a: Define alternatives to the project activity
This methodological step requires a number of sub-steps, the first of which is the identification of
realistic and credible alternatives to the project activity. There are only a few alternatives that are
prima facie realistic and credible in the context of the North East China Power Grid:
• Fossil fuel-fired power generation
• Hydropower
• The proposed windpower activity, without the support of CDM
• The same service of power supply is provided from grid
These are credible and realistic alternatives and alternatives that should be included as per the
description of the methodology (the additionality tool requires that the proposed project activity be
included as an alternative, without the benefit from CDM).
Coal-fired power generation is the dominant power supply option in China. In case of the North East
China Power Grid, both coal-fired power and to a lesser degree hydropower are common options for
power supply. Coal-fired power accounted for 84.1% of installed capacity and 93.5% of power
generation in 2004. Hydropower, accounted for 15.3% of installed capacity and 6.2% of power
generation in 2004.2
Continuation of the present situation (no capacity addition to the project electricity system) is not
realistic in the context of this project, because power demand has been increasing rapidly over the lastfew years. China has experienced severe power shortages, spurned by fast demand for power; and
hence the grids have been expanding rapidly. For example, the total generation on the North East
China Power Grid grew by 22.3% between 2002 and 2004.3
Sub-step 1b: Consistency with mandatory laws and regulations
The second sub-steps involve the confrontation of the alternatives with China’s applicable laws and
regulations. Three of the four alternatives identified above are in compliance with China’s relevant
2 See China Electric Power Yearbook 2005, pp. 473-474.
3 See China Electric Power Yearbook (editions 2003 and 2005).
8/8/2019 Qi Qi Har Wind Farm
http://slidepdf.com/reader/full/qi-qi-har-wind-farm 12/53
PROJECT DESIGN DOCUMENT FORM (CDM PDD) - Version 03.1
CDM – Executive Board page 12
This template shall not be altered. It shall be completed without modifying/adding headings or logo, format orfont.
laws and regulations. The only alternative that is not in compliance with China’s relevant laws and
regulations is the construction of a fossil-fuel fired power plant providing the same amount of power
as the proposed project activity. Such a thermal power plant would have a capacity of approximately
25MW, and thermal power stations of such scale are prohibited.4
The fact that the other options are in compliance with Chinese regulations may be demonstrated by
referring to statistics, which show that each of these power supply options is used in China.
The proposed project activity is consistent with national policies for environmental protection, energy
conservation and sustainable development. However, there are no binding legal and regulatory
requirements for this project type. The Renewable Energy Law adopted by the National People’s
Congress on 28 Feb. 2005 encourages and supports renewable-based power generation, but does not
stipulate specific goals for local air quality improvement.
Conclusion: We conclude that three of the four alternative scenarios for the proposed project activity
are in compliance with the Chinese regulations. The exception is the construction of a coal-fired
thermal power plant with equivalent power supply (Scenario 2), which is not in compliance with the
relevant Chinese laws and regulations. As there are alternatives to the project activity that are in
compliance with the relevant Chinese laws and regulations, the project may be additional.
Step 2. Investment analysis
Sub-step 2a: Determine appropriate analysis method
The analysis will be analyzed through Option III of the additionality tool, i.e. benchmark analysis.
This method is applicable because:
Option I: simple cost analysis, does not apply as the project generates economic returns
through the sales of electric power to the grid.
Option II: investment comparison analysis, can in the case of the proposed project activity not
be transparently demonstrated as economic and financial information on alternatives to the
project activity in Heilongjiang Province is considered confidential by such project operators
and could not be obtained.
Option III, benchmark analysis can be transparently demonstrated using financial/economic
information for the proposed project activity and compare financial indicators against a
relevant industry benchmark hurdle rate.
Conclusion: We conclude that option III is applicable to the project activity as transparent data on the
project activity and relevant industry benchmark is available.
Sub-step 2b – Option III: Apply benchmark analysis
4 Conventional coal-fired power plants are consistent with regulations although the construction of small-scale
power plants with a capacity under 135 MW has been prohibited, see General Office of the State Council
(2002), Notice of the General Office of the State Council concerning the Strict Prohibition of the
Construction of Thermal Power Units with a Capacity of 135MW or Below, Guo Ban Fa Ming Dian [2002]
Document No.6.

8/8/2019 Qi Qi Har Wind Farm
http://slidepdf.com/reader/full/qi-qi-har-wind-farm 13/53
PROJECT DESIGN DOCUMENT FORM (CDM PDD) - Version 03.1
CDM – Executive Board page 13
This template shall not be altered. It shall be completed without modifying/adding headings or logo, format orfont.
We conduct the investment analysis through a calculation of the Internal Rate of Return (IRR) of the
project and compare this with a benchmark stated on the Interim Rules on Economic Assessment of
Electrical Engineering Retrofit Projects, issued by the State Power Corporation of China. The Interim
Rules provide a guideline for projects in the electric power industry which state a minimum InternalRate of Return (IRR) of 8%. This minimum IRR is defined as a project IRR based on cash in- and
outflows only, and does not take into account the source of financing. The comparison of project IRR
as opposed to equity IRR has been chosen as the 8% hurdle for project IRR is a widely accepted
standard for projects in the power industry. Many of China’s power projects apply the 8% benchmark
IRR for financial assessment and use it as a hurdle rate for investment in the power industry such as
hydropower projects, fossil fuel fired projects, transmission and substation projects.
Sub-step 2c: Calculation and comparison of financial indicators
For the calculation of the IRR for the proposed wind farm, we use the parameters listed in Table B.2
which reflect the actual Guohua Qiqihaer Fuyu 1st Stage Wind Farm Project. The Total investment
amount, annual power supply and annual operation and maintenance costs are from the Feasibility
Study for the wind farm project, while the grid tariff is based on the outcome of a recent tender for
another wind farm project. The grid price for the proposed project has not yet been determined but
will be based on the outcome of recent tenders of other wind farm projects. We assume an investment
horizon of 21 years.
Table B.2 Parameters used in the calculation of the Internal Rate of Return
Parameter Value Unit EURO equivalent5
Total investment 419,310,000 RMB 41,450,178
Investment horizon 1 year construction plus 20 years operation -
Annual power supply 100,000 MWh -
Annual Operation and
Maintenance costs
10,480,000 (average)6 RMB 1,035,983
Grid tariff 0.509 RMB/kWh 0.050
Value Added Tax (VAT) 8.5 % -
CER Price (assumed price) 10 EUR 10
We calculate the Internal Rate of Return based on investments being made in the first year and power
sales in each subsequent year. A spreadsheet with the detailed calculation is available to the validator.
Table B.3 summarizes the main results of the calculations.
Table B.3 Project Internal Rate of Return (IRR), 21 years investment horizon
Internal Rate of Return
Project without CDM revenues 6.35 %Project with CDM revenues 10.09 %
Without the revenues from the sale of CERs, the IRR is 6.35%, below the benchmark of 8%. With the
revenues from the sale of CERs, the IRR exceeds 8% for a reasonable CER price. From these results
it is concluded that without CDM, the project is economically and financially unattractive. The
revenues from CDM, through the sale of CERs, are necessary to make the project attractive.
5 An exchange rate of 10.116 RMB/EURO has been applied to calculate the EURO equivalent values of the
parameters from the feasibility study. Source of exchange rate: Yahoo Finance.
6 For detailed values refer to Annex 5
8/8/2019 Qi Qi Har Wind Farm
http://slidepdf.com/reader/full/qi-qi-har-wind-farm 14/53
PROJECT DESIGN DOCUMENT FORM (CDM PDD) - Version 03.1
CDM – Executive Board page 14
This template shall not be altered. It shall be completed without modifying/adding headings or logo, format orfont.
Sub-step 2d: Sensitivity analysis
The tool for the demonstration and assessment of additionality requires that a sensitivity analysis is
conducted to check whether, under reasonable variations in the critical assumptions, the results of theanalysis remain unaltered. We have used as critical assumptions:
• Grid price
• Static total investment
• Annual Power Supply
• Annual O&M costs
• CER Price
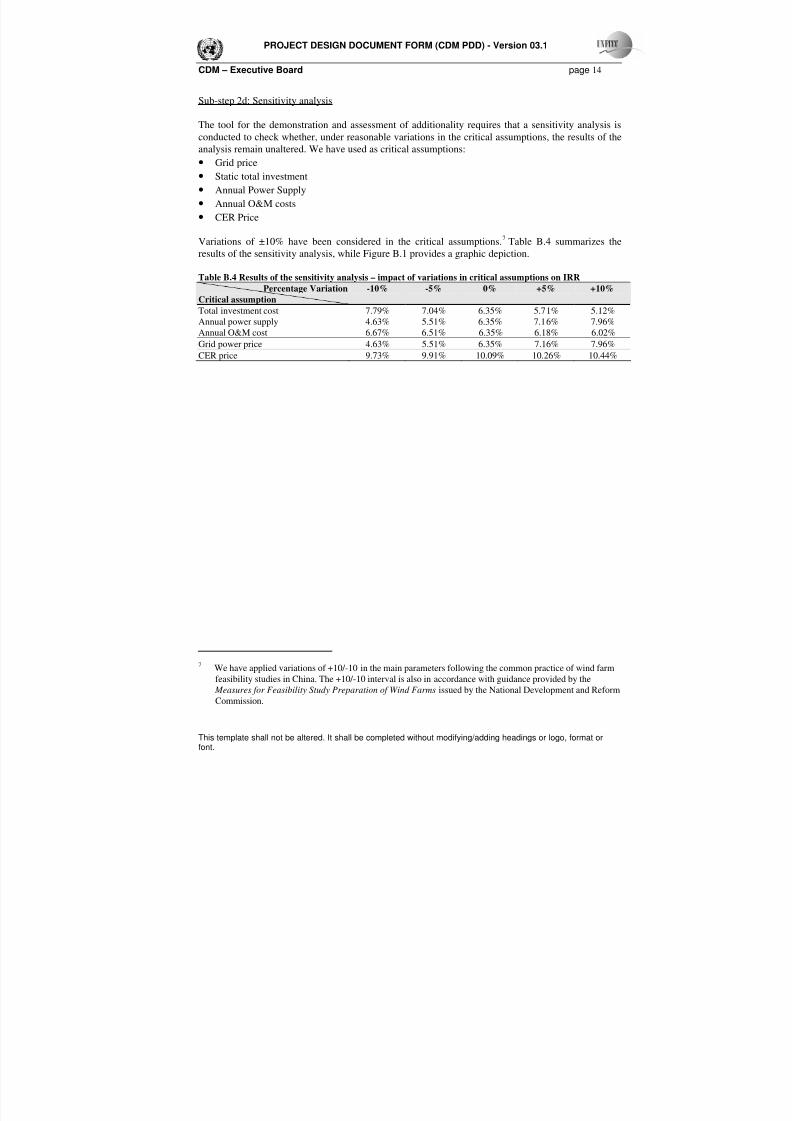
Variations of ±10% have been considered in the critical assumptions.7
Table B.4 summarizes the
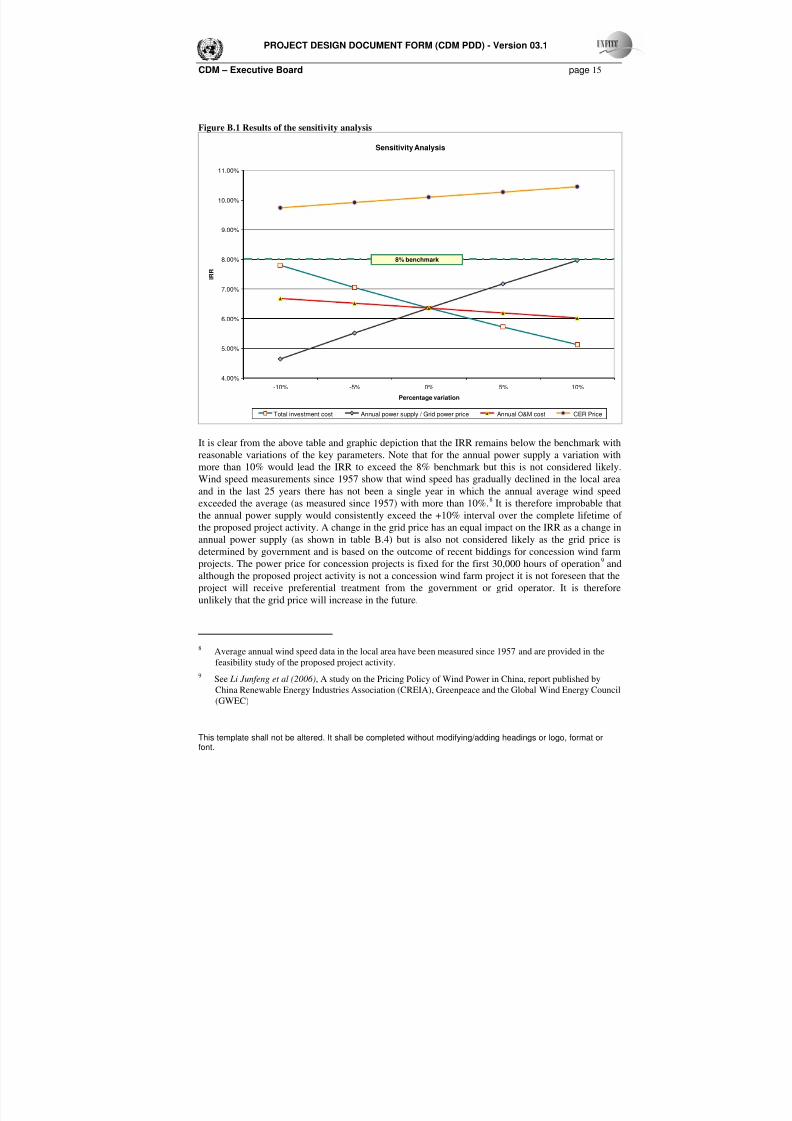
results of the sensitivity analysis, while Figure B.1 provides a graphic depiction.
Table B.4 Results of the sensitivity analysis – impact of variations in critical assumptions on IRR Percentage Variation
Critical assumption
-10% -5% 0% +5% +10%
Total investment cost 7.79% 7.04% 6.35% 5.71% 5.12%
Annual power supply 4.63% 5.51% 6.35% 7.16% 7.96%
Annual O&M cost 6.67% 6.51% 6.35% 6.18% 6.02%
Grid power price 4.63% 5.51% 6.35% 7.16% 7.96%
CER price 9.73% 9.91% 10.09% 10.26% 10.44%
7We have applied variations of +10/-10 in the main parameters following the common practice of wind farm
feasibility studies in China. The +10/-10 interval is also in accordance with guidance provided by the
Measures for Feasibility Study Preparation of Wind Farms issued by the National Development and ReformCommission.
8/8/2019 Qi Qi Har Wind Farm
http://slidepdf.com/reader/full/qi-qi-har-wind-farm 15/53
PROJECT DESIGN DOCUMENT FORM (CDM PDD) - Version 03.1
CDM – Executive Board page 15
This template shall not be altered. It shall be completed without modifying/adding headings or logo, format orfont.
Figure B.1 Results of the sensitivity analysis Sensitivity Analysis
4.00%
5.00%
6.00%
7.00%
8.00%
9.00%
10.00%
11.00%
-10% -5% 0% 5% 10%
Percentage variation
I R
R
Total investment cost Annual power supply / Grid power price Annual O&M cost CER Price
8% benchmark
It is clear from the above table and graphic depiction that the IRR remains below the benchmark with
reasonable variations of the key parameters. Note that for the annual power supply a variation with
more than 10% would lead the IRR to exceed the 8% benchmark but this is not considered likely.
Wind speed measurements since 1957 show that wind speed has gradually declined in the local area
and in the last 25 years there has not been a single year in which the annual average wind speed
exceeded the average (as measured since 1957) with more than 10%.8
It is therefore improbable that
the annual power supply would consistently exceed the +10% interval over the complete lifetime of
the proposed project activity. A change in the grid price has an equal impact on the IRR as a change in
annual power supply (as shown in table B.4) but is also not considered likely as the grid price is
determined by government and is based on the outcome of recent biddings for concession wind farmprojects. The power price for concession projects is fixed for the first 30,000 hours of operation
9and
although the proposed project activity is not a concession wind farm project it is not foreseen that the
project will receive preferential treatment from the government or grid operator. It is therefore
unlikely that the grid price will increase in the future.
8 Average annual wind speed data in the local area have been measured since 1957 and are provided in the
feasibility study of the proposed project activity.
9See Li Junfeng et al (2006), A study on the Pricing Policy of Wind Power in China, report published by
China Renewable Energy Industries Association (CREIA), Greenpeace and the Global Wind Energy Council(GWEC)
8/8/2019 Qi Qi Har Wind Farm
http://slidepdf.com/reader/full/qi-qi-har-wind-farm 16/53
PROJECT DESIGN DOCUMENT FORM (CDM PDD) - Version 03.1
CDM – Executive Board page 16
This template shall not be altered. It shall be completed without modifying/adding headings or logo, format orfont.
The conclusion may be clear that with reasonable modifications in the critical assumptions, the main
results remain unaltered: the project remains commercially unattractive with an IRR below the
benchmark of 8% for projects in the power industry.
Step 3. Barrier analysis
Sub-step 3a: Identify barriers that would prevent the implementation of the proposed CDM Project
activity:
Besides the economic barrier to implementation that is argued above, the project faces other barriers
which we describe below:
Technological barrier:
The project uses 1.5 MW wind turbines which are produced by a relatively new domestic wind
turbine manufacturer. Therefore, the long term quality and performance of the turbines are not yet
proven and this entails some risks associated with the installation and maintenance of these turbines.
Sub-step 3b: Show that the barriers do not prevent the implementation of at least one of the
alternatives (except the proposed project activity)
The continued operation of the existing power plants and the addition of new generation sources to
meet electricity demand is not prevented by the identified barrier. Coal-fired power generation (the
least cost option for expansion of power generation) and hydropower is common in China and
domestically produced equipment for these options is proven and mature. Companies in the hydro and
thermal power generation equipment manufacturing industry have solid track records and the
reliability of their equipment is known.
We conclude that the project faces a technological barrier which does not prevent the implementation
of the other identified scenarios.
Step 4. Common practice analysis
Sub-step 4a. Analyze other activities similar to the proposed project activity:
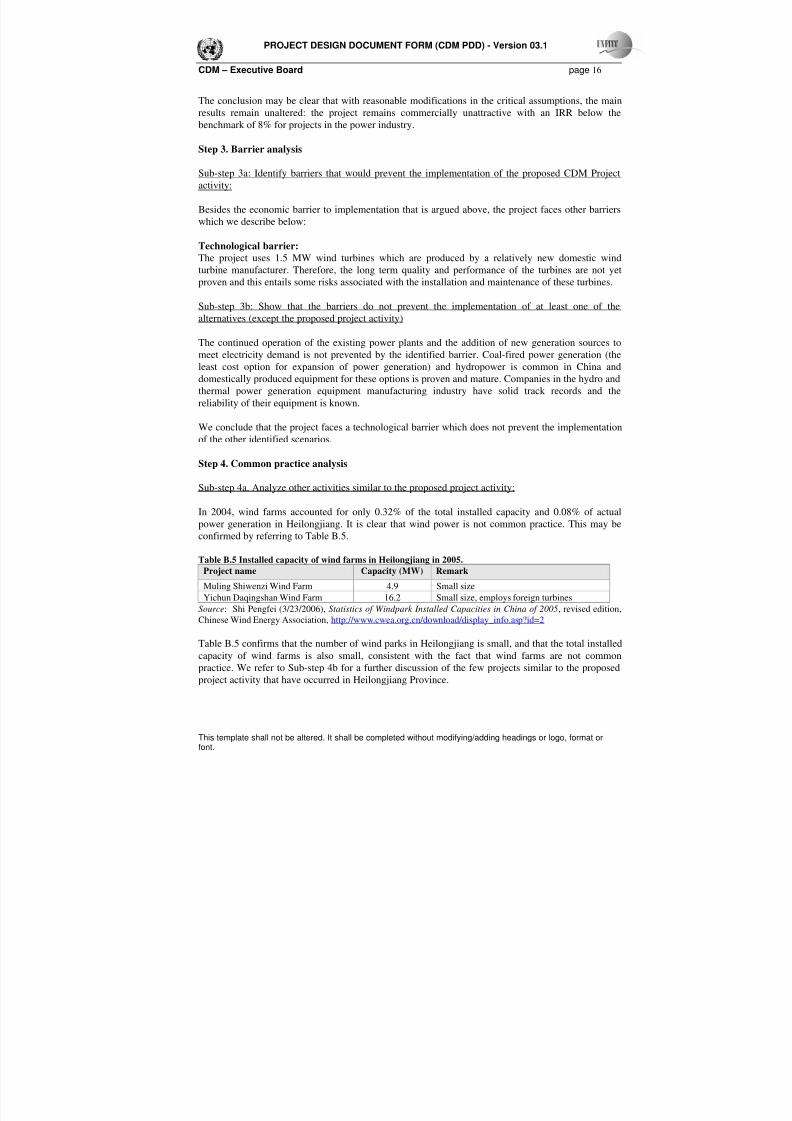
In 2004, wind farms accounted for only 0.32% of the total installed capacity and 0.08% of actual
power generation in Heilongjiang. It is clear that wind power is not common practice. This may be
confirmed by referring to Table B.5.
Table B.5 Installed capacity of wind farms in Heilongjiang in 2005.
Project name Capacity (MW) Remark
Muling Shiwenzi Wind Farm 4.9 Small size
Yichun Daqingshan Wind Farm 16.2 Small size, employs foreign turbines
Source: Shi Pengfei (3/23/2006), Statistics of Windpark Installed Capacities in China of 2005, revised edition,
Chinese Wind Energy Association, http://www.cwea.org.cn/download/display_info.asp?id=2
Table B.5 confirms that the number of wind parks in Heilongjiang is small, and that the total installed
capacity of wind farms is also small, consistent with the fact that wind farms are not common
practice. We refer to Sub-step 4b for a further discussion of the few projects similar to the proposed
project activity that have occurred in Heilongjiang Province.
8/8/2019 Qi Qi Har Wind Farm
http://slidepdf.com/reader/full/qi-qi-har-wind-farm 17/53
PROJECT DESIGN DOCUMENT FORM (CDM PDD) - Version 03.1
CDM – Executive Board page 17
This template shall not be altered. It shall be completed without modifying/adding headings or logo, format orfont.
Additionally, one could argue that if there were only a limited number of opportunities for a certain
type of project activity and at the same time, most of the limited number of opportunities would have
been realized, the type of project activity should be considered common practice. However, on the
basis of information available for China as a whole, we will argue that this is not the case for windfarms in China.
The available information of the wind resource of China is in terms of a classification scheme based
on wind power density (and annual effective wind hours),10
with typical estimates of the real
accessible resource of around 250 GW, of which about 130 GW is in the most favorable Class A
category. Other sources give similar but comparable numbers, for example ERI estimated the
exploitable wind energy potential as 253 GW.11
The total installed capacity in China per end 2003 is 391 GW, of which 0.14% is wind power,
corresponding to 0.555 GW. This means that as of end 2003, only 0.22% of the theoretical potential
for windpower had been utilized. Note that in making this assessment we have assumed that the
theoretical potential consists only of the most favorable Class A Category resources. This confirms
that the utilization of wind power is not common practice in China as only a small fraction of China’s
wind resources has been utilized.
Sub-step 4b. Discuss any similar options that are occurring:
The wind farms mentioned in Table B.5 are few, and are either small scale and use predominantly
foreign turbines. Additionally, windparks developed without CDM have benefited from power prices
ranging from 0.59-0.65 RMB/kWh, substantially above the price for the proposed project activity.
Earlier wind farm projects which started development prior to 2002 were faced with power prices that
were determined by local authorities. This system was replaced in 2002 when a bidding system for
wind concessions was introduced for larger projects (over 100 MW) which led to a downwardpressure on the grid prices due to strong competition. Although for projects under 100 MW the
regulations provide greater freedom to local authorities to set power prices, in the case of the
proposed project activity the local government has issued a notice to the project entity stating that the
grid power price will be determined on the basis of the outcome of recent biddings and therefore the
proposed project activity faces a similar low power price as faced by larger wind farms (see for more
information on wind power pricing policy in China, Li Junfeng et al (2006)).12
Wind farms with comparable capacity to the proposed project activity that are currently being
developed in other parts of China are all developed under the CDM. Thus, it may be clear that
windpower is not a power generation technology that is part of the baseline. This is also confirmed by
the analysis of Meier, op.cit., which concludes that wind farms are not commercially attractive
without special incentives, such as could be provided by CDM.
10 This information is based on Meier (2002), Economic and Financial Analysis of the China Rewewable
Energy Scaleup Programme (CRESP) Volume I: The optimal quantity of renewable energy. The
classification is as follows: Class A=high (annual effective wind power density >5850 MJ/m2); B=moderate
(5000-5850); C=marginal \ (4150-5000); poor (<4150).11
See ERI (2003), Evaluation of the sustainable development strategy and policies adopted in China’s energy
Industry and suggestions for improvement. Prepared for UNIDO, as part of UNIDO’s project with SDPC on
the Evaluation and Adjustment of China's Sustainable Industrial Planning and Policies.
12 Li Junfeng et al (2006), A study on the Pricing Policy of Wind Power in China, report published by China
Renewable Energy Industries Association (CREIA), Greenpeace and the Global Wind Energy Council(GWEC)
8/8/2019 Qi Qi Har Wind Farm
http://slidepdf.com/reader/full/qi-qi-har-wind-farm 18/53
PROJECT DESIGN DOCUMENT FORM (CDM PDD) - Version 03.1
CDM – Executive Board page 18
This template shall not be altered. It shall be completed without modifying/adding headings or logo, format orfont.
The proposed project activity will be the first wind farm to be constructed in the administrative area
of Qiqihaer City and one of the first to employ the domestically produced Sinovel FL 1500/77 Wind
Turbine.
We conclude that similar activities are observed but these are few and there are essential distinctions
between these activities and the project activity or these activities are also being supported through
CDM.
Impact of CDM registration
The CDM registration will create an additional income stream from the sale of CERs, substantially
increasing the economic attractiveness of the project. The additional income stream through CDM
will raise the project IRR with approximately 3.4%. This is sufficient to make the wind farm, with the
added revenues from CDM, a somewhat more attractive proposition for the investors. This is the most
important contribution of CDM to the project realization, removing the crucial barrier towards its
realization.
The above events and impact clearly demonstrate that the Project Entity was aware about the potential
for CDM before the start of the CDM activity, and that it played a crucial role in overcoming the
barriers towards the implementation of the proposed project activity.
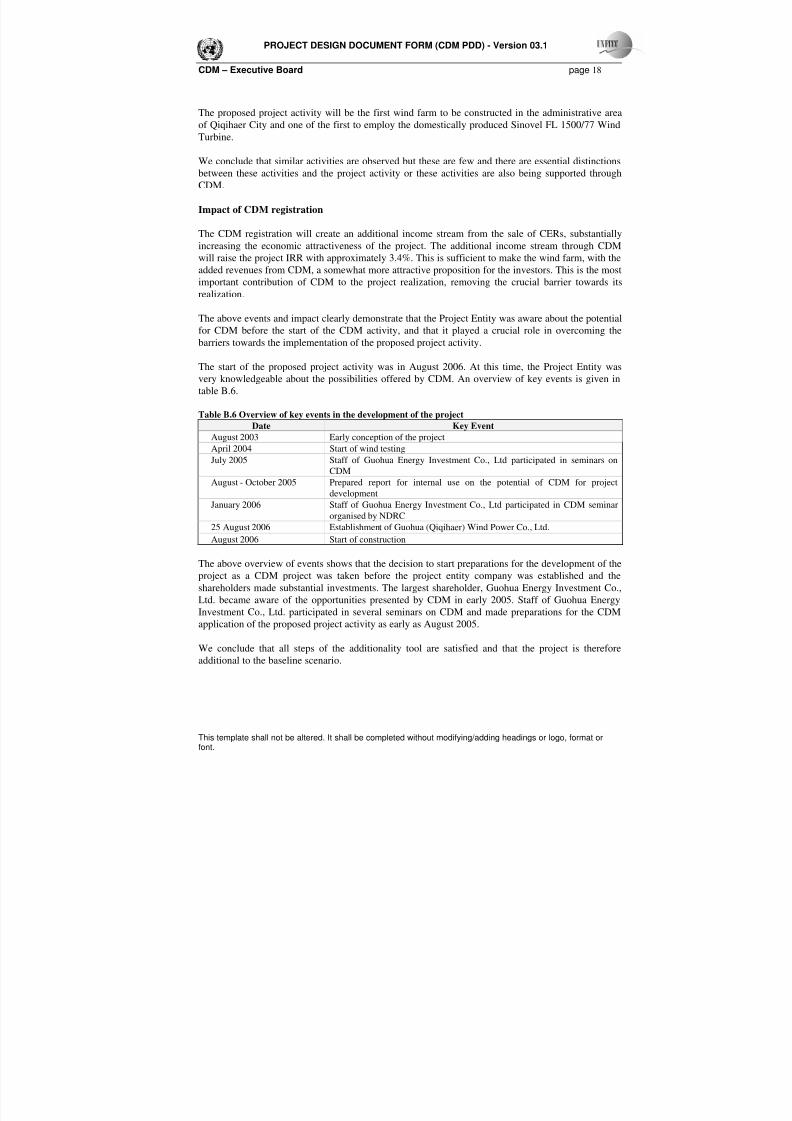
The start of the proposed project activity was in August 2006. At this time, the Project Entity was
very knowledgeable about the possibilities offered by CDM. An overview of key events is given in
table B.6.
Table B.6 Overview of key events in the development of the projectDate Key Event
August 2003 Early conception of the project
April 2004 Start of wind testing
July 2005 Staff of Guohua Energy Investment Co., Ltd participated in seminars on
CDM
August - October 2005 Prepared report for internal use on the potential of CDM for project
development
January 2006 Staff of Guohua Energy Investment Co., Ltd participated in CDM seminar
organised by NDRC
25 August 2006 Establishment of Guohua (Qiqihaer) Wind Power Co., Ltd.
August 2006 Start of construction
The above overview of events shows that the decision to start preparations for the development of the
project as a CDM project was taken before the project entity company was established and the
shareholders made substantial investments. The largest shareholder, Guohua Energy Investment Co.,
Ltd. became aware of the opportunities presented by CDM in early 2005. Staff of Guohua Energy
Investment Co., Ltd. participated in several seminars on CDM and made preparations for the CDM
application of the proposed project activity as early as August 2005.
We conclude that all steps of the additionality tool are satisfied and that the project is therefore
additional to the baseline scenario.

8/8/2019 Qi Qi Har Wind Farm
http://slidepdf.com/reader/full/qi-qi-har-wind-farm 19/53
PROJECT DESIGN DOCUMENT FORM (CDM PDD) - Version 03.1
CDM – Executive Board page 19
This template shall not be altered. It shall be completed without modifying/adding headings or logo, format orfont.
B.6. Emission reductions:
B.6.1. Explanation of methodological choices:
In accordance with the ACM0002 methodology, the baseline emission factor is calculated as a
combined margin: a weighted average of the operating margin (OM) emission factor and the build
margin (BM) emission factor. Both the OM and BM emission factor are calculated ex ante.
This PDD refers to the Operating Margin (OM) Emission Factor and the Build Margin (BM)
Emission Factor published by the Chinese DNA on 15 December 2006. We will refer to these
emission factors as the ‘published emission factors’.
F o r more information on the published OM and BM emission factors, please refer to :
http://cdm.ccchina.gov.cn/WebSite/CDM/UpFile/2006/20061215144550669.pdf : calculation result
of the baseline emission factor of Chinese power grid.http://cdm.ccchina.gov.cn/WebSite/CDM/UpFile/2006/20061215144641643.xls : calculation process
of the baseline OM emission factor of Chinese power grid
http://cdm.ccchina.gov.cn/WebSite/CDM/UpFile/2006/20061215144747182.pdf : calculation process
of the baseline BM emission factor of Chinese power grid
We calculate the OM and BM Emission Factors on the basis of the published emission factors but
deviate at some points by using data published in the China Energy Statistical Yearbook and China
Electric Power Yearbook which results in a slightly lower emission factor and is therefore more
conservative. Additionally, since the published emission factors were issued, new editions of the
above-mentioned statistical yearbooks (China Energy Statistical Yearbook 2006 and China Electric
Power Yearbook 2006) have been published, and conform the requirements of ACM0002 we haveused the latest available data for the calculation of the emission factors. The description below
focuses on the key elements in the calculation of the published emission factors and the subsequent
calculation of emission reductions. The full process of the calculation of the emission factors and all
underlying data are presented in English in Annex 3 to this PDD.
Selection of values for net calorific values, CO2 emission factors and oxidation rates of various fuels .
As mentioned above, the Chinese DNA has entrusted key experts with the calculation of the grid
emission factors. In these calculations choices have been made for the values of net calorific values,
CO2 emission factors, and oxidation rates. In the calculation files of the published emission factors,
the net calorific values are based on the China Energy Statistical Yearbook, and the oxidation rates
and the CO2 emission factors are based on IPCC 1996 default values. We have compared the IPCC1996 with the more recently published IPCC 2006 values. For some of the fuels the IPCC 2006 data
results in a lower carbon emission factor and we use the lower values in our calculation. The
following table summarizes the values used. Note that the table lists the carbon emission factor of the
fuels, the CO2 emission factor has been obtained by multiplying with 44/12. Rounded figures have
been reported but exact figures have been used in the calculations in this PDD.
8/8/2019 Qi Qi Har Wind Farm
http://slidepdf.com/reader/full/qi-qi-har-wind-farm 20/53
PROJECT DESIGN DOCUMENT FORM (CDM PDD) - Version 03.1
CDM – Executive Board page 20
This template shall not be altered. It shall be completed without modifying/adding headings or logo, format orfont.
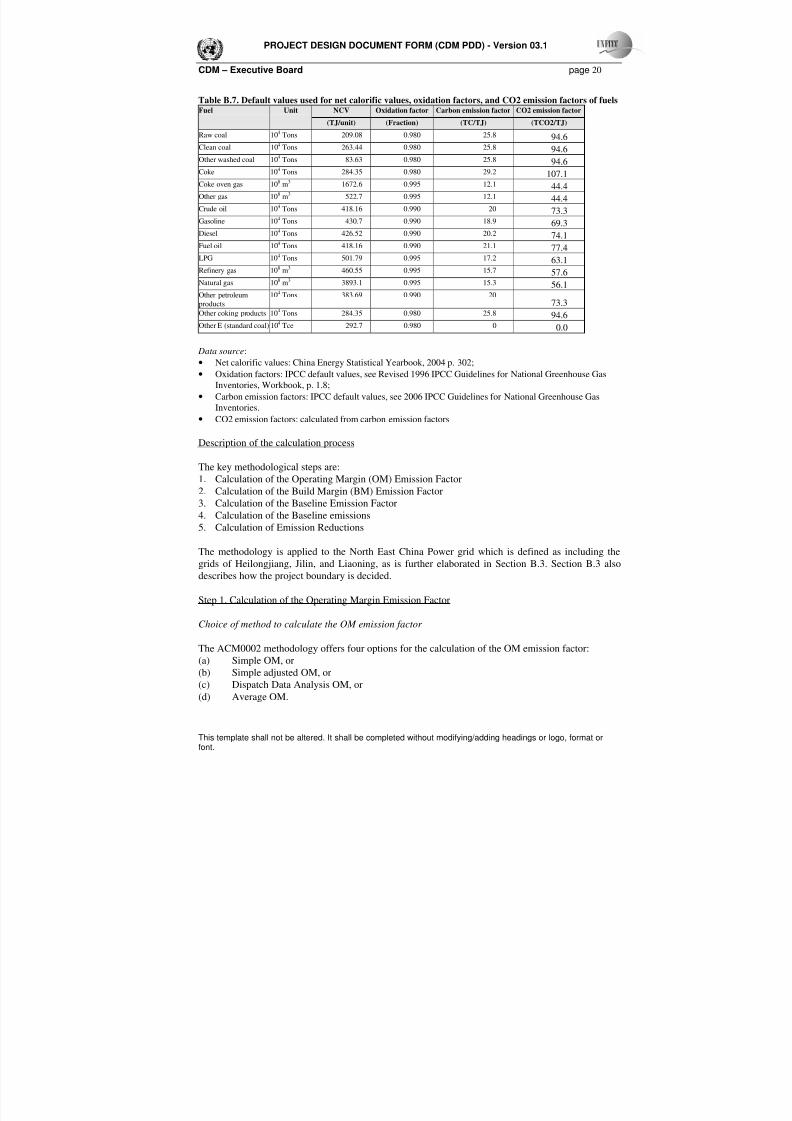
Table B.7. Default values used for net calorific values, oxidation factors, and CO2 emission factors of fuelsFuel Unit NCV Oxidation factor Carbon emission factor CO2 emission factor
(TJ/unit) (Fraction) (TC/TJ) (TCO2/TJ)
Raw coal 10
4
Tons 209.08 0.980 25.8 94.6 Clean coal 104 Tons 263.44 0.980 25.8 94.6
Other washed coal 104 Tons 83.63 0.980 25.8 94.6
Coke 104 Tons 284.35 0.980 29.2 107.1
Coke oven gas 108 m3 1672.6 0.995 12.1 44.4
Other gas 108 m3 522.7 0.995 12.1 44.4
Crude oil 104 Tons 418.16 0.990 20 73.3
Gasoline 104 Tons 430.7 0.990 18.9 69.3
Diesel 104 Tons 426.52 0.990 20.2 74.1
Fuel oil 104 Tons 418.16 0.990 21.1 77.4
LPG 104 Tons 501.79 0.995 17.2 63.1
Refinery gas 108 m3 460.55 0.995 15.7
57.6
Natural gas 108 m3 3893.1 0.995 15.3 56.1
Other petroleum
products
104 Tons 383.69 0.990 2073.3
Other coking products 104 Tons 284.35 0.980 25.8 94.6
Other E (standard coal) 104 Tce 292.7 0.980 0 0.0
Data source:
• Net calorific values: China Energy Statistical Yearbook, 2004 p. 302;
• Oxidation factors: IPCC default values, see Revised 1996 IPCC Guidelines for National Greenhouse Gas
Inventories, Workbook, p. 1.8;
• Carbon emission factors: IPCC default values, see 2006 IPCC Guidelines for National Greenhouse Gas
Inventories.
• CO2 emission factors: calculated from carbon emission factors
Description of the calculation process
The key methodological steps are:
1. Calculation of the Operating Margin (OM) Emission Factor
2. Calculation of the Build Margin (BM) Emission Factor
3. Calculation of the Baseline Emission Factor
4. Calculation of the Baseline emissions
5. Calculation of Emission Reductions
The methodology is applied to the North East China Power grid which is defined as including thegrids of Heilongjiang, Jilin, and Liaoning, as is further elaborated in Section B.3. Section B.3 also
describes how the project boundary is decided.
Step 1. Calculation of the Operating Margin Emission Factor
Choice of method to calculate the OM emission factor
The ACM0002 methodology offers four options for the calculation of the OM emission factor:
(a) Simple OM, or
(b) Simple adjusted OM, or
(c) Dispatch Data Analysis OM, or
(d) Average OM.
8/8/2019 Qi Qi Har Wind Farm
http://slidepdf.com/reader/full/qi-qi-har-wind-farm 21/53
PROJECT DESIGN DOCUMENT FORM (CDM PDD) - Version 03.1
CDM – Executive Board page 21
This template shall not be altered. It shall be completed without modifying/adding headings or logo, format orfont.
The preferred methodological choice, as provided for in the ACM0002 methodology, for the
calculation of the OM emission factor is dispatch analysis, option (c). However, the detail dispatch
information necessary for the implementation of this method is not available. Also option (b), Simpleadjusted OM can not be applied, because the detailed information necessary to construct a load curve
is not available. The choice is therefore between option (a), Simple OM, and option (d), Average OM.
If low cost/must resources account for more than 50% of grid generation option (d) should be chosen,
whereas if low cost/must resources account for less than 50% of grid generation, option (a) should be
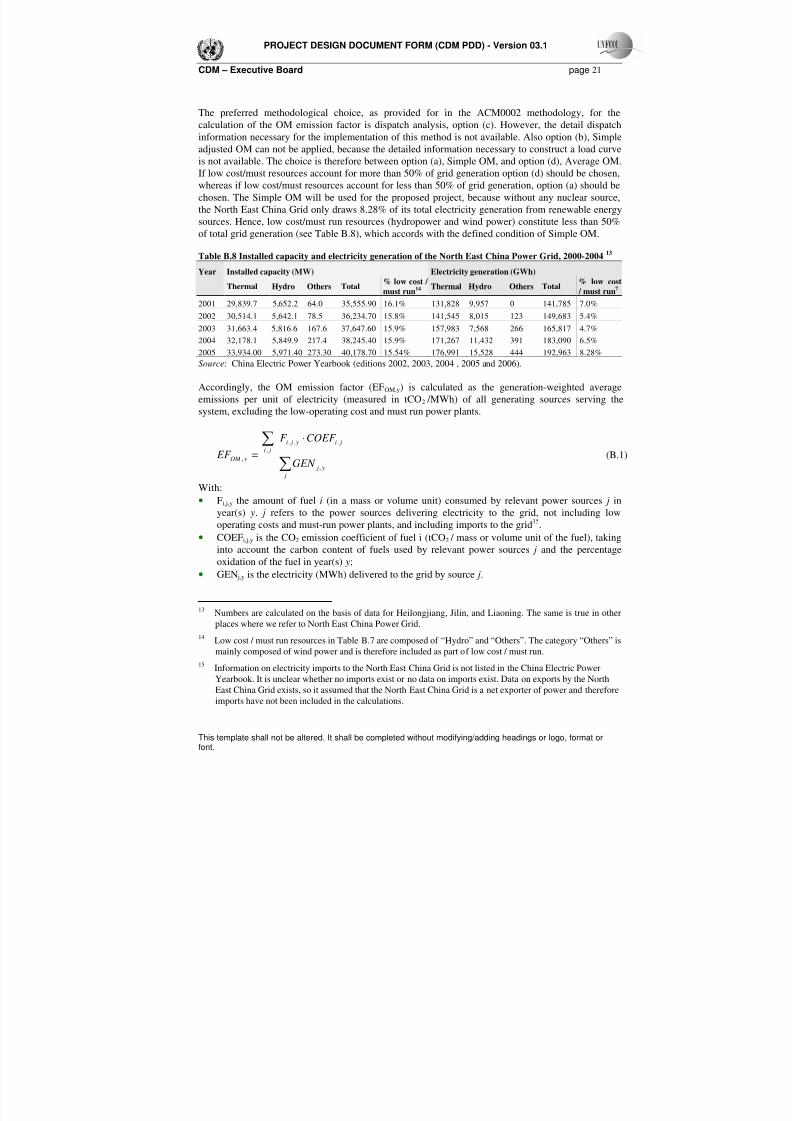
chosen. The Simple OM will be used for the proposed project, because without any nuclear source,
the North East China Grid only draws 8.28% of its total electricity generation from renewable energy
sources. Hence, low cost/must run resources (hydropower and wind power) constitute less than 50%
of total grid generation (see Table B.8), which accords with the defined condition of Simple OM.
Table B.8 Installed capacity and electricity generation of the North East China Power Grid, 2000-200413
Year Installed capacity (MW) Electricity generation (GWh)
Thermal Hydro Others Total% low cost /
must run14 Thermal Hydro Others Total
% low cost
/ must run7
2001 29,839.7 5,652.2 64.0 35,555.90 16.1% 131,828 9,957 0 141,785 7.0%
2002 30,514.1 5,642.1 78.5 36,234.70 15.8% 141,545 8,015 123 149,683 5.4%
2003 31,663.4 5,816.6 167.6 37,647.60 15.9% 157,983 7,568 266 165,817 4.7%
2004 32,178.1 5,849.9 217.4 38,245.40 15.9% 171,267 11,432 391 183,090 6.5%
2005 33,934.00 5,971.40 273.30 40,178.70 15.54% 176,991 15,528 444 192,963 8.28%
Source: China Electric Power Yearbook (editions 2002, 2003, 2004 , 2005 and 2006).
Accordingly, the OM emission factor (EFOM,y) is calculated as the generation-weighted average
emissions per unit of electricity (measured in tCO2 /MWh) of all generating sources serving the
system, excluding the low-operating cost and must run power plants.
∑
∑ ⋅
=
j
y j
ji y ji
ji
yOM GEN
COEF F
EF ,
...
,
, (B.1)
With:
• Fi,j,y the amount of fuel i (in a mass or volume unit) consumed by relevant power sources j in
year(s) y. j refers to the power sources delivering electricity to the grid, not including low
operating costs and must-run power plants, and including imports to the grid15
.
• COEFi,j,y is the CO2 emission coefficient of fuel i (tCO2 / mass or volume unit of the fuel), taking
into account the carbon content of fuels used by relevant power sources j and the percentageoxidation of the fuel in year(s) y;
• GEN j,y is the electricity (MWh) delivered to the grid by source j.
13 Numbers are calculated on the basis of data for Heilongjiang, Jilin, and Liaoning. The same is true in other
places where we refer to North East China Power Grid.
14Low cost / must run resources in Table B.7 are composed of “Hydro” and “Others”. The category “Others” is
mainly composed of wind power and is therefore included as part of low cost / must run.
15Information on electricity imports to the North East China Grid is not listed in the China Electric Power
Yearbook. It is unclear whether no imports exist or no data on imports exist. Data on exports by the North
East China Grid exists, so it assumed that the North East China Grid is a net exporter of power and thereforeimports have not been included in the calculations.

8/8/2019 Qi Qi Har Wind Farm
http://slidepdf.com/reader/full/qi-qi-har-wind-farm 22/53
PROJECT DESIGN DOCUMENT FORM (CDM PDD) - Version 03.1
CDM – Executive Board page 22
This template shall not be altered. It shall be completed without modifying/adding headings or logo, format orfont.
The CO2 emission coefficient (COEFi) of fuel i (in tCO2 / mass or volume unit of the fuel) is equal to
the net calorific value of fuel i, multiplied by the oxidation factor of the fuel and the CO2 emission
factor per unit of energy of the fuel i.
iiCOii OXID EF NCV COEF ⋅⋅= ,2 (B.2)
With:
• NCVi is the net calorific value (energy content) per mass or volume unit of a fuel i,
• OXIDi is the oxidation factor of the fuel,
• EFCO2,i is the CO2 emission factor per unit of energy of the fuel i.
Data vintage selection
In accordance with the ACM0002 methodology and the choice for an ex ante calculation of the OMEmission Factor, the formula (B.1) is applied to the three latest years for which data are available, and
a full-generation weighted average value is taken for the OM Emission Factor.
Choice of aggregated data sources
The published OM emission factor calculates the emission factor directly from published aggregated
data on fuel consumption, net calorific values, and power supply to the grid and IPCC default values
for the CO2 emission factor and the oxidation rate. According to the ACM0002 methodology, the
selection of aggregated data for the calculation of the emission factors, but the disaggregated data
needed for either of the three more preferred methodological choices is not publicly available in
China.
Calculation of the OM emission factor as a three-year full generation weighted average
On the basis of these data, the Operating Margin emission factors for 2003, 2004 and 2005 are
calculated. The three-year average is calculated as a full-generation-weighted average of the emission
factors. For details we refer to the publications cited above and the detailed explanations and
demonstration of the calculation of the OM emission factor provided in Annex 3. We calculate an
Operating Margin Emission Factor of 1.21775 tCO2/MWh (see Annex 3, Table A2 for the
calculation, repeated here as Table B.9).
8/8/2019 Qi Qi Har Wind Farm
http://slidepdf.com/reader/full/qi-qi-har-wind-farm 23/53
PROJECT DESIGN DOCUMENT FORM (CDM PDD) - Version 03.1
CDM – Executive Board page 23
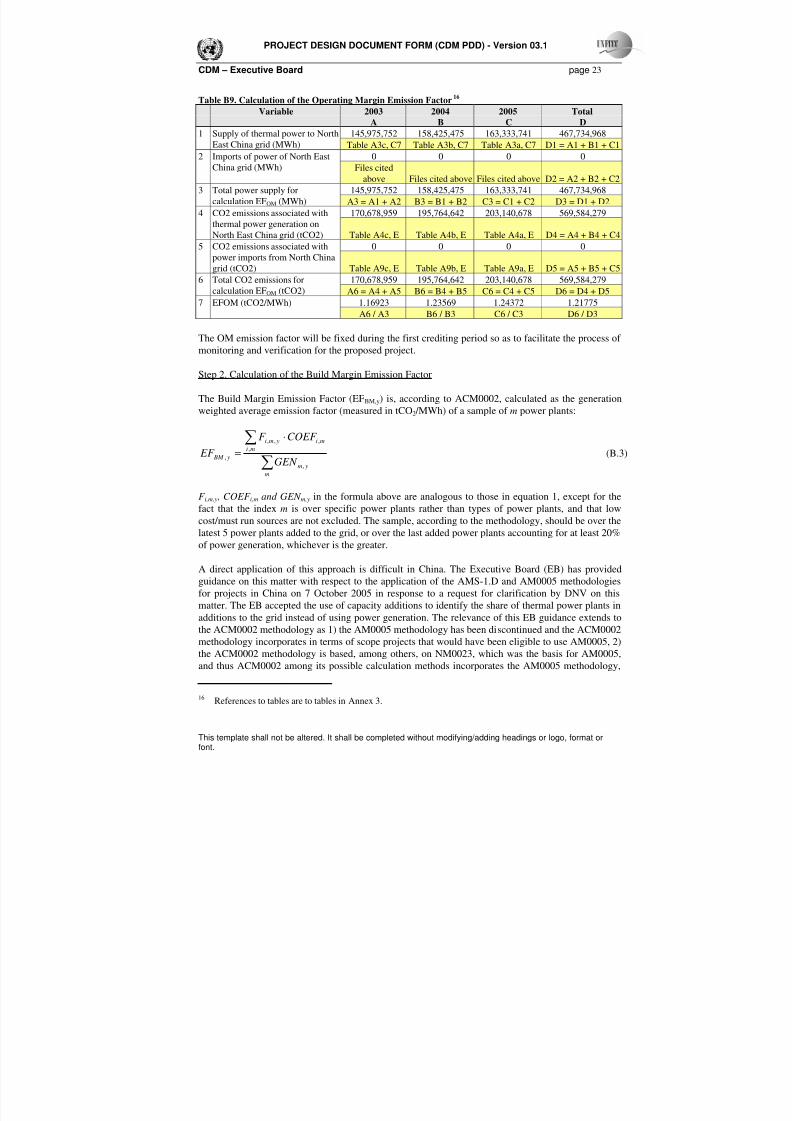
This template shall not be altered. It shall be completed without modifying/adding headings or logo, format orfont.
Table B9. Calculation of the Operating Margin Emission Factor16
Variable 2003 2004 2005 Total
A B C D
145,975,752 158,425,475 163,333,741 467,734,9681 Supply of thermal power to NorthEast China grid (MWh) Table A3c, C7 Table A3b, C7 Table A3a, C7 D1 = A1 + B1 + C1
0 0 0 02 Imports of power of North East
China grid (MWh) Files cited
above Files cited above Files cited above D2 = A2 + B2 + C2
145,975,752 158,425,475 163,333,741 467,734,9683 Total power supply for
calculation EFOM (MWh) A3 = A1 + A2 B3 = B1 + B2 C3 = C1 + C2 D3 = D1 + D2
170,678,959 195,764,642 203,140,678 569,584,2794 CO2 emissions associated with
thermal power generation on
North East China grid (tCO2) Table A4c, E Table A4b, E Table A4a, E D4 = A4 + B4 + C4
0 0 0 05 CO2 emissions associated with
power imports from North China
grid (tCO2) Table A9c, E Table A9b, E Table A9a, E D5 = A5 + B5 + C5
170,678,959 195,764,642 203,140,678 569,584,2796 Total CO2 emissions forcalculation EFOM (tCO2) A6 = A4 + A5 B6 = B4 + B5 C6 = C4 + C5 D6 = D4 + D5
1.16923 1.23569 1.24372 1.217757 EFOM (tCO2/MWh)
A6 / A3 B6 / B3 C6 / C3 D6 / D3
The OM emission factor will be fixed during the first crediting period so as to facilitate the process of
monitoring and verification for the proposed project.
Step 2. Calculation of the Build Margin Emission Factor
The Build Margin Emission Factor (EFBM,y) is, according to ACM0002, calculated as the generation
weighted average emission factor (measured in tCO2 /MWh) of a sample of m power plants:
∑
∑ ⋅
=
m
ym
mi
mi ymi
y BM GEN
COEF F
EF ,
,
,,,
, (B.3)
F i,m,y, COEF i,m and GEN m,y in the formula above are analogous to those in equation 1, except for the
fact that the index m is over specific power plants rather than types of power plants, and that low
cost/must run sources are not excluded. The sample, according to the methodology, should be over the
latest 5 power plants added to the grid, or over the last added power plants accounting for at least 20%
of power generation, whichever is the greater.
A direct application of this approach is difficult in China. The Executive Board (EB) has provided
guidance on this matter with respect to the application of the AMS-1.D and AM0005 methodologies
for projects in China on 7 October 2005 in response to a request for clarification by DNV on this
matter. The EB accepted the use of capacity additions to identify the share of thermal power plants in
additions to the grid instead of using power generation. The relevance of this EB guidance extends to
the ACM0002 methodology as 1) the AM0005 methodology has been discontinued and the ACM0002
methodology incorporates in terms of scope projects that would have been eligible to use AM0005, 2)
the ACM0002 methodology is based, among others, on NM0023, which was the basis for AM0005,
and thus ACM0002 among its possible calculation methods incorporates the AM0005 methodology,
16 References to tables are to tables in Annex 3.
8/8/2019 Qi Qi Har Wind Farm
http://slidepdf.com/reader/full/qi-qi-har-wind-farm 24/53
PROJECT DESIGN DOCUMENT FORM (CDM PDD) - Version 03.1
CDM – Executive Board page 24
This template shall not be altered. It shall be completed without modifying/adding headings or logo, format orfont.
and 3) the AMS-1.D methodology refers to the ACM0002 methodology for the baseline emission
factor calculation method.
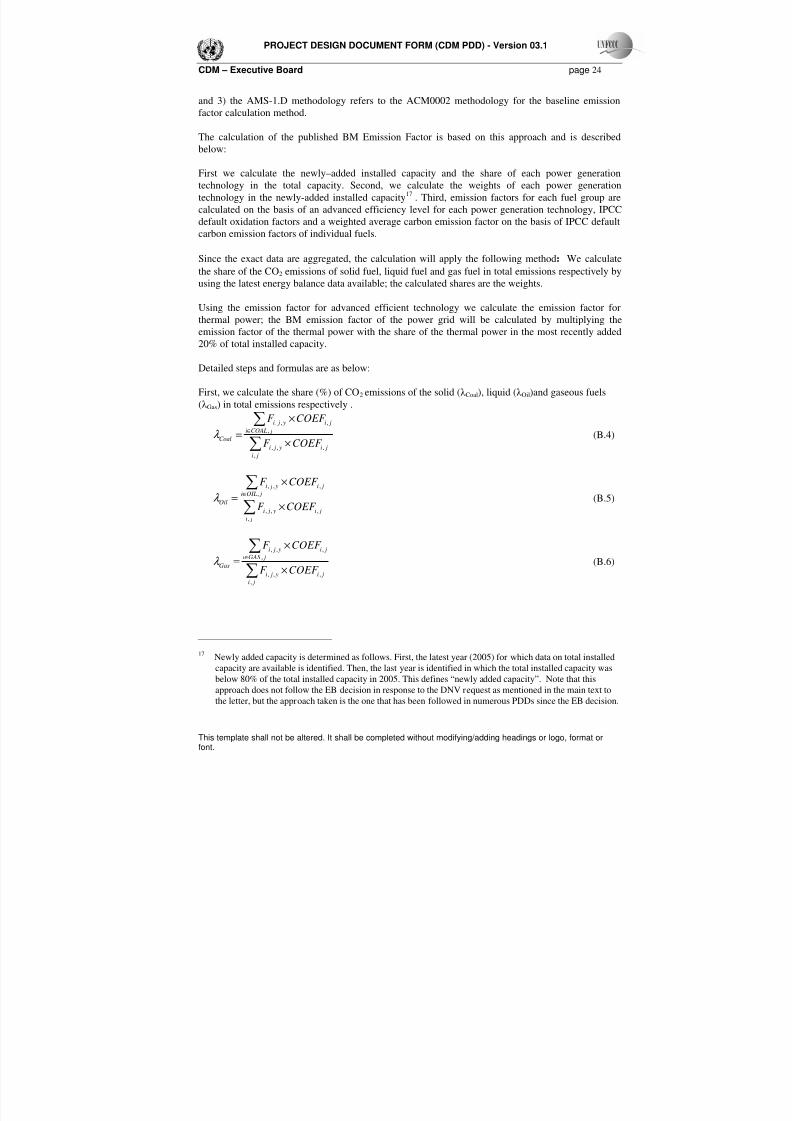
The calculation of the published BM Emission Factor is based on this approach and is describedbelow:
First we calculate the newly–added installed capacity and the share of each power generation
technology in the total capacity. Second, we calculate the weights of each power generation
technology in the newly-added installed capacity17
. Third, emission factors for each fuel group are
calculated on the basis of an advanced efficiency level for each power generation technology, IPCC
default oxidation factors and a weighted average carbon emission factor on the basis of IPCC default
carbon emission factors of individual fuels.
Since the exact data are aggregated, the calculation will apply the following method:
We calculate
the share of the CO2
emissions of solid fuel, liquid fuel and gas fuel in total emissions respectively by
using the latest energy balance data available; the calculated shares are the weights.
Using the emission factor for advanced efficient technology we calculate the emission factor for
thermal power; the BM emission factor of the power grid will be calculated by multiplying the
emission factor of the thermal power with the share of the thermal power in the most recently added
20% of total installed capacity.
Detailed steps and formulas are as below:
First, we calculate the share (%) of CO2 emissions of the solid (λ Coal), liquid (λ Oil)and gaseous fuels
(λ Gas) in total emissions respectively .
∑
∑
×
×
=∈
ji
ji y ji
jCOALi
ji y ji
CoalCOEF F
COEF F
,
,,,
,
,,,
λ (B.4)
∑
∑
×
×
=∈
ji
ji y ji
jOILi
ji y ji
OilCOEF F
COEF F
,
,,,
,
,,,
λ (B.5)
∑
∑
×
×
=∈
ji
ji y ji
jGASi
ji y ji
GasCOEF F
COEF F
,
,,,
,
,,,
λ (B.6)
17Newly added capacity is determined as follows. First, the latest year (2005) for which data on total installed
capacity are available is identified. Then, the last year is identified in which the total installed capacity was
below 80% of the total installed capacity in 2005. This defines “newly added capacity”. Note that this
approach does not follow the EB decision in response to the DNV request as mentioned in the main text tothe letter, but the approach taken is the one that has been followed in numerous PDDs since the EB decision.
8/8/2019 Qi Qi Har Wind Farm
http://slidepdf.com/reader/full/qi-qi-har-wind-farm 25/53
PROJECT DESIGN DOCUMENT FORM (CDM PDD) - Version 03.1
CDM – Executive Board page 25
This template shall not be altered. It shall be completed without modifying/adding headings or logo, format orfont.
with:
• F i,j,y the amount of the fuel i consumed in y year of j province (measured in tce;
• COEFi,j,y the emission factor of fuel i ( measured in tCO2/tce) while taking into account the
carbon content and oxidation rate of the fuel i consumed in year y;• COAL,OIL and GAS subscripts standing for the solid fuel, liquid fuel and gas fuel
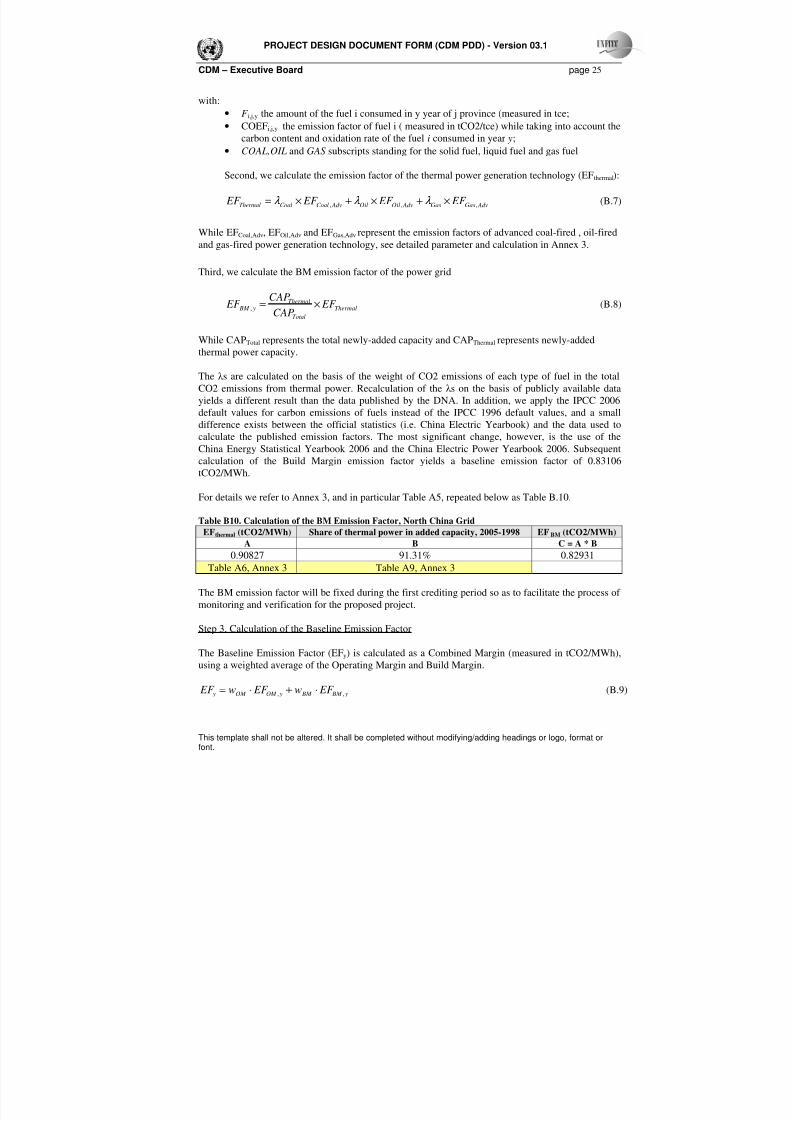
Second, we calculate the emission factor of the thermal power generation technology (EF thermal):
AdvGasGas AdvOilOil AdvCoalCoalThermal EF EF EF EF ,,, ×+×+×= λ λ λ (B.7)
While EFCoal,Adv, EFOil,Adv and EFGas,Adv represent the emission factors of advanced coal-fired , oil-fired
and gas-fired power generation technology, see detailed parameter and calculation in Annex 3.
Third, we calculate the BM emission factor of the power grid
Thermal
Total
Thermal y BM EF
CAP
CAP EF ×=, (B.8)
While CAPTotal represents the total newly-added capacity and CAPThermal represents newly-added
thermal power capacity.
The λ s are calculated on the basis of the weight of CO2 emissions of each type of fuel in the total
CO2 emissions from thermal power. Recalculation of the λ s on the basis of publicly available data
yields a different result than the data published by the DNA. In addition, we apply the IPCC 2006
default values for carbon emissions of fuels instead of the IPCC 1996 default values, and a smalldifference exists between the official statistics (i.e. China Electric Yearbook) and the data used to
calculate the published emission factors. The most significant change, however, is the use of the
China Energy Statistical Yearbook 2006 and the China Electric Power Yearbook 2006. Subsequent
calculation of the Build Margin emission factor yields a baseline emission factor of 0.83106
tCO2/MWh.
For details we refer to Annex 3, and in particular Table A5, repeated below as Table B.10.
Table B10. Calculation of the BM Emission Factor, North China Grid EFthermal (tCO2/MWh) Share of thermal power in added capacity, 2005-1998 EFBM (tCO2/MWh)
A B C = A * B
0.90827 91.31% 0.82931Table A6, Annex 3 Table A9, Annex 3
The BM emission factor will be fixed during the first crediting period so as to facilitate the process of
monitoring and verification for the proposed project.
Step 3. Calculation of the Baseline Emission Factor
The Baseline Emission Factor (EFy) is calculated as a Combined Margin (measured in tCO2/MWh),
using a weighted average of the Operating Margin and Build Margin.
EF y = wOM ⋅ EF OM , y + w BM ⋅ EF BM , y (B.9)
8/8/2019 Qi Qi Har Wind Farm
http://slidepdf.com/reader/full/qi-qi-har-wind-farm 26/53
PROJECT DESIGN DOCUMENT FORM (CDM PDD) - Version 03.1
CDM – Executive Board page 26
This template shall not be altered. It shall be completed without modifying/adding headings or logo, format orfont.
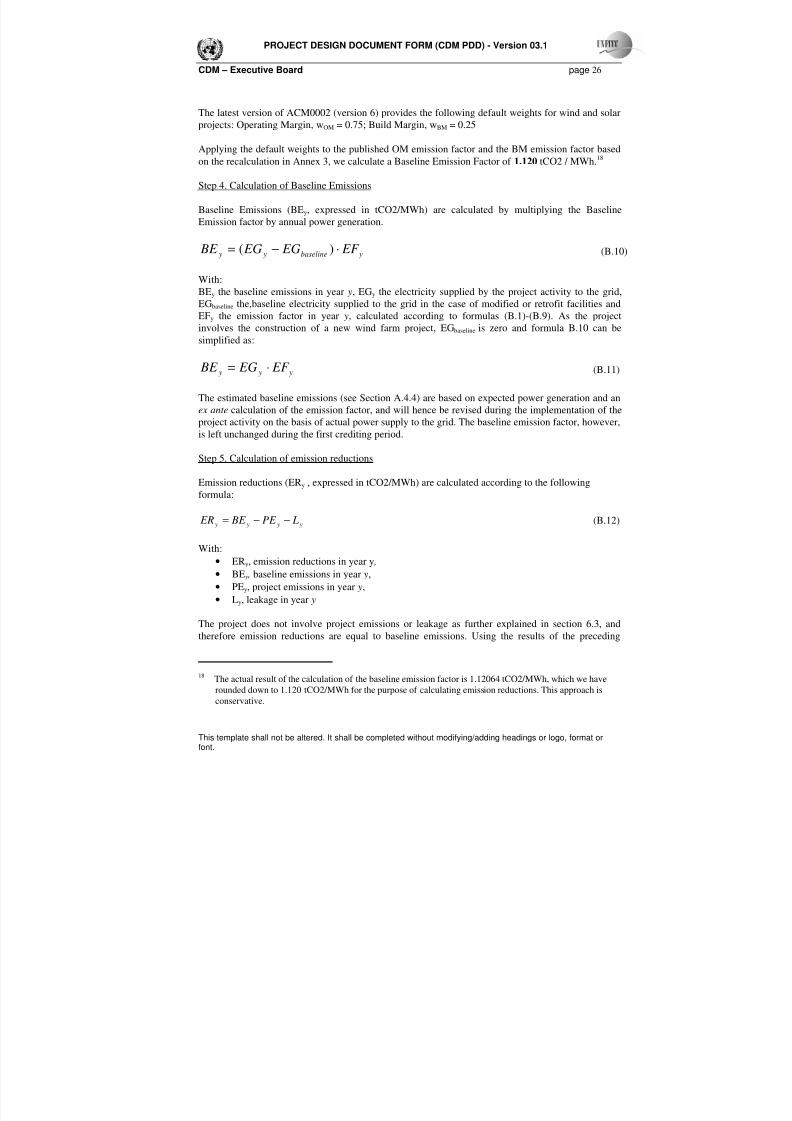
The latest version of ACM0002 (version 6) provides the following default weights for wind and solar
projects: Operating Margin, wOM = 0.75; Build Margin, wBM = 0.25
Applying the default weights to the published OM emission factor and the BM emission factor based
on the recalculation in Annex 3, we calculate a Baseline Emission Factor of 1.120 tCO2 / MWh.18
Step 4. Calculation of Baseline Emissions
Baseline Emissions (BEy, expressed in tCO2/MWh) are calculated by multiplying the Baseline
Emission factor by annual power generation.
ybaseline y y EF EG EG BE ⋅−= )( (B.10)
With:BEy the baseline emissions in year y, EGy the electricity supplied by the project activity to the grid,
EGbaseline the,baseline electricity supplied to the grid in the case of modified or retrofit facilities and
EFy the emission factor in year y, calculated according to formulas (B.1)-(B.9). As the project
involves the construction of a new wind farm project, EGbaseline is zero and formula B.10 can be
simplified as:
y y y EF EG BE ⋅= (B.11)
The estimated baseline emissions (see Section A.4.4) are based on expected power generation and an
ex ante calculation of the emission factor, and will hence be revised during the implementation of the
project activity on the basis of actual power supply to the grid. The baseline emission factor, however,
is left unchanged during the first crediting period.
Step 5. Calculation of emission reductions
Emission reductions (ERy , expressed in tCO2/MWh) are calculated according to the following
formula:
y y y y LPE BE ER −−= (B.12)
With:
• ERy, emission reductions in year y ,
• BE y , baseline emissions in year y,
• PEy, project emissions in year y,
• Ly, leakage in year y
The project does not involve project emissions or leakage as further explained in section 6.3, and
therefore emission reductions are equal to baseline emissions. Using the results of the preceding
18The actual result of the calculation of the baseline emission factor is 1.12064 tCO2/MWh, which we have
rounded down to 1.120 tCO2/MWh for the purpose of calculating emission reductions. This approach isconservative.

8/8/2019 Qi Qi Har Wind Farm
http://slidepdf.com/reader/full/qi-qi-har-wind-farm 27/53
PROJECT DESIGN DOCUMENT FORM (CDM PDD) - Version 03.1
CDM – Executive Board page 27
This template shall not be altered. It shall be completed without modifying/adding headings or logo, format orfont.
sections, we can further simplify formula B.12 and calculate the emission reductions using formula
B.13
120.1⋅= y y EG ER (B.13)
B.6.2. Data and parameters that are available at validation:
Data / Parameter: Power generation by source
Data unit: GWh (per annum)
Description: Provincial level power generation data by source
Source of data used: China Electric Power Yearbook (Editions 2004, 2005 and 2006)
Value applied: For detailed values see Annex 3
Justification of the
choice of data or
description of
measurement methods
and procedures
actually applied :
Detailed plant-level data on generation by source is considered confidential
and is therefore not available. The China Electric Power Yearbook provides
provincial level power generation data for thermal, hydro, nuclear and
“other” power generation.
Any comment: See Annex 3 for further details.
Data / Parameter: Internal power consumption of power plants
Data unit: Percentage
Description: Internal consumption of power by source
Source of data used: See the downloadable files mentioned above for the full data set. Original
data are from China Electric Power Yearbook (Editions 2004, 2005 and
2006)
Value applied: See Annex 3, Tables A3a-c
Justification of the
choice of data or
description of
measurement methods
and procedures
actually applied :
These data are the best and most recent data available, and use the same
data publication (although more recent editions) as the calculation of the
emission factors published by the Chinese authorities.
Any comment: For 2005, losses are calculated from information on the energy input per
kWh generated and per kWh supplied.
Data / Parameter: Primary fuel input for thermal power supplyData unit: 10
4tons, 10
8m
3, 10
4tce, depending on the specific fuel. We refer to Annex
for details.
Description: Physical amount of fuel input, for 18 different fuels
Source of data used: China Energy Statistical Yearbook 2006, 2005 and 2004 Editions
Value applied: For detailed values see Annex 3
Justification of the
choice of data or
description of
measurement methods
and procedures
actually applied :
This is the only available data source that can be used to take into account
that thermal power plants do not exclusively use coal as fuel. Using this
dataset is conservative, and in accordance with ACM0002 (version 06).
8/8/2019 Qi Qi Har Wind Farm
http://slidepdf.com/reader/full/qi-qi-har-wind-farm 28/53
PROJECT DESIGN DOCUMENT FORM (CDM PDD) - Version 03.1
CDM – Executive Board page 28
This template shall not be altered. It shall be completed without modifying/adding headings or logo, format orfont.
Any comment: For details, we refer to Annex 3.
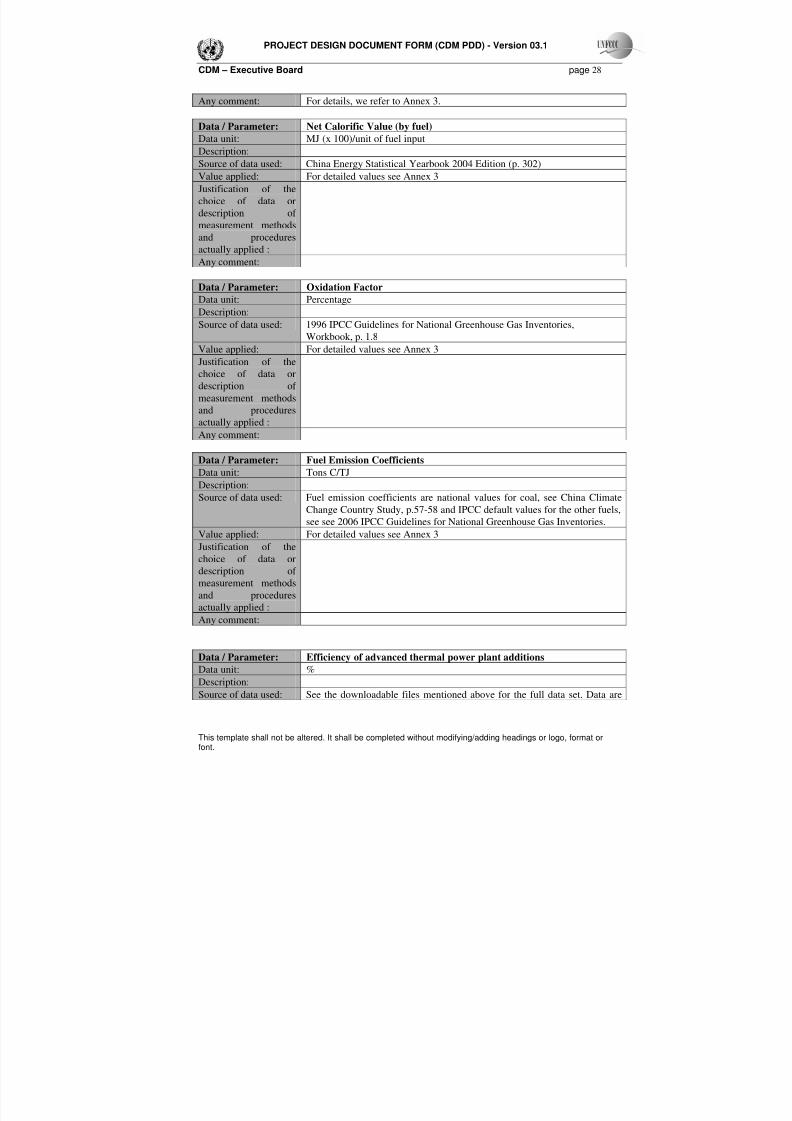
Data / Parameter: Net Calorific Value (by fuel)
Data unit: MJ (x 100)/unit of fuel inputDescription:
Source of data used: China Energy Statistical Yearbook 2004 Edition (p. 302)
Value applied: For detailed values see Annex 3
Justification of the
choice of data or
description of
measurement methods
and procedures
actually applied :
Any comment:
Data / Parameter: Oxidation Factor
Data unit: Percentage
Description:
Source of data used: 1996 IPCC Guidelines for National Greenhouse Gas Inventories,
Workbook, p. 1.8
Value applied: For detailed values see Annex 3
Justification of the
choice of data or
description of
measurement methods
and procedures
actually applied :
Any comment:
Data / Parameter: Fuel Emission Coefficients
Data unit: Tons C/TJ
Description:
Source of data used: Fuel emission coefficients are national values for coal, see China Climate
Change Country Study, p.57-58 and IPCC default values for the other fuels,
see see 2006 IPCC Guidelines for National Greenhouse Gas Inventories.
Value applied: For detailed values see Annex 3
Justification of the
choice of data or
description of
measurement methods
and procedures
actually applied :
Any comment:
Data / Parameter: Efficiency of advanced thermal power plant additions
Data unit: %
Description:
Source of data used: See the downloadable files mentioned above for the full data set. Data are

8/8/2019 Qi Qi Har Wind Farm
http://slidepdf.com/reader/full/qi-qi-har-wind-farm 29/53
PROJECT DESIGN DOCUMENT FORM (CDM PDD) - Version 03.1
CDM – Executive Board page 29
This template shall not be altered. It shall be completed without modifying/adding headings or logo, format orfont.
based on the best technologies available in China.
Value applied: Coal: 36.53%; Oil: 45.87%; Gas: 45.87%
Justification of the
choice of data ordescription of
measurement methods
and procedures
actually applied :
These data are the best data available, and have been published by the
Chinese authorities.
Any comment:
B.6.3 Ex-ante calculation of emission reductions:
The annual net power supply to the North East China Grid is estimated to be 100,000 MWh.
Application of the formulae presented in Section B yields the following results:
EFOM = 1.21775 t CO2 /MWh
EFBM = 0.82931 t CO2 /MWh
EFy = 0.75*1.21775 + 0.25*0.82931 = 1.120 tCO2 /MWh19
The annual emission reductions BEy are thus calculated to be 112,000 tCO2. We obtain the following
values for the baseline emissions during the first crediting period:
Table B.8 The estimation of the emission reductions in crediting period
Year Year
Annual net power
supply to the grid
(EGy) (MWh)
Baseline emission
factor
(tCO2 /MWh)
Baseline
emissions
(tCO2e) 1 01/11/2007 - 31/10/2008 62,000 1.120 69,440
2 01/11/2008 - 31/10/2009 100,000 1.120 112,000
3 01/11/2009 - 31/10/2010 100,000 1.120 112,000
4 01/11/2010 - 31/10/2011 100,000 1.120 112,000
5 01/11/2011 - 31/10/2012 100,000 1.120 112,000
6 01/11/2012 - 31/10/2013 100,000 1.120 112,000
7 01/11/2013 - 31/10/2014 100,000 1.120 112,000
Subtotal 662,000 741,440
Average 94,571 105,920
In a given year, the emission reductions realized by the project activity (ER y) is equal to baseline
GHG emissions (BEy) minus project direct emissions and leakages during the same year:
ERy = BEy - PEy - Ly
= BEy – 0 - 0
= BEy
19The actual result of the calculation of the baseline emission factor is 1.12064 tCO2/MWh, which we have
rounded down to 1.120 tCO2/MWh for the purpose of calculating emission reductions. This approach isconservative.

8/8/2019 Qi Qi Har Wind Farm
http://slidepdf.com/reader/full/qi-qi-har-wind-farm 30/53
PROJECT DESIGN DOCUMENT FORM (CDM PDD) - Version 03.1
CDM – Executive Board page 30
This template shall not be altered. It shall be completed without modifying/adding headings or logo, format orfont.
Hence, the emission reductions due to the project are equal to the baseline emissions. The emission
reductions will be calculated ex post on the basis of actual power supply to the grid, using the baseline
emission factor presented above in Section B.6.1.
B.6.4 Summary of the ex-ante estimation of emission reductions:
Table B.9 Ex ante estimate of emission reductions due to the project
Year Estimation of project
activity emissions
(tonnes of CO2e)
Estimation of
baseline emissions
(tonnes of CO2e)
Estimation of
leakage
(tonnes of CO2e)
Estimation of overall
emission reductions
(tones of CO2e)
Year 1 0 69,440 0 69,440
Year 2 0 112,000 0 112,000
Year 3 0 112,000 0 112,000
Year 4 0 112,000 0 112,000
Year 5 0 112,000 0 112,000
Year 6 0 112,000 0 112,000Year 7 0 112,000 0 112,000
Total (tonnes of CO2e) 0 741,440 0 741,440
B.7 Application of the monitoring methodology and description of the monitoring plan:
B.7.1 Data and parameters monitored:
Data / Parameter: EGy
Data unit: MWh
Description: Electricity supplied to the grid by the project
Source of data to beused: Directly measured
Value of data applied
for the purpose of
calculating expected
emission reductions in
section B.5
100,000 MWh
Description of
measurement methods
and procedures to be
applied:
The net supply of power to the grid by the Guohua Qiqihaer Fuyu 1st
Stage Wind Farm Project is measured through national standard
electricity metering instruments that meter power delivered to the grid
as well as power received from the grid. The project entity will
calculate the difference between electricity supplied to the grid and
electricity received from the grid (i.e. the net supply) on a monthlybasis (see also section B.7.2 for details). The metering instruments will
be calibrated annually in accordance with the “Technical
administrative code of electric energy metering (DL/T448- 2000)”.
QA/QC procedures to
be applied:
These data will be directly used for calculation of emission reductions.
Sales record to the grid and other records are used to ensure the
consistency.
Any comment: The measured electricity supply will be double checked by receipts of sales
to the grid. (see also Section B.7.2 for more details)
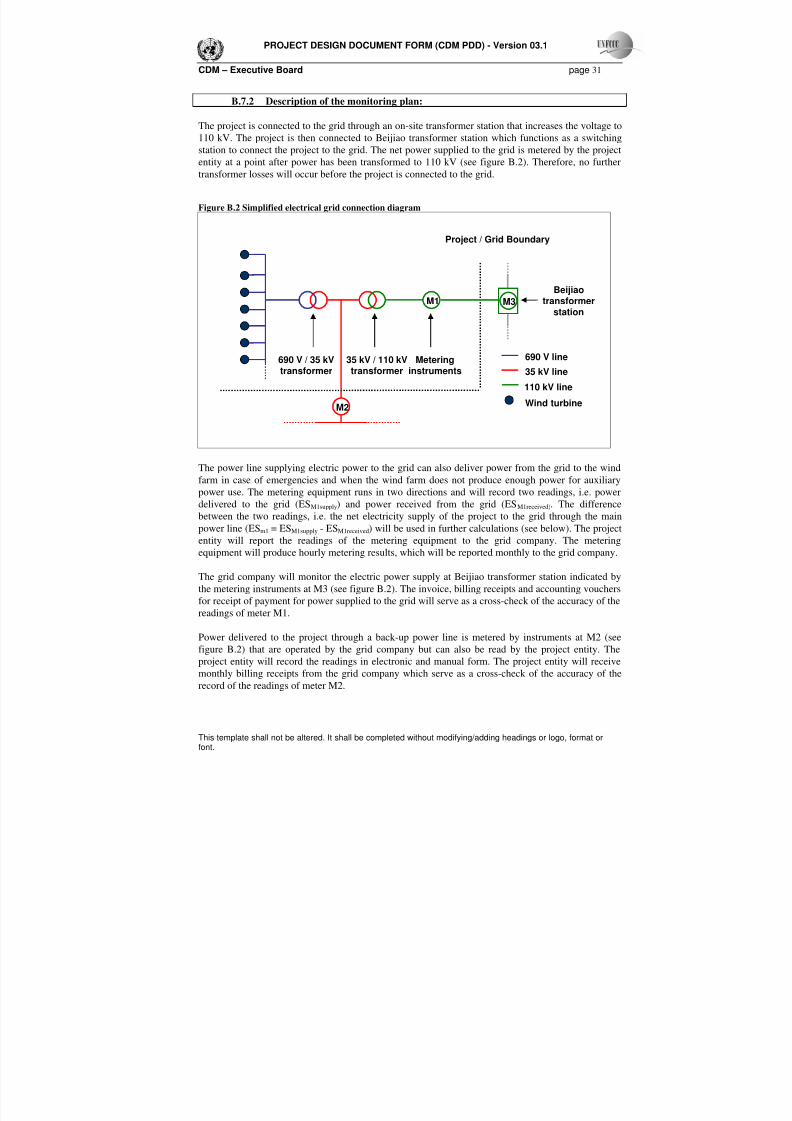
8/8/2019 Qi Qi Har Wind Farm
http://slidepdf.com/reader/full/qi-qi-har-wind-farm 31/53
PROJECT DESIGN DOCUMENT FORM (CDM PDD) - Version 03.1
CDM – Executive Board page 31
This template shall not be altered. It shall be completed without modifying/adding headings or logo, format orfont.
B.7.2 Description of the monitoring plan:
The project is connected to the grid through an on-site transformer station that increases the voltage to
110 kV. The project is then connected to Beijiao transformer station which functions as a switchingstation to connect the project to the grid. The net power supplied to the grid is metered by the project
entity at a point after power has been transformed to 110 kV (see figure B.2). Therefore, no further
transformer losses will occur before the project is connected to the grid.
Figure B.2 Simplified electrical grid connection diagram
The power line supplying electric power to the grid can also deliver power from the grid to the wind
farm in case of emergencies and when the wind farm does not produce enough power for auxiliary
power use. The metering equipment runs in two directions and will record two readings, i.e. power
delivered to the grid (ESM1supply) and power received from the grid (ESM1received). The difference
between the two readings, i.e. the net electricity supply of the project to the grid through the main
power line (ESm1 = ESM1supply - ESM1received) will be used in further calculations (see below). The project
entity will report the readings of the metering equipment to the grid company. The metering
equipment will produce hourly metering results, which will be reported monthly to the grid company.
The grid company will monitor the electric power supply at Beijiao transformer station indicated by
the metering instruments at M3 (see figure B.2). The invoice, billing receipts and accounting vouchers
for receipt of payment for power supplied to the grid will serve as a cross-check of the accuracy of the
readings of meter M1.
Power delivered to the project through a back-up power line is metered by instruments at M2 (see
figure B.2) that are operated by the grid company but can also be read by the project entity. The
project entity will record the readings in electronic and manual form. The project entity will receive
monthly billing receipts from the grid company which serve as a cross-check of the accuracy of the
record of the readings of meter M2.
690 V line
35 kV line
Project / Grid Boundary
690 V / 35 kVtransformer
M1
Wind turbine
Beijiaotransformer
station
Meteringinstruments
35 kV / 110 kVtransformer
110 kV line
M2
M3
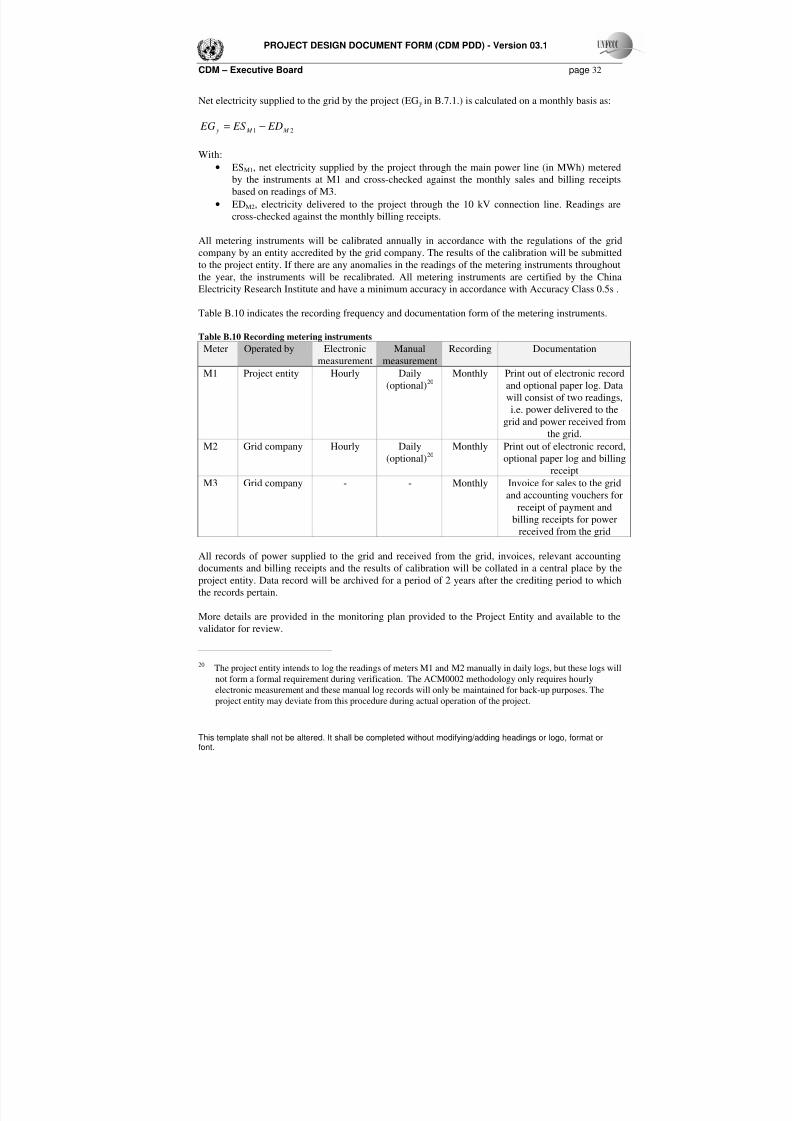
8/8/2019 Qi Qi Har Wind Farm
http://slidepdf.com/reader/full/qi-qi-har-wind-farm 32/53
PROJECT DESIGN DOCUMENT FORM (CDM PDD) - Version 03.1
CDM – Executive Board page 32
This template shall not be altered. It shall be completed without modifying/adding headings or logo, format orfont.
Net electricity supplied to the grid by the project (EGy in B.7.1.) is calculated on a monthly basis as:
21 M M y ED ES EG −=
With:
• ESM1, net electricity supplied by the project through the main power line (in MWh) metered
by the instruments at M1 and cross-checked against the monthly sales and billing receipts
based on readings of M3.
• EDM2, electricity delivered to the project through the 10 kV connection line. Readings are
cross-checked against the monthly billing receipts.
All metering instruments will be calibrated annually in accordance with the regulations of the grid
company by an entity accredited by the grid company. The results of the calibration will be submitted
to the project entity. If there are any anomalies in the readings of the metering instruments throughout
the year, the instruments will be recalibrated. All metering instruments are certified by the ChinaElectricity Research Institute and have a minimum accuracy in accordance with Accuracy Class 0.5s .
Table B.10 indicates the recording frequency and documentation form of the metering instruments.
Table B.10 Recording metering instruments
Meter Operated by Electronic
measurement
Manual
measurement
Recording Documentation
M1 Project entity Hourly Daily
(optional)20
Monthly Print out of electronic record
and optional paper log. Data
will consist of two readings,
i.e. power delivered to the
grid and power received from
the grid.
M2 Grid company Hourly Daily
(optional)20
Monthly Print out of electronic record,
optional paper log and billing
receipt
M3 Grid company - - Monthly Invoice for sales to the grid
and accounting vouchers for
receipt of payment and
billing receipts for power
received from the grid
All records of power supplied to the grid and received from the grid, invoices, relevant accountingdocuments and billing receipts and the results of calibration will be collated in a central place by the
project entity. Data record will be archived for a period of 2 years after the crediting period to which
the records pertain.
More details are provided in the monitoring plan provided to the Project Entity and available to the
validator for review.
20The project entity intends to log the readings of meters M1 and M2 manually in daily logs, but these logs will
not form a formal requirement during verification. The ACM0002 methodology only requires hourly
electronic measurement and these manual log records will only be maintained for back-up purposes. Theproject entity may deviate from this procedure during actual operation of the project.

8/8/2019 Qi Qi Har Wind Farm
http://slidepdf.com/reader/full/qi-qi-har-wind-farm 33/53
PROJECT DESIGN DOCUMENT FORM (CDM PDD) - Version 03.1
CDM – Executive Board page 33
This template shall not be altered. It shall be completed without modifying/adding headings or logo, format orfont.
PROCEDURES IN CASE OF DAMAGED METERING EQUIPMENT / EMERGENCIES
Damages to metering equipment:
In case metering equipment is damaged and no reliable readings can be recorded the project entity
will estimate net supply by the proposed project activity according to the following procedure:
1. In case metering equipment operated by project entity is damaged only:
The metering data logged by the grid company, evidenced by sales receipts and billing
receipts will be used as record of net power supplied to the grid for the days for which no
record could be recorded.
2. In case both metering equipment operated by project entity and grid company is
damaged:
The project entity and the grid company will jointly calculate a conservative estimate of
power supplied to the grid. A statement will be prepared indicating
► the background to the damage to metering equipment
► the assumptions used to estimate net supply to the grid for the days for which no record
could be recorded
► the estimation of power supplied to the grid
The statement will be signed by both a representative of the project entity as well as a
representative of the grid company.
The project entity will furthermore document all efforts taken to restore normal monitoring
procedures.
Emergencies:
In case of emergencies, the project entity will not claim emission reductions due to the project activity
for the duration of the emergency. The project entity will follow the following procedure for declaring
the emergency period to be over:
1. The project entity will ensure that all requirements for monitoring of emission reductions
have been re-established.
2. The monitoring officer and the head of operations of the wind farm will both sign a statement
declaring the emergency situation to have ended and normal operations to have resumed.
OPERATIONAL AND MANAGEMENT STRUCTURE FOR MONITORING
The monitoring of the emission reductions will be carried out according to the scheme shown in
Figure B.3. The General Manager will hold the overall responsibility for the monitoring process, but
as indicated below parts of the process are delegated. The first step is the measurement of the
electrical energy supplied to the grid and reporting of daily operations, which will be carried out by
the plant manager.
The project owner will appoint a monitoring officer who will be responsible for verification of the
measurement, collection of sales receipts, collection of billing receipts of the power supplied by the
grid to the wind farm and the calculation of the emissions reductions. The monitoring officer will
prepare operational reports of the project activity, recording the daily operation of the wind farm,
including operating periods, power generation, power delivered to the grid, equipment defects, etc.

8/8/2019 Qi Qi Har Wind Farm
http://slidepdf.com/reader/full/qi-qi-har-wind-farm 34/53
PROJECT DESIGN DOCUMENT FORM (CDM PDD) - Version 03.1
CDM – Executive Board page 34
This template shall not be altered. It shall be completed without modifying/adding headings or logo, format orfont.
The selection procedure, tasks and responsibilities of the monitoring officer are described in detail in
Annex 4. Finally, the monitoring reports will be reviewed by the General Manager.
Figure B.3 Management structure in order to monitor emission reductions
B.8 Date of completion of the application of the baseline study and monitoring methodology
and the name of the responsible person(s)/entity(ies)
Date of completion of the baseline study and monitoring methodology: 27/07/2007
Name of persons determining the baseline study and monitoring methodology:
Wang Suxia, Project Manager
Guohua Energy Investment Co., Ltd.
No.52 Jiaoda East Road, Haidian District,
Beijing, 100044, China.
Tel: +86-10-62272612
Tomoaki Fujii, Manager, Environmental Business Department, Industrial Energy Division.
Mitsui & Co., Ltd.
2-1, Ohtemachi 1-chome, Chiyoda-ku, Tokyo, Japan
Tel: +81-3-3285-2852
Fax: +81-3-3285-9515
E-mail: [email protected]
Joost van Acht, External Consultant to Mitsui & Co., Ltd.
CVDT Consulting
Tel: +86-10-84505756
Fax: +86-10-84505758
Email: [email protected]
Plant manager:
Measurement of
electrical power
Monitoring officer:
Verification of
measurement &
calculation of emission
reductions
General Manager:
Review
Internal audit

8/8/2019 Qi Qi Har Wind Farm
http://slidepdf.com/reader/full/qi-qi-har-wind-farm 35/53
PROJECT DESIGN DOCUMENT FORM (CDM PDD) - Version 03.1
CDM – Executive Board page 35
This template shall not be altered. It shall be completed without modifying/adding headings or logo, format orfont.
Jin Yuebing, External Consultant to Mitsui & Co., Ltd.
Gansu Tonghe Investment Project Consulting Co., Ltd.
Tel: +86-931-4663436Fax: +86-931-4541296
E-mail: [email protected]; [email protected]
Mitsui & Co., Ltd. and Guohua Energy Investment Co., Ltd. are project participants. CVDT
Consulting and Gansu Tonghe Investment Project Consulting Co., Ltd. are not project participants
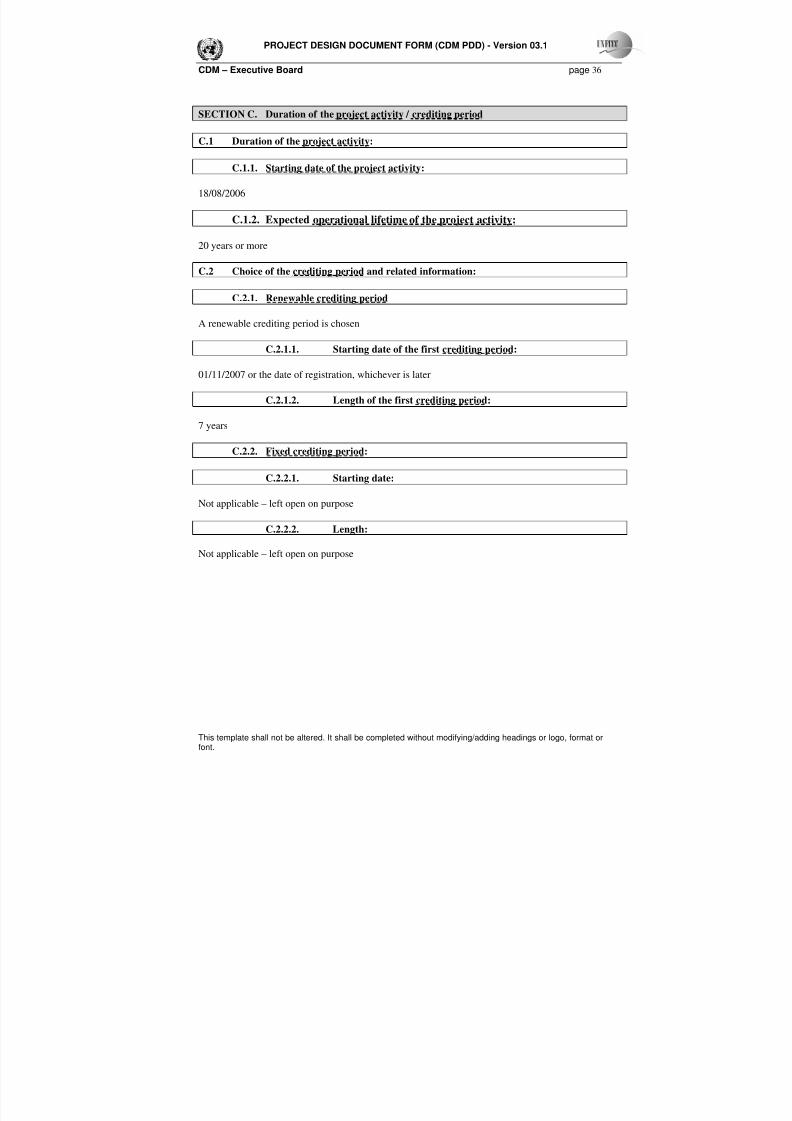
8/8/2019 Qi Qi Har Wind Farm
http://slidepdf.com/reader/full/qi-qi-har-wind-farm 36/53
PROJECT DESIGN DOCUMENT FORM (CDM PDD) - Version 03.1
CDM – Executive Board page 36
This template shall not be altered. It shall be completed without modifying/adding headings or logo, format orfont.
SECTION C. Duration of the project activity / crediting period
C.1 Duration of the project activity:
C.1.1. Starting date of the project activity:
18/08/2006
C.1.2. Expected operational lifetime of the project activity:
20 years or more
C.2 Choice of the crediting period and related information:
C.2.1. Renewable crediting period
A renewable crediting period is chosen
C.2.1.1. Starting date of the first crediting period:
01/11/2007 or the date of registration, whichever is later
C.2.1.2. Length of the first crediting period:
7 years
C.2.2. Fixed crediting period:
C.2.2.1. Starting date:
Not applicable – left open on purpose
C.2.2.2. Length:
Not applicable – left open on purpose

8/8/2019 Qi Qi Har Wind Farm
http://slidepdf.com/reader/full/qi-qi-har-wind-farm 37/53
PROJECT DESIGN DOCUMENT FORM (CDM PDD) - Version 03.1
CDM – Executive Board page 37
This template shall not be altered. It shall be completed without modifying/adding headings or logo, format orfont.
SECTION D. Environmental impacts
D.1. Documentation on the analysis of the environmental impacts, including transboundaryimpacts:
An Environmental Impact Assessment (EIA) was carried out and was accepted by the Environmental
Protection Department of Heilongjiang Province on the 1st
of July 2005. A summary of the main
findings of the EIA is provided in section D.2
D.2. If environmental impacts are considered significant by the project participants or the
host Party, please provide conclusions and all references to support documentation of an
environmental impact assessment undertaken in accordance with the procedures as required by
the host Party:
SUMMARY OF ENVIRONMENTAL IMPACT ASSESSMENT
Environmental impacts:
The project is located in Taha Town of Fuyu County in Heilongjiang, with 111 national express from
Beijing to Jiagedaqi on its east side, while Nenjiang water diversion project on the south, 1.5km
away; Taiping village(20 families with 60 people) of Taha Town on the north 1.5km away, and
grassland on the west.
1 .
..
.
ecological environmental impacts:
(1) impacts on land and cattle farmingThe permanent appropriated land of the project is about 31.36 ha, which only accounts for 0.039% of
total 80500 ha grassland in Fuyu County. It means the reduced grassland per capital is 0.0001 ha with
0.039% reduction rate, and the grass production loses only 0.04% of the total in Fuyu County. From
this point of view, this project will occupy relatively small land and causes little grass reduction.
Therefore, it will not affect the utilization and cattle farming in the local area.
(2) Impacts on soil
During the construction period and 1-2years after the construction work, the soil corrosion modulus
by temporary appropriated land will increase 1.5-4.0 times and expand to other surrounding grassland.
So the total influenced grassland will be 1.2-1.5 time than the area of temporary appropriated land,
and the total corrode amount will reach 11,000t (including background value) and affect for 2-3years
with most severe situation in the construction year. However, the total corroded land only accountsfor 0.01% of the total land in Fuyu County, if proper recovery measures been taken, the influence
period (2-3years) will be shorten. Therefore, the soil corrosion brought along by destroy of the ground
vegetation during construction is just a temporarily impact and will not cause obviously
environmental impacts.
(3) Impacts on wild animals
At present, the most common seen animals in this area are mice, rabbits, yellow stoats, raccoon dogs,
muskrats and wolves, they are all small size animals but with wide range of food search areas. So
even the construction work of this project will occupies relatively limited area of their activity place,
but they can easily find other places on other part of grassland. Meanwhile, after finishing of the
construction, these animals can also move back to live in the windpark.

8/8/2019 Qi Qi Har Wind Farm
http://slidepdf.com/reader/full/qi-qi-har-wind-farm 38/53
PROJECT DESIGN DOCUMENT FORM (CDM PDD) - Version 03.1
CDM – Executive Board page 38
This template shall not be altered. It shall be completed without modifying/adding headings or logo, format orfont.
Resident birds can adapt to this environment within very short period or easily find another suitable
habitat. It seldom happens that the blades will knocked on the birds. The construction site is not
within the migrating rest places and breeding sites of waterfowls and migrating birds. Most of them
have rested or bred in Zhalong National Nature Preservation Zone or Hala wetland NaturePreservation Zone, which are quite far away from the windpark site. And the flying height of these
birds is above 1,000m, so the construction of this project will not put any impacts on migrating birds.
In addition, the construction site is 17 km away from the north boundary of Zhalong National Nature
Preservation Zone, and 33 km from the core area of this zone.
(4) Impacts on landscape
After the construction finished, the rows of orderly wind turbines will give a bright beautiful
landscape in endless grassland. This combined scenery will introduce artificial element into natural
meadow and grassland, and together with farmland, swamp, forestry and bosk will enrich the diversity
of this landscape and add ecological heterogeneity to the three-dimensional sight of the grassland.
From the visual point, it gives a better view with a multilayer aesthetics character. Such a green
energy base without any pollution as this project sits on north green grassland, which will provide a
harmonious landscape between people and nature and a beautiful and fantastic feeling to people. It’s
full of vigor and vitality and also with strong times and environment characters.
2 .
..
.
Air pollution impacts:
There are no environmental sensitive objects in the construction site, because the only thing around it
is the grassland. The dust concentration value during the construction period is below the monitoring
limited concentration value of inorganization emission of particulate matter regulated by Emission
Standard for Atmospheric Pollutant (GB16297-
1996). So if taking feasible measures, the
concentration value can be reduced to minimal level and accepted by current environment. For the
heating purpose during the operational period, the electro-boils will be used without any emission of
pollutants, so they will not affect the air.
3 .
..
.
Water pollution impacts:
The waste water during the construction period is mainly from domestic water of the construction
workers and production waste water of batching and washing process, but the total amount of such
water is relatively small and will not give a big and long-term effect to the surface water environment.
The waste water during the operation period is mainly domestic water, 0.8t/day, which will be used to
irrigate the grassland after the first level deposition, so it will not give bad influence to water
environment.
4 .
..
.
Noise pollution impacts:
It will meet with the noise standard for the construction site during the construction period. And inaddition, there aren’t any environmental protected sensitive objects surrounding this project.
During the operation period, the noise produced by these windturbines will decrease below 45dB 250
m away, and due to long distance between windfarm and nearest residents area, when the noise
reaches this area, it will be low enough to satisfy the requirements by residents area standard, so the
project will not cause bad impacts on this point.
In a word, this project is a renewable green energy development project without pollution but of great
economic, environmental and social benefit and strategic significance.

8/8/2019 Qi Qi Har Wind Farm
http://slidepdf.com/reader/full/qi-qi-har-wind-farm 39/53
PROJECT DESIGN DOCUMENT FORM (CDM PDD) - Version 03.1
CDM – Executive Board page 39
This template shall not be altered. It shall be completed without modifying/adding headings or logo, format orfont.
SECTION E. Stakeholders’ comments
E.1. Brief description how comments by local stakeholders have been invited and compiled:
The Chinese regulations do not require a formal stakeholder consultation for the proposed project
activity as there is no local population in a 10 km radius from the project and the impact of the project
is considered to be minimal.
However, in relation to the CDM application, a separate stakeholder consultation was organized to
confirm the impacts of the project on the relevant stakeholders. The consultation lasted for one month,
from the 25th
of August to the 25th
of September of 2006, and consisted of the following elements:
• Establishment of a website:
The website contained information on the project, CDM, the stakeholder consultation process and
provided an opportunity to post comments by e-mail or by telephone.
• Organization of a stakeholder consultation meeting near project site:
Date / time: 12 September 2006, from 9:00 to 11:30.
Location: Taha Township government meeting room of Fuyu County of Qiqihaer (a few
kilometers from the project site).
Agenda of the meeting:
- Opening of the meeting
- Introduction of the project
- Introduction of the Clean Development Mechanism
- Explanation of the stakeholder consultation process
- Round of comments by each participant
- Further questions and answers
- Closing of the meeting
To ensure wide participation of stakeholders, announcements of the stakeholder consultation meeting
and website were made through the following channels:
- Newspaper announcement on 25th
of August, 2006 in the Qiqihaer Daily (Qiqihaer’s leading daily
newspaper)
- Online announcement on the Qiqihaer Goverment Site: http://www.qqhr.gov.cn/tz1.htm
- Online announcement on the website of the Caspervandertak Consulting:
http://www.cdmasia.org/Fuyu.html
In addition to the above announcements, important stakeholders received personal invitations to
attend the meeting. The outcome of the consultation is described in section E.2.
E.2. Summary of the comments received:
Comments received at stakeholder consultation meeting:
During the meeting, Mr. Liang Jun, the Assistant General Manager of Guohua Energy Investment Co.,
Ltd, represented the project entity and gave formal responses to the questions and comments
expressed.

8/8/2019 Qi Qi Har Wind Farm
http://slidepdf.com/reader/full/qi-qi-har-wind-farm 40/53
PROJECT DESIGN DOCUMENT FORM (CDM PDD) - Version 03.1
CDM – Executive Board page 40
This template shall not be altered. It shall be completed without modifying/adding headings or logo, format orfont.
An overview of the main comments/questions expressed during the meeting is provided below:
Name: Mr. Xu Jinsheng
Position / Affiliation: Vice director of Cultural Heritage Administrative Station of QiqihaerComments:
Mr. Xu asked Guohua (Qiqihaer) Energy Investment Co., Ltd had conducted the archaeological
investigation of cultural heritage on the construction site according to Chinese Cultural Heritage
Protection Law. And he also showed an archaeological investigation letter and promised to finish the
work before the real construction started.
Response by project entity (Mr. Liang Jun):
Mr. Liang said Guohua welcomed people from Cultural Heritage Administrative Station of Qiqihaer
to conduct such investigation, and will try its best to cooperate to successfully finish this work.
Name: Mr. Bai Zhanlin and Wang Changshan
Position / Affiliation: Local villagers
Comments:
Mr. Bai and Wang asked whether there would be the opportunities for them to work in this project
and earned some money, if necessary they could provide their owner instruments for the construction.
Response by project entity (Mr. Liang Jun):
Mr. Liang first thanked their supply and replied as below:
• There surely would be such opportunities. If Guohua Company needed labours; it would put the
local people into first consideration and hire them for some assistant construction work, such as
caretakers.
• For the construction material, Guohua will buy the materials from the local area, since this townis rich in sand and stones, in this way it can also benefit the local people.
Name: Mr. Liu Zhiming
Position / Affiliation: Local villager
Comments:
Mr. Liu said this windpark project could bring benefit to the local people, but at the same time it
would also raised some conflicts between the local people and Guohua company. The construction
will surely use the land (maybe the farmland) of villager in Taha township, even the occupied areas
were small. So he asked about whether Guohua had plan to solve it or not.
Response by project entity (Mr. Liang Jun):Mr. Liang gave the responses:
• For the land occupied, Guohua company promises to compensate the villagers according to
related national laws.
• Guohua company planned to only occupy the grassland and wasteland while avoid the farmland
as possible as they could during the designing and construction processes, but if it had to, Guohua
would compensate according to related national laws for farmlands.
• Each wind tower was planned a 20*20m2area, and after finishing the construction, the land will
be recovered, so actually the occupied land for each tower would be much smaller than 20*20m2
area
• Mr. Liang promised the villager Guohua would be strictly follow the laws of China and satisfied
the villager. Since Guohua is a large stated owned company, it will surely keep its promise.
8/8/2019 Qi Qi Har Wind Farm
http://slidepdf.com/reader/full/qi-qi-har-wind-farm 41/53
PROJECT DESIGN DOCUMENT FORM (CDM PDD) - Version 03.1
CDM – Executive Board page 41
This template shall not be altered. It shall be completed without modifying/adding headings or logo, format orfont.
Other comments:
Other comments expressed by various people included:
- The project changed the wind from bad to beneficial to the local people.
- This windpark was an environment friendly project, which would not use oil or coal but withzero poisonous gases and dusts emission.
- The construction of this project could bring along the development of local economy,
especially the travel industry, at the same time it would promote the sale amount the
agricultural production of the farmers.
The project entity (Mr. Liang Jun) provided satisfactory explanations and answers to the questions /
comments.
Comments received through website:
No comments were received by e-mail through the stakeholder consultation website or by telephone.
E.3. Report on how due account was taken of any comments received:
Responses by the project entity in reaction to the findings of the Environmental Impact
Assessment (EIA):
The project entity has taken the findings and recommendations of the EIA and approval of EIA into
account in the planning and implementation of the project. Given the generally positive (or neutral)
nature of the EIA conclusions, no further actions were considered necessary.
Responses to the comments received during the stakeholder consultation:
The project entity, represented by Mr. Liang Jun, provided satisfactory answers and explanations to
the comments and questions raised during the meeting. Given the low impact on the local population
and environment, no further actions are considered necessary.
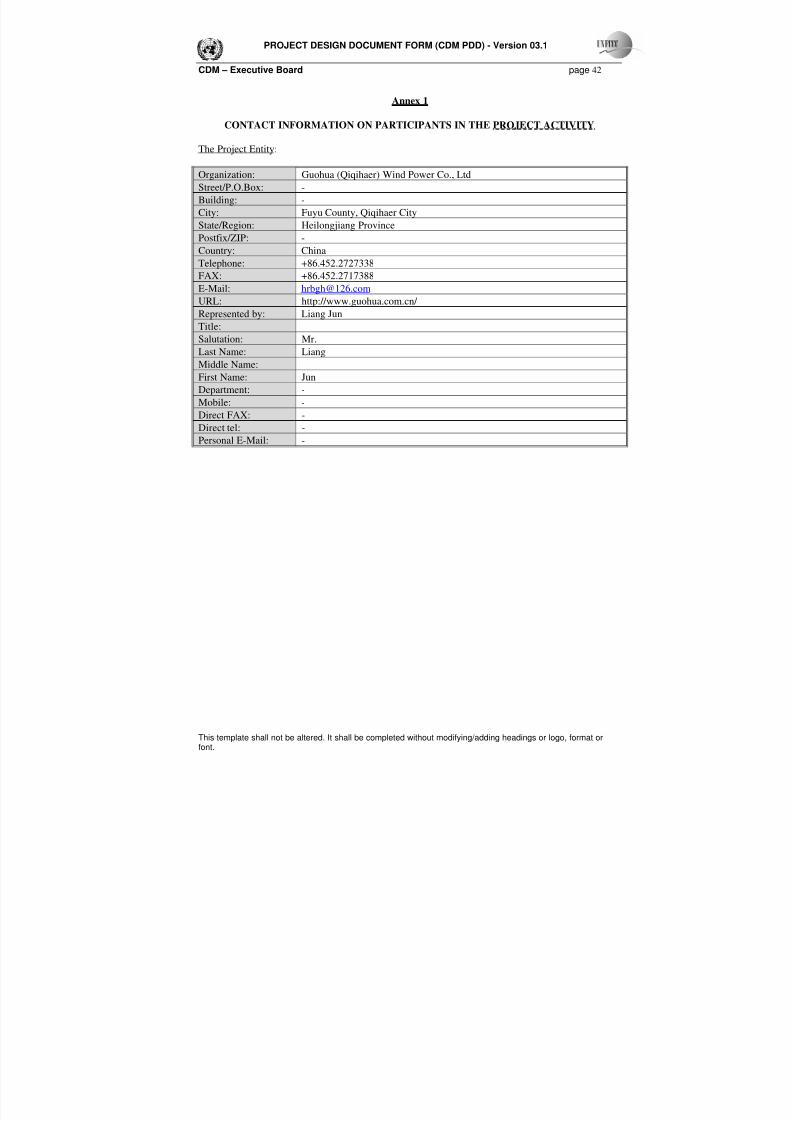
8/8/2019 Qi Qi Har Wind Farm
http://slidepdf.com/reader/full/qi-qi-har-wind-farm 42/53
PROJECT DESIGN DOCUMENT FORM (CDM PDD) - Version 03.1
CDM – Executive Board page 42
This template shall not be altered. It shall be completed without modifying/adding headings or logo, format orfont.
Annex 1
CONTACT INFORMATION ON PARTICIPANTS IN THE PROJECT ACTIVITY
The Project Entity:
Organization: Guohua (Qiqihaer) Wind Power Co., Ltd
Street/P.O.Box: -
Building: -
City: Fuyu County, Qiqihaer City
State/Region: Heilongjiang Province
Postfix/ZIP: -
Country: China
Telephone: +86.452.2727338
FAX: +86.452.2717388E-Mail: [email protected]
URL: http://www.guohua.com.cn/
Represented by: Liang Jun
Title:
Salutation: Mr.
Last Name: Liang
Middle Name:
First Name: Jun
Department: -
Mobile: -
Direct FAX: -Direct tel: -
Personal E-Mail: -
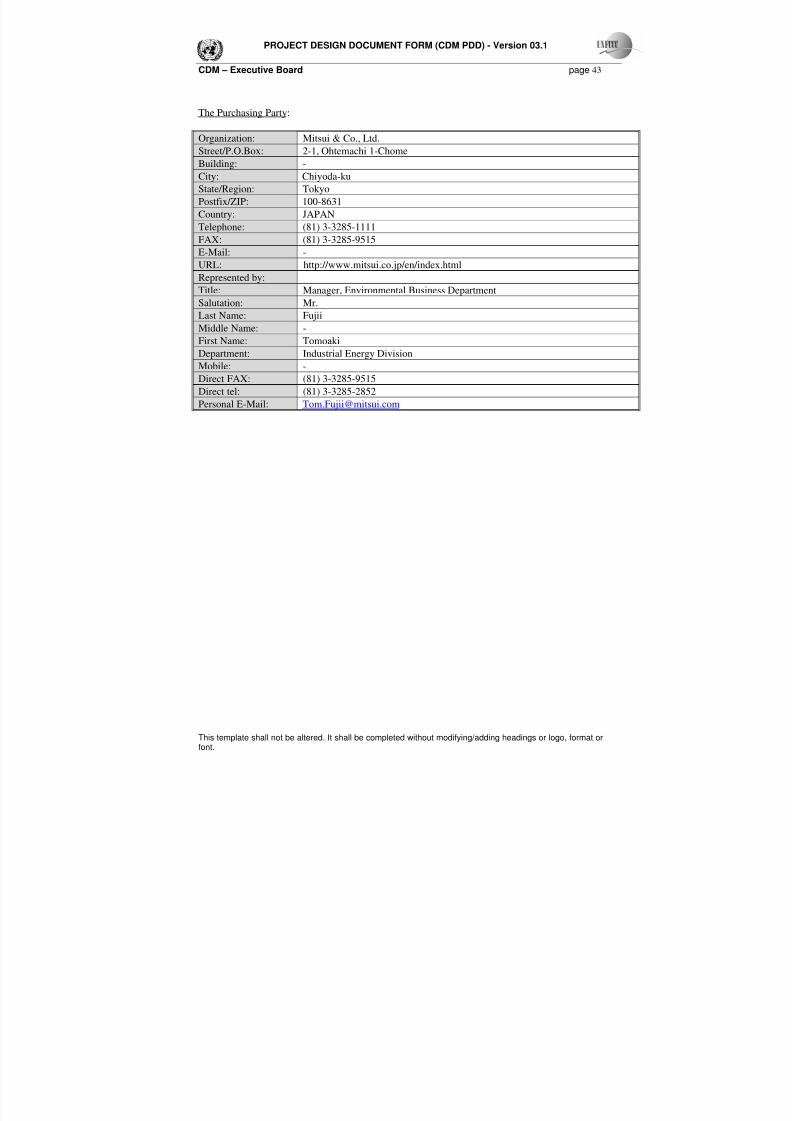
8/8/2019 Qi Qi Har Wind Farm
http://slidepdf.com/reader/full/qi-qi-har-wind-farm 43/53
PROJECT DESIGN DOCUMENT FORM (CDM PDD) - Version 03.1
CDM – Executive Board page 43
This template shall not be altered. It shall be completed without modifying/adding headings or logo, format orfont.
The Purchasing Party:
Organization: Mitsui & Co., Ltd.Street/P.O.Box: 2-1, Ohtemachi 1-Chome
Building: -
City: Chiyoda-ku
State/Region: Tokyo
Postfix/ZIP: 100-8631
Country: JAPAN
Telephone: (81) 3-3285-1111
FAX: (81) 3-3285-9515
E-Mail: -
URL: http://www.mitsui.co.jp/en/index.html Represented by:Title: Manager, Environmental Business Department
Salutation: Mr.
Last Name: Fujii
Middle Name: -
First Name: Tomoaki
Department: Industrial Energy Division
Mobile: -
Direct FAX: (81) 3-3285-9515
Direct tel: (81) 3-3285-2852
Personal E-Mail: [email protected]

8/8/2019 Qi Qi Har Wind Farm
http://slidepdf.com/reader/full/qi-qi-har-wind-farm 44/53
PROJECT DESIGN DOCUMENT FORM (CDM PDD) - Version 03.1
CDM – Executive Board page 44
This template shall not be altered. It shall be completed without modifying/adding headings or logo, format orfont.
Annex 2
INFORMATION REGARDING PUBLIC FUNDING
The project does not receive any public funding
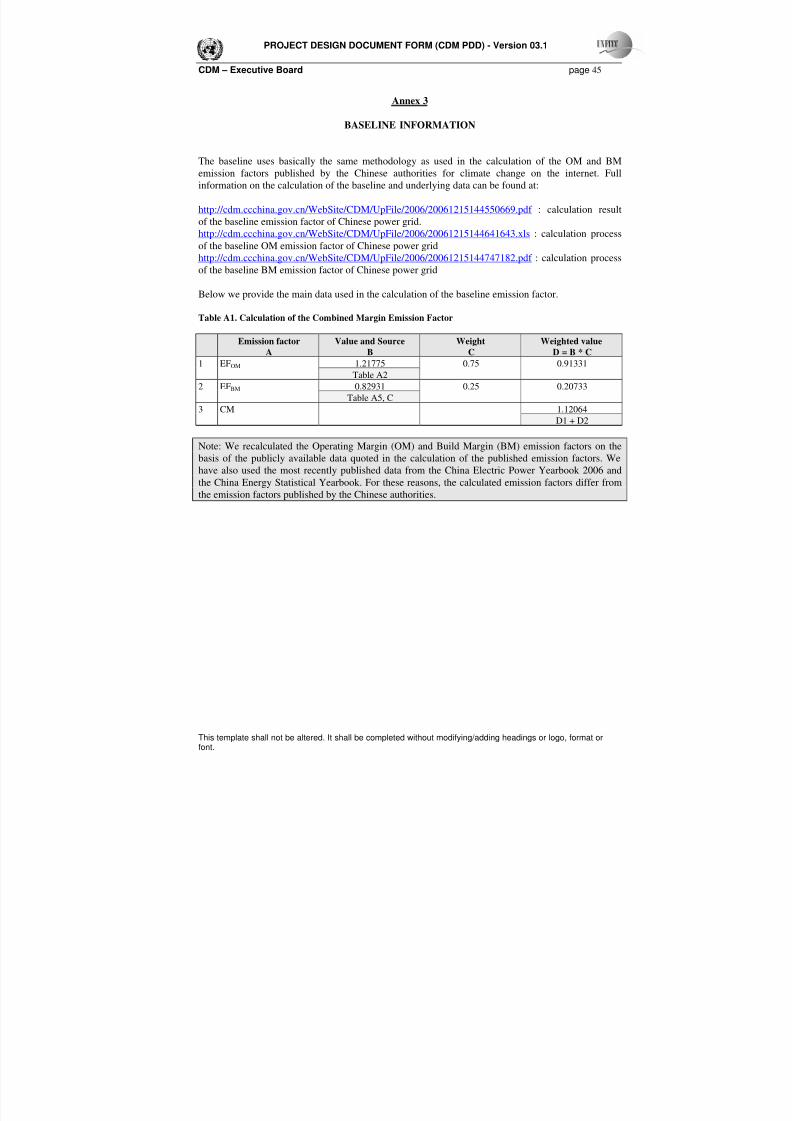
8/8/2019 Qi Qi Har Wind Farm
http://slidepdf.com/reader/full/qi-qi-har-wind-farm 45/53
PROJECT DESIGN DOCUMENT FORM (CDM PDD) - Version 03.1
CDM – Executive Board page 45
This template shall not be altered. It shall be completed without modifying/adding headings or logo, format orfont.
Annex 3
BASELINE INFORMATION
The baseline uses basically the same methodology as used in the calculation of the OM and BM
emission factors published by the Chinese authorities for climate change on the internet. Full
information on the calculation of the baseline and underlying data can be found at:
http://cdm.ccchina.gov.cn/WebSite/CDM/UpFile/2006/20061215144550669.pdf : calculation result
of the baseline emission factor of Chinese power grid.
http://cdm.ccchina.gov.cn/WebSite/CDM/UpFile/2006/20061215144641643.xls : calculation process
of the baseline OM emission factor of Chinese power grid
http://cdm.ccchina.gov.cn/WebSite/CDM/UpFile/2006/20061215144747182.pdf : calculation process
of the baseline BM emission factor of Chinese power grid
Below we provide the main data used in the calculation of the baseline emission factor.
Table A1. Calculation of the Combined Margin Emission Factor
Emission factor Value and Source Weight Weighted value
A B C D = B * C
1 EFOM 1.21775 0.75 0.91331
Table A2
2 EFBM 0.82931 0.25 0.20733
Table A5, C
3 CM 1.12064
D1 + D2
Note: We recalculated the Operating Margin (OM) and Build Margin (BM) emission factors on the
basis of the publicly available data quoted in the calculation of the published emission factors. We
have also used the most recently published data from the China Electric Power Yearbook 2006 and
the China Energy Statistical Yearbook. For these reasons, the calculated emission factors differ from
the emission factors published by the Chinese authorities.
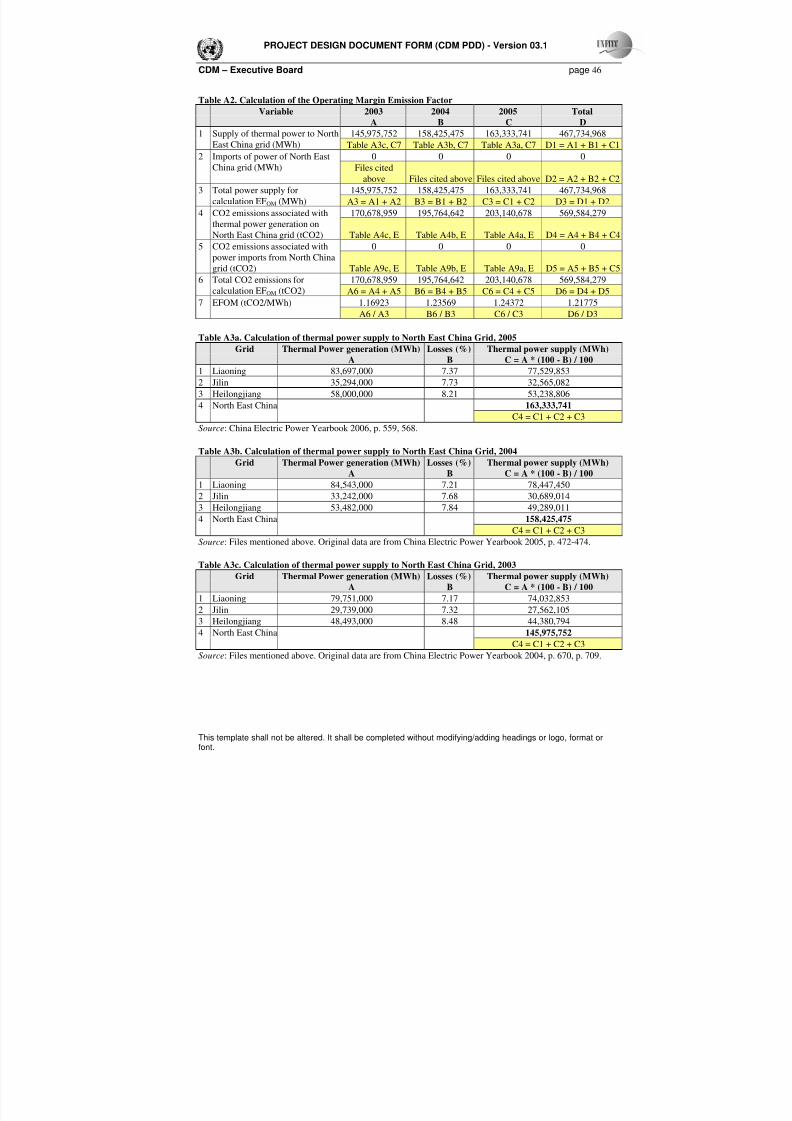
8/8/2019 Qi Qi Har Wind Farm
http://slidepdf.com/reader/full/qi-qi-har-wind-farm 46/53
PROJECT DESIGN DOCUMENT FORM (CDM PDD) - Version 03.1
CDM – Executive Board page 46
This template shall not be altered. It shall be completed without modifying/adding headings or logo, format orfont.
Table A2. Calculation of the Operating Margin Emission Factor
Variable 2003 2004 2005 Total
A B C D
145,975,752 158,425,475 163,333,741 467,734,9681 Supply of thermal power to NorthEast China grid (MWh) Table A3c, C7 Table A3b, C7 Table A3a, C7 D1 = A1 + B1 + C1
0 0 0 02 Imports of power of North East
China grid (MWh) Files cited
above Files cited above Files cited above D2 = A2 + B2 + C2
145,975,752 158,425,475 163,333,741 467,734,9683 Total power supply for
calculation EFOM (MWh) A3 = A1 + A2 B3 = B1 + B2 C3 = C1 + C2 D3 = D1 + D2
170,678,959 195,764,642 203,140,678 569,584,2794 CO2 emissions associated with
thermal power generation on
North East China grid (tCO2) Table A4c, E Table A4b, E Table A4a, E D4 = A4 + B4 + C4
0 0 0 05 CO2 emissions associated with
power imports from North China
grid (tCO2) Table A9c, E Table A9b, E Table A9a, E D5 = A5 + B5 + C5
170,678,959 195,764,642 203,140,678 569,584,2796 Total CO2 emissions forcalculation EFOM (tCO2) A6 = A4 + A5 B6 = B4 + B5 C6 = C4 + C5 D6 = D4 + D5
1.16923 1.23569 1.24372 1.217757 EFOM (tCO2/MWh)
A6 / A3 B6 / B3 C6 / C3 D6 / D3
Table A3a. Calculation of thermal power supply to North East China Grid, 2005
Grid Thermal Power generation (MWh) Losses (%) Thermal power supply (MWh)
A B C = A * (100 - B) / 100
1 Liaoning 83,697,000 7.37 77,529,853
2 Jilin 35,294,000 7.73 32,565,082
3 Heilongjiang 58,000,000 8.21 53,238,806
4 North East China 163,333,741
C4 = C1 + C2 + C3Source: China Electric Power Yearbook 2006, p. 559, 568.
Table A3b. Calculation of thermal power supply to North East China Grid, 2004
Grid Thermal Power generation (MWh) Losses (%) Thermal power supply (MWh)
A B C = A * (100 - B) / 100
1 Liaoning 84,543,000 7.21 78,447,450
2 Jilin 33,242,000 7.68 30,689,014
3 Heilongjiang 53,482,000 7.84 49,289,011
4 North East China 158,425,475
C4 = C1 + C2 + C3
Source: Files mentioned above. Original data are from China Electric Power Yearbook 2005, p. 472-474.
Table A3c. Calculation of thermal power supply to North East China Grid, 2003
Grid Thermal Power generation (MWh) Losses (%) Thermal power supply (MWh)
A B C = A * (100 - B) / 100
1 Liaoning 79,751,000 7.17 74,032,853
2 Jilin 29,739,000 7.32 27,562,105
3 Heilongjiang 48,493,000 8.48 44,380,794
4 North East China 145,975,752
C4 = C1 + C2 + C3
Source: Files mentioned above. Original data are from China Electric Power Yearbook 2004, p. 670, p. 709.

8/8/2019 Qi Qi Har Wind Farm
http://slidepdf.com/reader/full/qi-qi-har-wind-farm 47/53
PROJECT DESIGN DOCUMENT FORM (CDM PDD) - Version 03.1.
CDM – Executive Board
This template shall not be altered. It shall be completed without modifying/adding headings or logo, format or font.
Table A4a. Calculation of CO2 emissions from fuels for thermal power production, North East China Grid, 2005.
Fuel Unit Heilongjiang Liaoning Jilin Northeast China Grid NCV Oxidation factor Carbon emis
(TJ/unit) (Fraction) (TC/T
A B C D
Raw coal 104 Tons 3,383.21 4,305.41 2,446.13 10,134.75 209.08 0.98
Clean coal 104 Tons 0 0 0 0.00 263.44 0.98
Other washed coal 104 Tons 24.16 524.74 19.26 568.16 83.63 0.98
Coke 104 Tons 0 0 0 0.00 284.35 0.98
Coke oven gas 108 m3 0.68 1.03 3.57 5.28 1672.6 0.995
Other gas 108 m3 0 12.62 8.37 20.99 522.7 0.995
Crude oil 104 Tons 0 1.16 0 1.16 418.16 0.99
Gasoline 104 Tons 0 0 0 0.00 430.7 0.99
Diesel 10
4
Tons 0.57 1.18 1.48 3.23 426.52 0.99 Fuel oil 104 Tons 1.55 9.32 2.46 13.33 418.16 0.99
LPG 104 Tons 0 0.12 0 0.12 501.79 0.995
Refinery gas 108 m3 1.32 5.48 0 6.80 460.55 0.995
Natural gas 108 m3 2.24 0 0.84 3.08 3893.1 0.995
Other petroleum
products
104 Tons 0 0 0 0.00 383.69 0.99
Other coking products 104 Tons 0 0 0 0.00 284.35 0.98
Other E (standard coal) 104 Tce 0 16.18 0 16.18 292.7 0.98
Total
Data source: Fuel consumption data are from China Energy Statistical Yearbook 2006, p. 146-157. Net calorific values are fromagainst China Energy Statistical Yearbook, 2004 p. 302; Oxidation factors are from the files mentioned above and crosschecked
IPCC Guidelines for National Greenhouse Gas Inventories, Workbook, p. 1.8; fuel emission coefficients are IPCC default value
Greenhouse Gas Inventories..

8/8/2019 Qi Qi Har Wind Farm
http://slidepdf.com/reader/full/qi-qi-har-wind-farm 48/53
PROJECT DESIGN DOCUMENT FORM (CDM PDD) - Version 03.1.
CDM – Executive Board
This template shall not be altered. It shall be completed without modifying/adding headings or logo, format or font.
Table A4b. Calculation of CO2 emissions from fuels for thermal power production, North East China Grid, 2004.21
Fuel Unit Heilongjiang Liaoning Jilin Northeast China Grid NCV Oxidation factor Carbon emis
(TJ/unit) (Fraction) (TC/T
A B C D
Raw coal 104 Tons 3,084.80 4,144.20 2,310.90 9539.90 209.08 0.980
Clean coal 104 Tons 4.88 84.75 1.09 90.72 263.44 0.980
Other washed coal 104 Tons 61.00 577.67 14.26 652.93 83.63 0.980
Coke 104 Tons 0.00 0.00 0.00 0.00 284.35 0.980
Coke oven gas 108 m3 0.00 4.83 2.91 7.74 1672.6 0.995
Other gas 108 m3 0.00 57.33 4.19 61.52 522.7 0.995
Crude oil 104 Tons 0.00 0.00 0.00 0.00 418.16 0.990
Gasoline 104 Tons 0.00 0.00 0.00 0.00 430.7 0.990
Diesel 10
4
Tons 0.24 2.04 1.16 3.44 426.52 0.990 Fuel oil 104 Tons 2.86 12.81 1.78 17.45 418.16 0.990
LPG 104 Tons 0.00 2.19 0.00 2.19 501.79 0.995
Refinery gas 108 m3 1.14 9.79 0.00 10.93 460.55 0.995
Natural gas 108 m3 2.53 0.00 0.03 2.56 3893.1 0.995
Other petroleum
products
104 Tons 0.00 0.00 0.00 0.00 383.69 0.990
Other coking products 104 Tons 0.00 0.00 0.00 0.00 284.35 0.980
Other E (standard coal) 104 Tce 0.00 26.97 5.07 32.04 292.7 0.980
Total
Data source: Fuel consumption data are from China Energy Statistical Yearbook 2005, p. 222-233. Net calorific values are fromagainst China Energy Statistical Yearbook, 2004 p. 302; Oxidation factors are from the files mentioned above and crosschecked
IPCC Guidelines for National Greenhouse Gas Inventories, Workbook, p. 1.8; fuel emission coefficients are IPCC default value
Greenhouse Gas Inventories..
21 The data tables used in the calculation of the published emission factor omit gasoline. As consumption of gasoline for ther
the calculation of the OM emission factor.

8/8/2019 Qi Qi Har Wind Farm
http://slidepdf.com/reader/full/qi-qi-har-wind-farm 49/53
PROJECT DESIGN DOCUMENT FORM (CDM PDD) - Version 03.1.
CDM – Executive Board
This template shall not be altered. It shall be completed without modifying/adding headings or logo, format or font.
Table A4c. Calculation of CO2 emissions from fuels for thermal power production, North East China Grid, 2003.
Fuel Unit Heilongjiang Liaoning Jilin Northeast China Grid NCV Oxidation factor Carbon emis
(TJ/unit) (Fraction) (TC/T
A B C D
Raw coal 104 Tons 2,763.62 3,556.51 2,006.66 8326.79 209.08 0.980
Clean coal 104 Tons 3.00 70.83 0.00 73.83 263.44 0.980
Other washed coal 104 Tons 53.41 617.04 15.90 686.35 83.63 0.980
Coke 104 Tons 0.00 0.00 0.00 0.00 284.35 0.980
Coke oven gas 108 m3 0.00 1.66 0.00 1.66 1672.6 0.995
Other gas 108 m3 0.00 5.31 0.00 5.31 522.7 0.995
Crude oil 104 Tons 0.00 3.39 0.00 3.39 418.16 0.990
Gasoline 104 Tons 0.00 0.00 0.00 0.00 430.7 0.990
Diesel 104 Tons 0.00 0.32 0.34 0.66 426.52 0.990
Fuel oil 10
4
Tons 4.32 14.87 0.70 19.89 418.16 0.990 LPG 104 Tons 0.00 1.55 0.00 1.55 501.79 0.995
Refinery gas 108 m3 0.46 4.03 0.00 4.49 460.55 0.995
Natural gas 108 m3 4.47 0.00 0.04 4.51 3893.1 0.995
Other petroleum
products
104 Tons 0.00 0.00 0.00 0.00 383.69 0.990
Other coking products 104 Tons 0.00 0.00 0.00 0.00 284.35 0.980
Other E (standard coal) 104 Tce 0.00 29.38 0.00 29.38 292.7 0.980
Total
Data source: Fuel consumption data are from China Energy Statistical Yearbook 2004, 2004, p. 166-77. Net calorific values are
against China Energy Statistical Yearbook, 2004 p. 302; Oxidation factors are from the files mentioned above and crosscheckedIPCC Guidelines for National Greenhouse Gas Inventories, Workbook, p. 1.8; fuel emission coefficients are IPCC default value
Greenhouse Gas Inventories.
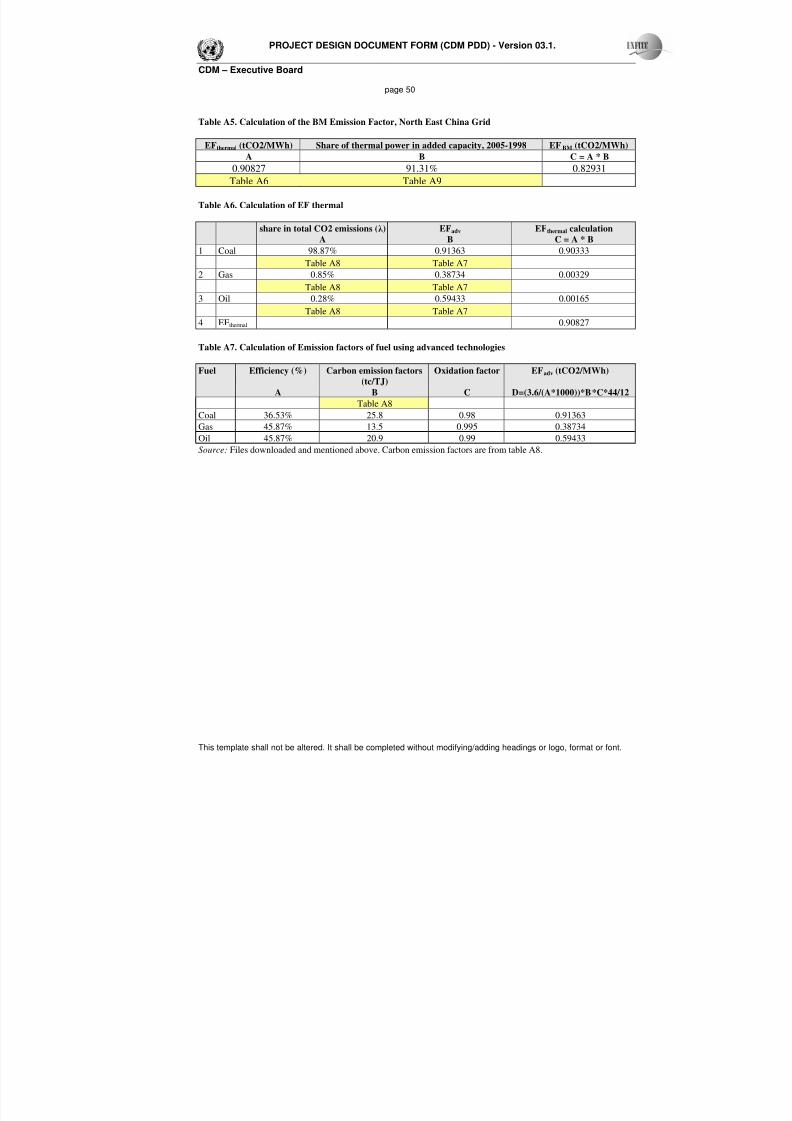
8/8/2019 Qi Qi Har Wind Farm
http://slidepdf.com/reader/full/qi-qi-har-wind-farm 50/53
PROJECT DESIGN DOCUMENT FORM (CDM PDD) - Version 03.1.
CDM – Executive Board
page 50
This template shall not be altered. It shall be completed without modifying/adding headings or logo, format or font.
Table A5. Calculation of the BM Emission Factor, North East China Grid
EFthermal (tCO2/MWh) Share of thermal power in added capacity, 2005-1998 EFBM (tCO2/MWh)
A B C = A * B
0.90827 91.31% 0.82931
Table A6 Table A9
Table A6. Calculation of EF thermal
share in total CO2 emissions (λ ) EFadv EFthermal calculation
A B C = A * B
1 Coal 98.87% 0.91363 0.90333
Table A8 Table A7
2 Gas 0.85% 0.38734 0.00329Table A8 Table A7
3 Oil 0.28% 0.59433 0.00165
Table A8 Table A7
4 EFthermal 0.90827
Table A7. Calculation of Emission factors of fuel using advanced technologies
Fuel Efficiency (%) Carbon emission factors
(tc/TJ)
Oxidation factor EFadv (tCO2/MWh)
A B C D=(3.6/(A*1000))*B*C*44/12
Table A8
Coal 36.53% 25.8 0.98 0.91363Gas 45.87% 13.5 0.995 0.38734
Oil 45.87% 20.9 0.99 0.59433
Source: Files downloaded and mentioned above. Carbon emission factors are from table A8.
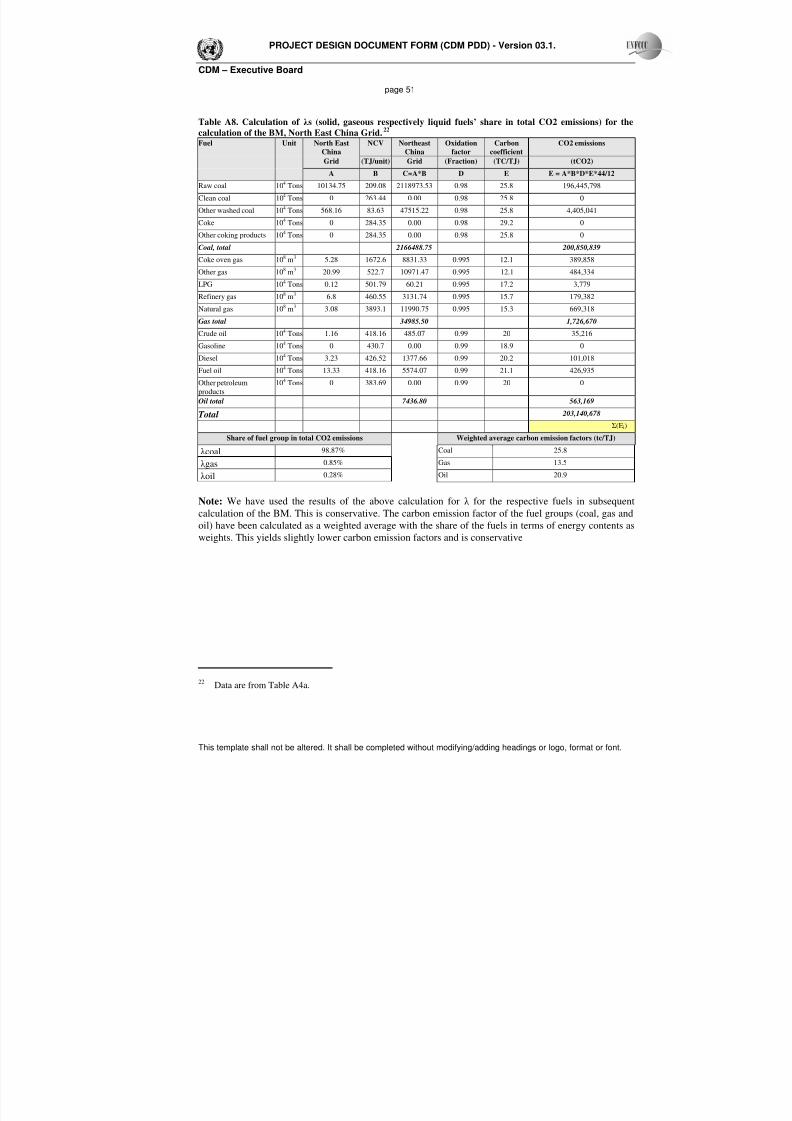
8/8/2019 Qi Qi Har Wind Farm
http://slidepdf.com/reader/full/qi-qi-har-wind-farm 51/53
PROJECT DESIGN DOCUMENT FORM (CDM PDD) - Version 03.1.
CDM – Executive Board
page 51
This template shall not be altered. It shall be completed without modifying/adding headings or logo, format or font.
Table A8. Calculation of λ s (solid, gaseous respectively liquid fuels’ share in total CO2 emissions) for the
calculation of the BM, North East China Grid.22 Fuel Unit North East
China
NCV Northeast
China
Oxidation
factor
Carbon
coefficient
CO2 emissions
Grid (TJ/unit) Grid (Fraction) (TC/TJ) (tCO2)
A B C=A*B D E E = A*B*D*E*44/12
Raw coal 104 Tons 10134.75 209.08 2118973.53 0.98 25.8 196,445,798
Clean coal 104 Tons 0 263.44 0.00 0.98 25.8 0
Other washed coal 104 Tons 568.16 83.63 47515.22 0.98 25.8 4,405,041
Coke 104 Tons 0 284.35 0.00 0.98 29.2 0
Other coking products 104 Tons 0 284.35 0.00 0.98 25.8 0
Coal, total 2166488.75 200,850,839
Coke oven gas 108 m3 5.28 1672.6 8831.33 0.995 12.1 389,858
Other gas 108 m3 20.99 522.7 10971.47 0.995 12.1 484,334
LPG 104 Tons 0.12 501.79 60.21 0.995 17.2 3,779
Refinery gas 108 m3 6.8 460.55 3131.74 0.995 15.7 179,382
Natural gas 108 m3 3.08 3893.1 11990.75 0.995 15.3 669,318
Gas total 34985.50 1,726,670
Crude oil 104 Tons 1.16 418.16 485.07 0.99 20 35,216
Gasoline 104 Tons 0 430.7 0.00 0.99 18.9 0
Diesel 104 Tons 3.23 426.52 1377.66 0.99 20.2 101,018
Fuel oil 104 Tons 13.33 418.16 5574.07 0.99 21.1 426,935
Other petroleum
products
104 Tons 0 383.69 0.00 0.99 20 0
Oil total 7436.80 563,169
Total 203,140,678 Σ(Ei)
Share of fuel group in total CO2 emissions Weighted average carbon emission factors (tc/TJ)
λ coal 98.87% Coal 25.8
λ gas 0.85% Gas 13.5
λ oil 0.28% Oil 20.9
Note: We have used the results of the above calculation for λ for the respective fuels in subsequent
calculation of the BM. This is conservative. The carbon emission factor of the fuel groups (coal, gas and
oil) have been calculated as a weighted average with the share of the fuels in terms of energy contents as
weights. This yields slightly lower carbon emission factors and is conservative
22Data are from Table A4a.

8/8/2019 Qi Qi Har Wind Farm
http://slidepdf.com/reader/full/qi-qi-har-wind-farm 52/53
PROJECT DESIGN DOCUMENT FORM (CDM PDD) - Version 03.1.
CDM – Executive Board
page 52
This template shall not be altered. It shall be completed without modifying/adding headings or logo, format or font.
Table A9. Calculation of the share of thermal power in recently added capacityInstalled capacity 1998 1999 2005 Capacity added in
1998-2005
Share in added
capacity
A B C D=C-A
Thermal (MW) 26104.9 27136.9 33934 7829.1 91.31%
Hydropower (MW) 5482.3 5522.7 5971.4 489.1 5.70%
Nuclear (MW) 0 0 0 0 0.00%
Other (MW) 17 22.9 273.3 256.3 2.99%
Total (MW) 31604.2 32682.5 40178.7 8574.5 100.00%
Percentage of 2005 capacity 78.66% 81.34% 100%
Source: China Electric Power Yearbook 1999; China Electric Power Yearbook 2000; China Electric Power
Yearbook 2006. Totals are calculated from provincial data.
8/8/2019 Qi Qi Har Wind Farm
http://slidepdf.com/reader/full/qi-qi-har-wind-farm 53/53
PROJECT DESIGN DOCUMENT FORM (CDM PDD) - Version 03.1.
CDM – Executive Board
page 53
Annex 4
MONITORING INFORMATION
Selection procedure:
The monitoring officer will be appointed by the general manager of Guohua (Qiqihaer) Wind Power Co.,
Ltd. The monitoring officer will be selected from among the senior technical or managerial staff.
The selection of the initial monitoring officer has taken place and the following person was appointed:
Name: Mr. Yang Ming
Position: Manager of Engineering Department
Tasks and responsibilities:The monitoring officer will be responsible for carrying out the following tasks
• Supervise and verify metering and recording:
The monitoring officer will coordinate with the plant manager to ensure and verify adequate
metering and recording of data, including power delivered to the grid.
• Collection of additional data, sales / billing receipts:
The monitoring officer will collect sales receipts for power delivered to the grid, billing receipts
for power delivered by the grid to the wind farm (if applicable) and additional data such as the
daily operational reports of the wind farm.
• Calibration:
The monitoring officer will coordinate with staff of the project entity to ensure that calibration of the metering instruments is carried out periodically in accordance with regulations of the grid
company.
• Calculation of emission reductions:
The monitoring officer will calculate the annual emission reductions on the basis of net power
supply to the grid. The monitoring officer will be provided with a calculation template in
electronic form by the project’s CDM advisors.
• Preparation of monitoring report:
The monitoring officer will annually prepare a monitoring report which will include among
others a summary of daily operations, metering values of power supplied to and received from
the grid, copies of sales/billing receipts, a report on calibration and a calculation of emission
reductions.
Related Documents