QCL-14-v3_Pareto Diagram_SIMSREE_Aditi Chavan
Aug 07, 2015
Welcome message from author
This document is posted to help you gain knowledge. Please leave a comment to let me know what you think about it! Share it to your friends and learn new things together.
Transcript

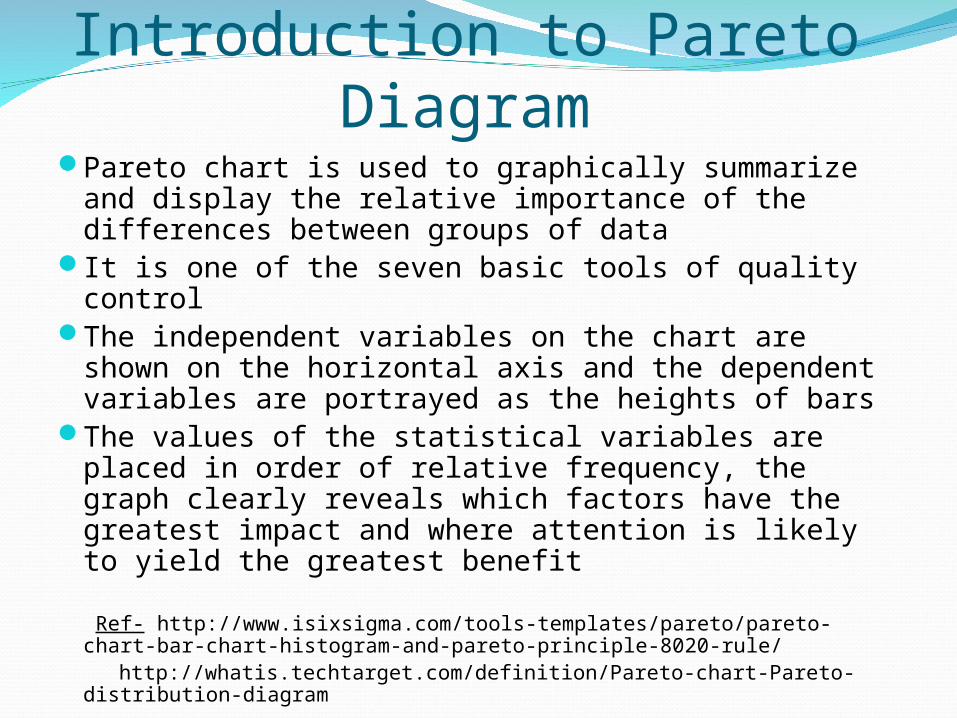
Introduction to Pareto DiagramPareto chart is used to graphically summarize
and display the relative importance of the differences between groups of data
It is one of the seven basic tools of quality controlThe independent variables on the chart are
shown on the horizontal axis and the dependent variables are portrayed as the heights of bars
The values of the statistical variables are placed in order of relative frequency, the graph clearly reveals which factors have the greatest impact and where attention is likely to yield the greatest benefit
Ref- http://www.isixsigma.com/tools-templates/pareto/pareto-chart-bar-chart-histogram-and-pareto-principle-8020-rule/
http://whatis.techtarget.com/definition/Pareto-chart-Pareto-distribution-diagram
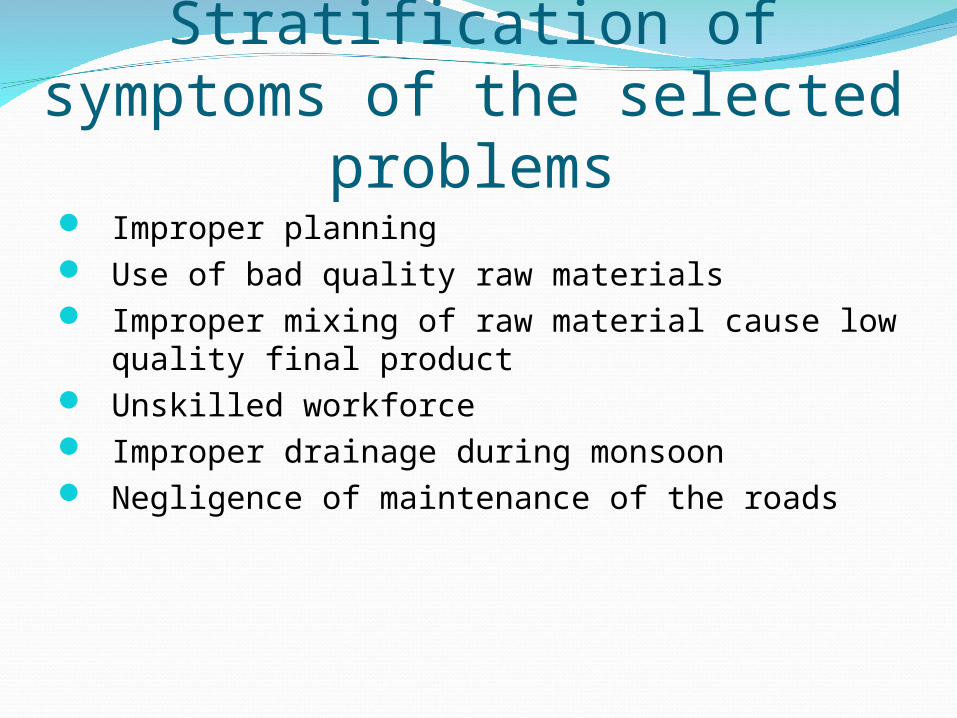
Stratification of symptoms of the selected problems
Improper planning Use of bad quality raw materials Improper mixing of raw material cause low
quality final product Unskilled workforce Improper drainage during monsoon Negligence of maintenance of the roads
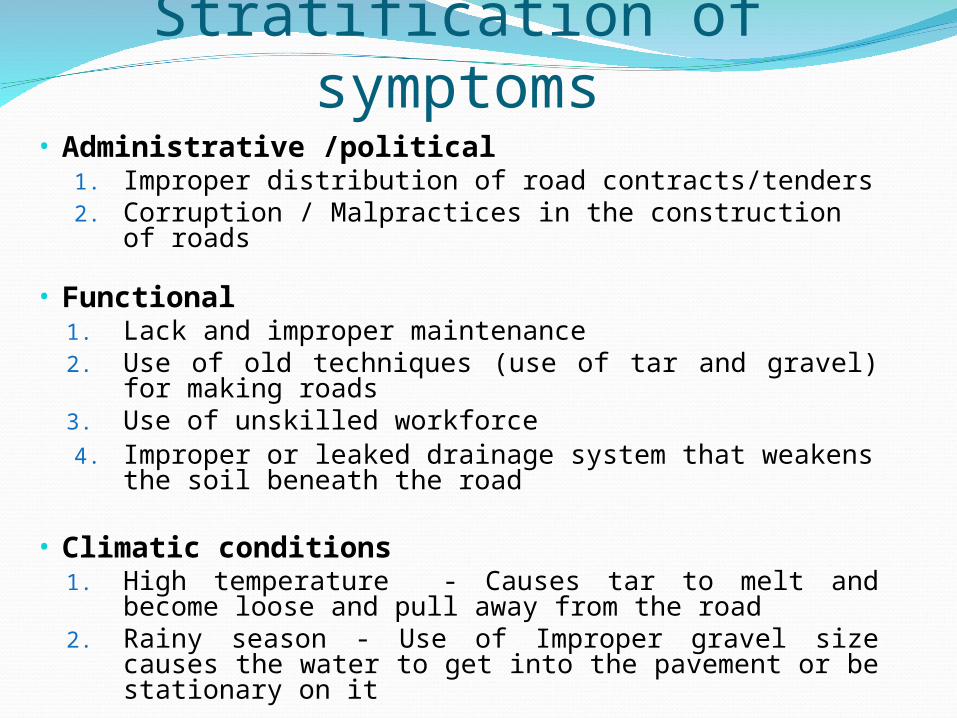
Stratification of symptoms• Administrative /political
1. Improper distribution of road contracts/tenders2. Corruption / Malpractices in the construction of
roads
• Functional 1. Lack and improper maintenance2. Use of old techniques (use of tar and gravel) for
making roads3. Use of unskilled workforce4. Improper or leaked drainage system that weakens
the soil beneath the road
• Climatic conditions1. High temperature - Causes tar to melt and become
loose and pull away from the road 2. Rainy season - Use of Improper gravel size causes
the water to get into the pavement or be stationary on it


The team did a survey to find out the major symptoms that accounted for 80% frequency
Number of roads analysed – 30Gathered information from localities about :
Number of potholes in the road in different seasonHow many times the road was reconstructedUse of any unfair means in the constructionMaintenance of the roadMaterial used in the construction/maintenance of
the road Is the technique used for construction the main
symptom
Identification of symptoms
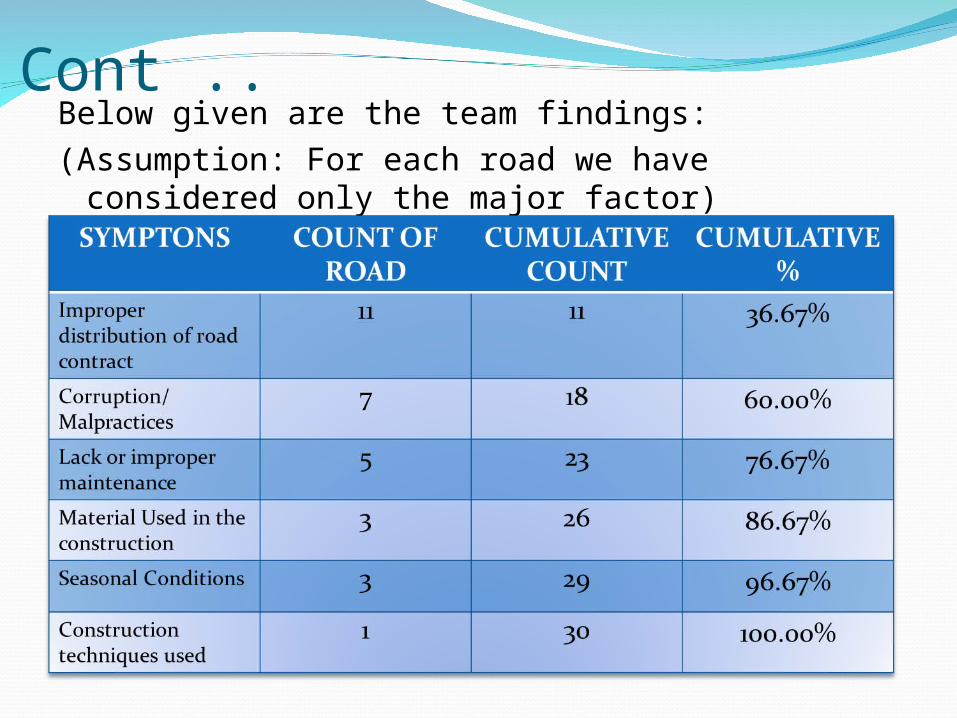
Cont ..Below given are the team findings: (Assumption: For each road we have considered
only the major factor)

Pareto ChartSymptoms Accounting for 80% of the frequency
Problem Definitions of symptomsThe three main symptoms identified are
Improper Distribution of Road ContractCorruption / Malpractices in the construction of
roadsLack or improper maintenance
Problem Description Improper Distribution of Road Contracts:
i. Work taking place on irregular phases
ii. No surveillance on the contractorsiii. Roads constructed before monsoon in a short
period and in haphazard manner
Cont..Corruption / Malpractices in the construction of
roads:i. Use of low quality material
ii. Use of unskilled laboursiii. Sometimes just a thin layer of tar and gravel is
spread on the old pavement
Lack or improper maintenance:i. Zero or low maintenance of the roads
ii. Temporary repair done which is not long lasting iii. Roads dig for drainage or other purpose are not
reconstruction properly
Team Learning Using the Pareto Chart the team was able to find
the various symptoms that accounted for Potholes in the city
With the help of this quality control tool we were able to distinguish the major symptoms
The major symptom that has accounted for the potholes in the city is the improper distribution of contracts or tenders, lack of maintenance and malpractices during construction of road
Government should perform regular surveillance to check the progress of the road construction and quality of material used
Proper maintenance of the roads can minimize the potholes

THANK YOUTHANK YOU
Related Documents