arXiv:hep-lat/0104002v2 29 May 2001 The QCD spectrum with three quark flavors Claude Bernard Department of Physics, Washington University, St. Louis, MO 63130, USA Tom Burch, Kostas Orginos ∗ and Doug Toussaint Department of Physics, University of Arizona, Tucson, AZ 85721, USA Thomas A. DeGrand Physics Department, University of Colorado, Boulder, CO 80309, USA Carleton DeTar Physics Department, University of Utah, Salt Lake City, UT 84112, USA Saumen Datta and Steven Gottlieb Department of Physics, Indiana University, Bloomington, IN 47405, USA Urs M. Heller CSIT, Florida State University, Tallahassee, FL 32306-4120, USA Robert Sugar Department of Physics, University of California, Santa Barbara, CA 93106, USA (February 1, 2008) ∗ Present address: RIKEN-BNL Research Center, Brookhaven National Laboratory, Upton, NY 11973-5000 1

Welcome message from author
This document is posted to help you gain knowledge. Please leave a comment to let me know what you think about it! Share it to your friends and learn new things together.
Transcript
arX
iv:h
ep-l
at/0
1040
02v2
29
May
200
1
The QCD spectrum with three quark flavors
Claude BernardDepartment of Physics, Washington University, St. Louis, MO 63130, USA
Tom Burch, Kostas Orginos∗ and Doug ToussaintDepartment of Physics, University of Arizona, Tucson, AZ 85721, USA
Thomas A. DeGrandPhysics Department, University of Colorado, Boulder, CO 80309, USA
Carleton DeTarPhysics Department, University of Utah, Salt Lake City, UT 84112, USA
Saumen Datta and Steven GottliebDepartment of Physics, Indiana University, Bloomington, IN 47405, USA
Urs M. HellerCSIT, Florida State University, Tallahassee, FL 32306-4120, USA
Robert SugarDepartment of Physics, University of California, Santa Barbara, CA 93106, USA
(February 1, 2008)
∗Present address: RIKEN-BNL Research Center, Brookhaven National Laboratory, Upton, NY
11973-5000
1
Abstract
We present results from a lattice hadron spectrum calculation using three fla-
vors of dynamical quarks — two light and one strange, and quenched simula-
tions for comparison. These simulations were done using a one-loop Symanzik
improved gauge action and an improved Kogut-Susskind quark action. The
lattice spacings, and hence also the physical volumes, were tuned to be the
same in all the runs to better expose differences due to flavor number. Lattice
spacings were tuned using the static quark potential, so as a byproduct we
obtain updated results for the effect of sea quarks on the static quark po-
tential. We find indications that the full QCD meson spectrum is in better
agreement with experiment than the quenched spectrum. For the 0++ (a0)
meson we see a coupling to two pseudoscalar mesons, or a meson decay on
the lattice.
11.15Ha,12.38.Gc
Typeset using REVTEX
2
I. INTRODUCTION
Computation of the properties of hadrons beginning from the QCD Lagrangian is amajor goal of lattice gauge theory, and steady progress has been made. The computationalburden of including dynamical quarks is a major obstacle in the use of lattice QCD tocompute hadronic properties. As a result, many quantities are much better determined inthe quenched approximation than in full QCD. One way of studying the effects of dynamicalquarks is to calculate in quenched and full QCD, using the same valence quark action inboth cases, and matching the lattice spacings and physical sizes of the lattices, so that anydifferences that are found can convincingly be ascribed to the dynamical quarks. Here wepresent a calculation of the hadron spectrum at a lattice spacing of about a = 0.13 fm, usingquenched and full QCD lattices at the same lattice spacing. The lattice spacing was tunedby making short runs on smaller lattices, adjusting the parameters to match the latticespacing of an initial quenched run at 10/g2 = 8.0.
We use an improved Kogut-Susskind quark action which removes tree level order a2
lattice artifacts [1]. The gauge action is a one-loop Symanzik improved action [2]. This actionhas been shown to reduce flavor symmetry breaking and to improve rotational symmetry ofthe hadron spectrum, and to give improved scaling of hadron masses as a function of latticespacing [3].
Another important improvement of these calculations over previous generations is thatwe use three flavors of dynamical quarks. For quark masses larger than the strange quarkmass we use three degenerate flavors, and for light quark masses less thanms we use two lightflavors, keeping the third quark mass at about the strange quark mass. We have also doneone two-flavor simulation on a matched lattice to check for effects of the dynamical strangequark. For the runs with 2+1 dynamical flavors, we computed hadron spectra using valencequark masses equal to the sea quark masses. In the quenched run we computed hadronmasses with valence quarks with the same masses, and nondegenerate propagators using astrange quark mass of ams = 0.05. Finally, in the two dynamical flavor run we computedhadron propagators using light quark masses equal to the dynamical mass, amu,d = 0.02and a non-dynamical strange quark with ams = 0.05.
Two issues that we do not completely address are extrapolation to zero lattice spacingand extrapolation to the physical light quark mass. Using matched quenched and full QCDlattices allows us to draw conclusions about the effects of dynamical quarks without explicitcontinuum extrapolation. Although it is in principle possible that the discretization errorsin quenched and full QCD are very different, we expect that the differences in lattice spacingdependence are in fact comparable to the differences in physical quantities themselves. Sincecorrections to scaling are in any case quite small with our current improved action [1,3] (seealso below), we confidently expect conclusions drawn at fixed lattice spacing to survive inthe continuum limit. We are beginning a series of simulations at a smaller lattice spacingwhich will eventually allow us to make the continuum extrapolation. A few preliminaryquenched points from these finer lattice runs are included here to give an idea of the sizeof these effects. A complete chiral extrapolation will be more difficult. In this work, weattempt an explicit chiral extrapolation only for the shape of the static quark potential, andshow other quantities as functions of the quark mass. Some quantities such as “J” [4] areonly minimally sensitive to chiral extrapolation, and such quantites provide immediately
3
useful tests of dynamical quark effects.In addition to presenting hadron spectra, we update our computation of the static quark
potential. For this quantity we have sufficiently accurate data that we can hazard an extrap-olation to zero quark mass to produce numbers that can be compared with phenomenologicalpotential models. Because the static potential is determined very accurately, it clearly showsdifferences between quenched and full QCD. In fact, one can even see the differences be-tween two and three dynamical flavors, and a “kink” in the plots where we change fromthree degenerate flavors to two light and one heavy indicates a noticeable difference betweentwo light plus one heavy and three light dynamical flavors.
In the meson sector we find differences between full and quenched QCD. A nice wayof exposing these differences is the ratio J proposed by Lacock and Michael [4]. We findthat this quantity is in better agreement with experiment in full QCD than in the quenchedapproximation, as predicted in [4]. This is consistent with results of the CP-PACS [5] andJLQCD [6] collaborations, who also conclude that inclusion of two flavors of dynamicalquarks improves agreement of the lattice spectrum with the real world.
In the isovector JPC = 0++ (a0) channel we find a large difference between quenchedand three-flavor results. We interpret the three flavor results as an avoided level crossingbetween the 0++ meson and a two pseudoscalar state. In other words, we see the a0 decayto two mesons.
We include tables of the mass fits we have chosen, so the reader can compute his or herown favorite mass ratios.
II. SIMULATION PARAMETERS
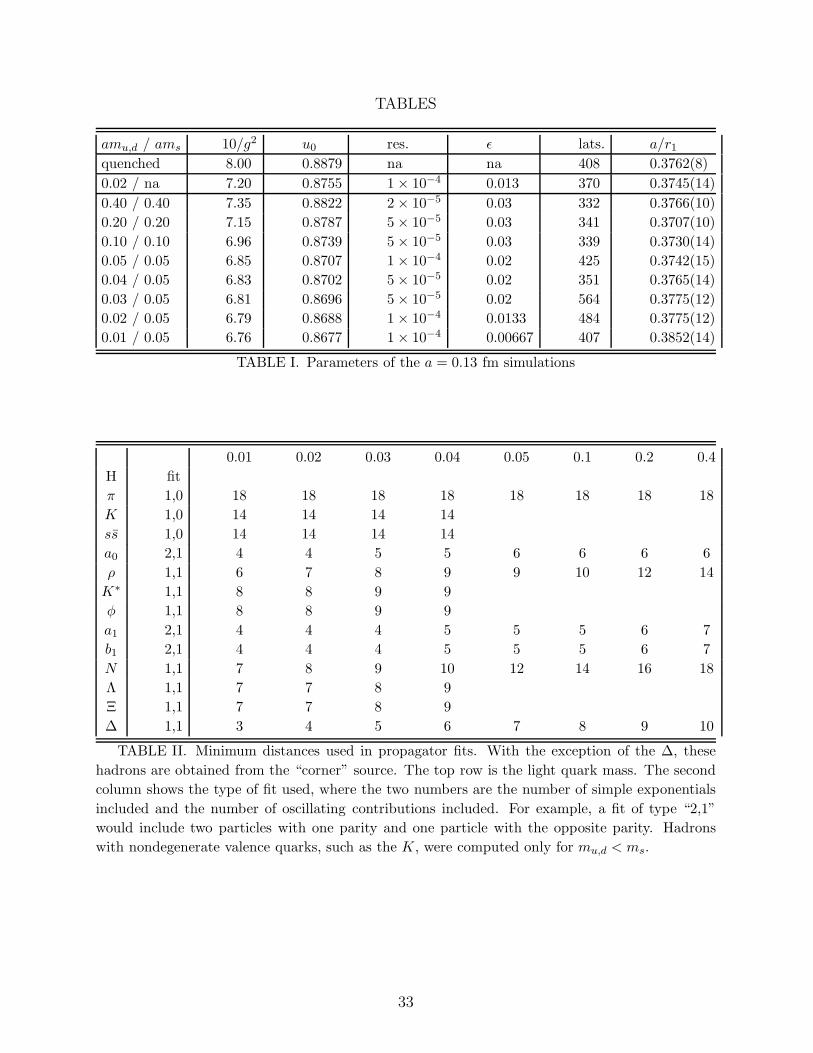
For our two and three flavor simulations we used the standard hybrid-molecular dynamics“R algorithm”, [7] with one pseudofermion field for runs with degenerate quarks, and twopseudofermion fields for runs with different strange and up and down quark masses. In allcases, we used trajectories with unit length in the simulation time. Basic parameters ofthese runs are summarized in Table I.
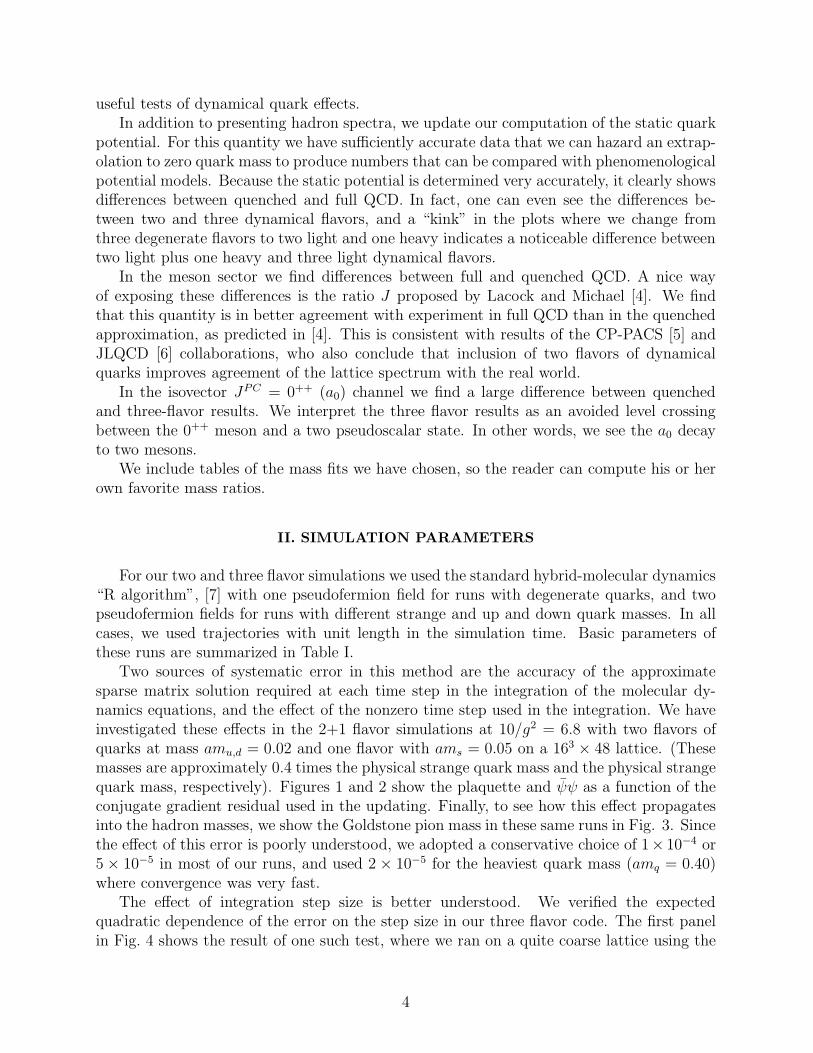
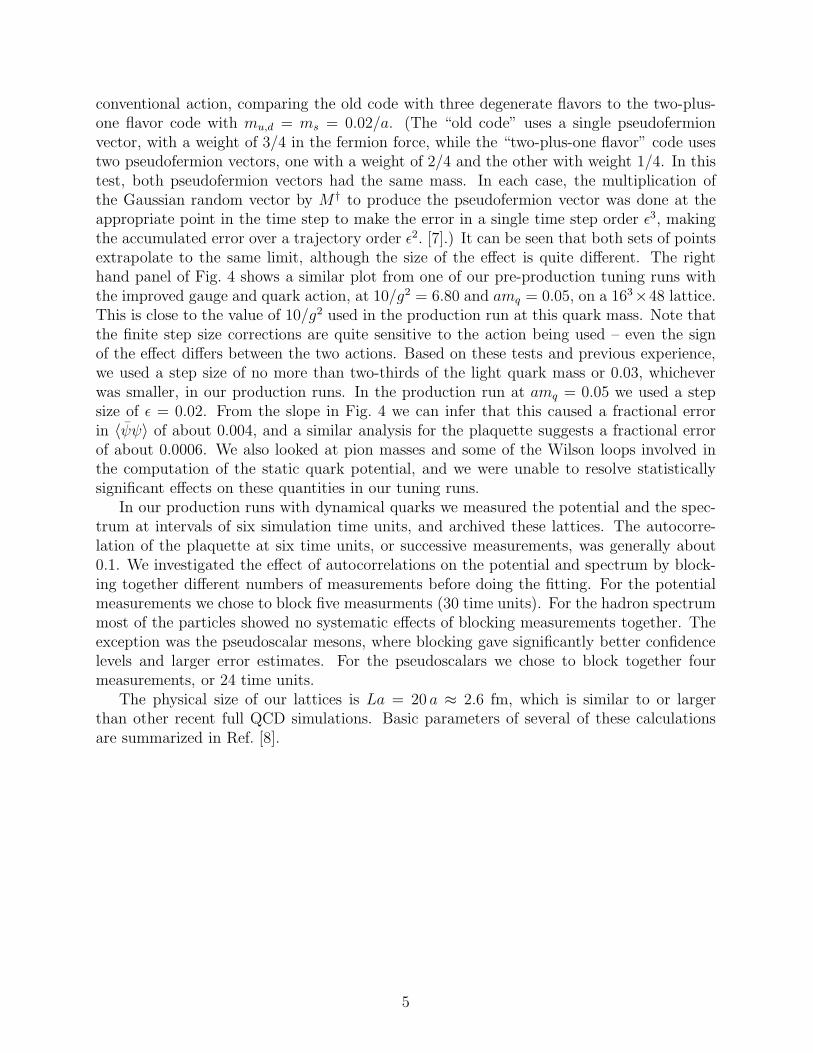
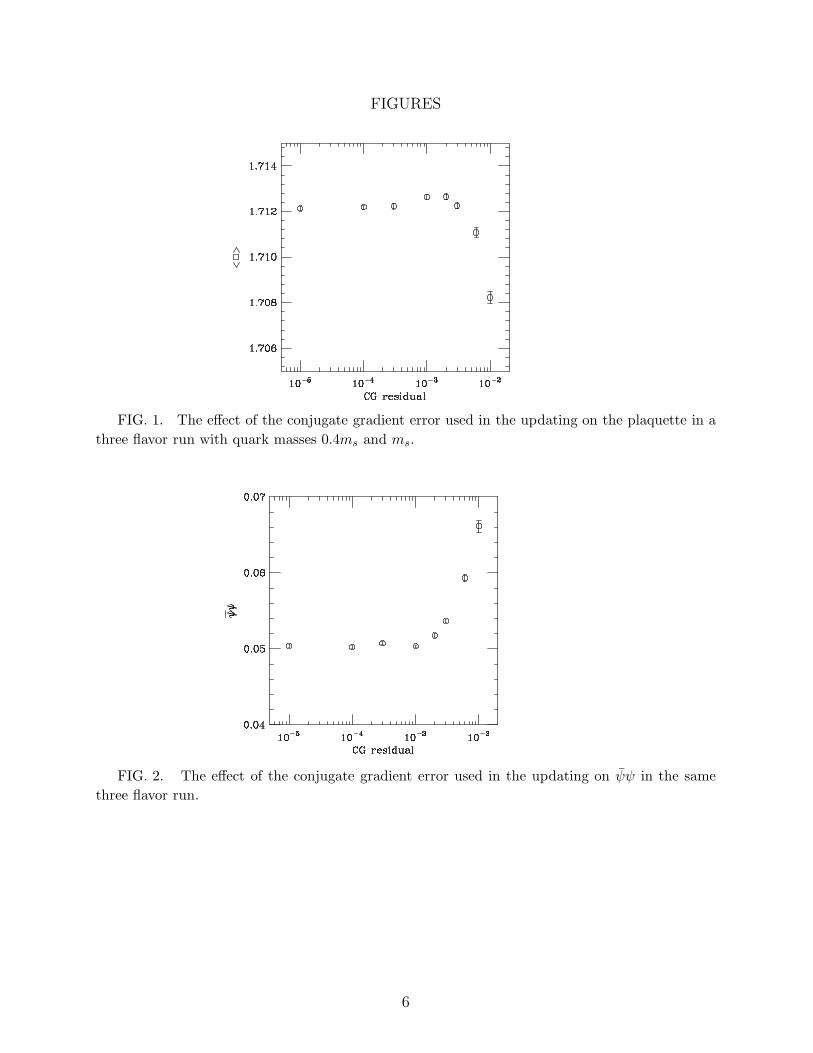
Two sources of systematic error in this method are the accuracy of the approximatesparse matrix solution required at each time step in the integration of the molecular dy-namics equations, and the effect of the nonzero time step used in the integration. We haveinvestigated these effects in the 2+1 flavor simulations at 10/g2 = 6.8 with two flavors ofquarks at mass amu,d = 0.02 and one flavor with ams = 0.05 on a 163 × 48 lattice. (Thesemasses are approximately 0.4 times the physical strange quark mass and the physical strangequark mass, respectively). Figures 1 and 2 show the plaquette and ψψ as a function of theconjugate gradient residual used in the updating. Finally, to see how this effect propagatesinto the hadron masses, we show the Goldstone pion mass in these same runs in Fig. 3. Sincethe effect of this error is poorly understood, we adopted a conservative choice of 1× 10⁻⁴ or5 × 10−5 in most of our runs, and used 2 × 10⁻⁵ for the heaviest quark mass (amq = 0.40)where convergence was very fast.
The effect of integration step size is better understood. We verified the expectedquadratic dependence of the error on the step size in our three flavor code. The first panelin Fig. 4 shows the result of one such test, where we ran on a quite coarse lattice using the
4
conventional action, comparing the old code with three degenerate flavors to the two-plus-one flavor code with mu,d = ms = 0.02/a. (The “old code” uses a single pseudofermionvector, with a weight of 3/4 in the fermion force, while the “two-plus-one flavor” code usestwo pseudofermion vectors, one with a weight of 2/4 and the other with weight 1/4. In thistest, both pseudofermion vectors had the same mass. In each case, the multiplication ofthe Gaussian random vector by M † to produce the pseudofermion vector was done at theappropriate point in the time step to make the error in a single time step order ǫ3, makingthe accumulated error over a trajectory order ǫ2. [7].) It can be seen that both sets of pointsextrapolate to the same limit, although the size of the effect is quite different. The righthand panel of Fig. 4 shows a similar plot from one of our pre-production tuning runs withthe improved gauge and quark action, at 10/g2 = 6.80 and amq = 0.05, on a 163×48 lattice.This is close to the value of 10/g2 used in the production run at this quark mass. Note thatthe finite step size corrections are quite sensitive to the action being used – even the signof the effect differs between the two actions. Based on these tests and previous experience,we used a step size of no more than two-thirds of the light quark mass or 0.03, whicheverwas smaller, in our production runs. In the production run at amq = 0.05 we used a stepsize of ǫ = 0.02. From the slope in Fig. 4 we can infer that this caused a fractional errorin 〈ψψ〉 of about 0.004, and a similar analysis for the plaquette suggests a fractional errorof about 0.0006. We also looked at pion masses and some of the Wilson loops involved inthe computation of the static quark potential, and we were unable to resolve statisticallysignificant effects on these quantities in our tuning runs.
In our production runs with dynamical quarks we measured the potential and the spec-trum at intervals of six simulation time units, and archived these lattices. The autocorre-lation of the plaquette at six time units, or successive measurements, was generally about0.1. We investigated the effect of autocorrelations on the potential and spectrum by block-ing together different numbers of measurements before doing the fitting. For the potentialmeasurements we chose to block five measurments (30 time units). For the hadron spectrummost of the particles showed no systematic effects of blocking measurements together. Theexception was the pseudoscalar mesons, where blocking gave significantly better confidencelevels and larger error estimates. For the pseudoscalars we chose to block together fourmeasurements, or 24 time units.
The physical size of our lattices is La = 20 a ≈ 2.6 fm, which is similar to or largerthan other recent full QCD simulations. Basic parameters of several of these calculationsare summarized in Ref. [8].
5
FIGURES
FIG. 1. The effect of the conjugate gradient error used in the updating on the plaquette in a
three flavor run with quark masses 0.4ms and ms.
FIG. 2. The effect of the conjugate gradient error used in the updating on ψψ in the same
three flavor run.
6
FIG. 3. The effect of the conjugate gradient error used in the updating on the Goldstone pion
mass in the same three flavor run.
7
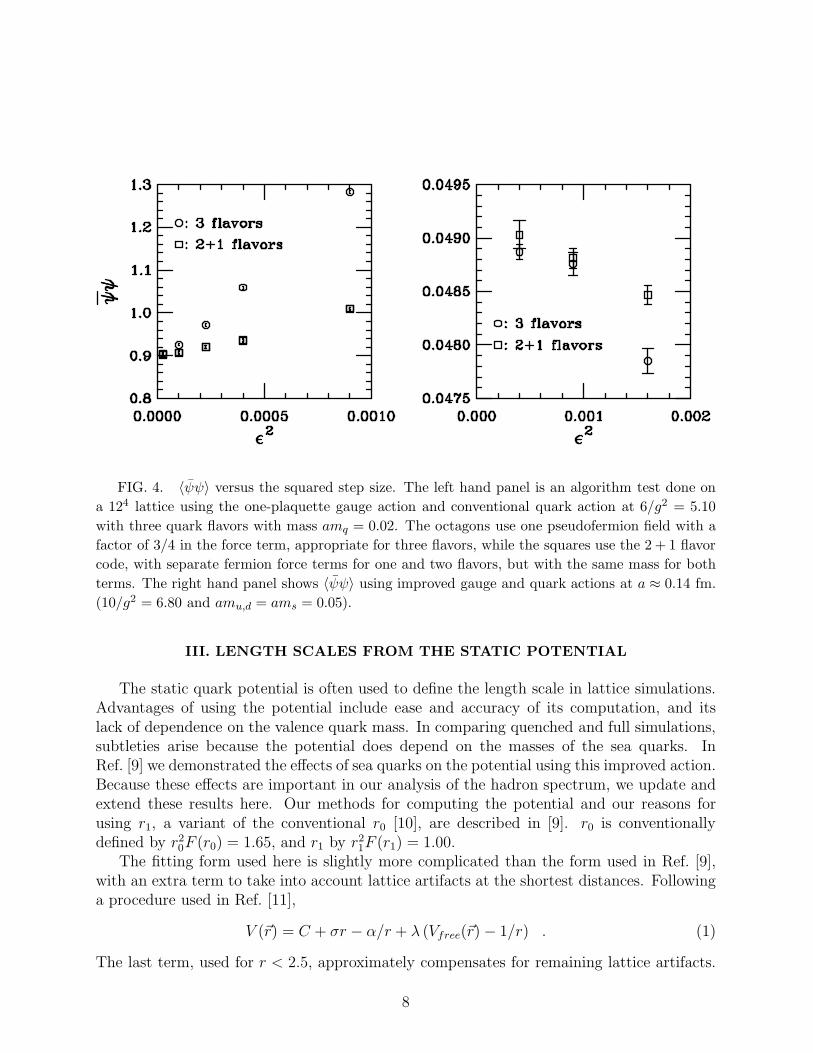
FIG. 4. 〈ψψ〉 versus the squared step size. The left hand panel is an algorithm test done on
a 124 lattice using the one-plaquette gauge action and conventional quark action at 6/g2 = 5.10
with three quark flavors with mass amq = 0.02. The octagons use one pseudofermion field with a
factor of 3/4 in the force term, appropriate for three flavors, while the squares use the 2 + 1 flavor
code, with separate fermion force terms for one and two flavors, but with the same mass for both
terms. The right hand panel shows 〈ψψ〉 using improved gauge and quark actions at a ≈ 0.14 fm.
(10/g2 = 6.80 and amu,d = ams = 0.05).
III. LENGTH SCALES FROM THE STATIC POTENTIAL
The static quark potential is often used to define the length scale in lattice simulations.Advantages of using the potential include ease and accuracy of its computation, and itslack of dependence on the valence quark mass. In comparing quenched and full simulations,subtleties arise because the potential does depend on the masses of the sea quarks. InRef. [9] we demonstrated the effects of sea quarks on the potential using this improved action.Because these effects are important in our analysis of the hadron spectrum, we update andextend these results here. Our methods for computing the potential and our reasons forusing r1, a variant of the conventional r0 [10], are described in [9]. r0 is conventionallydefined by r2
0F (r0) = 1.65, and r1 by r21F (r1) = 1.00.
The fitting form used here is slightly more complicated than the form used in Ref. [9],with an extra term to take into account lattice artifacts at the shortest distances. Followinga procedure used in Ref. [11],
V (~r) = C + σr − α/r + λ (Vfree(~r) − 1/r) . (1)
The last term, used for r < 2.5, approximately compensates for remaining lattice artifacts.
8
Here Vfree(~r) is the potential calculated in free field theory, using the improved gauge action.Adding this term to the fits significantly improves the goodness of fit and makes the fitparameters less sensitive to the choice of distance range. For the a ≈ 0.13 fm runs wetypically find λ ≈ 0.3 − 0.4.
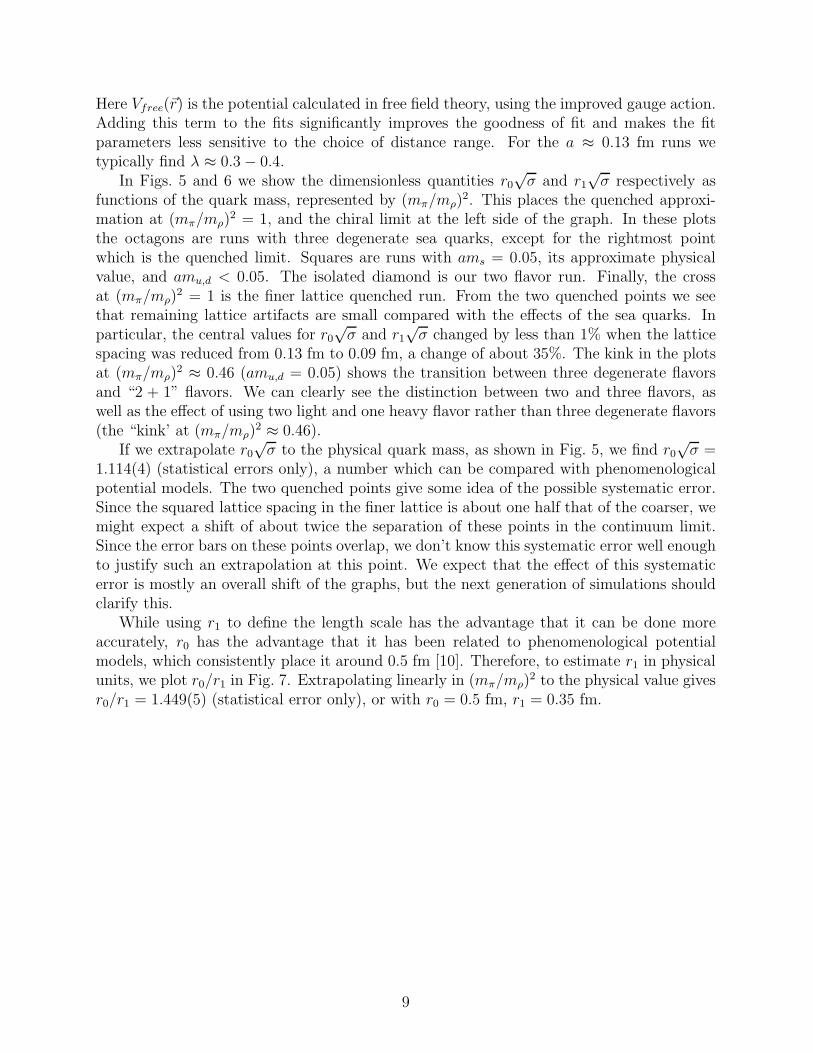
In Figs. 5 and 6 we show the dimensionless quantities r0√σ and r1
√σ respectively as
functions of the quark mass, represented by (mπ/mρ)2. This places the quenched approxi-
mation at (mπ/mρ)2 = 1, and the chiral limit at the left side of the graph. In these plots
the octagons are runs with three degenerate sea quarks, except for the rightmost pointwhich is the quenched limit. Squares are runs with ams = 0.05, its approximate physicalvalue, and amu,d < 0.05. The isolated diamond is our two flavor run. Finally, the crossat (mπ/mρ)
2 = 1 is the finer lattice quenched run. From the two quenched points we seethat remaining lattice artifacts are small compared with the effects of the sea quarks. Inparticular, the central values for r0
√σ and r1
√σ changed by less than 1% when the lattice
spacing was reduced from 0.13 fm to 0.09 fm, a change of about 35%. The kink in the plotsat (mπ/mρ)
2 ≈ 0.46 (amu,d = 0.05) shows the transition between three degenerate flavorsand “2 + 1” flavors. We can clearly see the distinction between two and three flavors, aswell as the effect of using two light and one heavy flavor rather than three degenerate flavors(the “kink’ at (mπ/mρ)
2 ≈ 0.46).If we extrapolate r0
√σ to the physical quark mass, as shown in Fig. 5, we find r0
√σ =
1.114(4) (statistical errors only), a number which can be compared with phenomenologicalpotential models. The two quenched points give some idea of the possible systematic error.Since the squared lattice spacing in the finer lattice is about one half that of the coarser, wemight expect a shift of about twice the separation of these points in the continuum limit.Since the error bars on these points overlap, we don’t know this systematic error well enoughto justify such an extrapolation at this point. We expect that the effect of this systematicerror is mostly an overall shift of the graphs, but the next generation of simulations shouldclarify this.
While using r1 to define the length scale has the advantage that it can be done moreaccurately, r0 has the advantage that it has been related to phenomenological potentialmodels, which consistently place it around 0.5 fm [10]. Therefore, to estimate r1 in physicalunits, we plot r0/r1 in Fig. 7. Extrapolating linearly in (mπ/mρ)
2 to the physical value givesr0/r1 = 1.449(5) (statistical error only), or with r0 = 0.5 fm, r1 = 0.35 fm.
9
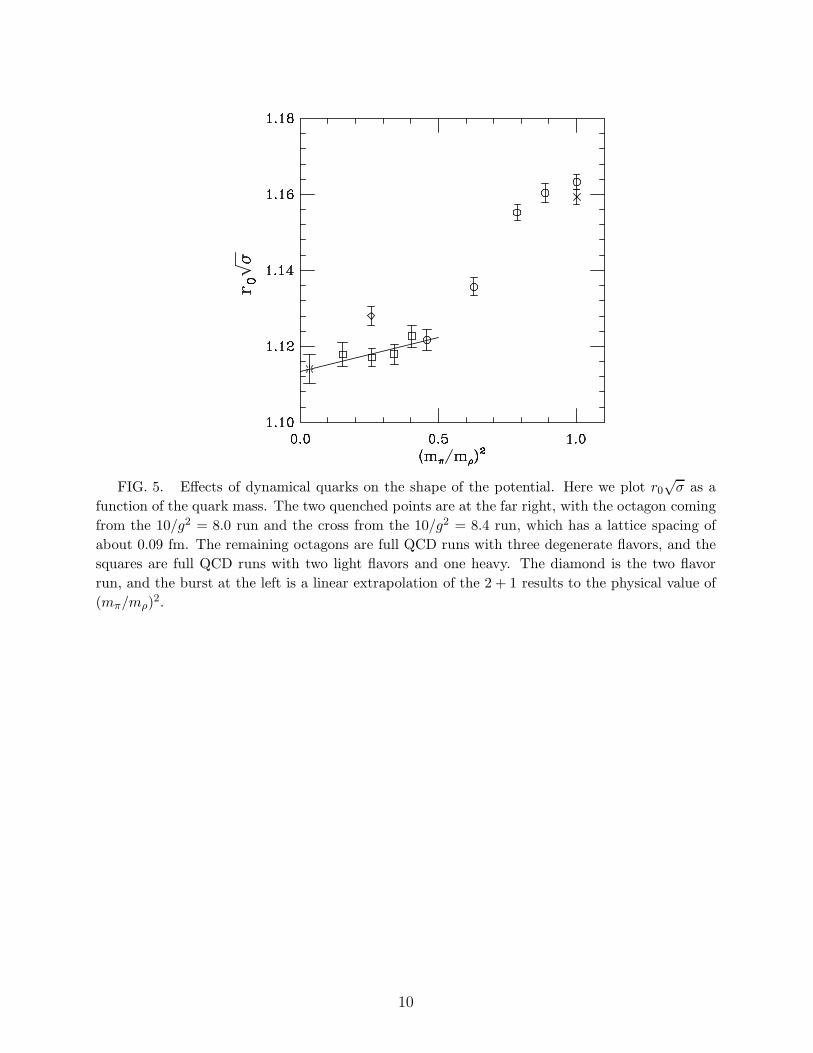
FIG. 5. Effects of dynamical quarks on the shape of the potential. Here we plot r0√σ as a
function of the quark mass. The two quenched points are at the far right, with the octagon coming
from the 10/g2 = 8.0 run and the cross from the 10/g2 = 8.4 run, which has a lattice spacing of
about 0.09 fm. The remaining octagons are full QCD runs with three degenerate flavors, and the
squares are full QCD runs with two light flavors and one heavy. The diamond is the two flavor
run, and the burst at the left is a linear extrapolation of the 2 + 1 results to the physical value of
(mπ/mρ)2.
10
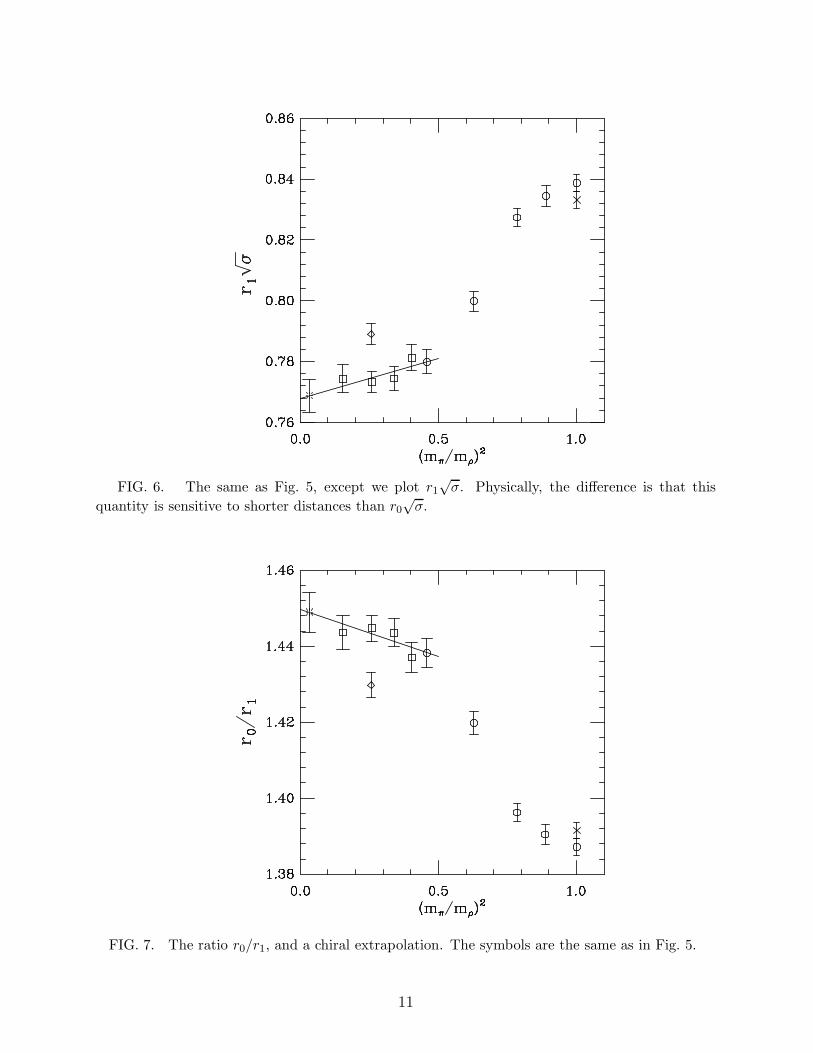
FIG. 6. The same as Fig. 5, except we plot r1√σ. Physically, the difference is that this
quantity is sensitive to shorter distances than r0√σ.
FIG. 7. The ratio r0/r1, and a chiral extrapolation. The symbols are the same as in Fig. 5.
11
IV. PROCEDURES FOR DETERMINING MASSES
All of our hadron propagators used wall sources and local sink operators. Several differentwall sources were used. For the “pointlike” hadrons, for which all the quarks can be on asingle corner of the hypercube, a “corner wall” source gave the best results. This sourceis simply a 1 on each (0, 0, 0) corner of the 23 cubes on the chosen time slice. However,to isolate the decuplet baryons a non-pointlike source is essential, and we used “even” and“odd” wall sources, where 1 or (−1)x+y+z is placed on each site, respectively. This set ofsources was developed in Ref. [12]. For the nonlocal pseudoscalar and vector mesons weused two wall sources made from empirically determined linear combinations of the nonlocalpion operators. Finally, for the nonzero momentum mesons we used a quark source with 1
on each site, and an antiquark source with ei~k·~x on each site. All of the configurations weregauge fixed to the Coulomb gauge before computing the propagators.
In most cases we computed propagators from four source times evenly spread throughthe lattice (only one source slice was “turned on” at a time). For the corner source we usedeight source time slices for the light quark particles with amq ≤ 0.04, and we used eightsource time slices for the “even” and “odd” source baryon propagators. (The ∆ propagatoris very noisy, and propagators computed from source times separated by 8 × 0.13 fm werebasically independent.)
For Kogut-Susskind quarks the meson propagators have the generic form
H(t) =∑
i
Ai
(
e−mit + e−mi(Nt−t))
+∑
i
A′i(−1)t
(
e−m′
it + e−m′
i(Nt−t)
)
. (2)
Here the oscillating terms correspond to particles with opposite parity from the ordinaryexponential terms. Baryon propagators are similar, but have antiperiodic boundary con-ditions and the “backwards” terms include an extra factor of (−1)t. In most cases onlyone mass with each parity is included in the fits, but for half of the pseudoscalar mesonoperators the opposite parity terms are not present, and for the P-wave mesons we found itnecessary to keep two simple exponentials. The quantum numbers for the various operatorsare tabulated in Ref. [13].
Hadron masses were determined from fits to propagators, using the full covariance matrixto estimate errors. The maximum time distance used in the fits was chosen to include pointswith fractional error less than 0.3. Because of the oscillating components in the staggeredquark propagators, it sometimes happens that the fractional error exceeds the threshold atone distance but is smaller at larger distances, so the complete criterion for the maximumdistance included is the largest distance such that the fractional error on each of the nexttwo points exceeds 0.3. Since the points at largest distance contribute little information,the exact large distance cutoff is not critical. To choose the minimum distance included, wefirst went through the fits and chose a minimum distance for each hadron in each dataset,choosing a distance where the confidence level was reasonable and where the mass appearedto reach a plateau. As expected, some propagators had larger(smaller) fluctuations thanother similar propagators, resulting in the choice of a larger(smaller) minimum distance. Forthe particles of greatest interest, to reduce this effect we then “smoothed” these minimumdistances, requiring that the minimum distances be smooth functions of quark mass andbe the same for the quenched and dynamical runs. The resulting minimum distances are
12
strongly dependent on the quark masses, with smaller minimum distances for smaller masses.Most of this is due to the larger statistical errors at smaller quark mass, which result in theexcited state contributions disappearing into the noise at shorter distance. However, it is inpart physical, since splittings between the ground and excited states are larger for smallerquark masses. Table II shows the minimum distances that we chose, and the number ofparticles with each parity.
V. RESULTS
A. Pseudoscalar mesons
We calculated propagators for all eight flavor combinations of the staggered quark pseu-doscalar mesons. These masses obey the “partial flavor symmetry restoration” predicted byLee and Sharpe [14] to very good accuracy. Specifically, Ref. [14] predicts that the leadingorder flavor symmetry breaking effects, which are order a2, leave degeneracies between pairsof pseudoscalar mesons for which γ0 is replaced by γi in the flavor structure. For example,the local non-Goldstone pion, γ0γ5⊗γ0γ5 in the “spin ⊗ flavor” notation, is degenerate withthe distance one pion, γ5 ⊗ γiγ5, to this order. Moreover, all of the squared pion massesshould depend linearly on the quark mass with the same slope to lowest order. Figure 8shows this behavior for the quenched pion masses for amu,d ≤ 0.05. The results for the fullQCD runs are similar. Since the local γ5 ⊗ γ5 pseudoscalar has the correct chiral behavior(and the best scaling behavior), we will use this pseudoscalar in the rest of the analysisunless we specifically indicate otherwise. Results for the full QCD runs are similar, but theflavor symmetry breaking is somewhat larger.
In Fig. 8 the relation between the squared pseudoscalar mass and the quark mass isclearly nearly linear. The deviations from linearity and the effect of the dynamical quarkscan be exposed by plotting the squared pseudoscalar masses divided by the quark mass,in Fig. 9. This is essentially 〈ψψ〉r1/f 2
π with an (unknown) renormalization factor. Thisplot contains pseudoscalar mesons with both light and strange valence quarks (pions, kaonsand “unmixed ss’s”). There is clearly a systematic difference between quenched and fullQCD. This difference increases with decreasing quark mass, and the two-flavor point fallsin between the quenched and three-flavor points. The bursts among the quenched pointsare from the 10/g2 = 8.4, a ≈ 0.09 fm run, showing gratifying agreement with the a ≈ 0.13fm points. Unfortunately, a coarser three flavor lattice, a ≈ 0.2 fm, shows a large effect, sowe would not want to use much coarser lattices in studying this effect. We do note thatwe expect scaling violations to be similar for the quenched and dynamical theories, so it isan advantage to have runs with matched lattice spacings. The deviations from linearity ofm2
π are similar in quenched and full QCD. The upturn for larger quark masses signals thebeginning of the transition to the heavy quark regime, where m2
π ≈ m2q. We do not fully
understand the shape of this plot for small quark mass. There are several ways to interpretthe difference between quenched and dynamical results. One could say that 〈ψψ〉/f 2
π is toosmall in the quenched approximation, or one could say that the quark mass at which adesired mπ/mρ is reached is larger in the quenched approximation than in full QCD. Thissecond interpretation is consistent with CP-PACS results on the quark masses, in whichthey find that the quark mass needed to reach a given value of mπ/mρ is smaller in two
13
flavor QCD than in quenched QCD [15]. (Indeed, one could even use this quantity as alength scale, and conclude that r1 is different in quenched and full QCD.)
The largest part of the error bars in Fig. 9 come from the uncertainty in r1. However, thisuncertainty is common to all of the points coming from the same set of lattices. In particular,all the a ≈ 0.13 fm quenched points are correlated in this respect, as are the three two-flavorpoints. If we are interested in the dependence of the pseudoscalar mass on the quark masson a fixed lattice, we may want to consider only the error from the determination of themeson mass in units of a. The left hand panel in Fig. 10 shows m2
πr21/(r1(m1 +m2)) for the
quenched calculation, including only the error from amPS and showing only the reasonablylight mass points. In this panel the octagons are “pions”, with m1 = m2 = amu,d, and thebursts are “kaons”, with am2 fixed at 0.05, which is approximately the physical value of thestrange quark mass. We see that this quantity is dependent only on the sum of the quarkmasses to very good accuracy. The center panel contains the same plot for the three-flavorruns, where now r1 is determined independently in each run. In this panel the octagons areruns with amu,d = ams ≥ 0.05, the squares the run with amu,d = 0.04, the diamonds fromamu,d = 0.03, the crosses from amu,d = 0.02 and the bursts from amu,d = 0.01. The threesymbols for each of the runs with amu,d < 0.05 correspond to the “pion”, with both valencequarks light, the “kaon”, with one light and one strange valence quark, and an “unmixedss”, with two valence quarks of mass approximately equal to that of the strange quark,but no qq annihilation. This graph is far from smooth, but most of the scatter comes fromthe fact that each set of dynamical quark masses has an independent uncertainty in r1.Note that each dynamical run (for example, the three bursts) shows qualitatively the samebehavior as the quenched case, with the light-light pseudoscalar tending to a larger value.An interesting question is how the sea quark mass affects the pseudoscalar mass. This canbe investigated by looking at the points at a(m1 +m2) = 0.1, which are the “unmixed ss”points with both valence quark masses equal to 0.05/a. In the right hand panel of Fig. 10we plot these points as a function of the light quark mass. There is a noticeable effect, withsmaller light quark mass producing larger ss mass. The direction of this effect is consistentwith the smaller pseudoscalar masses in the two flavor and quenched calculations seen inFig. 9.
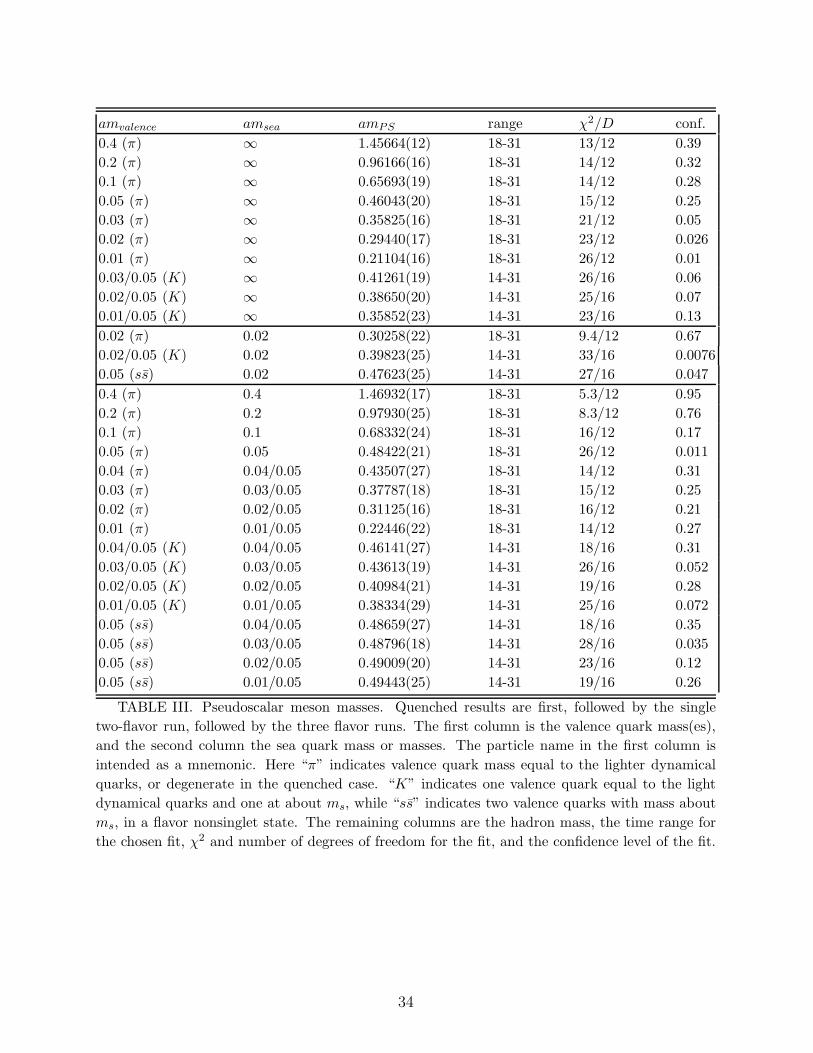
The selected pseudoscalar meson mass fits in units of the lattice spacing are tabulatedin table III. In addition to the “pions”, the table also contains fits with one quark at aboutthe strange quark mass and one lighter quark, or “kaons”. For the two and three flavor runswe also tabulate “unmixed ss mesons”, with two valence quarks with amv = 0.05.
We have attempted to fit the results in Fig. 9 to the forms predicted by chiral perturbationtheory. In the quenched case, the behavior of m2
π as a function of quark mass is derived inRefs. [16,17]. We use eqn. (9) in [16], with the parameter α, which is believed to be small,set equal to zero, and the analytic correction term added to the chiral log. For pions, thenone has
m2π
m= C(1 − δ log
(
Cm
Λ2
)
+Km) , (3)
where m1 = m2 ≡ m, C and K are constants, and the chiral scale Λ may be taken as theη mass. As shown in Fig. 9, the fit to the a = .13 fm quenched data is good. It givesδ = 0.061(3) (statistical error only), which is on the low side but compatible with the range
14
reported by CP-PACS [18] and is in excellent agreement with the result of Bardeen et al.
[19], δ = 0.065(13).Unfortunately, our attempts to fit the 3-flavor pion data in Fig. 9 to the corresponding
full QCD chiral form [20] have been unsuccessful to date. We can fit the 5 lowest-mass pionswith reasonable confidence level, but the coefficients of the analytic terms are unreasonablylarge, and the fit misses the next lightest pion by a wide margin. If we try to fit the 6lowest-mass pions, the fit has terrible confidence level. Finally, good fits can be obtainedby introducing, as an additional free parameter, an overall coefficient in front of the chirallogs. However, the value of that coefficient in the fit is much smaller than its predicted [20]value. We are continuing to study this puzzling situation. Our current running at smallerlattice spacing may provide additional insight here.
15
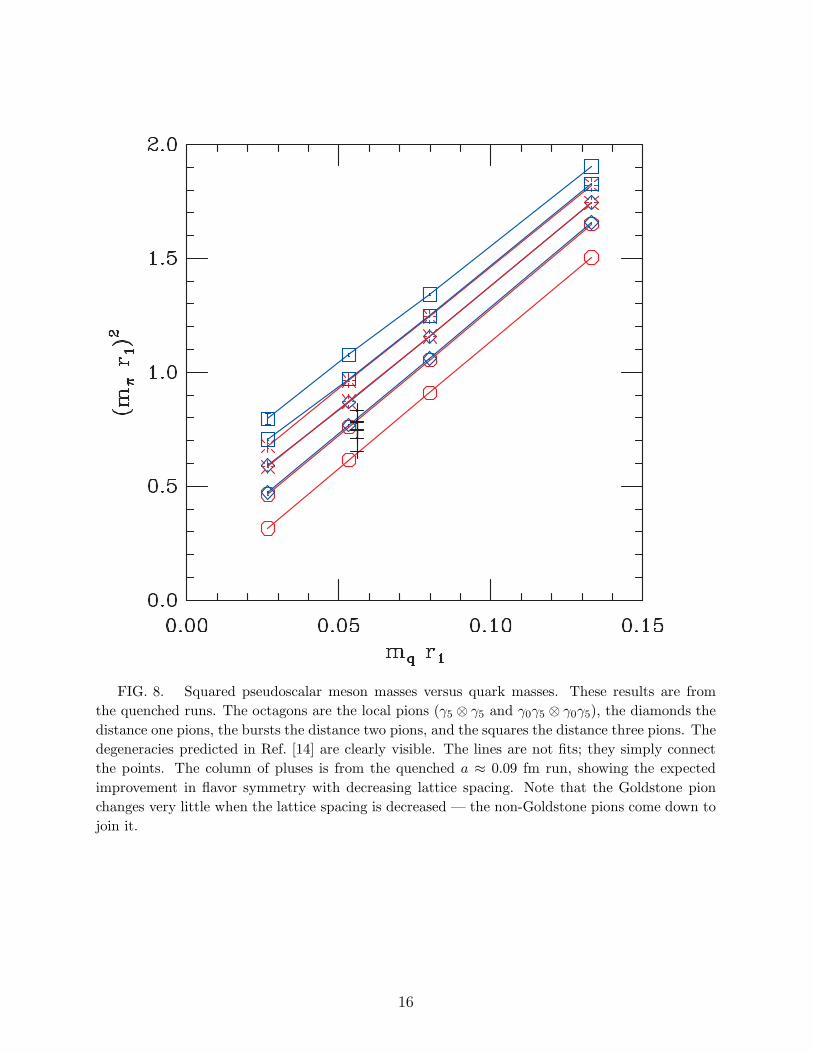
FIG. 8. Squared pseudoscalar meson masses versus quark masses. These results are from
the quenched runs. The octagons are the local pions (γ5 ⊗ γ5 and γ0γ5 ⊗ γ0γ5), the diamonds the
distance one pions, the bursts the distance two pions, and the squares the distance three pions. The
degeneracies predicted in Ref. [14] are clearly visible. The lines are not fits; they simply connect
the points. The column of pluses is from the quenched a ≈ 0.09 fm run, showing the expected
improvement in flavor symmetry with decreasing lattice spacing. Note that the Goldstone pion
changes very little when the lattice spacing is decreased — the non-Goldstone pions come down to
join it.
16
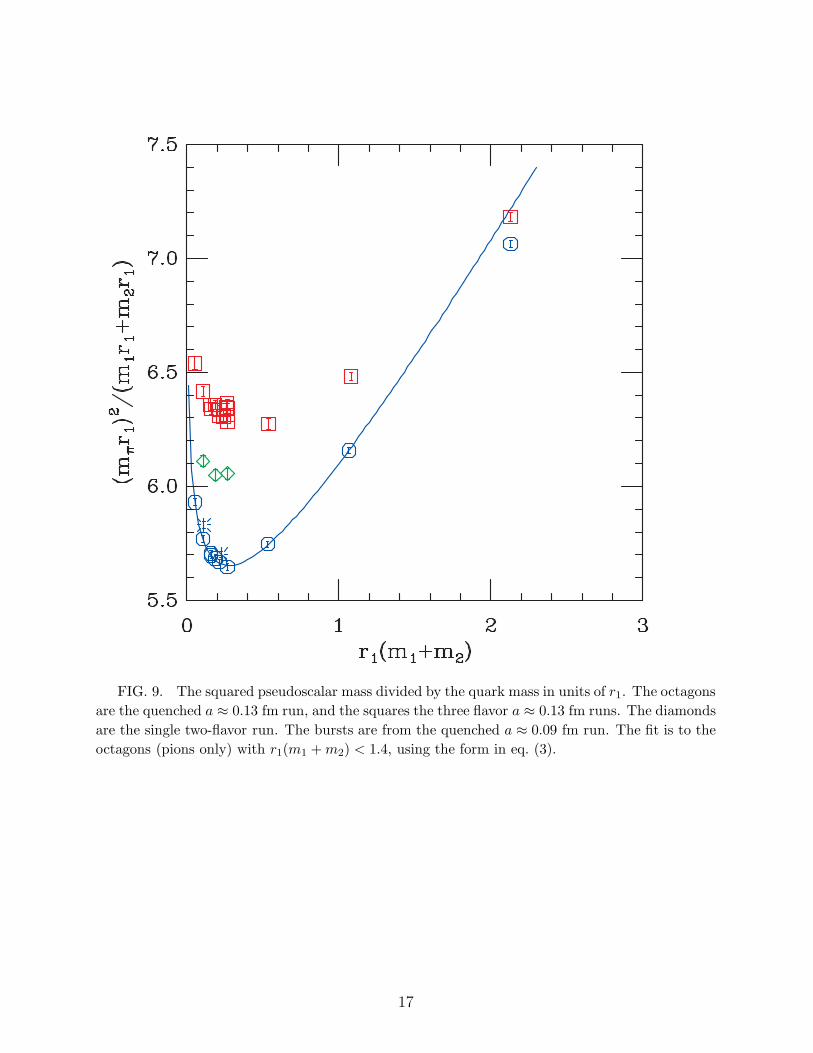
FIG. 9. The squared pseudoscalar mass divided by the quark mass in units of r1. The octagons
are the quenched a ≈ 0.13 fm run, and the squares the three flavor a ≈ 0.13 fm runs. The diamonds
are the single two-flavor run. The bursts are from the quenched a ≈ 0.09 fm run. The fit is to the
octagons (pions only) with r1(m1 +m2) < 1.4, using the form in eq. (3).
17
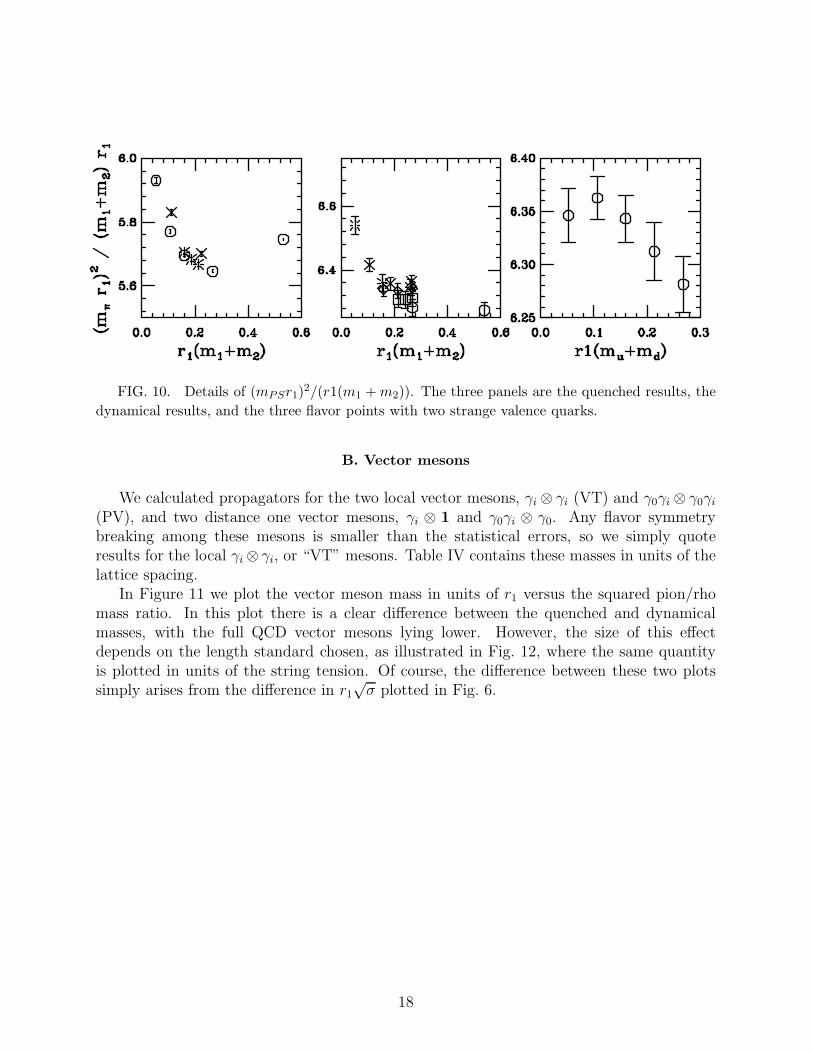
FIG. 10. Details of (mPSr1)2/(r1(m1 +m2)). The three panels are the quenched results, the
dynamical results, and the three flavor points with two strange valence quarks.
B. Vector mesons
We calculated propagators for the two local vector mesons, γi ⊗ γi (VT) and γ0γi ⊗ γ0γi
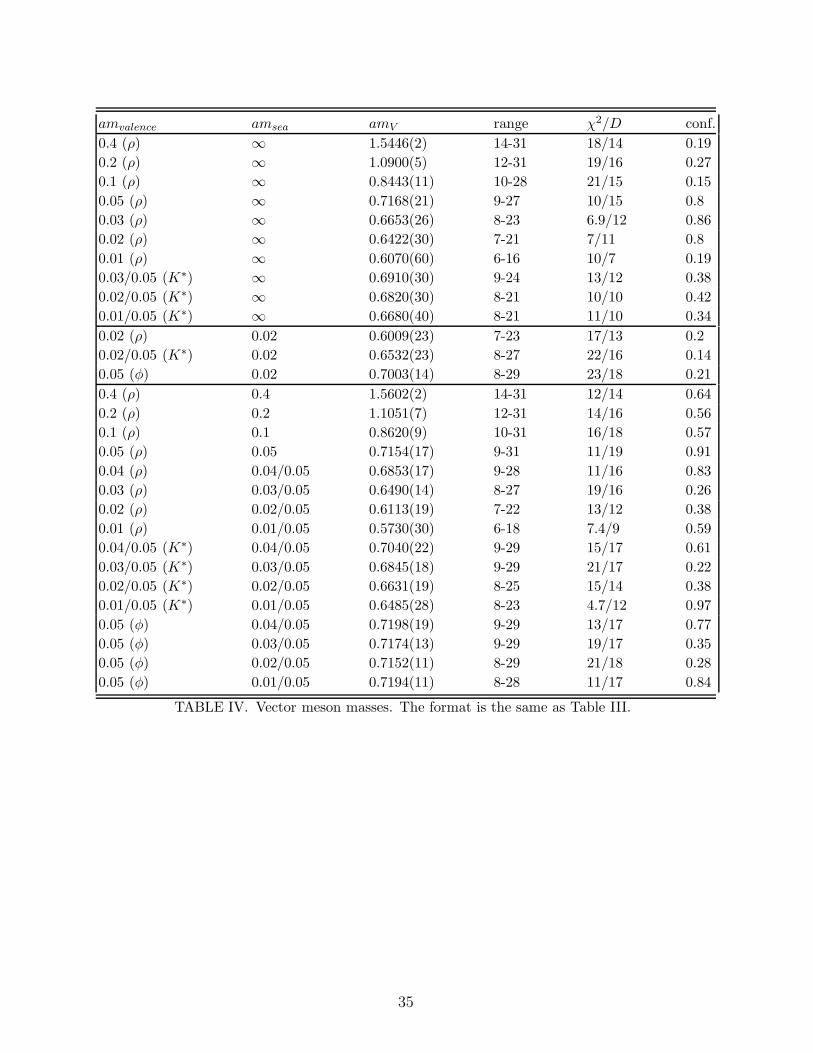
(PV), and two distance one vector mesons, γi ⊗ 1 and γ0γi ⊗ γ0. Any flavor symmetrybreaking among these mesons is smaller than the statistical errors, so we simply quoteresults for the local γi ⊗ γi, or “VT” mesons. Table IV contains these masses in units of thelattice spacing.
In Figure 11 we plot the vector meson mass in units of r1 versus the squared pion/rhomass ratio. In this plot there is a clear difference between the quenched and dynamicalmasses, with the full QCD vector mesons lying lower. However, the size of this effectdepends on the length standard chosen, as illustrated in Fig. 12, where the same quantityis plotted in units of the string tension. Of course, the difference between these two plotssimply arises from the difference in r1
√σ plotted in Fig. 6.
18
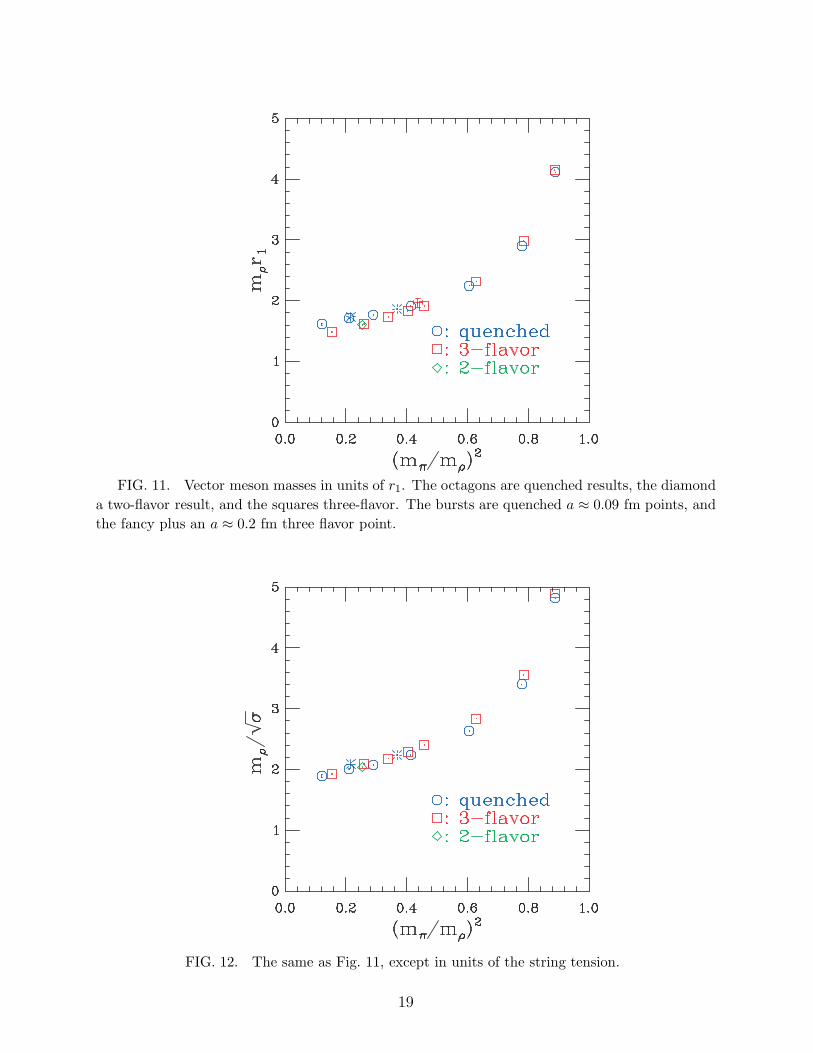
FIG. 11. Vector meson masses in units of r1. The octagons are quenched results, the diamond
a two-flavor result, and the squares three-flavor. The bursts are quenched a ≈ 0.09 fm points, and
the fancy plus an a ≈ 0.2 fm three flavor point.
FIG. 12. The same as Fig. 11, except in units of the string tension.
19
In our calculations we used a mass of ams = 0.05 for the strange quark mass. With themeson spectrum in hand, we can now go back and ask whether this choice was exactly correct.There are several quantities that we could choose to define the strange quark mass, and,especially in the quenched calculation, they will in general give different results. Perhapsthe most accessible quantity is the ratio of the ss pseudoscalar to vector meson mass. (Our“ss pseudoscalar” does not include qq annihilation diagrams, so it is not the η or η′.) We
therefore tune this quantity using mss =√
2m2K −m2
π = 686 MeV and mφ = 1020 MeV, ormPS/mV = 0.673.
In the quenched spectrum with amq = 0.05 we have mPS/mV = 0.643, indicating thatamq = 0.05 is smaller than the desired strange quark mass. To compute the mass at whichmPS/mV = 0.673, we can do a linear fit to the vector meson mass as a function of quarkmass, and combine that with a squared pseudoscalar mass proportional to the quark mass toconclude that the quenched strange quark mass defined by mPS/mV at this lattice spacingis ams = 0.058. In contrast, for the dynamical runs ams = 0.05 is a fairly good estimate ofthe strange quark mass, with mPS/mV taking values between 0.670(2) and 0.687(1).
Differences between the quenched meson spectrum and the real world have been observedby the UKQCD collaboration [4], and improvements of the spectrum when dynamical quarksare included have been reported by the CPPACS [5] and JLQCD [6] collaborations. Inparticular, the UKQCD collaboration studied the quantity
J = mK∗
∂mV
∂m2PS
, (4)
where mV and mPS are the vector and pseudoscalar meson masses. This quantity has theadvantage of being relatively insensitive to the quark masses, so that accurate tuning of thestrange quark mass or extrapolation of the masses to the chiral limit is not essential. Ofcourse, to compare to experiment the derivative in this expression must be replaced by aratio of mass differences, and we choose
J = mK∗
(mφ −mρ)
2 (m2K −m2
π). (5)
Here mρ is the mass of the vector meson including two light quarks, etc. We choose themφ − mρ mass difference because the statistical error in J is dominated by the error inthe vector meson masses, and the larger difference in mφ −mρ relative to, say, mK∗ −mρ
leads to smaller statistical errors on J . Because all of the masses in Eq. 5 are correlated,we use a jackknife analysis to compute the error on J . Figure 13 shows the results for Jin quenched and three flavor QCD. Following UKQCD, we plot this versus mK∗/mK , forwhich the real world value is 1.8. The burst is the real world value of this definition of J(0.49), and the cross is the value of J found in the UKQCD quenched simulations. We seea clear effect of the sea quarks on this quantity. Indeed, any reasonable extrapolation ofour data in mK∗/mK would pass near the real world point. Figure 13 also contains onepoint with two dynamical flavors. This point falls near the three flavor points, indicatingthat the dynamical strange quark is less important than the two light quarks. Although ourquenched results are somewhat higher than the UKQCD value, they are significantly belowthe experimental value. The fact that the quenched points in this plot are to the right ofthe full QCD points is largely due to the fact that the mass of amq = 0.05 used for the
20
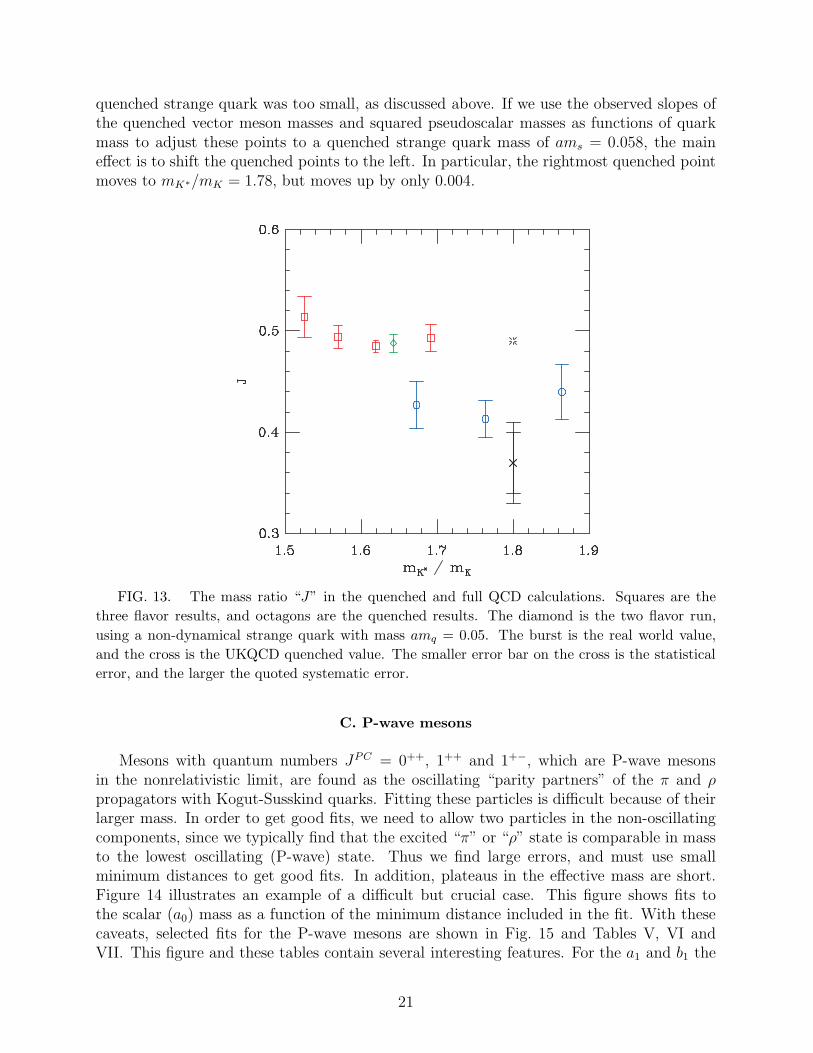
quenched strange quark was too small, as discussed above. If we use the observed slopes ofthe quenched vector meson masses and squared pseudoscalar masses as functions of quarkmass to adjust these points to a quenched strange quark mass of ams = 0.058, the maineffect is to shift the quenched points to the left. In particular, the rightmost quenched pointmoves to mK∗/mK = 1.78, but moves up by only 0.004.
FIG. 13. The mass ratio “J” in the quenched and full QCD calculations. Squares are the
three flavor results, and octagons are the quenched results. The diamond is the two flavor run,
using a non-dynamical strange quark with mass amq = 0.05. The burst is the real world value,
and the cross is the UKQCD quenched value. The smaller error bar on the cross is the statistical
error, and the larger the quoted systematic error.
C. P-wave mesons
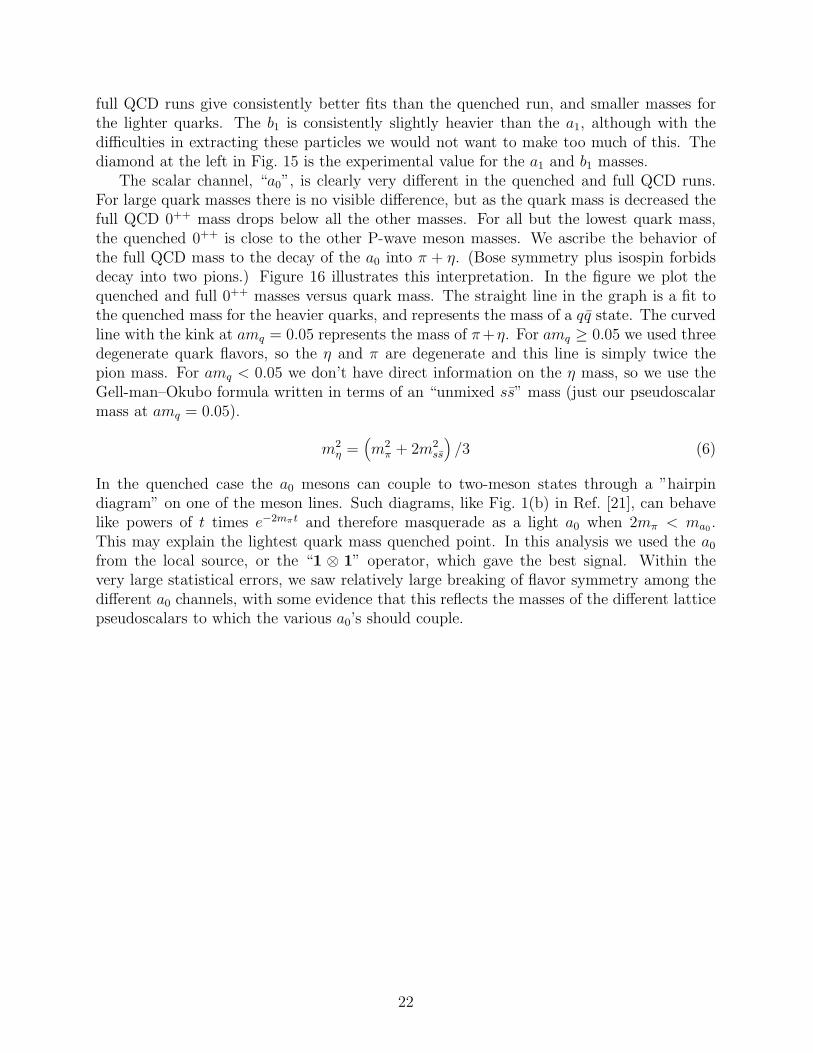
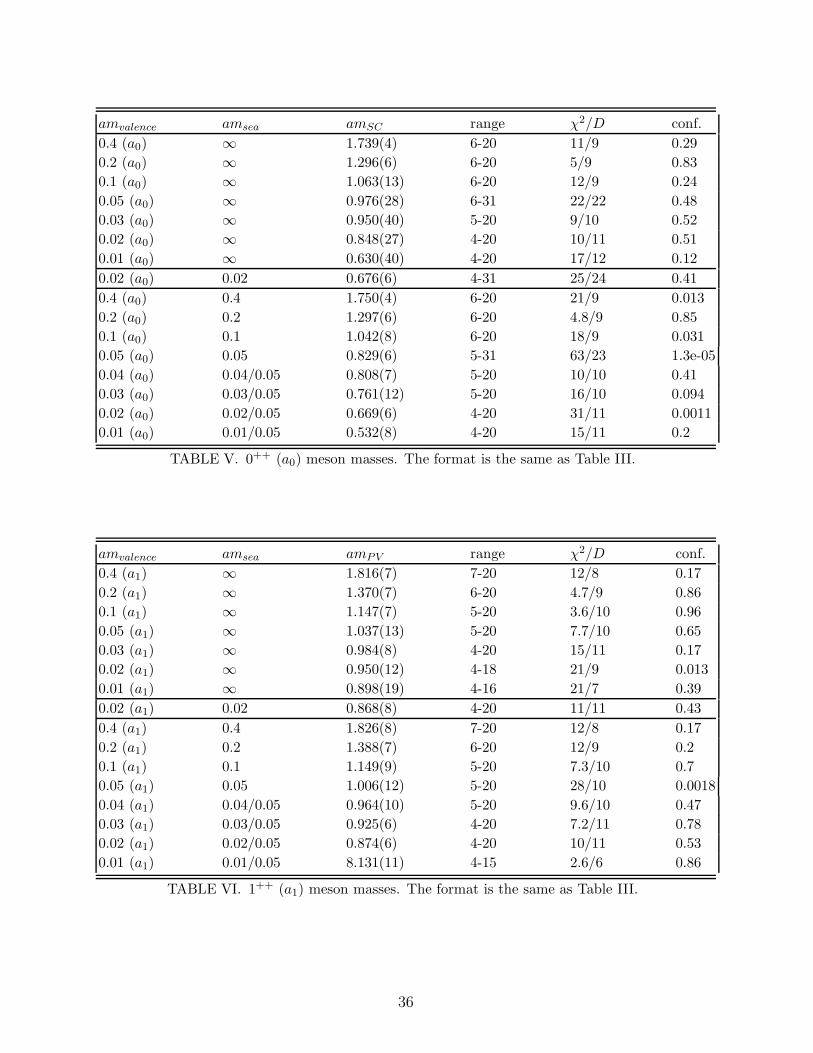
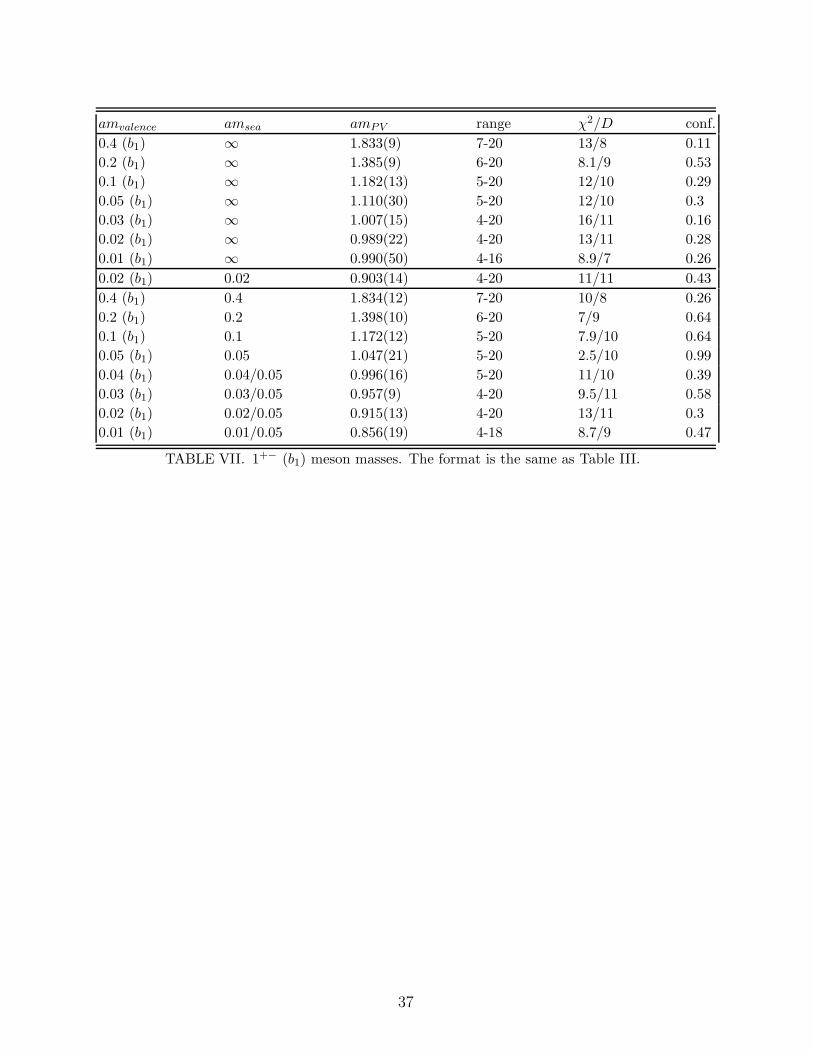
Mesons with quantum numbers JPC = 0++, 1++ and 1+−, which are P-wave mesonsin the nonrelativistic limit, are found as the oscillating “parity partners” of the π and ρpropagators with Kogut-Susskind quarks. Fitting these particles is difficult because of theirlarger mass. In order to get good fits, we need to allow two particles in the non-oscillatingcomponents, since we typically find that the excited “π” or “ρ” state is comparable in massto the lowest oscillating (P-wave) state. Thus we find large errors, and must use smallminimum distances to get good fits. In addition, plateaus in the effective mass are short.Figure 14 illustrates an example of a difficult but crucial case. This figure shows fits tothe scalar (a0) mass as a function of the minimum distance included in the fit. With thesecaveats, selected fits for the P-wave mesons are shown in Fig. 15 and Tables V, VI andVII. This figure and these tables contain several interesting features. For the a1 and b1 the
21
full QCD runs give consistently better fits than the quenched run, and smaller masses forthe lighter quarks. The b1 is consistently slightly heavier than the a1, although with thedifficulties in extracting these particles we would not want to make too much of this. Thediamond at the left in Fig. 15 is the experimental value for the a1 and b1 masses.
The scalar channel, “a0”, is clearly very different in the quenched and full QCD runs.For large quark masses there is no visible difference, but as the quark mass is decreased thefull QCD 0++ mass drops below all the other masses. For all but the lowest quark mass,the quenched 0++ is close to the other P-wave meson masses. We ascribe the behavior ofthe full QCD mass to the decay of the a0 into π + η. (Bose symmetry plus isospin forbidsdecay into two pions.) Figure 16 illustrates this interpretation. In the figure we plot thequenched and full 0++ masses versus quark mass. The straight line in the graph is a fit tothe quenched mass for the heavier quarks, and represents the mass of a qq state. The curvedline with the kink at amq = 0.05 represents the mass of π+η. For amq ≥ 0.05 we used threedegenerate quark flavors, so the η and π are degenerate and this line is simply twice thepion mass. For amq < 0.05 we don’t have direct information on the η mass, so we use theGell-man–Okubo formula written in terms of an “unmixed ss” mass (just our pseudoscalarmass at amq = 0.05).
m2η =
(
m2π + 2m2
ss
)
/3 (6)
In the quenched case the a0 mesons can couple to two-meson states through a ”hairpindiagram” on one of the meson lines. Such diagrams, like Fig. 1(b) in Ref. [21], can behavelike powers of t times e−2mπt and therefore masquerade as a light a0 when 2mπ < ma0
.This may explain the lightest quark mass quenched point. In this analysis we used the a0
from the local source, or the “1 ⊗ 1” operator, which gave the best signal. Within thevery large statistical errors, we saw relatively large breaking of flavor symmetry among thedifferent a0 channels, with some evidence that this reflects the masses of the different latticepseudoscalars to which the various a0’s should couple.
22
FIG. 14. Fitted masses for the scalar (a0) meson with quark mass amu,d = 0.03 as a function
of the minimum distance included in the fit. In this plot the symbol size indicates the confidence
level of the fit, with the symbol size used in the legend corresponding to 50%. Here the octagons
are quenched results using two 0−+ (pion) states and one 0++ (a0) state, while the bursts are
quenched results with one state of each parity. The squares and diamonds are 2+1 flavor results
using two and one 0−+ states respectively.
23
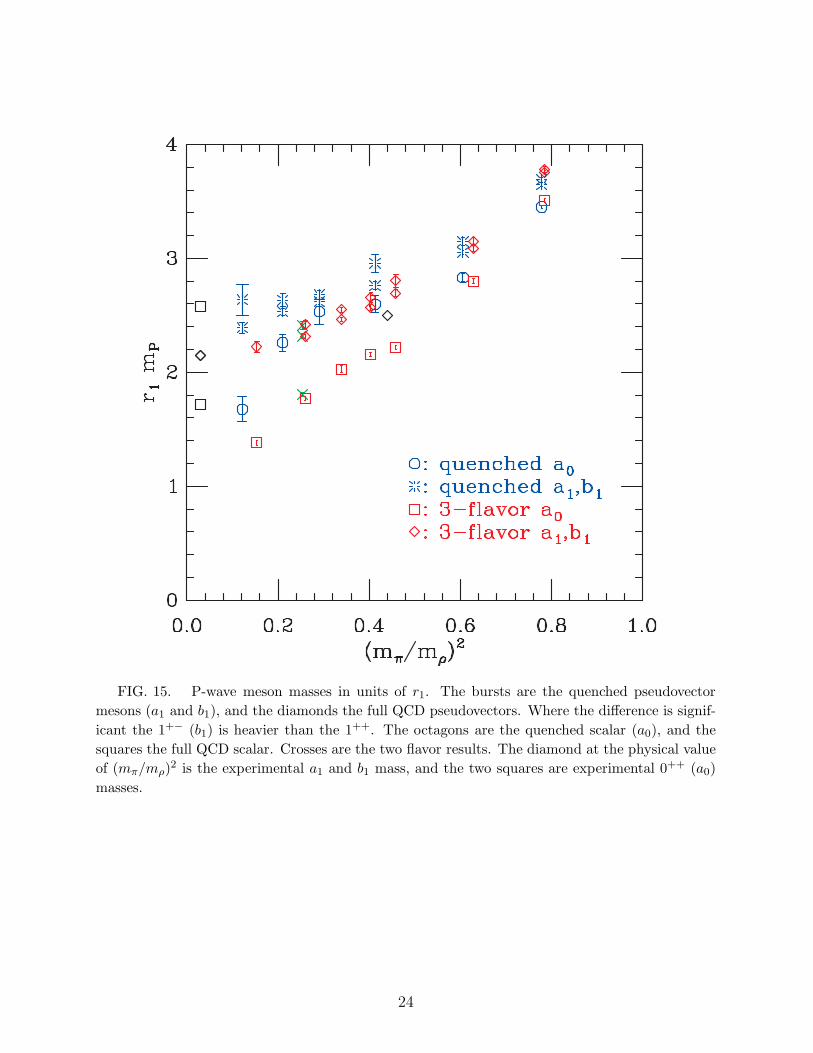
FIG. 15. P-wave meson masses in units of r1. The bursts are the quenched pseudovector
mesons (a1 and b1), and the diamonds the full QCD pseudovectors. Where the difference is signif-
icant the 1+− (b1) is heavier than the 1++. The octagons are the quenched scalar (a0), and the
squares the full QCD scalar. Crosses are the two flavor results. The diamond at the physical value
of (mπ/mρ)2 is the experimental a1 and b1 mass, and the two squares are experimental 0++ (a0)
masses.
24
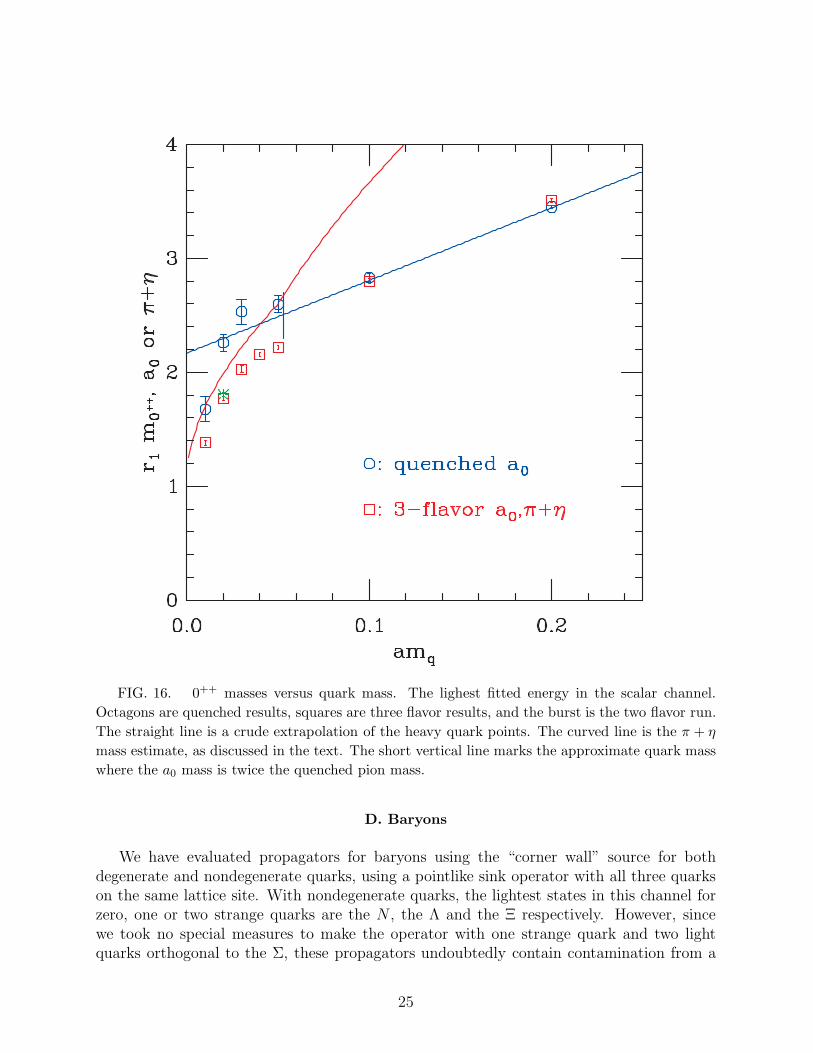
FIG. 16. 0++ masses versus quark mass. The lighest fitted energy in the scalar channel.
Octagons are quenched results, squares are three flavor results, and the burst is the two flavor run.
The straight line is a crude extrapolation of the heavy quark points. The curved line is the π + η
mass estimate, as discussed in the text. The short vertical line marks the approximate quark mass
where the a0 mass is twice the quenched pion mass.
D. Baryons
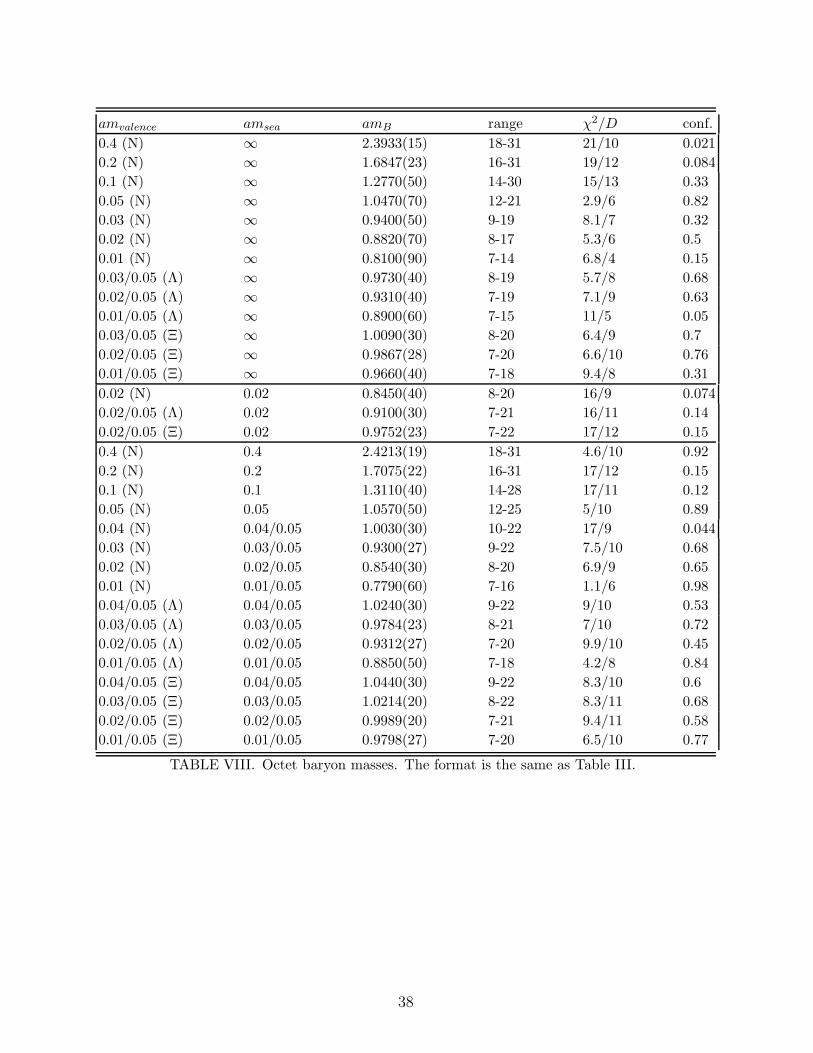
We have evaluated propagators for baryons using the “corner wall” source for bothdegenerate and nondegenerate quarks, using a pointlike sink operator with all three quarkson the same lattice site. With nondegenerate quarks, the lightest states in this channel forzero, one or two strange quarks are the N , the Λ and the Ξ respectively. However, sincewe took no special measures to make the operator with one strange quark and two lightquarks orthogonal to the Σ, these propagators undoubtedly contain contamination from a
25
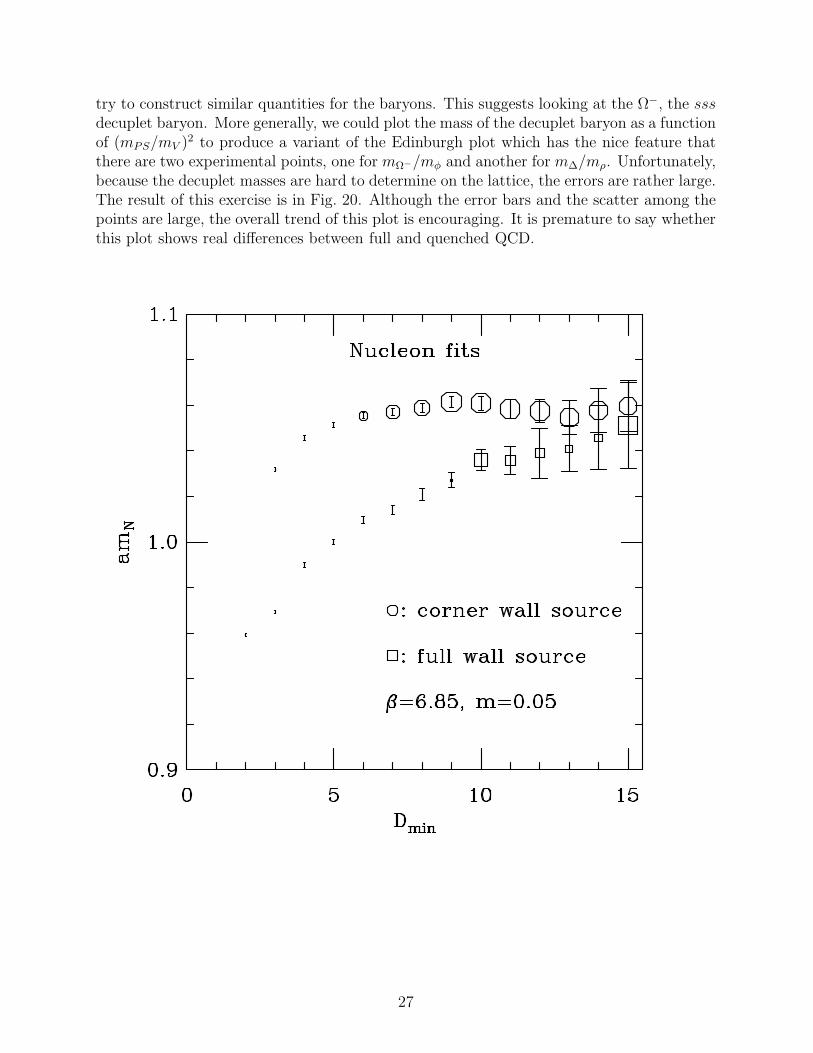
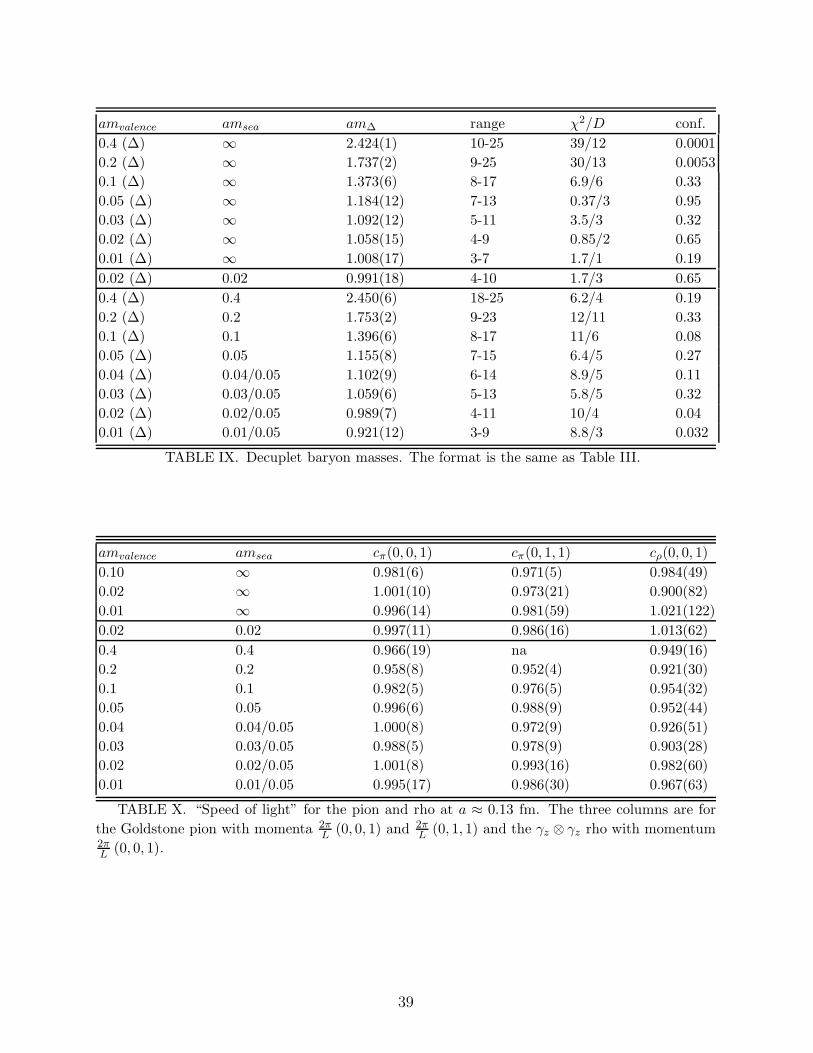
nearby Σ. In order to get the decuplet baryons, we followed Ref. [12], using a wall sourceon every spatial site, and using the operator in Eq. 6.3 of Ref. [22] for the ∆. This isnecessary because the corner wall source does not overlap this ∆ operator. As a byproductof the calculation of the decuplet mass, we obtain nucleon propagators from even site wallsources and a wall source containing all sites. These propagators are generally noisier thanthe corner wall source propagators, and the plateau in the effective mass occurs at largerdistances. Therefore we generally use the corner source propagators. However, if one usesour fitting procedures on the even-wall or full-wall propagators, one invariably selects asmaller mass than from the corner-wall source propagators. This situation is illustrated byFig. 17, which show mass fits to these two propagators as a function of the minimum distanceincluded in the fit. In this figure the corner source propagators reach a plateau earlier andwith smaller error bars. However, there are perfectly acceptable fits to the full wall sourcepropagators giving masses significantly smaller than the corner source values. Perhaps theonly good thing we can say about this situation is that the effect is similar in the quenchedand dynamical runs, so as long as we are careful to make the same choices in both cases, wecan investigate the effects of sea quarks on the spectrum while taking the statistical errorsat face value. The results of the fits that we selected are listed in Tables VIII and IX.
The nucleon to rho mass ratio, or “Edinburgh plot”, has long been used as a way ofdisplaying lattice spectrum results. This ratio is known to be sensitive to lattice spacing,lattice volume and quark masses. As mentioned above, we do not address the issues ofcontinuum extrapolation and chiral extrapolation in this paper. However, since our quenchedand dynamical lattices are matched in lattice spacing and physical size, we are well positionedto ask if effects of dynamical quarks show up in this ratio. In Fig. 18 we show a variant ofthe Edinburgh plot, the “APE plot”, where (mπ/mρ)
2 is used as the abscissa, so that forsmall quark masses the abscissa is proportional to the quark mass. Most of the points onthis plot are from the a ≈ 0.13 fm matched lattice runs. It can be seen that there are nosignificant differences between the quenched and three flavor runs. The single two flavorpoint lies slightly above the trend, although this is probably not significant. This agreementbetween mN/mρ for quenched and full QCD is in apparent conflict with our extrapolationsof the conventional action [23]. The discrepancy, which may be due to residual discretizationeffects in one or both calculations, is under study. We are hopeful that currently runningthree flavor simulations at finer lattice spacing will shed new light here. Figure 18 alsocontains a point from a coarser lattice three flavor run and a preliminary point from a finerlattice quenched run (10/g2 = 8.4, 283 × 96 lattice, a ≈ 0.09 fm) These two points suggestthat when we are in a position to do a continuum extrapolation the continuum results willbe lower.
It is interesting to compare these results to the conventional Kogut-Susskind quark ac-tion. Figure 19 shows the improved action results together with conventional action resultsat 6/g2 = 5.7, 5.85. 6.15 [24] and 6.5 [25], which correspond to lattice spacings of about0.16, 0.12, 0.07 and 0.043 fm respectively. While a continuum extrapolation will be deferreduntil the 0.1 fm runs are completed, we can see in this plot that the improved action at 0.13fm gives results similar to the conventional action at a = 0.07 fm.
Just as for the mesons, one of the biggest problems in comparing baryon masses to thereal world is the need for an extrapolation in quark mass. For the mesons the quantity J hasthe nice feature that it is only minimally sensitive to this extrapolation. It is tempting to
26
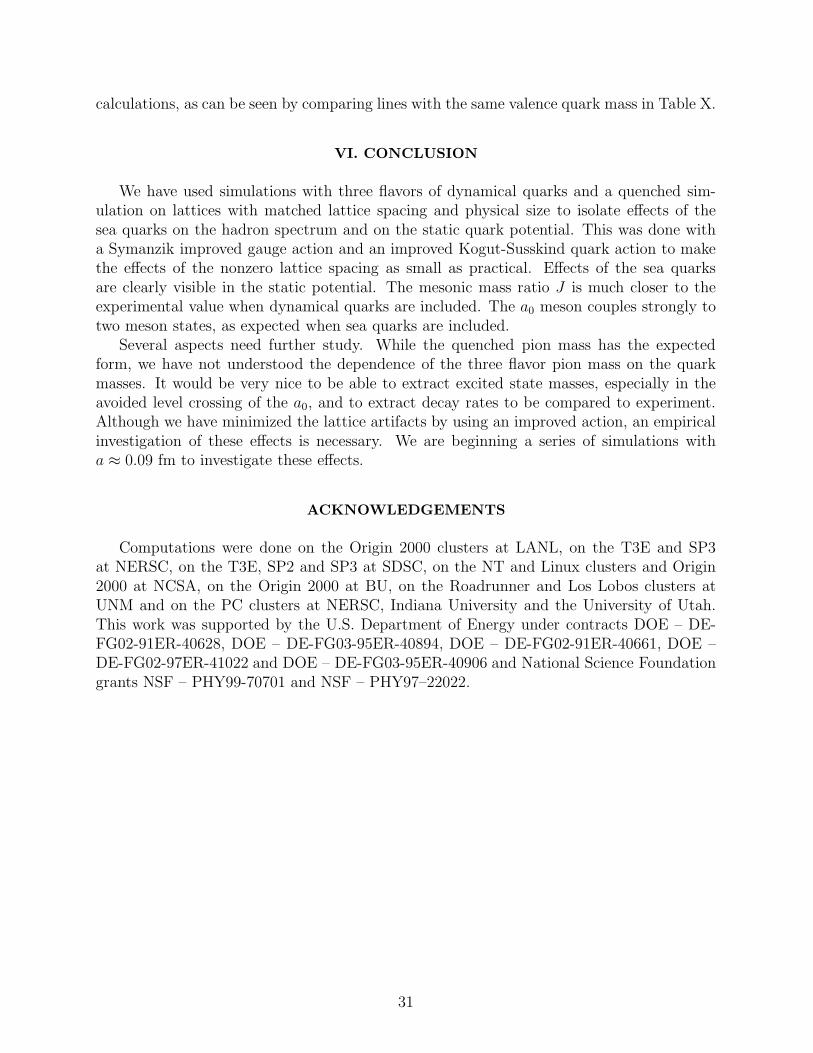
try to construct similar quantities for the baryons. This suggests looking at the Ω−, the sssdecuplet baryon. More generally, we could plot the mass of the decuplet baryon as a functionof (mPS/mV )2 to produce a variant of the Edinburgh plot which has the nice feature thatthere are two experimental points, one for mΩ−/mφ and another for m∆/mρ. Unfortunately,because the decuplet masses are hard to determine on the lattice, the errors are rather large.The result of this exercise is in Fig. 20. Although the error bars and the scatter among thepoints are large, the overall trend of this plot is encouraging. It is premature to say whetherthis plot shows real differences between full and quenched QCD.
27
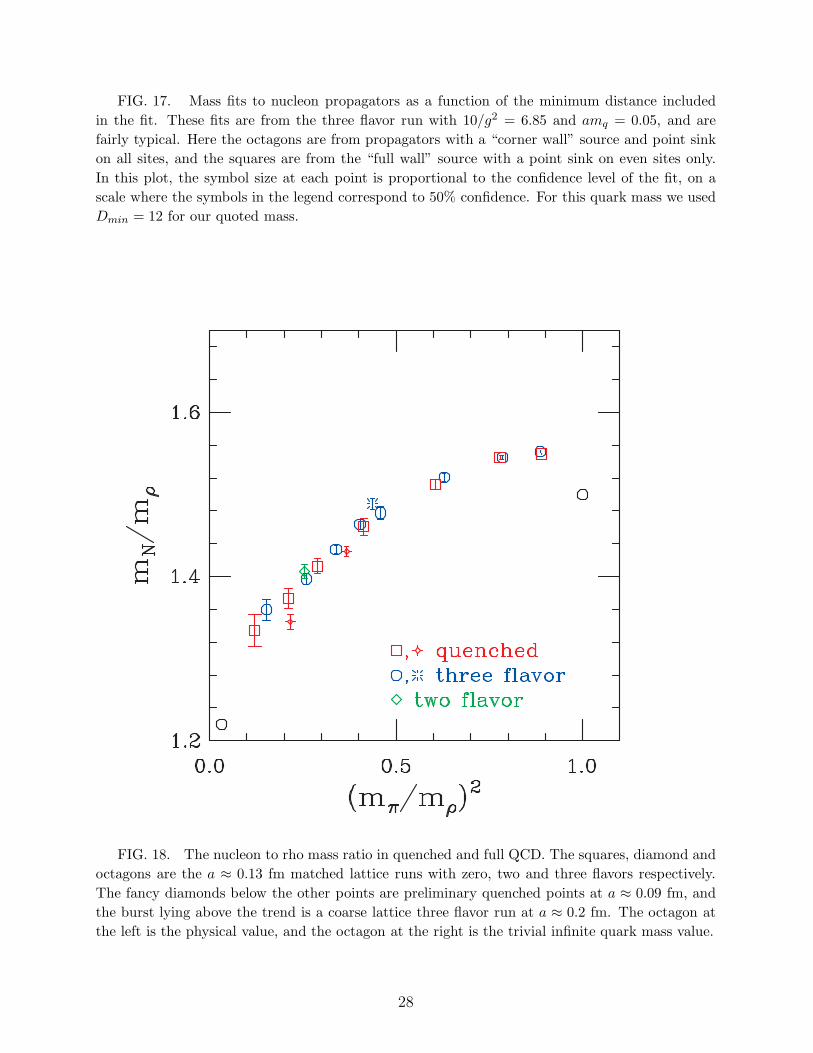
FIG. 17. Mass fits to nucleon propagators as a function of the minimum distance included
in the fit. These fits are from the three flavor run with 10/g2 = 6.85 and amq = 0.05, and are
fairly typical. Here the octagons are from propagators with a “corner wall” source and point sink
on all sites, and the squares are from the “full wall” source with a point sink on even sites only.
In this plot, the symbol size at each point is proportional to the confidence level of the fit, on a
scale where the symbols in the legend correspond to 50% confidence. For this quark mass we used
Dmin = 12 for our quoted mass.
FIG. 18. The nucleon to rho mass ratio in quenched and full QCD. The squares, diamond and
octagons are the a ≈ 0.13 fm matched lattice runs with zero, two and three flavors respectively.
The fancy diamonds below the other points are preliminary quenched points at a ≈ 0.09 fm, and
the burst lying above the trend is a coarse lattice three flavor run at a ≈ 0.2 fm. The octagon at
the left is the physical value, and the octagon at the right is the trivial infinite quark mass value.
28
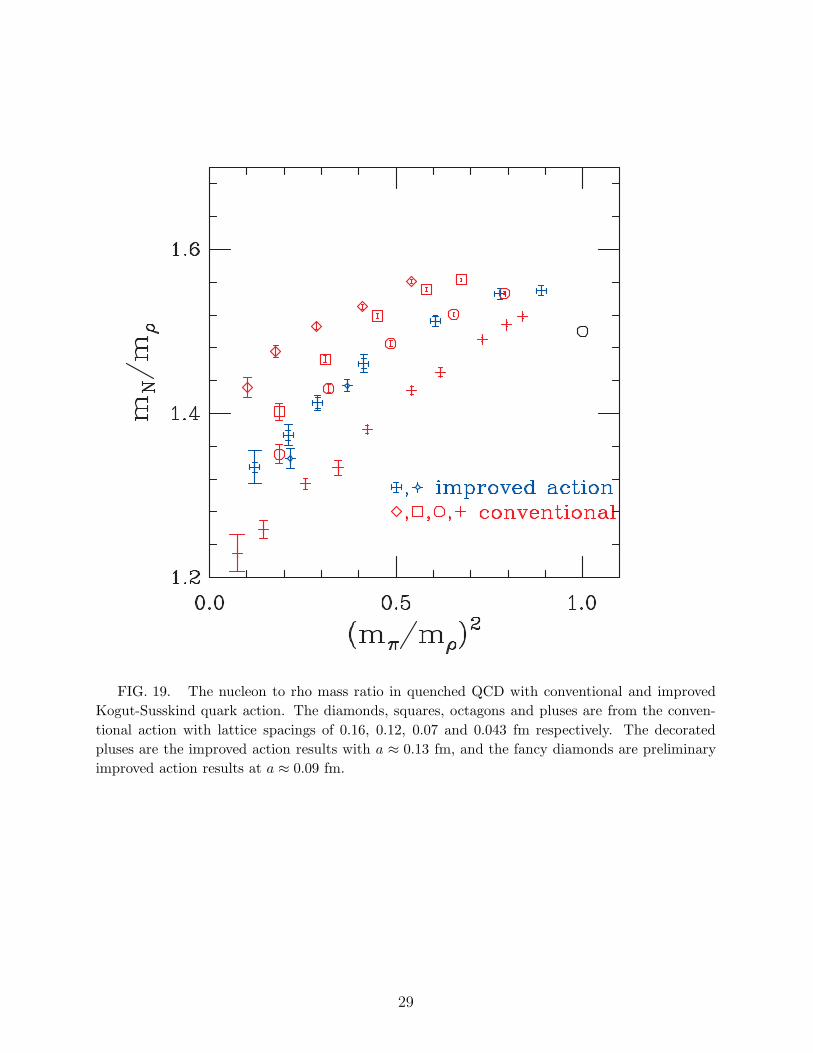
FIG. 19. The nucleon to rho mass ratio in quenched QCD with conventional and improved
Kogut-Susskind quark action. The diamonds, squares, octagons and pluses are from the conven-
tional action with lattice spacings of 0.16, 0.12, 0.07 and 0.043 fm respectively. The decorated
pluses are the improved action results with a ≈ 0.13 fm, and the fancy diamonds are preliminary
improved action results at a ≈ 0.09 fm.
29
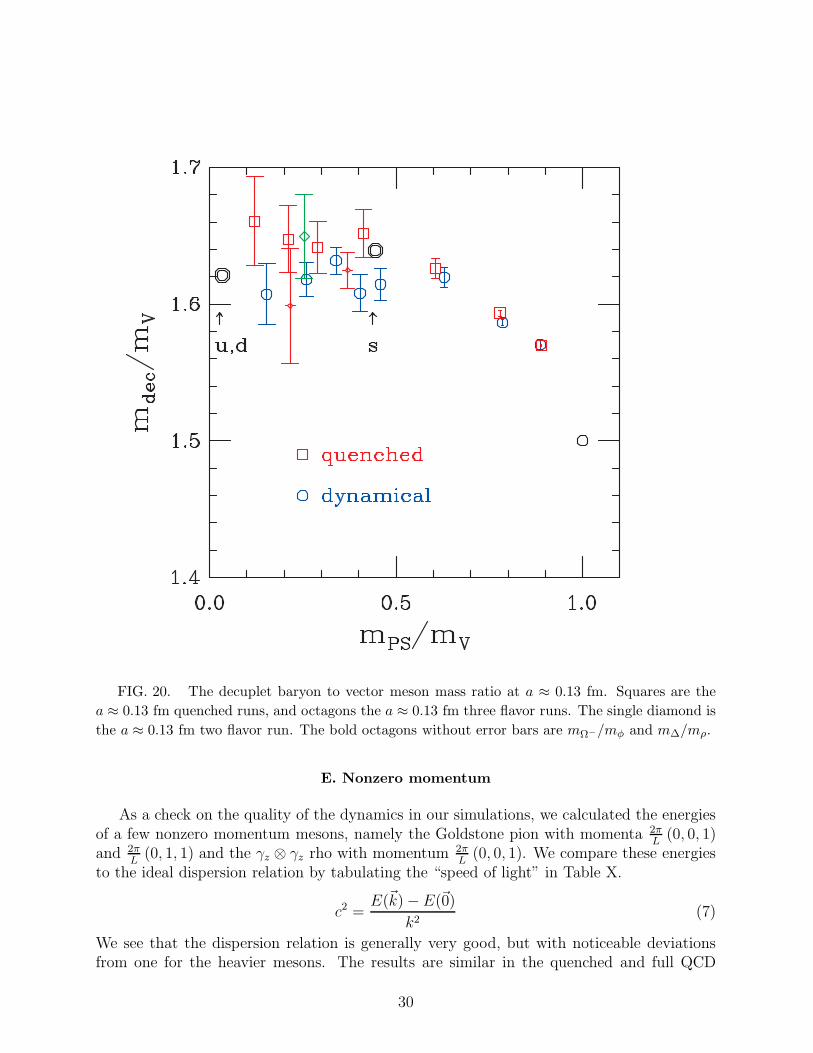
FIG. 20. The decuplet baryon to vector meson mass ratio at a ≈ 0.13 fm. Squares are the
a ≈ 0.13 fm quenched runs, and octagons the a ≈ 0.13 fm three flavor runs. The single diamond is
the a ≈ 0.13 fm two flavor run. The bold octagons without error bars are mΩ−/mφ and m∆/mρ.
E. Nonzero momentum
As a check on the quality of the dynamics in our simulations, we calculated the energiesof a few nonzero momentum mesons, namely the Goldstone pion with momenta 2π
L(0, 0, 1)
and 2πL
(0, 1, 1) and the γz ⊗ γz rho with momentum 2πL
(0, 0, 1). We compare these energiesto the ideal dispersion relation by tabulating the “speed of light” in Table X.
c2 =E(~k) −E(~0)
k2(7)
We see that the dispersion relation is generally very good, but with noticeable deviationsfrom one for the heavier mesons. The results are similar in the quenched and full QCD
30
calculations, as can be seen by comparing lines with the same valence quark mass in Table X.
VI. CONCLUSION
We have used simulations with three flavors of dynamical quarks and a quenched sim-ulation on lattices with matched lattice spacing and physical size to isolate effects of thesea quarks on the hadron spectrum and on the static quark potential. This was done witha Symanzik improved gauge action and an improved Kogut-Susskind quark action to makethe effects of the nonzero lattice spacing as small as practical. Effects of the sea quarksare clearly visible in the static potential. The mesonic mass ratio J is much closer to theexperimental value when dynamical quarks are included. The a0 meson couples strongly totwo meson states, as expected when sea quarks are included.
Several aspects need further study. While the quenched pion mass has the expectedform, we have not understood the dependence of the three flavor pion mass on the quarkmasses. It would be very nice to be able to extract excited state masses, especially in theavoided level crossing of the a0, and to extract decay rates to be compared to experiment.Although we have minimized the lattice artifacts by using an improved action, an empiricalinvestigation of these effects is necessary. We are beginning a series of simulations witha ≈ 0.09 fm to investigate these effects.
ACKNOWLEDGEMENTS
Computations were done on the Origin 2000 clusters at LANL, on the T3E and SP3at NERSC, on the T3E, SP2 and SP3 at SDSC, on the NT and Linux clusters and Origin2000 at NCSA, on the Origin 2000 at BU, on the Roadrunner and Los Lobos clusters atUNM and on the PC clusters at NERSC, Indiana University and the University of Utah.This work was supported by the U.S. Department of Energy under contracts DOE – DE-FG02-91ER-40628, DOE – DE-FG03-95ER-40894, DOE – DE-FG02-91ER-40661, DOE –DE-FG02-97ER-41022 and DOE – DE-FG03-95ER-40906 and National Science Foundationgrants NSF – PHY99-70701 and NSF – PHY97–22022.
31
REFERENCES
[1] The MILC Collaboration: C. Bernard et al., Phys. Rev. D 58 (1998) 014503; The MILCCollaboration: T. Blum et al., Phys. Rev. D 55, 1133 (1997); G.P. Lepage, Nucl. Phys.(Proc. Suppl.) 60A, 267 (1998); K. Orginos and D. Toussaint, Phys. Rev. D 59 (1999)014501; Nucl. Phys. B (Proc. Suppl.) 73, 909 (1999); J.F. Lagae and D.K. Sinclair,Nucl. Phys. (Proc. Suppl.) 63, 892 (1998); Phys. Rev. D 59 (1999) 014511; K. Orginos,D. Toussaint and R.L. Sugar, Phys. Rev. D 60 (1999) 054503; Nucl. Phys. B (Proc.Suppl.) 83-84, 878 (2000); G.P. Lepage, Phys. Rev. D 59 (1999) 074501.
[2] K. Symanzik, in “Recent Developments in Gauge Theories”, eds. G. ’t Hooft et al., 313(Plenum, New York, 1980); Nucl. Phys. B226 187 (1983); M. Luscher and P. Weisz,Comm. Math. Phys. 97 19 (1985); Phys. Lett. 158B 250 (1985); G. P. Lepage and P.B. Mackenzie, Phys. Rev. D48 2250 (1993); M. Alford, W. Dimm, G.P. Lepage, G.Hockney and P.B. Mackenzie, Phys. Lett. 361B 87 (1995).
[3] The MILC collaboration: C. Bernard et al., Phys. Rev. D 61, 111502 (2000).[4] P. Lacock and C. Michael, Phys. Rev. D 52 5213 (1995).[5] K. Kanaya, hep-lat/0009263, Talk presented at the XXXth International Conference on
High Energy Physics (ICHEP 2000), July 27-August 2, 2000, Osaka, Japan; CP-PACScollaboration: A. Ali Khan et al., hep-lat/0010078, to appear in Nucl. Phys. B (Proc.Suppl.).
[6] JLQCD collaboration: A. Aoki et al., hep-lat/0010086, to appear in Nucl. Phys. B(Proc. Suppl.).
[7] S. Gottlieb et al., Phys. Rev. D 35, 2531 (1987).[8] S. Aoki, Nucl. Phys. B (Proc. Suppl.) 94, 3 (2001).[9] The MILC Collaboration: C. Bernard et al., Phys. Rev. D 62, 034503 (2000).
[10] R. Sommer, Nucl. Phys. B411, 839 (1994).[11] UKQCD Collaboration, S.P. Booth et al., Phys. Lett. B294, 385 (1992).[12] R. Gupta, G. Guralnik, C. Kilcup and S. Sharpe, Phys. Rev. D 43, 2003 (1991).[13] M.F.L. Golterman and J. Smit, Nucl. Phys. B255 328 (1985); M.F.L. Golterman, Nucl.
Phys. B273, 663 (1986).[14] W. Lee and S. Sharpe, Phys. Rev. D 60 (1999) 114503.[15] CP-PACS collaboration: T. Manke et al., Phys. Rev. D 62 (2000) 114508.[16] C. Bernard and M. Golterman, Phys. Rev. D bf 46, 853 (1992).[17] S.R. Sharpe , Phys. Rev. D bf 46, 3146 (1992).[18] S.Aoki et al., Phys.Rev.Lett. 84, 238 (2000).[19] W. Bardeen et al., Phys.Rev. D 62, 114505 (200).[20] J. Gasser and H. Leutwyler, Nucl. Phys. B250, 465 (1985).[21] C. Bernard and M. Golterman, Phys. Rev. D 53, 476 (1996).[22] M.F.L. Golterman and J. Smit, Nucl. Phys. B255, 328 (1985).[23] The MILC Collaboration: C. Bernard et al., Nucl. Phys. B (Proc. Suppl.) 73, 198
(1999); Phys. Rev. Lett. 81, 3087 (1998).[24] The MILC Collaboration: C. Bernard et al., Nucl. Phys. B (Proc. Suppl.) 60A, 3 (1998)[25] S. Kim and S. Ohta, Phys. Rev. D 61 (2000) 074506.
32
TABLES
amu,d / ams 10/g2 u0 res. ǫ lats. a/r1quenched 8.00 0.8879 na na 408 0.3762(8)
0.02 / na 7.20 0.8755 1 × 10⁻⁴ 0.013 370 0.3745(14)
0.40 / 0.40 7.35 0.8822 2 × 10⁻⁵ 0.03 332 0.3766(10)
0.20 / 0.20 7.15 0.8787 5 × 10⁻⁵ 0.03 341 0.3707(10)
0.10 / 0.10 6.96 0.8739 5 × 10⁻⁵ 0.03 339 0.3730(14)
0.05 / 0.05 6.85 0.8707 1 × 10⁻⁴ 0.02 425 0.3742(15)
0.04 / 0.05 6.83 0.8702 5 × 10⁻⁵ 0.02 351 0.3765(14)
0.03 / 0.05 6.81 0.8696 5 × 10⁻⁵ 0.02 564 0.3775(12)
0.02 / 0.05 6.79 0.8688 1 × 10⁻⁴ 0.0133 484 0.3775(12)
0.01 / 0.05 6.76 0.8677 1 × 10⁻⁴ 0.00667 407 0.3852(14)
TABLE I. Parameters of the a = 0.13 fm simulations
0.01 0.02 0.03 0.04 0.05 0.1 0.2 0.4
H fit
π 1,0 18 18 18 18 18 18 18 18
K 1,0 14 14 14 14
ss 1,0 14 14 14 14
a0 2,1 4 4 5 5 6 6 6 6
ρ 1,1 6 7 8 9 9 10 12 14
K∗ 1,1 8 8 9 9
φ 1,1 8 8 9 9
a1 2,1 4 4 4 5 5 5 6 7
b1 2,1 4 4 4 5 5 5 6 7
N 1,1 7 8 9 10 12 14 16 18
Λ 1,1 7 7 8 9
Ξ 1,1 7 7 8 9
∆ 1,1 3 4 5 6 7 8 9 10
TABLE II. Minimum distances used in propagator fits. With the exception of the ∆, these
hadrons are obtained from the “corner” source. The top row is the light quark mass. The second
column shows the type of fit used, where the two numbers are the number of simple exponentials
included and the number of oscillating contributions included. For example, a fit of type “2,1”
would include two particles with one parity and one particle with the opposite parity. Hadrons
with nondegenerate valence quarks, such as the K, were computed only for mu,d < ms.
33
amvalence amsea amPS range χ2/D conf.
0.4 (π) ∞ 1.45664(12) 18-31 13/12 0.39
0.2 (π) ∞ 0.96166(16) 18-31 14/12 0.32
0.1 (π) ∞ 0.65693(19) 18-31 14/12 0.28
0.05 (π) ∞ 0.46043(20) 18-31 15/12 0.25
0.03 (π) ∞ 0.35825(16) 18-31 21/12 0.05
0.02 (π) ∞ 0.29440(17) 18-31 23/12 0.026
0.01 (π) ∞ 0.21104(16) 18-31 26/12 0.01
0.03/0.05 (K) ∞ 0.41261(19) 14-31 26/16 0.06
0.02/0.05 (K) ∞ 0.38650(20) 14-31 25/16 0.07
0.01/0.05 (K) ∞ 0.35852(23) 14-31 23/16 0.13
0.02 (π) 0.02 0.30258(22) 18-31 9.4/12 0.67
0.02/0.05 (K) 0.02 0.39823(25) 14-31 33/16 0.0076
0.05 (ss) 0.02 0.47623(25) 14-31 27/16 0.047
0.4 (π) 0.4 1.46932(17) 18-31 5.3/12 0.95
0.2 (π) 0.2 0.97930(25) 18-31 8.3/12 0.76
0.1 (π) 0.1 0.68332(24) 18-31 16/12 0.17
0.05 (π) 0.05 0.48422(21) 18-31 26/12 0.011
0.04 (π) 0.04/0.05 0.43507(27) 18-31 14/12 0.31
0.03 (π) 0.03/0.05 0.37787(18) 18-31 15/12 0.25
0.02 (π) 0.02/0.05 0.31125(16) 18-31 16/12 0.21
0.01 (π) 0.01/0.05 0.22446(22) 18-31 14/12 0.27
0.04/0.05 (K) 0.04/0.05 0.46141(27) 14-31 18/16 0.31
0.03/0.05 (K) 0.03/0.05 0.43613(19) 14-31 26/16 0.052
0.02/0.05 (K) 0.02/0.05 0.40984(21) 14-31 19/16 0.28
0.01/0.05 (K) 0.01/0.05 0.38334(29) 14-31 25/16 0.072
0.05 (ss) 0.04/0.05 0.48659(27) 14-31 18/16 0.35
0.05 (ss) 0.03/0.05 0.48796(18) 14-31 28/16 0.035
0.05 (ss) 0.02/0.05 0.49009(20) 14-31 23/16 0.12
0.05 (ss) 0.01/0.05 0.49443(25) 14-31 19/16 0.26
TABLE III. Pseudoscalar meson masses. Quenched results are first, followed by the single
two-flavor run, followed by the three flavor runs. The first column is the valence quark mass(es),
and the second column the sea quark mass or masses. The particle name in the first column is
intended as a mnemonic. Here “π” indicates valence quark mass equal to the lighter dynamical
quarks, or degenerate in the quenched case. “K” indicates one valence quark equal to the light
dynamical quarks and one at about ms, while “ss” indicates two valence quarks with mass about
ms, in a flavor nonsinglet state. The remaining columns are the hadron mass, the time range for
the chosen fit, χ2 and number of degrees of freedom for the fit, and the confidence level of the fit.
34
amvalence amsea amV range χ2/D conf.
0.4 (ρ) ∞ 1.5446(2) 14-31 18/14 0.19
0.2 (ρ) ∞ 1.0900(5) 12-31 19/16 0.27
0.1 (ρ) ∞ 0.8443(11) 10-28 21/15 0.15
0.05 (ρ) ∞ 0.7168(21) 9-27 10/15 0.8
0.03 (ρ) ∞ 0.6653(26) 8-23 6.9/12 0.86
0.02 (ρ) ∞ 0.6422(30) 7-21 7/11 0.8
0.01 (ρ) ∞ 0.6070(60) 6-16 10/7 0.19
0.03/0.05 (K∗) ∞ 0.6910(30) 9-24 13/12 0.38
0.02/0.05 (K∗) ∞ 0.6820(30) 8-21 10/10 0.42
0.01/0.05 (K∗) ∞ 0.6680(40) 8-21 11/10 0.34
0.02 (ρ) 0.02 0.6009(23) 7-23 17/13 0.2
0.02/0.05 (K∗) 0.02 0.6532(23) 8-27 22/16 0.14
0.05 (φ) 0.02 0.7003(14) 8-29 23/18 0.21
0.4 (ρ) 0.4 1.5602(2) 14-31 12/14 0.64
0.2 (ρ) 0.2 1.1051(7) 12-31 14/16 0.56
0.1 (ρ) 0.1 0.8620(9) 10-31 16/18 0.57
0.05 (ρ) 0.05 0.7154(17) 9-31 11/19 0.91
0.04 (ρ) 0.04/0.05 0.6853(17) 9-28 11/16 0.83
0.03 (ρ) 0.03/0.05 0.6490(14) 8-27 19/16 0.26
0.02 (ρ) 0.02/0.05 0.6113(19) 7-22 13/12 0.38
0.01 (ρ) 0.01/0.05 0.5730(30) 6-18 7.4/9 0.59
0.04/0.05 (K∗) 0.04/0.05 0.7040(22) 9-29 15/17 0.61
0.03/0.05 (K∗) 0.03/0.05 0.6845(18) 9-29 21/17 0.22
0.02/0.05 (K∗) 0.02/0.05 0.6631(19) 8-25 15/14 0.38
0.01/0.05 (K∗) 0.01/0.05 0.6485(28) 8-23 4.7/12 0.97
0.05 (φ) 0.04/0.05 0.7198(19) 9-29 13/17 0.77
0.05 (φ) 0.03/0.05 0.7174(13) 9-29 19/17 0.35
0.05 (φ) 0.02/0.05 0.7152(11) 8-29 21/18 0.28
0.05 (φ) 0.01/0.05 0.7194(11) 8-28 11/17 0.84
TABLE IV. Vector meson masses. The format is the same as Table III.
35
amvalence amsea amSC range χ2/D conf.
0.4 (a0) ∞ 1.739(4) 6-20 11/9 0.29
0.2 (a0) ∞ 1.296(6) 6-20 5/9 0.83
0.1 (a0) ∞ 1.063(13) 6-20 12/9 0.24
0.05 (a0) ∞ 0.976(28) 6-31 22/22 0.48
0.03 (a0) ∞ 0.950(40) 5-20 9/10 0.52
0.02 (a0) ∞ 0.848(27) 4-20 10/11 0.51
0.01 (a0) ∞ 0.630(40) 4-20 17/12 0.12
0.02 (a0) 0.02 0.676(6) 4-31 25/24 0.41
0.4 (a0) 0.4 1.750(4) 6-20 21/9 0.013
0.2 (a0) 0.2 1.297(6) 6-20 4.8/9 0.85
0.1 (a0) 0.1 1.042(8) 6-20 18/9 0.031
0.05 (a0) 0.05 0.829(6) 5-31 63/23 1.3e-05
0.04 (a0) 0.04/0.05 0.808(7) 5-20 10/10 0.41
0.03 (a0) 0.03/0.05 0.761(12) 5-20 16/10 0.094
0.02 (a0) 0.02/0.05 0.669(6) 4-20 31/11 0.0011
0.01 (a0) 0.01/0.05 0.532(8) 4-20 15/11 0.2
TABLE V. 0++ (a0) meson masses. The format is the same as Table III.
amvalence amsea amPV range χ2/D conf.
0.4 (a1) ∞ 1.816(7) 7-20 12/8 0.17
0.2 (a1) ∞ 1.370(7) 6-20 4.7/9 0.86
0.1 (a1) ∞ 1.147(7) 5-20 3.6/10 0.96
0.05 (a1) ∞ 1.037(13) 5-20 7.7/10 0.65
0.03 (a1) ∞ 0.984(8) 4-20 15/11 0.17
0.02 (a1) ∞ 0.950(12) 4-18 21/9 0.013
0.01 (a1) ∞ 0.898(19) 4-16 21/7 0.39
0.02 (a1) 0.02 0.868(8) 4-20 11/11 0.43
0.4 (a1) 0.4 1.826(8) 7-20 12/8 0.17
0.2 (a1) 0.2 1.388(7) 6-20 12/9 0.2
0.1 (a1) 0.1 1.149(9) 5-20 7.3/10 0.7
0.05 (a1) 0.05 1.006(12) 5-20 28/10 0.0018
0.04 (a1) 0.04/0.05 0.964(10) 5-20 9.6/10 0.47
0.03 (a1) 0.03/0.05 0.925(6) 4-20 7.2/11 0.78
0.02 (a1) 0.02/0.05 0.874(6) 4-20 10/11 0.53
0.01 (a1) 0.01/0.05 8.131(11) 4-15 2.6/6 0.86
TABLE VI. 1++ (a1) meson masses. The format is the same as Table III.
36
amvalence amsea amPV range χ2/D conf.
0.4 (b1) ∞ 1.833(9) 7-20 13/8 0.11
0.2 (b1) ∞ 1.385(9) 6-20 8.1/9 0.53
0.1 (b1) ∞ 1.182(13) 5-20 12/10 0.29
0.05 (b1) ∞ 1.110(30) 5-20 12/10 0.3
0.03 (b1) ∞ 1.007(15) 4-20 16/11 0.16
0.02 (b1) ∞ 0.989(22) 4-20 13/11 0.28
0.01 (b1) ∞ 0.990(50) 4-16 8.9/7 0.26
0.02 (b1) 0.02 0.903(14) 4-20 11/11 0.43
0.4 (b1) 0.4 1.834(12) 7-20 10/8 0.26
0.2 (b1) 0.2 1.398(10) 6-20 7/9 0.64
0.1 (b1) 0.1 1.172(12) 5-20 7.9/10 0.64
0.05 (b1) 0.05 1.047(21) 5-20 2.5/10 0.99
0.04 (b1) 0.04/0.05 0.996(16) 5-20 11/10 0.39
0.03 (b1) 0.03/0.05 0.957(9) 4-20 9.5/11 0.58
0.02 (b1) 0.02/0.05 0.915(13) 4-20 13/11 0.3
0.01 (b1) 0.01/0.05 0.856(19) 4-18 8.7/9 0.47
TABLE VII. 1+− (b1) meson masses. The format is the same as Table III.
37
amvalence amsea amB range χ2/D conf.
0.4 (N) ∞ 2.3933(15) 18-31 21/10 0.021
0.2 (N) ∞ 1.6847(23) 16-31 19/12 0.084
0.1 (N) ∞ 1.2770(50) 14-30 15/13 0.33
0.05 (N) ∞ 1.0470(70) 12-21 2.9/6 0.82
0.03 (N) ∞ 0.9400(50) 9-19 8.1/7 0.32
0.02 (N) ∞ 0.8820(70) 8-17 5.3/6 0.5
0.01 (N) ∞ 0.8100(90) 7-14 6.8/4 0.15
0.03/0.05 (Λ) ∞ 0.9730(40) 8-19 5.7/8 0.68
0.02/0.05 (Λ) ∞ 0.9310(40) 7-19 7.1/9 0.63
0.01/0.05 (Λ) ∞ 0.8900(60) 7-15 11/5 0.05
0.03/0.05 (Ξ) ∞ 1.0090(30) 8-20 6.4/9 0.7
0.02/0.05 (Ξ) ∞ 0.9867(28) 7-20 6.6/10 0.76
0.01/0.05 (Ξ) ∞ 0.9660(40) 7-18 9.4/8 0.31
0.02 (N) 0.02 0.8450(40) 8-20 16/9 0.074
0.02/0.05 (Λ) 0.02 0.9100(30) 7-21 16/11 0.14
0.02/0.05 (Ξ) 0.02 0.9752(23) 7-22 17/12 0.15
0.4 (N) 0.4 2.4213(19) 18-31 4.6/10 0.92
0.2 (N) 0.2 1.7075(22) 16-31 17/12 0.15
0.1 (N) 0.1 1.3110(40) 14-28 17/11 0.12
0.05 (N) 0.05 1.0570(50) 12-25 5/10 0.89
0.04 (N) 0.04/0.05 1.0030(30) 10-22 17/9 0.044
0.03 (N) 0.03/0.05 0.9300(27) 9-22 7.5/10 0.68
0.02 (N) 0.02/0.05 0.8540(30) 8-20 6.9/9 0.65
0.01 (N) 0.01/0.05 0.7790(60) 7-16 1.1/6 0.98
0.04/0.05 (Λ) 0.04/0.05 1.0240(30) 9-22 9/10 0.53
0.03/0.05 (Λ) 0.03/0.05 0.9784(23) 8-21 7/10 0.72
0.02/0.05 (Λ) 0.02/0.05 0.9312(27) 7-20 9.9/10 0.45
0.01/0.05 (Λ) 0.01/0.05 0.8850(50) 7-18 4.2/8 0.84
0.04/0.05 (Ξ) 0.04/0.05 1.0440(30) 9-22 8.3/10 0.6
0.03/0.05 (Ξ) 0.03/0.05 1.0214(20) 8-22 8.3/11 0.68
0.02/0.05 (Ξ) 0.02/0.05 0.9989(20) 7-21 9.4/11 0.58
0.01/0.05 (Ξ) 0.01/0.05 0.9798(27) 7-20 6.5/10 0.77
TABLE VIII. Octet baryon masses. The format is the same as Table III.
38
amvalence amsea am∆ range χ2/D conf.
0.4 (∆) ∞ 2.424(1) 10-25 39/12 0.0001
0.2 (∆) ∞ 1.737(2) 9-25 30/13 0.0053
0.1 (∆) ∞ 1.373(6) 8-17 6.9/6 0.33
0.05 (∆) ∞ 1.184(12) 7-13 0.37/3 0.95
0.03 (∆) ∞ 1.092(12) 5-11 3.5/3 0.32
0.02 (∆) ∞ 1.058(15) 4-9 0.85/2 0.65
0.01 (∆) ∞ 1.008(17) 3-7 1.7/1 0.19
0.02 (∆) 0.02 0.991(18) 4-10 1.7/3 0.65
0.4 (∆) 0.4 2.450(6) 18-25 6.2/4 0.19
0.2 (∆) 0.2 1.753(2) 9-23 12/11 0.33
0.1 (∆) 0.1 1.396(6) 8-17 11/6 0.08
0.05 (∆) 0.05 1.155(8) 7-15 6.4/5 0.27
0.04 (∆) 0.04/0.05 1.102(9) 6-14 8.9/5 0.11
0.03 (∆) 0.03/0.05 1.059(6) 5-13 5.8/5 0.32
0.02 (∆) 0.02/0.05 0.989(7) 4-11 10/4 0.04
0.01 (∆) 0.01/0.05 0.921(12) 3-9 8.8/3 0.032
TABLE IX. Decuplet baryon masses. The format is the same as Table III.
amvalence amsea cπ(0, 0, 1) cπ(0, 1, 1) cρ(0, 0, 1)
0.10 ∞ 0.981(6) 0.971(5) 0.984(49)
0.02 ∞ 1.001(10) 0.973(21) 0.900(82)
0.01 ∞ 0.996(14) 0.981(59) 1.021(122)
0.02 0.02 0.997(11) 0.986(16) 1.013(62)
0.4 0.4 0.966(19) na 0.949(16)
0.2 0.2 0.958(8) 0.952(4) 0.921(30)
0.1 0.1 0.982(5) 0.976(5) 0.954(32)
0.05 0.05 0.996(6) 0.988(9) 0.952(44)
0.04 0.04/0.05 1.000(8) 0.972(9) 0.926(51)
0.03 0.03/0.05 0.988(5) 0.978(9) 0.903(28)
0.02 0.02/0.05 1.001(8) 0.993(16) 0.982(60)
0.01 0.01/0.05 0.995(17) 0.986(30) 0.967(63)
TABLE X. “Speed of light” for the pion and rho at a ≈ 0.13 fm. The three columns are for
the Goldstone pion with momenta 2πL
(0, 0, 1) and 2πL
(0, 1, 1) and the γz ⊗ γz rho with momentum2πL
(0, 0, 1).
39
Related Documents