QCD Phase Diagram in Polyakov-NJL Model Wei-jie Fu ITP, Chinese Academy of S cience August 11, 2009 kshop on RHIC Physics and CSR Physics at Weihai

QCD Phase Diagram in Polyakov-NJL Model
Dec 30, 2015
Workshop on RHIC Physics and CSR Physics at Weihai. QCD Phase Diagram in Polyakov-NJL Model. Wei-jie Fu ITP, Chinese Academy of Science August 11, 2009. Outline. Introduction The PNJL Model Numerical Results Inhomogeneous Phases Summary. Introduction. - PowerPoint PPT Presentation
Welcome message from author
This document is posted to help you gain knowledge. Please leave a comment to let me know what you think about it! Share it to your friends and learn new things together.
Transcript

QCD Phase Diagram in Polyakov-NJL Model
Wei-jie Fu
ITP, Chinese Academy of Science
August 11, 2009
Workshop on RHIC Physics and CSR Physics at Weihai

Outline
Introduction The PNJL Model Numerical Results Inhomogeneous Phases Summary

Introduction
A semiquantitative QCD phase diagram
In term of temperature and density (chemical potential)
Experiments and observations: RHIC (temperature), Compact stars (density).
The Frontiers of Nuclear Science, A Long Range Plan 2007

QCD critical point
Phenomenological Models
Lattice Simulations
1. Reweighting2. Imaginary ch
emical potential
3.Taylor expansion
4…….
M. A. Stephanov, PoS, LAT2006, 024, 2006

An example: Taylor Expansion
C. R. Allton et al., PRD. 71, 054508, 2005

Does the QCD critical point really exist?
O. Philipsen, arXiv: 0808.0672, 2008

The PNJL Model
The 2+1 flavor NJL model with a Polyakov-loop is given by
where
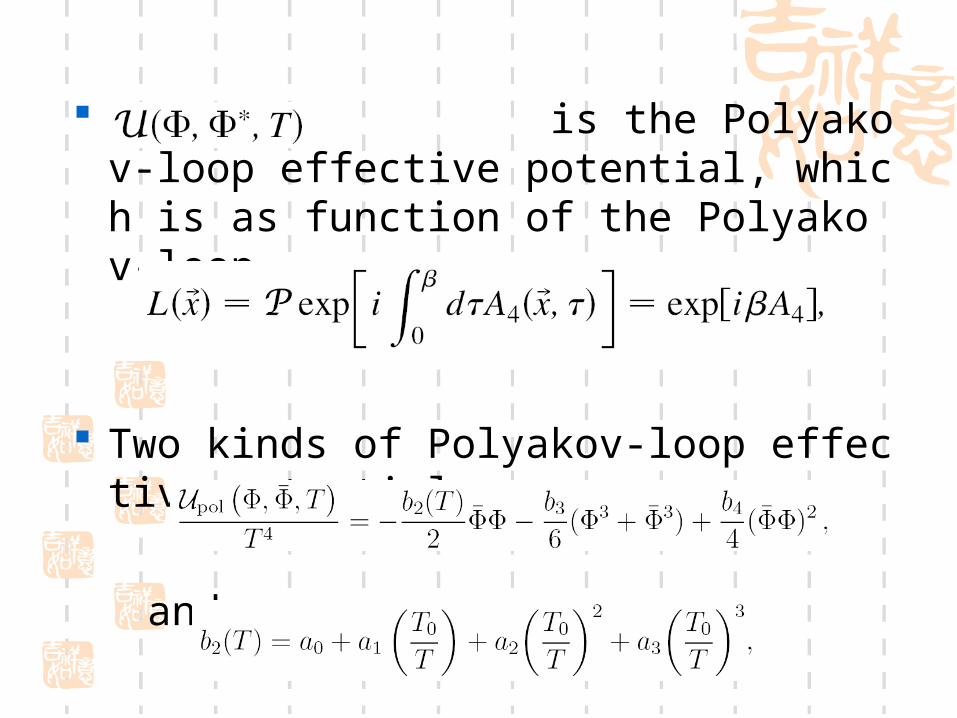
is the Polyakov-loop effective potential, which is as function of the Polyakov-loop
Two kinds of Polyakov-loop effective potential
and

The other is
and
The Polyakov-loop effective potential as function of the real part and the imaginary part of the Polyakov-loop at two values of the temperature:

H. Hansen, et al., PRD. 75, 065004, 2007

Phase Transition at Finite Temperature

Phase Transition at Finite Temperature and Nonzero Chemical Potential

Phase Diagram (Effects of Flavor-mixing and Quark Current Mass)
Wei-jie Fu, Zhao Zhang, Yu-xin Liu., PRD. 77, 014006, 2008
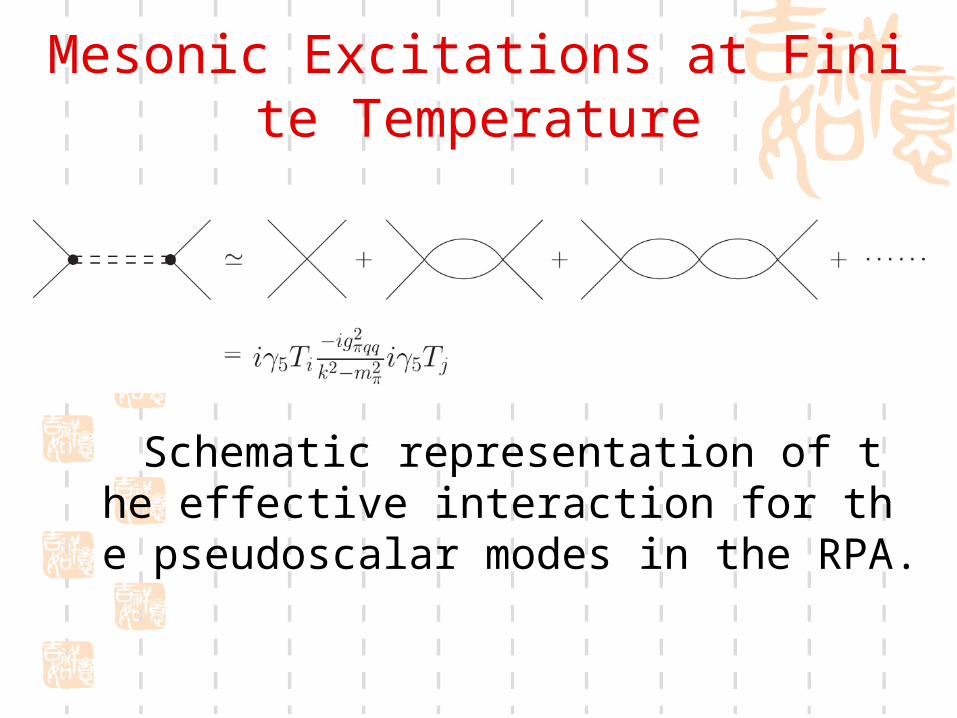
Mesonic Excitations at Finite Temperature
Schematic representation of the effective interaction for the pseudoscalar modes in the RPA.

The pseudoscalar polarization function is
and the scalar polarization function is

Goldberger-Treiman( GT) relation on the quark level at finite temperature:
Gell-Mann--Oakes--Renner ( GOR) relation at finite temperature:
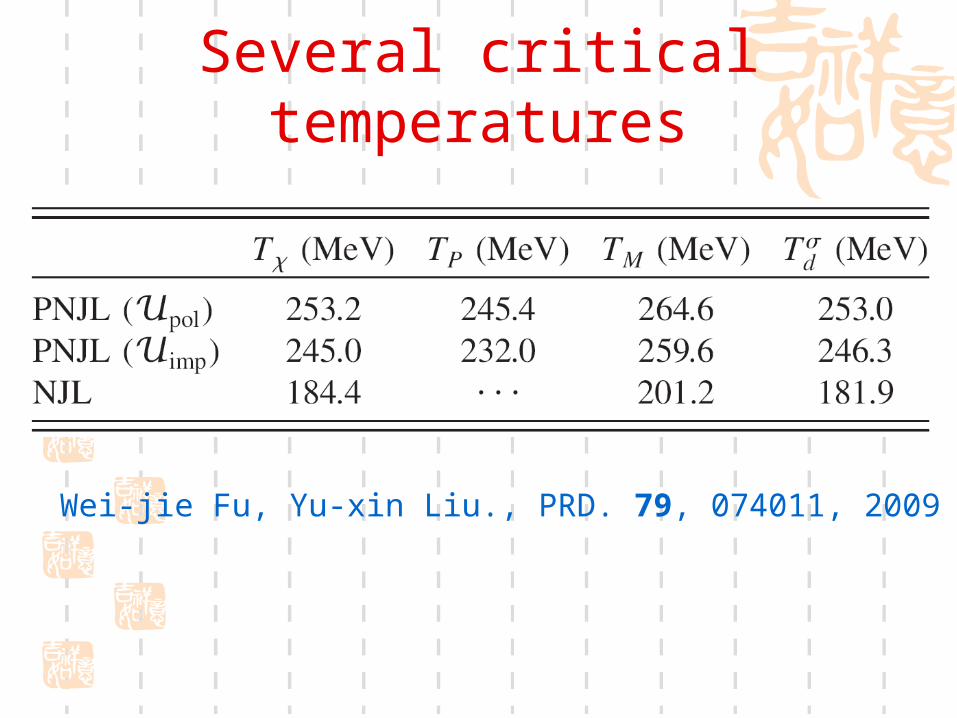
Several critical temperatures
Wei-jie Fu, Yu-xin Liu., PRD. 79, 074011, 2009
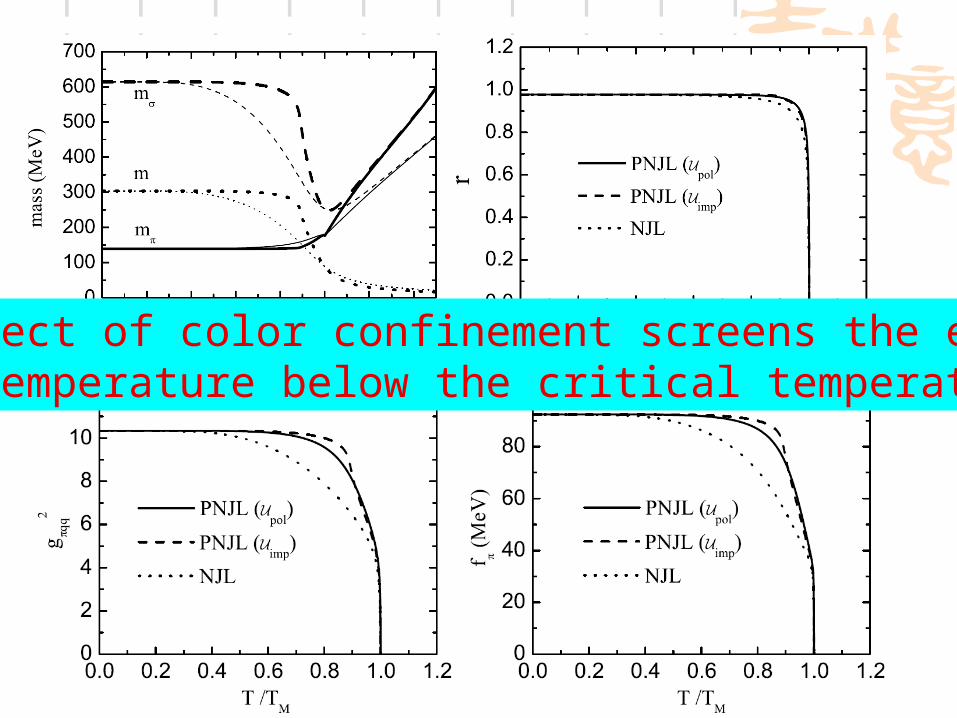
The effect of color confinement screens the effect of temperature below the critical temperature

Scattering Lengths

Wei-jie Fu, Yu-xin Liu., PRD. 79, 074011, 2009

P. Deb et al., PRC 79,055208, 2009

P. Deb et al., PRC 79,055208, 2009

Inhomogeneous Phases
D. Nickel, arXiv: 0906.5295, 2009

Ginzburg-Landau Expansion

D. Nickel, arXiv: 0902.1778, 2009

Summary
The QCD phase diagram is calculated in the 2+1 flavor PNJL model. We have also investigated the dependence of the location of the QCD critical point on the strength of the ’t Hooft flavor-mixing interaction and the current mass of strange quarks.
Mesonic excitations is studied in the PNJL model. We find that the effect of color confinement screens the effect of temperature below the critical temperature.
Could the Polyakov dynamics affect the inhomogeneous phases, and how?
Thank you !
Related Documents