CURRENT TRENDS IN PHARMACEUTICAL ANALYSIS :QBD & PAT 1 Sunil N Patil Research Associate Ipca Lab, Mumbai

Welcome message from author
This document is posted to help you gain knowledge. Please leave a comment to let me know what you think about it! Share it to your friends and learn new things together.
Transcript

1
CURRENT TRENDS IN PHARMACEUTICAL ANALYSIS :QBD & PAT
Sunil N PatilResearch AssociateIpca Lab, Mumbai

2
OUTLINE
Introduction to QbD & PAT Pharmaceutical Development –ICH Q8(R2). Role of Analytical Methods in QbD Process. QbD analytical method development strategies. PAT Optimization by PAT Case study Conclusion

3
INTRODUCTION TO QUALITY BY DESIGN(QBD)
QbD is defined as “a Systematic approach to pharmaceutical development and manufacturing that begins with predefined objectives & emphasizes product & process understanding & process control, based on sound science & quality risk management”
Quality by Design (QbD) is a concept first outlined by J.M. Juran.
Quality cannot be tested into products – it has to be built by design.
Quality by Testing and Inspection QbD

OVERVIEW OF QbD

5
PHARMACEUTICAL DEVELOPMENT – ICH Q8(R2)
The aim is to design a quality product and its manufacturing process to consistently deliver the intended performance of the product.
Describes science and risk-based approaches for pharmaceutical product and manufacturing process development.
Introduced concepts of design space and flexible regulatory approaches.
Introduced concepts of Quality by Design (QbD).

6
QUALITY BY DESIGN – THE LIFECYCLE APPROACH
ICH Q8Pharmaceutical Development
ICH Q10Pharmaceutical Quality
System
ICH Q9Quality Risk Managemen
t
Quality by Design
QbD- GMP for the 21st century

Intended UseRoute of administration
Patient population…..
Product Design
Intended UseRoute of administration
Patient population…..
Product Design
Design Specifications(Customer requirements)
Manufacturing Process
Goals•High degree of process understanding
•To ensure a low risk of releasing a poor quality product
•High efficiency through continuous learning and improvement

09/25/2014
8
CQA’s
Risk Assessment
Design Space
Control Strategy
Continual Improvement
Product ProfileQuality Target Product Profile (QTPP).
Determine “potential” critical quality attributes (CQAs).
Link raw material attributes and process parameters to CQAs and perform risk assessment (ICH Q9) .
Develop a design space .
Design and implement a control strategy.
Manage product lifecycle, including continual improvement (ICH Q10) .
Elements of Pharmaceutical Development- ICH Q8 (R2)

9
ROLE OF ANALYTICAL METHODS IN QBD MFG. PROCESS Raw MaterialTesting
• Specification based on product QTPP and CQAs.
eg. Particle size, crystal properties etc.
In process Testing
• Real time (at-, on-, or in-line) measurements, Process Analytical Technology (PAT): eg. NIR- identification, drying, blending, assay, and content uniformity.
• Active control of process to minimize product variation.
Stability Testing
• Predictive models at release minimize stability failures.

10
THE CONCEPT OF ATP (ANALYTICAL TARGET PROFILE)
PhRMA and EFPIA working group introduced an approach that describes predefined performance requirements of analytical methods. i.e. ATP.
ATP: Defines what the method has to measure (e.g. the level of a specified impurity) & to what level the measurement is required (i.e. performance level characteristics).
ATP measures requirements defined in CQAs of Drug products.

11
QBD ANALYTICAL METHOD DEVELOPMENT STRATEGIES
Define Method
Goal
Method Scouting & Evaluation
Method Selection
& Risk Assessmen
t
MethodPerforman
ceControl
Strategy
Method Validation
Figure. Generalized method development strategy (MDS) approach for QbD analytical methods.

12
DEFINE METHOD GOAL
• eg. The goal of an HPLC method for API- To separate & Quantify the main compound & impurities (CQAs) that may impact the quality of the drug product.
Define Method
requirements: i.e. ATP.
• eg. For chromatographic resolution for 2 adjacent peaks must not be less than 1.5
Define the Method
Attributes:
• eg. Temperature, Humidity, etc. Operational
intent of Method:

13
METHOD SCOUTING AND EVALUATION
Systematic Design of Experiments (DoEs) approach: eg. RP-HPLC: Systematic & automatic Screening of all three key components (Column, pH & organic modifier ), then optimization of chromatographic
performance by using simulation softwares.
Optimization predicts large number of method conditions based on limited data from screening experiments.

14
METHOD SELECTION & RISK ASSESSMENT
Method selection: It is desirable to select at least one backup method.
Risk Assessment: It involves the risk identification & prioritization of risk in structured fashion, followed by ruggedness & robustness testing.Tools used: Fishbone diagram, FMEA (Failure Mode Effect Analysis), MSA (Measurement System Analysis).

15
FMEA (FAILURE MODE EFFECT ANALYSIS )
It evaluates potential failure modes for method & their likely effect on method performance.
FMEA methodically breaks down the Analytical method into process steps & identify possible failure modes for each step.
Each failure mode is ranked on estimated frequency of occurrence (O), probability , process (D) & severity(S).
Failure risks is calculated by Risk Priority Numbers (RPNs)= O × D × S

16
FMEA FOR A PAT NIR METHOD USED FOR DRYING MONITORING
Step Failure mode Failure effects Sev. Occ. Det.
RPNs
Probe control Interlock with Agitator
Probe cannot be inserted
7 4 4 112
Probe damage , Fiber damage
No signal transmission or Data gathering
Loss of data & control on drying
10 4 4 160
Retraction performance
Probe fails in insertion position
Agitator cannot be started
10 4 4 160
PLS model PLS model for NIR needs updating
Error in prediction of % w/w water content
10 1 7 70
Software NIR Software Failure
Loss of data & control on drying
4 1 1 4

17
MEASUREMENT SYSTEM ANALYSIS (MSA)
MSA is used in the design and analysis studies to determine the reproducibility of the method.
MSA is used to identify the noise factors which will have to be controlled & factors that do not have impact on method performance under normal operating conditions.
eg. for typical HPLC method the risk assessment is performed for Noise factors such as Different Analyst, column batches, laboratories, sample batches & date of analysis.

18
METHOD DESIGN SPACE
Method Design Space (MDS): Multidimensional space formed by the factor ranges that is used during method development which assures quality data (robustness).
In contrast to the ATP, the MDS is related to a specific method.
MDS is also known as Method Operable Design Region (MODR).

19
METHOD PERFORMANCE CONTROL STRATEGY
Method control strategy: Controls analytical factors and parameters and ensures that analytical method performance criteria are met.
It assures that method will be performed as intended on a routine use.
System suitability Test (SST): eg. Resolution value between critical pair of peaks, acceptable value for tailing peaks etc.

20
QBD LIFECYCLE APPROACH FOR ANALYTICAL METHOD
Figure 1: Components of application of quality by design (QbD) to analytical methods .

21
COMPARISON BETWEEN TRADITIONAL & QBD APPROACH
Method Development by OFAT (one-factor-at-a-time)Method TransferMethod Developed independently by Transferring lab. Then several batches are selected & run by both transferring & receiving labs prior to completing method transfer
Traditional Approach
Method Development by using DoEs Approach.Systematic Screening & Optimization Approach.
Method Transfer Risk assessment is performed in Receiving laboratory, so that any risk can be located prior to the method transfer.
QbD Approach

PAT (Process Analytical Technologies)
• A scientific and risk based approach to acquire process understanding.• An important enabler for QbD.• A paradigm most easily applied to new products.
What is PAT not?
• PAT is not a one-size-fits-all solution.• Difficult to fully implement for legacy products.

Process Analytical Technology (PAT)
PAT includes:• Timely measurements during processing
• Critical quality and performance attributes• Raw and in-process materials
• At-line, on-line or in-line measurements founded on “Process Understanding”
• Opportunities for improvement.• More reliable and consistent processes (& product)• Less failures, less reworks, less recalls• Flexibility w.r.t. scale and equipment• Better / faster Quality Systems.• Process Enhancement Opportunities

PAT is not just Analytical and not only NIR…...!!
• Raman• Image/Vision• Acoustics• Fluorescence• UV/Vis• FBRM (Laser scattering)• LIBS• etc……….
In conjunction with….• Process Engineering• SPA (Data Acquisition)• Multivariate Data Analysis
Summary - Tools in the toolbox
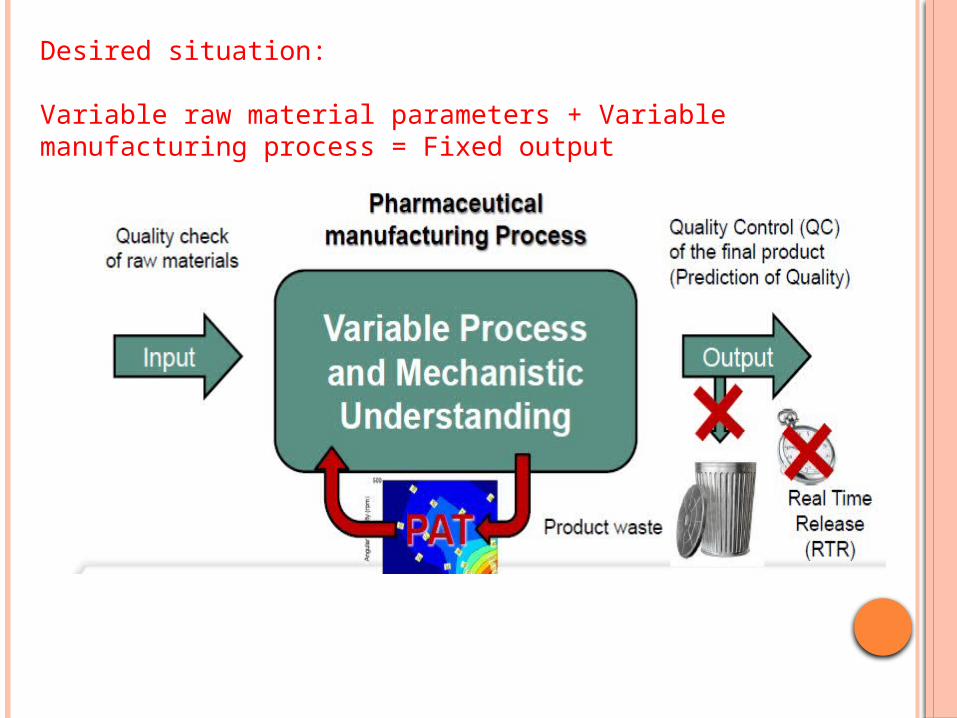
Desired situation:
Variable raw material parameters + Variable manufacturing process = Fixed output

Difference between PAT and QbD• PAT and QbD share similar goals for pharmaceutical manufacturing
a. Process understanding
b. Process control
c. Risk based decisions
•PAT facilitates the implementation of QbD
• Some elements of QbD (e.g., dosage form selection, formulation development, design space) can be implemented without PAT

27
A QBD BASED METHOD DEVELOPMENT FOR THE DETERMINATION OF IMPURITIES IN A PEROXIDE DEGRADED SAMPLE OF ZIPRASIDONE
• 1:UPLC method development by using QbD approach for determination of impurities in a peroxide degraded sample of Ziprasidone
• 2:Subsequent Method transfer to HPLC.
Objectives
CASE STUDY
28
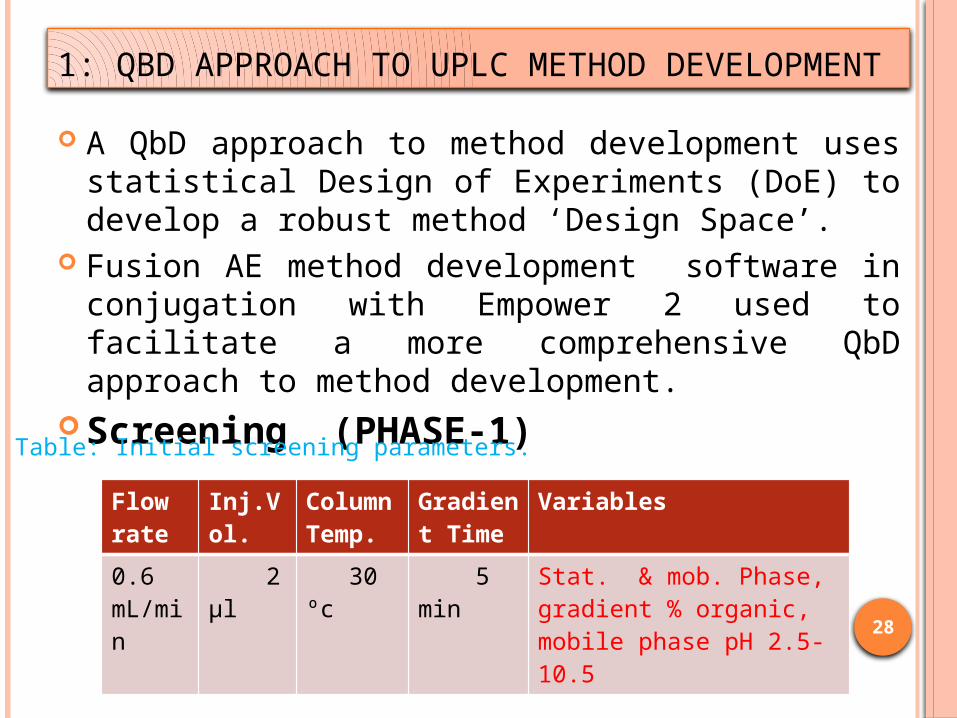
1: QBD APPROACH TO UPLC METHOD DEVELOPMENT
A QbD approach to method development uses statistical Design of Experiments (DoE) to develop a robust method ‘Design Space’.
Fusion AE method development software in conjugation with Empower 2 used to facilitate a more comprehensive QbD approach to method development.
Screening (PHASE-1)Flow rate
Inj.Vol.
Column Temp.
Gradient Time
Variables
0.6 mL/min
2 µl 30 ºc 5 min Stat. & mob. Phase, gradient % organic, mobile phase pH 2.5-10.5
Table: Initial screening parameters.

29
Initial Screening Results Using variable parameters, an Experimental Design was
generated within Fusion AE Partial factorial Design selected by software to obtain max. amt.
of information with least No. of experimental run.
Parameters Description of parameters
Column ACQUITY UPLC CHS C182.1× 50 mm, 1.7 µm
Mobile Phase D1: Water with 0.1% Formic acid (pH 2.5)
Gradient % organic 87.5 % Water/Acetonitrile
Table2: Initial Screening results of variable parameters.
30
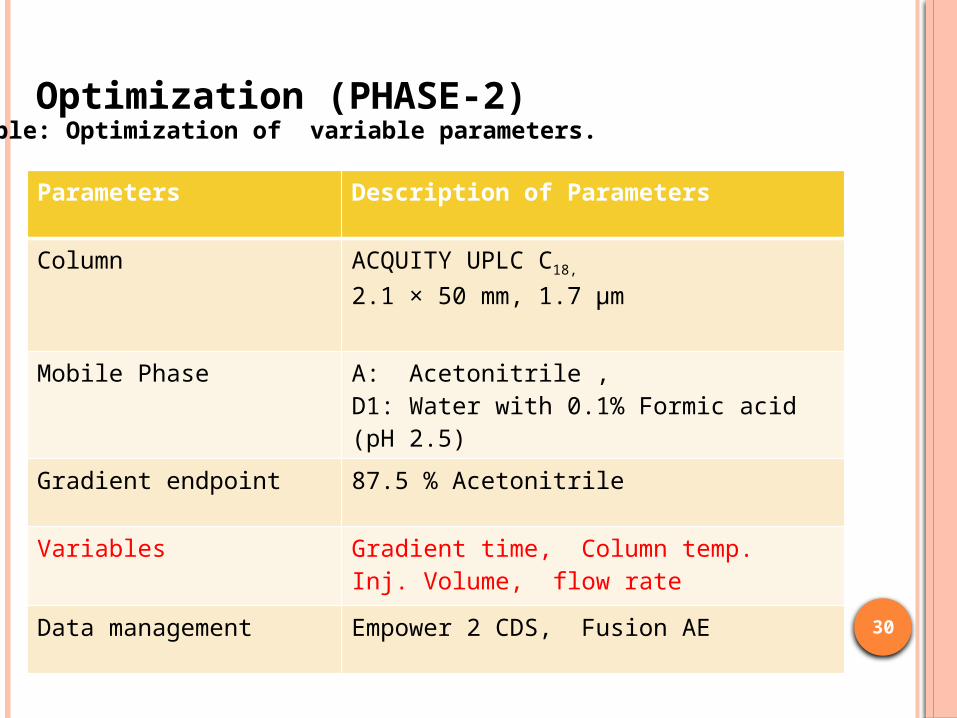
Optimization (PHASE-2)
Parameters Description of Parameters
Column ACQUITY UPLC C18, 2.1 × 50 mm, 1.7 µm
Mobile Phase A: Acetonitrile , D1: Water with 0.1% Formic acid (pH 2.5)
Gradient endpoint 87.5 % Acetonitrile
Variables Gradient time, Column temp. Inj. Volume, flow rate
Data management Empower 2 CDS, Fusion AE
Table: Optimization of variable parameters.

31
Final Optimization Results. Secondary effectors Such as Column temp, inj. Volume,
Gradient time & flow rate varied. A new experimental Design generated by Fusion AE. After processing data in Fusion AE, the final optimized
method was generated.
Parameters Description of parameters
Column ACQUITY UPLC CHS C182.1× 50 mm, 1.7 µm
Mobile Phase D1: Water with 0.1% Formic acid (pH 2.5)
Gradient % organic 0-87.5 % Water/Acetonitrile
Gradient time 8.1 minColumn temp. 30ºcflow rate 0.8 mL/min
Table: Final optimization results.

32
Fig.Initial method from screening expt for ziprasidone peroxide degradation.
Fig . Final optimized method for ziprasidone peroxide degradation showing improved peak tailing and resolution.

33
DESIGN SPACE FOR UPLC METHOD DEVELOPMENT
Figure . The design space region showing the independent effects of gradient time and pump flow rate on method success.
•Multi-dimensional plots in Fusion AE facilitates visualization of the effect of each factor on separation

34
METHOD TRANSFER•The UPLC method developed using Fusion AE software was transferred to HPLC to demonstrate transferability from a method development laboratory to other laboratory that might not be equipped with UPLC.
Figure. Method transfer from UPLC to HPLC for ziprasidone peroxide degradation.

35
A robust method for ziprasidone was developed in two days using a QbD approach on an ACQUITY UPLC H-Class system running Empower 2 and Fusion AE Method Development software.
It allows for rapid screening and optimization across a wide range of column chemistries, mobile phases and pH ranges, while evaluating the effects of secondary factors such as column temperature, flow rate, injection volume and gradient time on the separation.
The UPLC method developed for ziprasidone was transferred to HPLC in one step using a Method Transfer Kit and ACQUITY UPLC Columns Calculator.


PROCESS ANALYTICAL TECHNOLOGY
Analytical in the context of PAT includes much more than measuring, it is all about an overall process understanding!

38
CONCLUSIONS
Method developed with QbD approach are more robust & rugged, and thus survive the challenges of long-term usage by QC laboratories with decreased likelihood of failure.
Design Space (DS) for Analytical Methods provides possibility to move inside the DS without need for post–approval changes in process.
Method transfer by QbD approach are more successful without need for revalidation for any Out of specification results.

39
International Conference on Harmonization Tripartite Guideline “Q8(R2): Pharmaceutical Development” August 2009.
International Conference on Harmonization Tripartite Guideline “Q9: Quality Risk Management” November 2005.
International Conference on Harmonization Tripartite Guideline “Q10: Pharmaceutical Quality System” June 2008.
F.G. Vogt, A.S. Kord, REVIEW Development of Quality-By-Design Analytical Methods, J. Pharm. Sci. 100 (2010) 797-812.
REFRENCES
40
E.Rozet, P.Lebrun, B. Debrus, B.Boulanger, P.Hubert, Design Spaces for Analytical Methods, Trends in Analytical Chemistry, Vol.42, (2013) 157-167.
M. Summers, K.J. Fountain, Waters App. Note, 720004072EN, (2011) , 1-6.
M. Schweitzer, M. Pohl, M. Hanna-Brown, P. Nothercote, P. Borman, G. Hasen, K. Smith, J. Larew, Implications & Opportunities of Applying QbD Principles to Analytical Measurements, Pharm. Tech. Vol.34, issue2, (2010).
P. Nothercote, P. Borman, M.Chatfield, D.Thompson, K. Truman, The Application of QbD to Analytical Methods, Pharm. Tech. (2007).
Related Documents


