Qatar Business Optimism Index Q3 2010 Presented by Presented by Dun & Bradstreet Dun & Bradstreet Qatar Financial Centre (QFC) Authority Qatar Financial Centre (QFC) Authority

Qatar Business Optimism Index Q3 2010 Presented by Dun & Bradstreet Qatar Financial Centre (QFC) Authority.
Dec 14, 2015
Welcome message from author
This document is posted to help you gain knowledge. Please leave a comment to let me know what you think about it! Share it to your friends and learn new things together.
Transcript

Qatar Business Optimism Index Q3 2010
Presented by Presented by Dun & BradstreetDun & BradstreetQatar Financial Centre (QFC) Authority Qatar Financial Centre (QFC) Authority
• The D&B Business Optimism Index is recognized world over as an
indicator which ascertains the pulse of the business community
• Provides insight into the short-term outlook of business units on
key business parameters including sales, profits, pricing,
headcount and investment
• Provides analysis of major trends and issues concerning the
business community
Business Optimism Index
• Sample of business units representing Qatar’s economy is selected
• 500 business owners and senior executives across business units are
surveyed
• The Q3 survey was conducted during June 2010
• Respondents are questioned about their expectations on relevant
business parameters
• Survey also captures respondent feedback on current business
conditions
Survey

Composite Business Optimism Index
• The Composite Index is calculated separately for the hydrocarbon and non hydrocarbon sectors
• Within the non hydrocarbon sector the index is calculated:
– for the six individual indices
– for the five sub sectors within
• For the hydrocarbon sector the Composite Index takes into account the aggregate behavior of the three individual indices

World Economic Outlook
• Global economy expected to grow 4.6% in 2010, up from April forecast of 4.2%
• The US economy registered growth of 2.7% in Q1 2010 as against a revised GDP
growth rate of 5.6% in Q4 2009. 2010 growth revised upward to 3.3%
• The global composite PMI showed expansion (i.e. scoring > 50) for the eleventh
consecutive month
Source: IMF forecast, Q1 2010 are actual figures Source: JPMorgan and Markit
Global composite manufacturing & services PMIReal GDP (%)

30,000
40,000
50,000
60,000
70,000
80,000
90,000
100,000
110,000
5,000
6,000
7,000
8,000
9,000
10,000
11,000
12,000
Q1 2009 Q2 2009 Q3 2009 Q4 2009
Manufacturing Construction
Trade, Restau & Hotels Finance, Ins, Real Est & Bus Ser
Transport & Comm Mining & quarrying (sec axis)
GDP at current prices (sec axis)
Economy of Qatar
• Qatar’s nominal GDP growth in Q4
2009 over the previous quarter was
9.7%; mining & quarrying sector grew
23.8%
• Real GDP growth is expected to surge
from 8.7% last year to 18.5% in 2010
• Higher oil & gas revenues will lead to
a surge in current account balance
from US$ 14 bn in 2009 to US$ 28 bn
in 2010
Quarterly GDP 2009 (QAR mn)
780
792
805
776
814 815821
750
760
770
780
790
800
810
820
830
Q309 Q409 Q110 2009 Mar-10 Apr-10 May-10
'00
0 b
pd
Crude oil production
Source: OPEC
Composite Business Optimism Indices
Non Hydrocarbon Sector Hydrocarbon Sector
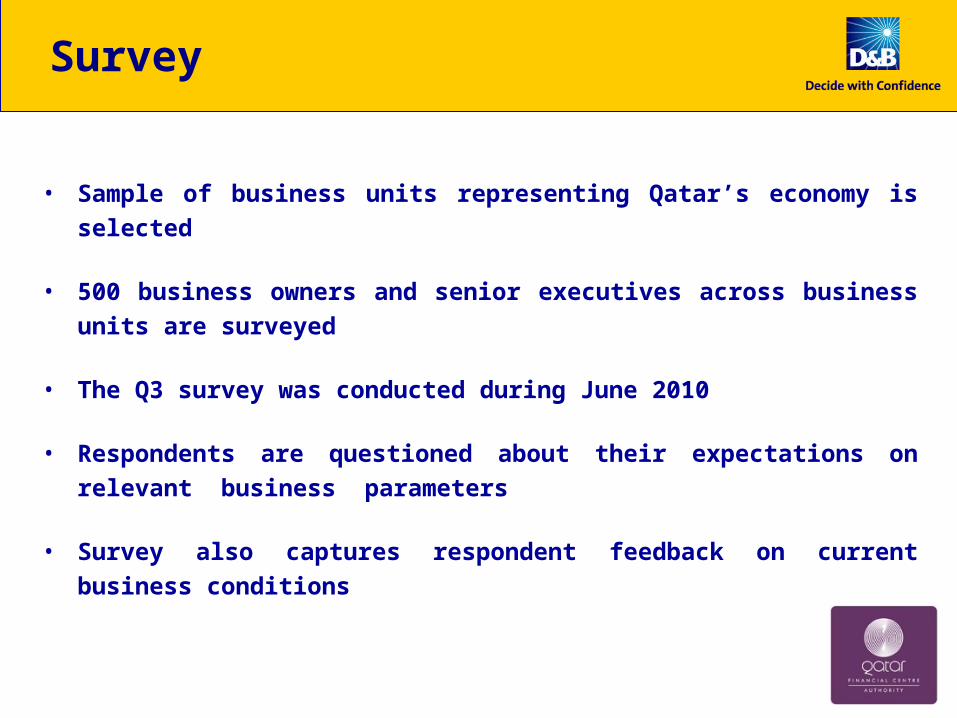
• Business optimism in the non hydrocarbon sector lifted by improvement in all parameters
• Surge in hydrocarbon optimism mainly due to an increase in level of selling prices expectation
69 66
34
7
2128
24 27
39
0
10
20
30
40
50
60
70
80
Q3 08 Q4 08 Q1 09 Q2 09 Q3 09 Q4 09 Q1 10 Q2 10 Q3 10
95
70
-37
-6 -5
25 28
12
46
-40
-20
0
20
40
60
80
100
120
Q3 08 Q4 08 Q1 09 Q2 09 Q3 09 Q4 09 Q1 10 Q2 10 Q3 10

Business Optimism Indices Trend – Non Hydrocarbon Sector
7882
41
9
34
49
38 41
49
0
10
20
30
40
50
60
70
80
90
Q3 08 Q4 08 Q1 09 Q2 09 Q3 09 Q4 09 Q1 10 Q2 10 Q3 10
BO
I In
dex
Volume of Sales
76
63
40
19
37
24
3339
49
0
10
20
30
40
50
60
70
80
Q3 08 Q4 08 Q1 09 Q2 09 Q3 09 Q4 09 Q1 10 Q2 10 Q3 10B
OI I
ndex
New Orders
5952
8
-18
-4
51
7
19
-30
-20
-10
0
10
20
30
40
50
60
70
Q3 08 Q4 08 Q1 09 Q2 09 Q3 09 Q4 09 Q1 10 Q2 10 Q3 10
BO
I In
dex
Selling Prices
66
74
37
3
26
37
3027
46
0
10
20
30
40
50
60
70
80
Q3 08 Q4 08 Q1 09 Q2 09 Q3 09 Q4 09 Q1 10 Q2 10 Q3 10
BO
I In
dex
Net Profits
66
60
42
24
12
25
19 20
34
0
10
20
30
40
50
60
70
Q3 08 Q4 08 Q1 09 Q2 09 Q3 09 Q4 09 Q1 10 Q2 10 Q3 10
BO
I In
dex
Number of Employees
51
61
13
1
23
41
13
5
33
0
10
20
30
40
50
60
70
Q3 08 Q4 08 Q1 09 Q2 09 Q3 09 Q4 09 Q1 10 Q2 10 Q3 10
BO
I In
dex
Level of Stock

Manufacturing Sector
• The Global Manufacturing Purchasing Managers’ Index has shown growth for twelve
consecutive months
• Manufacturing sector BOI increase on the back of improvement in hiring outlook
• BOI for Sales Volume drops but for New Order increases, suggesting mixed
demand outlook in the third quarter
Global Manufacturing Purchasing Managers’ Index
Source: J P Morgan and market economics in association with ISM and IFPSM
Manufacturing Sector: Composite Index

Construction Sector
• The global construction sector is witnessing a gradual upturn; sector is evolving
as emerging markets continue to drive global recovery
• Strong demand expected in the construction sector as BOI for Volume of Sales
has jumped to 49 as against 26 in previous quarter
• The BOI for Level of Selling Prices has stayed stable, reflecting recent correction
in international commodities market
Construction sector: Composite Index

Trade & Hospitality Sector
• Retail sector growth in developed countries likely to remain slow whereas emerging markets are expected to
witness rising retail sales in 2010
• In Qatar, respondents are optimistic about the sector due to expectations of a huge increase in BOI for level
of selling prices which moved to 26 from -5 in Q2
• Demand levels are expected to improve modestly
Trade & Hospitality sector: Composite Index
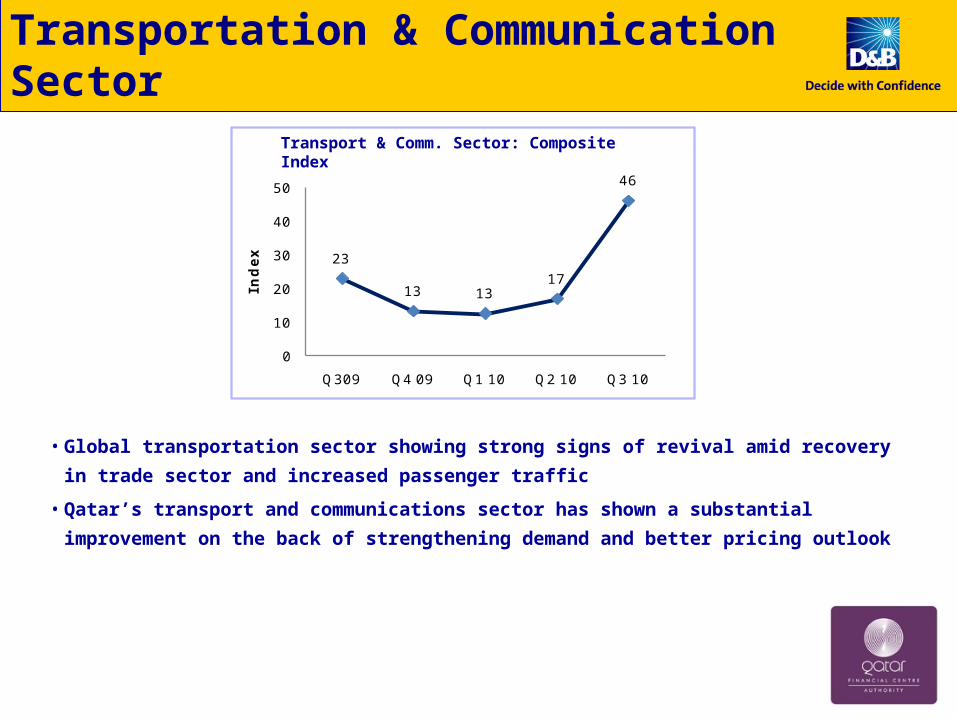
23
13 1317
46
0
10
20
30
40
50
Q309 Q4 09 Q1 10 Q2 10 Q3 10
Ind
ex
Transportation & Communication Sector
• Global transportation sector showing strong signs of revival amid recovery in
trade sector and increased passenger traffic
• Qatar’s transport and communications sector has shown a substantial
improvement on the back of strengthening demand and better pricing outlook
Transport & Comm. Sector: Composite Index
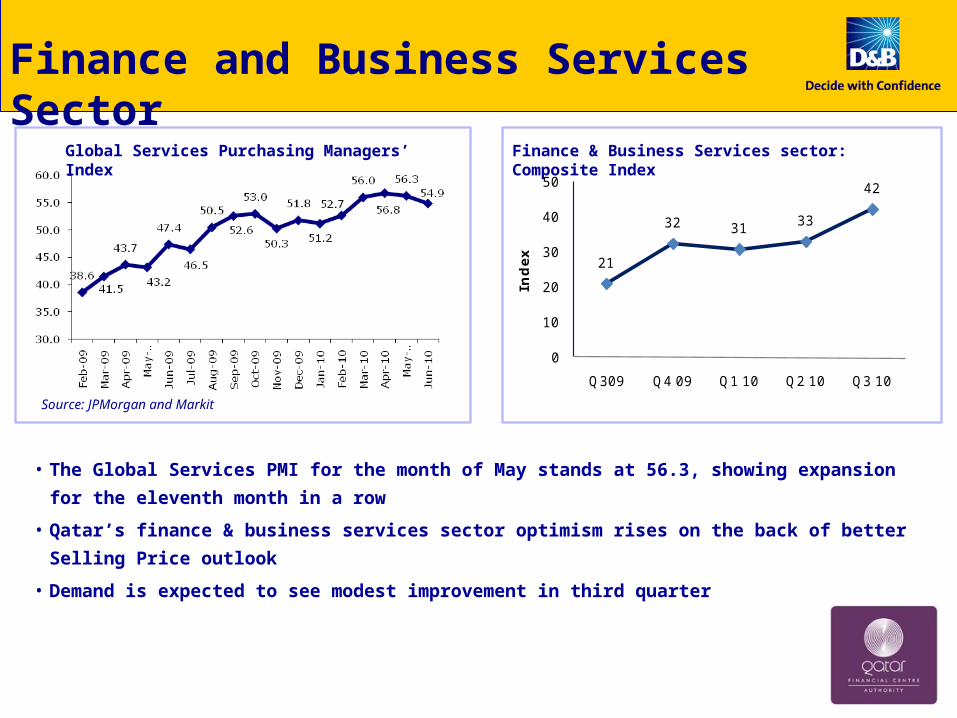
21
32 31 33
42
0
10
20
30
40
50
Q309 Q4 09 Q1 10 Q2 10 Q3 10
Ind
ex
Finance and Business Services Sector
• The Global Services PMI for the month of May stands at 56.3, showing expansion for the eleventh
month in a row
• Qatar’s finance & business services sector optimism rises on the back of better Selling Price
outlook
• Demand is expected to see modest improvement in third quarter
Finance & Business Services sector: Composite IndexGlobal Services Purchasing Managers’ Index
Source: JPMorgan and Markit
-60
-40
-20
0
20
40
60
80
100
Q3 08 Q4 08 Q1 09 Q2 09 Q3 09 Q4 09 Q1 10 Q2 10 Q3 10
In
dex
Level of Selling Prices Net Profits New Employees
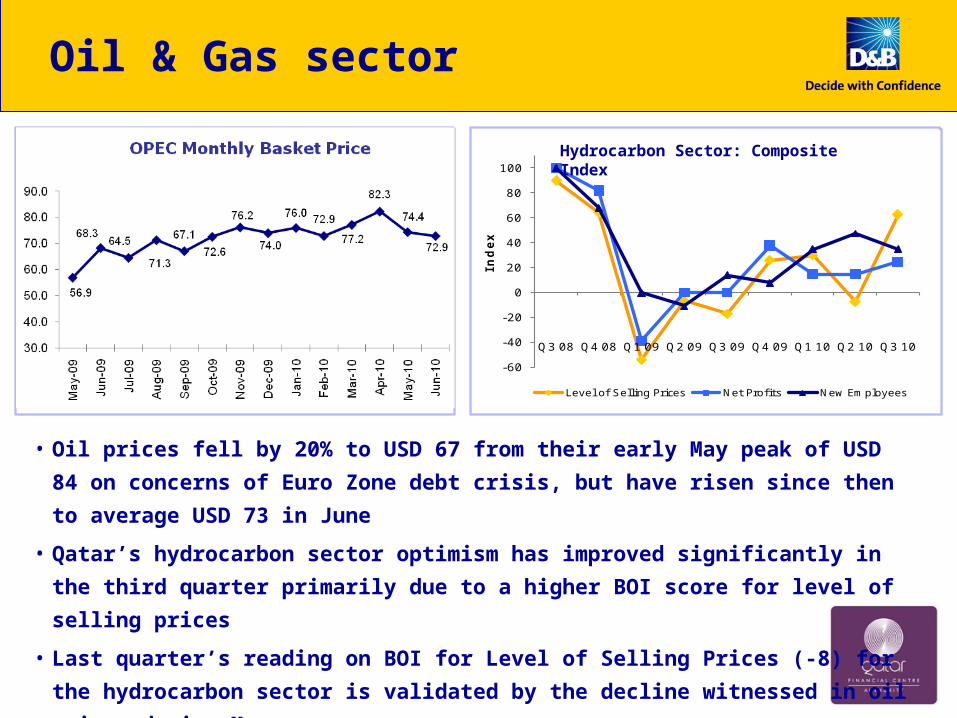
Oil & Gas sector
• Oil prices fell by 20% to USD 67 from their early May peak of USD 84 on concerns of
Euro Zone debt crisis, but have risen since then to average USD 73 in June
• Qatar’s hydrocarbon sector optimism has improved significantly in the third quarter
primarily due to a higher BOI score for level of selling prices
• Last quarter’s reading on BOI for Level of Selling Prices (-8) for the hydrocarbon
sector is validated by the decline witnessed in oil prices during May
Hydrocarbon Sector: Composite Index

Other Highlights
•Raw material costs is the leading concern for non hydrocarbon segment, 48% of the respondents have cited it as a factor which might affect their business •Availability of finance is a concern for 29% of the business units in non hydrocarbon sector
•31% of companies in the non hydrocarbon sector intend to investment in business expansion
•For 50% of the companies in the hydrocarbon sector project delays could be a major factor which might impact their business in the third quarter

Conclusion
• Business outlook improves in Qatar despite continuing debt troubles in Euro Zone
• All sub sectors show an improvement in sentiments buoyed by robust demand outlook
• Transport & logistics sector shows major improvement due to improved demand and consequently profitability outlook
• Hydrocarbon sector displays surge in optimism levels on the back of expectations of rise in level of selling prices

THANK YOU THANK YOU
Related Documents