Follow our Official Page ‘pnbindia’ FINANCIAL RESULTS Q4 & FY 2020

Welcome message from author
This document is posted to help you gain knowledge. Please leave a comment to let me know what you think about it! Share it to your friends and learn new things together.
Transcript

Follow our Official Page ‘pnbindia’
FINANCIAL RESULTS
Q4 & FY 2020

Page I
Core Strengths of the Bank
Trust of 11.8 crore + customers
(Amalgamated entity: 18 crore + customers)
23231 Touch Points: 6563 Branches, 9168 ATMs, 7500 BCs
(Amalgamated entity: 37440 Touch Points: 10910 Branches, 13797 ATMs, 12733 BCs)
Dedicated Workforce 68000 +
(Amalgamated entity: Dedicated Workforce 103000 +)
Resilient Business Model
High CASA Share44.05%
Core Operations Profitable
125+ Years of banking Experience
PAN India Presence
2

Page I
Key Financial Highlights Q4 FY’20
37.4% YoY Gr
Operating Profit
₹ 516929 Crore
Gross Credit
44.05 %CASA Share
6.1% YoY Gr
CASA Deposit
4.9% YoY Gr
Domestic Deposit
6.1% YoY Gr
Retail Loans
14.2% YoY Gr
Housing Loans
PCRNNPA
5.78%QoQ: 140 bps decline
77.79%
3

Page I
Content
Business Performance1
Profitability2
Asset Quality3
Capital & Share Holding4
Digitalization & Financial Inclusion5
Way Forward6
Subsidiaries, JVs, Associates & RRBs7
Summary of Amalgamation Entity8
5-23
Slide No
58-61
62-71
72-82
33-47
48-50
51-57
24-32
4

Crore
Page I
Business Performance As at 31st Mar’20
Business Performance1
Sl. Parameters Mar’18 Mar'19 Mar’20YoY variation
Amount %
1 Domestic Deposits 600387 654536 686493 31957 4.9
Overseas Deposits 41839 21494 17353 -4141 -19.3
Global Deposits 642226 676030 703846 27816 4.1
2 Gross Domestic Advances 428466 489812 495045 5233 1.1
Gross Overseas Advances 42831 16382 21883 5501 33.6
Gross Global Advances 471297 506194 516929 10735 2.1
3 Gross Domestic Business 1028852 1144348 1181538 37190 3.2
Gross Overseas Business 84670 37876 39237 1361 3.6
Gross Global Business 1113523 1182224 1220775 38551 3.3
5

Crore
Page I
Business Performance (Daily Average Basis)
Business Performance1
Sl. Parameters Mar’18 Mar'19 Mar’20YoY Variation
Amt. %
1 Domestic Deposits 561391 601091 645421 44330 7.4
Overseas Deposits 52538 26053 20785 -5268 -20.2
Global Deposits 613929 627144 666206 39062 6.2
CASA Deposits 241559 251311 268102 16791 6.7
Saving Deposits 212606 223419 239516 16097 7.2
2 Gross Domestic Advances 372525 427101 440828 13727 3.2
Gross Overseas Advances 52538 27270 17165 -10105 -37.1
Gross Global Advances 425063 454371 457993 3622 0.8
3 Gross Domestic Business 933916 1028192 1086249 58057 5.6
Gross Overseas Business 105076 53323 37950 -15373 -28.8
Gross Global Business 1038992 1081515 1124199 42684 3.9
6

Crore
Page I
Deposit Mix
Business Performance1
Sl. Parameters Mar’18 Mar’19 Mar’20YoY variation
Amount %
1 Domestic Deposit 600387 654536 686493 31957 4.9
2 Overseas Deposit 41839 21494 17353 -4141 -19.3
3 Global Deposit 642226 676030 703846 27816 4.1
4 CASA Deposit 263247 285040 302475 17434 6.1
5 Current Deposit 40374 44375 45714 1339 3.0
6 Saving Deposit 222873 240665 256760 16095 6.7
CASA Share Domestic (%) 43.80 43.51 44.05
7

Crore
Page I
CASA Share
Business Performance1
222873
240665
256760
Mar'18 Mar'19 Mar' 20
Saving Deposit (₹ Crore )
40374
44375
45714
Mar'18 Mar'19 Mar' 20
Current Deposits (₹ Crore)
43.80% 43.51%44.05%
Mar'18 Mar'19 Mar' 20
CASA Share %
8
Crore
Page I
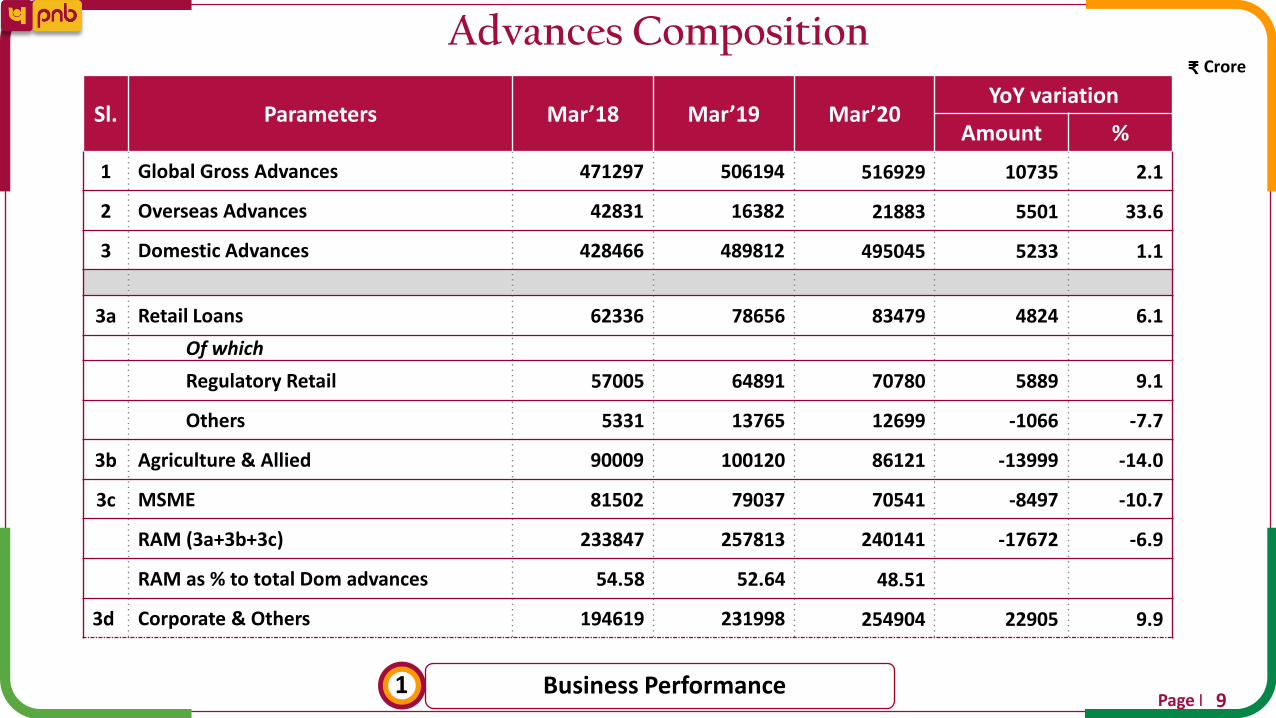
Advances Composition
Business Performance1
Sl. Parameters Mar’18 Mar’19 Mar’20YoY variation
Amount %
1 Global Gross Advances 471297 506194 516929 10735 2.1
2 Overseas Advances 42831 16382 21883 5501 33.6
3 Domestic Advances 428466 489812 495045 5233 1.1
3a Retail Loans 62336 78656 83479 4824 6.1
Of which
Regulatory Retail 57005 64891 70780 5889 9.1
Others 5331 13765 12699 -1066 -7.7
3b Agriculture & Allied 90009 100120 86121 -13999 -14.0
3c MSME 81502 79037 70541 -8497 -10.7
RAM (3a+3b+3c) 233847 257813 240141 -17672 -6.9
RAM as % to total Dom advances 54.58 52.64 48.51
3d Corporate & Others 194619 231998 254904 22905 9.9
9

Crore
Page I
Retail Product Performance
Business Performance1
Retail Components Mar’18 Mar’19 Mar’20 YoY %Housing 36003 44874 51267 14.2
Mortgage 6220 8150 9191 12.8
Car/Vehicle 5934 5745 5480 -4.6
Education 5220 5586 5843 4.6
Personal 4348 4865 5124 5.3
Others 4610 9435 6573 -30.3
Total Retail 62336 78656 83479 6.1
62336
78656 83479
Mar'18 Mar'19 Mar'20
Retail YoY Gr 6.1%
Growth
44874
8150 5745 5586 48659436
51267
9191 5480 5843 5124 6574
Housing Mortgage Car/Vehicle Education Personal Others
Mar'19 Mar'20
4.6% Gr14.2 % Gr -4.6% Gr12.8% Gr -30.3 % Gr5.3 % Gr
10

Crore
Page I
MSME Lending portfolio
Business Performance1
45%
41%
14%
Segment Mix
Micro
Small
Medium
67%
9%
9%
15%
Book by Loan Size
Upto 5 crore
5 cr-10 cr
10 cr-25 cr
More than 25 cr
Maximum MSME portfolio of Bank is in smaller valued accounts.
Bank has maximum exposure in MSE sector to boost priority sector credit.
11

Crore
Page I
MSME Lending portfolio
Business Performance1
63%15%
10%
12%
Geographical Mix
NORTH
WEST
SOUTH
EAST
Bank has maximum exposure in Northern States of India
5%4%
3%
5%2%
2%
1%
2%
1%28%20%
20%
7%
Sectoral Mix
Textile
Iron & steel
Gems & Jewellery
Infrastructure
Automobile
Manufacturing of CONSUMER DURABLESDRUGS & PHARMACEUTICALSManufacturing of food itemsPLASTIC INDUSTRY
Service & Others
Manufacturing & Other
Small Buisness
Professionals
12
saket.karan
Highlight
saket.karan
Highlight
saket.karan
Highlight
saket.karan
Highlight
saket.karan
Highlight
saket.karan
Highlight
saket.karan
Highlight
saket.karan
Highlight
saket.karan
Highlight
saket.karan
Highlight
saket.karan
Highlight
saket.karan
Highlight

Crore
Page I
MSME: Advances Composition
Business Performance1
93%
97%
7%
3%
Mar'19 Mar'20
Unsecured
Secured
97% of MSME loan portfolio is secured.
68% 72%
32% 28%
Mar-19 Mar-20
Long term loan
Short term loan
Short term MSME portfolio of Bank increased during FY 19-20. 71% of MSME loan portfolio is consists of working capital loans.
13

Crore
Page I
Mudra and Stand up India
Business Performance1
Parameter Mar’19 Mar’20
Amount Sanctioned 6315 5956
Amount Disbursed 4964 4707
Achievement % Disbursement to sanctions 78.6% 79.0%
Since Inception Current FY
No. of A/Cs Amt. Sanc. No. of A/Cs Amt. Sanc.
12497 2822 1014 314
14

Crore
Page I
Priority Sector
Business Performance1
Sl. ParametersNational
GoalsMar’18 Mar’19 Mar’20
YoY Variation
Amt. %
1 Priority Sector 169772 178644 182344 3700 2.071
% to ANBC 40% 40.94% 41.89% 39.47%
2 Agriculture (PS) 69207 81500 79707 -1793 -2.2
% to ANBC 18% 18.49% 18.40% 17.85%
3 Small and Marginal Farmers 34442 36826 40512 3686 10.01
% to ANBC 8% 8.86% 8.41% 8.86%
4 Weaker Section 51600 49595 50850 1255 2.53
% to ANBC 10% 11.56% 11.30% 11.30%
5 Women Beneficiaries 26083 29813 30580 767 2.573
% to ANBC 5% 6.78% 6.81% 6.81%
6 Micro Enterprises (PS) 34475 31552 31506 -46 -0.15
% to ANBC 7.5% 7.65% 7.71% 7.27%
% Ach. is on Quarterly Annual Average Basis.
15

Crore
Page I
Balance Sheet : PNB Standalone
Business Performance1
Sl. Parameters Mar’18 Mar'19 Mar’20YoY Variation
Amt. %
CAPITAL & LIABILITIES
1 Capital 552 921 1348 427 46.3
2 Reserves and Surplus 40522 43866 61010 17144 39.1
3 Deposits 642226 676030 703846 27816 4.1
4 Borrowings 60851 39326 50225 10900 27.7
5 Other Liabilities and Provisions 21679 14806 14237 -570 -3.8
Total 765830 774949 830666 55716 7.2
ASSETS
1 Cash and Balances with RBI 28789 32129 38398 6269 19.5
2 Balances with Banks 66673 43159 37595 -5564 -12.9
3 Investments 200306 202128 240466 38337 19.0
4 Loans & Advances 433735 458249 471828 13579 3.0
5 Fixed Assets 6349 6225 7239 1014 16.3
6 Other Assets 29978 33059 35140 2081 6.3
Total 765830 774949 830666 55716 7.2
16

Crore
Page I
Diversified Industry Portfolio
Business Performance1
Sl. ParametersMar’18 Mar’19 Mar’20 YoY variation
O/S O/S O/S% to Total Portfolio
%
1 Food Processing 10761 10120 10293 5.8 1.72 Textiles 10258 9289 7801 4.4 -16.03 Chemical & Chemical Products 6355 4803 17522 9.9 264.84 Cement & Cement Products 1508 1651 995 0.6 -39.75 Basic Metal & Metal Products 26604 22240 25650 14.5 15.3
-Iron & Steel 24392 20234 23734 13.4 17.36 Paper & paper products 1252 1084 931 0.5 -14.17 Petroleum 8370 7219 4546 2.6 -37.08 Engineering 4887 4363 3940 2.2 -9.79 Vehicles & Vehicle parts 662 1053 758 0.4 -28.0
10 Construction 3818 2579 1330 0.8 -48.411 Infrastructure 70501 72754 71963 40.6 -1.1
-Power 32592 36884 32072 18.1 -13.0-Tele-Communication 11872 14083 13231 7.5 -6.0
-Roads & Ports 18261 16011 21727 12.3 35.7-Others 7777 5776 4934 2.8 -14.6
12 Others 30367 30595 31557 17.8 3.1Total 175344 167750 177287 100.0 5.7
17

Crore
Page I
Exposure to Sensitive Sector
Business Performance1
Sl. Parameters Mar’19 Jun’19 Sep’19 Dec’19 Mar’20YoY Variation
Amt. %
1 Capital Market 4849 4180 3700 4625 3966 -883 -18.2
2 Commercial Real Estate 14480 15675 19318 18681 18415 3935 27.2
3 NBFC 40771 39858 44577 43026 54206 13435 33.0
of which HFC 15116 14150 14377 17316 22304 7188 47.6
4 Aviation 7023 7007 6703 5539 5337 -1686 -24.0
18

Crore
Page I
Regulatory Bifurcation of Advances
Business Performance1
Sl. Parameters Mar’19 June’19 Sep’19 Dec’19 Mar’20YoY Variation
Amt. %
1 Regulatory Retail (< Rs 5 Crore) 172365 168915 172590 175240 176223 3858 2.2
2 Corporate Total 317447 283029 282540 279796 318822 1375 0.4
2a Corporate (> Rs 250 Crore) 230170 200452 202262 199886 239751 9581 4.2
2bCorporate (> Rs 10 Crore & < Rs 250 Crore)
76548 71864 69256 68685 67806 -8742 -11.4
2cOthers (> Rs 5 Crore& < Rs 10 Crore)
10729 10713 11021 11225 11265 536 5.0
3 Gross Domestic Advances (1+2) 489812 451944 455130 455036 495045 5233 1.1
19

Crore
Page I
Concentration Risk
Business Performance1
Sl. Parameters Mar’18 Mar’19 Mar’20
1 Exposure to top 20 Borrowers as % of total Exposure 18.6 19.9 18.2
2 Exposure to top 10 Groups as % of total Exposure 14.4 13.2 14.3
20

Crore
Page I
Advances Mix of Benchmark Rate (%)
Business Performance1
20.4 21.6 19.8 18.913.9
3.2 3.4 3.3 3.22.9
15.4 12.3 12.6 12.418.2
58.9 60.1 61.5 59.7 58.9
0.0 0.0 0.1 2.0 3.3
2.1 2.6 2.7 3.7 2.9
Mar’19 June’19 Sep’19 Dec'19 Mar'20
Base Rate BPLR Fixed MCLR RLLR Foreign Currency & Others
21

Crore
Page I
Sl. Parameters Mar’18 Mar’19 Mar’20YoY Variation
Amt. %
1 Domestic Investment 197328 200632 236670 36038 18.0
a SLR 145271 140391 166713 26322 18.7
b Non SLR 52057 60241 69957 9716 16.1
SLR as % to Dom. Investment 73.62 69.97 70.44
I Held To Maturity (HTM) 119439 135102 162123 24603 18.2
II Available For Sale (AFS) 77839 65280 74541 9261 14.2
III Held For trading (HFT) 50 250 5 -245 -98.0
2 Duration (AFS+HFT) 4.29 3.42 3.75
3 Modified Duration (AFS+HFT) 4.09 3.26 3.61
4 Net demand & time Liabilities 584269 639565 703577 64012 10.0
5 Investment by Overseas Branches 6081 5493 7084 1591 29.0
6 Total Gross Investment (1+5) 203409 206125 243754 37629 18.3
SLR HTM to Total SLR (%) 73.38 77.45 71.85
HTM To Investment (%) 60.53 67.33 68.50
Investment Portfolio
Business Performance122

Crore
Page I
Non SLR Portfolio
Business Performance123
Sl. ParametersMar’18 Mar’19 Mar’20 Y-o-Y Variation
O/S % Share O/S % Share O/S % Share Amt Gr. %
1 PSU Bonds 12696 24.4 11130 18.5 9615 13.7 -1515 -13.6
2Corporate and Other Bonds & Debentures
17254 33.1 16415 27.2 9317 13.3 -7098 -43.2
3 Special Govt. Sec excl. Recap Bonds 1996 3.8 1328 2.2 1212 1.7 -116 -8.7
4 CG Recap. Bond 5473 10.5 19628 32.6 35719 51.1 16091 82.0
5 Share of PSU/Corporate/Others 6678 12.8 6587 10.9 5693 8.1 -894 -13.6
6 Venture Capital Fund 216 0.4 164 0.3 152 0.2 -12 -7.0
7 Regional Rural Bank 70 0.1 70 0.1 74 0.1 4 6.1
8 Security Receipts 1657 3.2 1526 2.5 1458 2.1 -68 -4.4
9 Subsidiaries JV 2952 5.7 2927 4.9 2977 4.3 50 1.7
10 Other 3065 5.9 468 0.8 3740 5.3 3272 699.7
Total Non SLR Investment 52057 100.0 60241 100.0 69957 100.0 9716 16.1

Crore
Page I
Total Income
Profitability2
Sl. Parameters Q4’ FY19 Q3’ FY20 Q4’ FY20YoY Variation
FY19 FY20YoY
Gr. %Amt. %
1 Interest Income (2+3+4) 12836 13563 13859 1023 8.0 51310 53800 4.9
2 Interest on Advances 8811 8838 9220 408 4.6 35086 35815 2.1
3 Interest on Investments 3543 4022 3935 393 11.1 14106 15333 8.7
4 Other Interest Income 482 702 704 222 46.1 2118 2652 25.2
5 Other Income (6+7+8+9) 1889 2405 2529 640 33.9 7377 9274 25.7
of which
6 Fee Based Income 1003 980 1073 70 7.0 4225 4341 2.7
7 Recovery in Written off a/cs 545 1194 1006 460 84.4 1808 3095 71.2
8 Trading Profit 252 203 407 156 61.8 1093 1632 49.3
9 Others 89 28 43 -46 -51.5 251 207 -17.8
10 Total Income (1+5) 14725 15967 16388 1663 11.3 58688 63074 7.5
24

Crore
Page I
Non Interest Income
Profitability2
Sl. ParametersQ4’
FY 19Q3’
FY 20Q4’
FY20
YoY VariationFY19 FY20
YoYGr. %Amt. %
A Fee Based Income 1003 980 1073 70 7.0 4225 4341 2.7
1 Processing Fees 113 58 128 15 13.1 623 649 4.1
2 LC/LG Income 169 178 169 0 -0.1 676 664 -1.7
3 Income from Ins & MF 76 60 74 -2 -2.9 233 243 4.6
4 Govt. Business 50 34 51 1 2.4 124 144 15.9
5 Exchange Profit 102 83 122 20 19.4 509 439 -13.7
6 Misc. Fee Income 493 567 529 37 7.4 2061 2201 6.8
B Trading Profit 252 203 407 156 61.8 1093 1632 49.3
C Realization in write off A/C's 545 1194 1006 460 84.4 1808 3095 71.2
D Income from Dividend 16 6 35 18 110.0 149 154 3.6
E Other Non intt Income 73 22 9 -64 -87.9 103 52 -48.9
Total Non Interest Income(A to E) 1889 2405 2529 640 33.9 7377 9274 25.7
25

Crore
Page I
Total Expenses
Profitability2
Sl. Parameters Q4’ FY19 Q3’ FY20 Q4’ FY20YoY Variation
FY19 FY20YoY
Gr. %Amt. %
1 Total Interest Paid (2+3+4) 8635 9208 9181 546 6.3 34154 36362 6.5
2 Intt. Paid on Deposits 8330 8658 8552 222 2.7 32218 34375 6.7
3 Intt. Paid on Borrowings 135 191 254 119 88.5 552 654 18.4
4 Others 170 359 375 204 119.9 1384 1333 -3.6
5 Operating Expenses (6+8) 3229 2997 3275 46 1.4 11538 11973 3.8
6 Estab. Expenses 1990 1751 1854 -136 -6.8 6963 6962 0.0
Of Which
Employee Benefits (AS-15) 508 207 300 -208 -40.9 1143 854 -25.3
7 Other Operating Expenses 1239 1245 1421 182 14.7 4575 5012 9.5
8 Total Expenses (1+5) 11864 12205 12456 592 5.0 45692 48336 5.8
26

Crore
Page I
Profit
Profitability2
Sl. Parameters Q4’ FY19 Q3’ FY20 Q4’ FY20YoY Variation
FY19 FY20YoY
Gr. %Amt. %
1 Interest Income 12836 13563 13859 1023 8.0 51310 53800 4.9
2 Interest Expenses 8635 9208 9181 546 6.3 34154 36362 6.5
3 Net Interest Income 4200 4355 4678 477 11.4 17156 17438 1.6
4 Other Income 1889 2405 2529 640 33.9 7377 9274 25.7
5 Operating Income 6090 6760 7207 1117 18.3 24534 26712 8.9
6 Operating Expenses 3229 2997 3275 46 1.4 11538 11973 3.8
7 Operating Profit (5-6) 2861 3763 3932 1071 37.4 12995 14739 13.4
8 Provisions 7611 4255 4629 -2981 -39.2 22971 14402 -37.3
9 Net Profit (7-8) -4750 -492 -697 4052 - -9975 336 -
27

Crore
Page I
Provisions
Profitability2
Sl. Parameters Q4’ FY 19 Q3’ FY20 Q4’ FY20 FY19 FY20
1 NPAs 9154 4445 4618 24435 14464
2Standard Advances incl. Std. Restructured
223 -209 441 208 73
3 Depreciation on Investment 147 -106 -404 1641 -366
4 Income Tax -2460 109 -272 -5370 403
5 Others 548 16 246 2058 -171
B Total Provision 7611 4255 4629 22971 14402
28

Annualized %
Page I
Profitability Ratios
Profitability2
Sl. Parameters Q4’ FY19 Q3’ FY20 Q4’ FY20 FY19 FY20
1 Return on Assets [%] -2.33 -0.23 -0.31 -1.25 0.04
2 Return on Net worth [%] -46.92 -3.38 -4.91 -24.64 0.59
3 Earnings per share *₹+ -49.62 -2.95 -4.14 -30.98 0.62
4 Book Value per Share *₹+ 47.2 57.74 54.43 47.2 54.43
5 Cost to Income Ratio [%] 53.02 44.33 45.44 47.03 44.82
6 Opt. Profit to AWF [%] 1.40 1.75 1.74 1.63 1.72
7 Opt. Exp. To AWF [%] 1.58 1.39 1.45 1.45 1.40
29
Annualized %
Page I
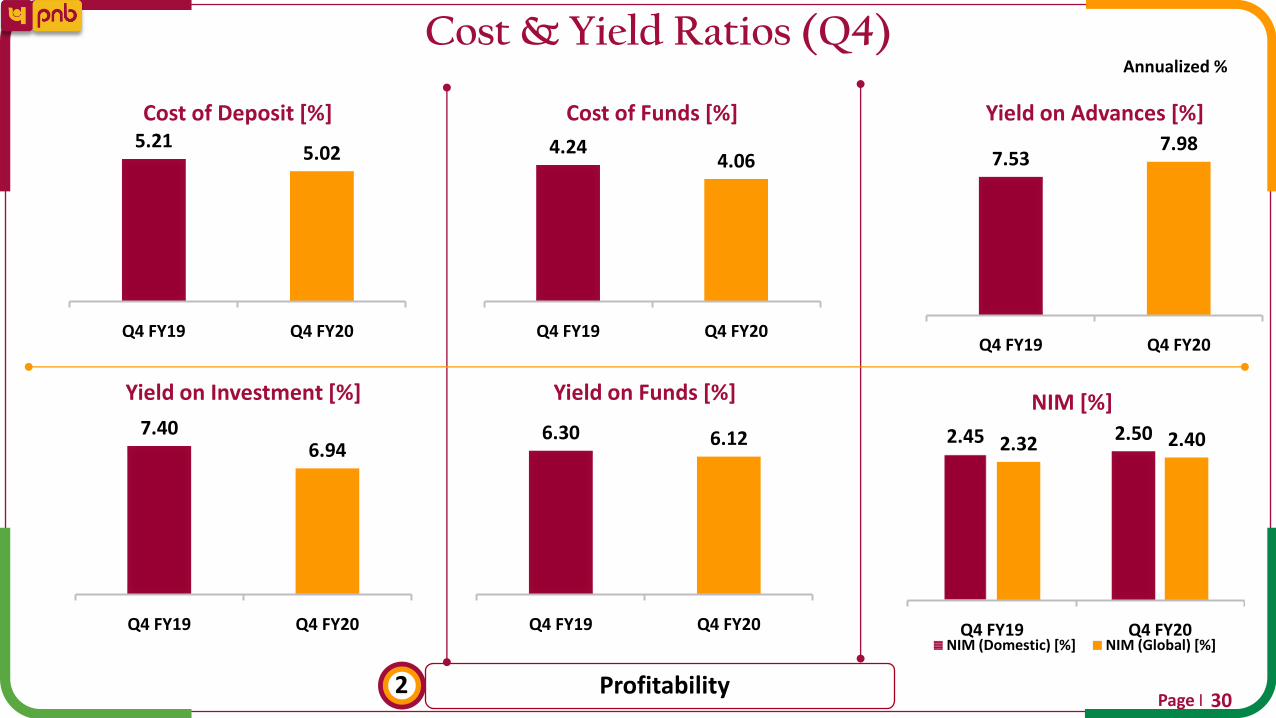
Cost & Yield Ratios (Q4)
Profitability2
7.537.98
Q4 FY19 Q4 FY20
Yield on Advances [%]
6.30 6.12
Q4 FY19 Q4 FY20
Yield on Funds [%]
7.406.94
Q4 FY19 Q4 FY20
Yield on Investment [%]
4.244.06
Q4 FY19 Q4 FY20
Cost of Funds [%]
2.45 2.502.32 2.40
Q4 FY19 Q4 FY20
NIM [%]
NIM (Domestic) [%] NIM (Global) [%]
5.215.02
Q4 FY19 Q4 FY20
Cost of Deposit [%]
30
Page I
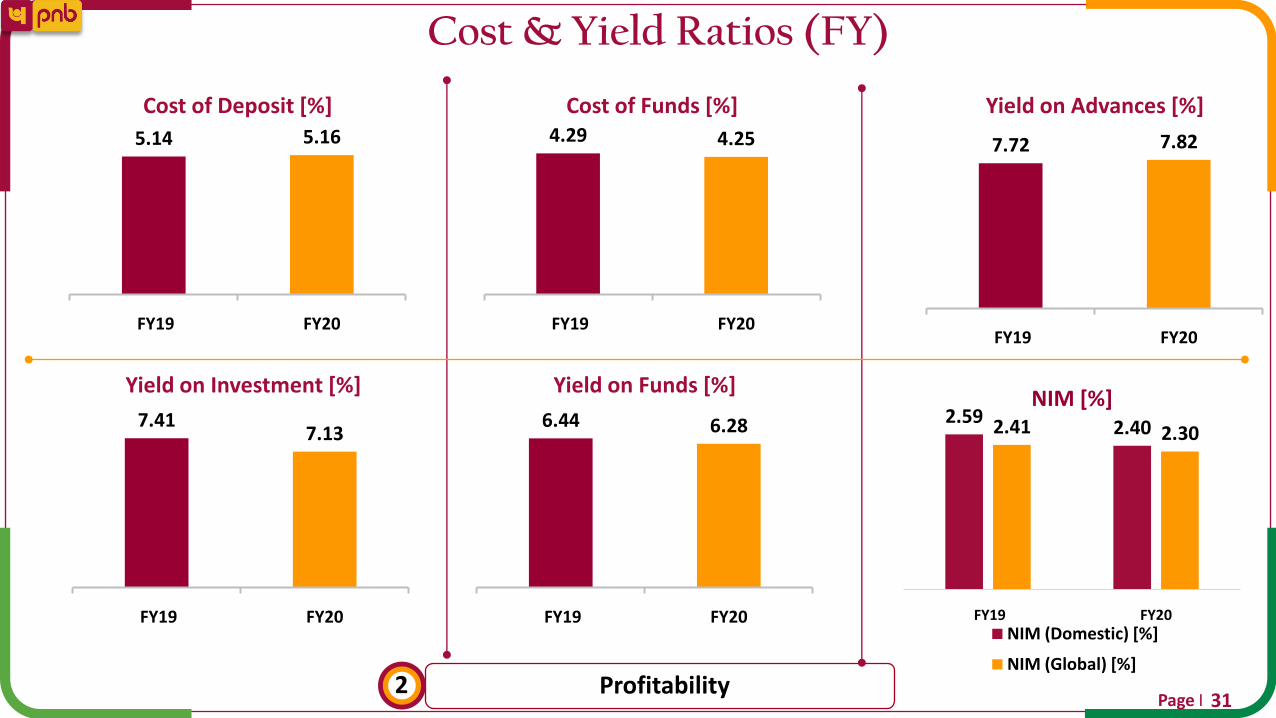
Cost & Yield Ratios (FY)
Profitability231
7.72 7.82
FY19 FY20
Yield on Advances [%]
6.44 6.28
FY19 FY20
Yield on Funds [%]
7.417.13
FY19 FY20
Yield on Investment [%]
4.29 4.25
FY19 FY20
Cost of Funds [%]
2.592.402.41 2.30
FY19 FY20
NIM [%]
NIM (Domestic) [%]
NIM (Global) [%]
5.14 5.16
FY19 FY20
Cost of Deposit [%]

Page I
Productivity
Profitability2
Sl. Parameters Mar’18 Mar’19 Mar’20
1 Business per Employee 1473 1680 1821
2 Business per Branch 14624 15650 16259
3 Operating Profit per Employee 14.84 19.96 23.44
4 Operating Profit per Branch 147 186 209
in lakhs
32

Crore
Page I
Asset Quality Classification: Advance
Asset Quality 3
Sl. ParametersMar’18 Mar’19 Mar’20 YoY Variation
O/S Share% O/S Share% O/S Share% Amt. Var. %
1 Standard 384677 81.6 427722 84.5 443450 85.8 15728 3.7
2 Gross NPA 86620 18.4 78473 15.5 73479 14.2 -4994 -6.4
2a Sub-Standard 22289 4.7 14053 2.8 12532 2.4 -1521 -10.8
2b Doubtful 51708 11.0 51657 10.2 50291 9.7 -1366 -2.6
2c Loss 12623 2.7 12763 2.5 10656 2.1 -2107 -16.5
Total Advances(1+2) 471297 100 506194 100 516929 100.0 10735 2.1
33

Crore
Page I
Movement of NPA
Asset Quality3
Sl. Parameters Mar’19
(Q4FY19)Dec’19
(Q3FY20)Mar’20
(Q4FY20)FY19 FY20
1 NPA as at the beginning of Year 77733 79458 76809 86620 78473
2 -Cash Recovery 2518 5043 2922 12165 10782
3 -Up-gradation 1064 1601 1121 3633 1598
4 -Write Off 2981 3403 4308 12253 13365
5 Total Reduction (2+3+4) 6562 10047 8351 28051 25745
6 Fresh Addition 7302 7398 5020 19904 20751
-Fresh slippages 6710 6783 3850 16616 18235
-Debits in existing NPA A/cs 592 615 1170 3288 2516
7 Gross NPAs at end of the period 78473 76809 73479 78473 73479
8 Eligible Deductions incl. Provisions 48435 46290 46260 48435 46260
9 Net NPAs 30038 30519 27219 30038 27219
10 Recovery in written-off A/cs 545 1194 1006 1808 3095
34

Page I
NPA Ratios
Asset Quality3
Sl. Parameters Mar’18 Mar’19 Dec’19 Mar’20
1 Gross NPA (%) 18.38 15.50 16.30 14.21
2 Net NPA (%) 11.24 6.56 7.18 5.78
3 Provision Coverage Ratio (%) 58.42 74.50 75.27 77.79
4 Provision Coverage Ratio (%) (Exc TWO) 43.80 61.72 60.27 62.96
5 Credit Cost (%) 7.38 5.18 2.59 2.86
35

Crore
Page I
Movement of Std. Restructured Advances
Asset Quality3
Sl Parameter Mar’18 Mar’19 Mar’20
A Opening Balance 11932 5235 3102
B Total Addition 476 675 1246
1 Fresh Restructuring 319 565 1176
2 Up-gradation 156 110 70
C Reduction 7173 2808 851
1 In eligible 1038 2056 504
2 Down-gradation to NPA 4169 629 321
3 Exit/Failure 1966 123 26
Closing Balance (A+B-C) 5235 3102 3497
36

Crore
Page I
Sector wise Std. Restructured
Asset Quality3
Sl. Parameter Mar’18 Mar’19 Mar’20
A Retail Loans - - -
B Agriculture & Allied 1374 1360 1268
C MSME 277 622 1762
D Corporate & Others 3584 1120 467
Total 5235 3102 3497
37

Crore
Page I
Exposure to NCLT accounts: 31st Mar 2020
Asset Quality3
5654 3964
34638
7054
51309
100.0% 94.9% 88.1% 95.3% 90.9%
-10000.0%
-8000.0%
-6000.0%
-4000.0%
-2000.0%
0.0%
0
10000
20000
30000
40000
50000
RBI 1 List RBI 2 List Account Filed by PNB and Admitted
Accounts Filed by Other Banks / FI / Operational Creditors
Total
O/S AmountProvision Coverage (%)
Sl. Parameters Accounts Balance Provision PCR%
1 RBI list 1 5 5654 5654 100
2 RBI list 2 11 3964 3761 95
3 Filed by other Lenders 239 34638 30521 88
4 Filed by PNB 80 7054 6722 95
5 Total 335 51309 46657 91
38

Crore
Page I
NPA classification: Industry wise
Asset Quality3
Sl. ParametersMar’18 Mar’19 Mar’20 YoY variation
GNPA GNPA% GNPA GNPA% GNPA GNPA% Amount
1 Food Processing 2378 22.1 2041 20.2 1945 18.9 -96
2 Textiles 1787 17.4 1762 19.0 1844 23.6 82
3 Chemical & Chemical Products 959 15.1 883 18.4 539 3.1 -344
4 Cement & Cement Products 822 54.5 896 54.3 108 10.8 -788
5 Basic Metal & Metal Products 16341 61.4 10738 48.3 6745 26.3 -3993
-Iron & Steel 15657 64.2 10027 49.6 6110 25.7 -3917
6 Paper & paper products 318 25.4 169 15.6 102 10.9 -67
7 Petroleum 22 0.3 354 4.9 351 7.7 -2
8 Engineering 2064 42.2 1900 43.5 1802 45.7 -97
9 Vehicles & Vehicle parts 98 14.8 421 40.0 101 13.3 -321
10 Construction 1077 28.2 678 26.3 419 31.5 -259
11 Infrastructure 22295 31.6 18246 25.1 16239 22.6 -2007
-Power 13642 41.9 11346 30.9 8183 25.5 -3163
-Tele-Communication 4005 33.7 4674 33.2 3677 27.8 -997
-Roads & Ports 2483 13.6 1204 7.5 3674 16.9 2470
-Others 2165 27.8 1022 17.7 705 14.3 -317
12 Others 14111 46.5 12626 41.3 11375 36.0 -1251
Total 62272 35.5 50714 30.3 41569 23.4 -9144
39

Crore
Page I
NPA Classification: Sector Wise
Asset Quality3
Sl. ParametersMar’18 Mar’19 Mar’20
O/S GNPA GNPA%Slippages
(Q)O/S GNPA GNPA%
Slippages (Q)
O/S GNPA GNPA%Slippages
(Q)
1 Global Gross Advances 471297 86620 18.3 30377 506194 78473 15.5 6710 516929 73479 14.2 3850
2Overseas Advances (Gross)
42831 2772 6.4 382 16382 1748 10.7 0 21883 2792 12.8 0
3 Domestic Advances 428466 83848 19.6 29996 489812 76724 15.7 6710 495045 70686 14.3 3850
3a Retail Loans 62336 2971 4.8 869 78656 3033 3.9 429 83479 3479 4.2 428
3b Agriculture & Allied (PS+NPS)
90009 9890 11.0 1973 100120 11928 11.9 2186 86121 13464 15.6 376
3c MSME 81502 13243 16.2 4446 79037 13878 17.6 1878 70541 13798 19.6 1982
3d Corporate & Others 194619 57744 29.7 22708 231999 47885 20.6 2217 256390 39946 15.7 1064
40

Crore
Page I
Retail Sector NPA
Asset Quality3
Sl. Parameters
Mar’18 Mar’19 Mar’20
O/S GNPA GNPA% O/S GNPA GNPA% O/S GNPA GNPA%
1 Total Retail Credit 62336 2971 4.8 78656 3033 3.9 83479 3479 4.2
of which
2 Housing 36003 1449 4.0 44874 1531 3.4 51267 1849 3.6
3 Mortgage 6220 289 4.6 8150 305 3.7 9191 328 3.6
4 Car/Vehicle 5934 371 6.2 5745 372 6.5 5480 396 7.2
5 Education 5220 726 13.9 5586 695 12.4 5843 775 13.3
6 Others 8958 136 1.5 14300 130 0.9 11697 132 1.1
41

Crore
Page I
Position of SMA 2
Asset Quality3
Parameter Mar’19 Jun’19 Sep’19 Dec’19 Mar’20
SMA2 14120 24650 21165 19361 9608
SMA2 as % to Dom. Advances
2.8 5.3 4.5 4.3 1.9
42

Crore
Page I
Exposure to NBFC as on 31.03.2020
Asset Quality3
19744
13564
20898
1
NBFC Portfolio
Backed by large Pvt. Sector Institutions
Public Sector/ Govt. account
Pvt. Sector 31902
22304
1
NBFC Breakup
Others HFC
54206
47%
3%
50%
Housing Finance
Backed by large Pvt. Sector Institutions
Public Sector/ Govt. account
Pvt. Sector
29%
40%
30%
Others
Backed by large Pvt. Sector Institutions
Public Sector/ Govt. account
Pvt. Sector
External Rating wise portfolio
NBFC O/S % Share
AAA 34764 64.2%
AA 14244 26.3%
A 2788 5.1%
BBB & Below 2410 4.4%
Total 54206 100%
54206
43

Crore
Page I
Telecom Sector as on 31.03.2020
Asset Quality3
Telecom Classification
7537
2017
External Rating Std Portfolio
A & Above
BBB
3677
9554
1
NPA STD
2343
10888
1
PSU Pvt.
13231
44

Crore
Page I
Power Sector as on 31.03.2020
Asset Quality3
23889
8183
1
Power Classification
Standard NPA
32072
8277
15612
Standard Breakup
Public Private
70%
19%
2%8%
External Rating of standard portfolio
A & Above BBB, BB & B C & D Unrated
45

Crore
Page I
External Rating Outstanding Portfolio
Asset Quality3
Sl Rating Grade Mar’18% Share Mar’18
Mar’19% Share Mar’19
Mar’20% Share Mar’20
1 AAA & AAA+ 40676
47.8%
65839
59.8%
79873
68.3%2 AA 18596 36886 39118
3 A 18512 22393 23666
4 BBB 27872 17.1% 24597 11.8% 21743 10.4%
5 BB 19221
17.4%
12713
8.3%
14828
10.9%6 B 8880 4403 7770
7 C 240 198 111
8 D 10296 6.3% 6017 2.9% 4247 2.0%
9 Unrated 18475 11.4% 36176 17.3% 17434 8.4%
Total 162769 100% 209222 100% 208790 100%
46

Page I
Portfolio: Rating Wise
Asset Quality3
64.9
71.6
78.7
23.7
11.2 12.911.417.3
8.4
Mar'18 Mar'19 Mar'20
External Rating O/S Standard Portfolio
BBB & Above BB & Below Unrated
65.2
75.0 77.0
34.8
25.0 23.0
Mar'18 Mar'19 Mar'20
Risk Weight wise Portfolio
Below 100% >=100%
Exposure after risk mitigation
(in %)
47

Crore
Page I
Capital Adequacy (Basel III)
Capital & Share Holding4
Sl. Parameters Mar’18 Mar’19 Mar’20
1 Tier I 32267 30309 49108
Common Equity 26971 25107 44116
Additional Tier I 5296 5202 4992
2 Tier II 9413 9057 9226
3 Total (Tier I+II) 41680 39366 58334
4 Risk-weighted Assets 453070 404622 412628
1 Tier I % 7.12 7.49 11.90
Common Equity % 5.95 6.21 10.69
Additional Tier I % 1.17 1.29 1.21
2 Tier II % 2.08 2.24 2.24
3 Total (Tier I+II) % 9.20 9.73 14.14
48

Crore
Page I
Capital Optimization
Capital & Share Holding4
Sl. Parameters Mar’19 June’19 Sep’19 Dec’19 Mar’20
1 Credit RWA (Includes NFB RWA) 331929 329591 329747 334769 334835
Of which Credit RWA (FB) 264271 259531 250141 254057 254547
2 Market RWAs 34382 34019 38296 36867 37771
3 Operational RWAs 38310 40022 40022 40022 40022
4 Total RWAs 404621 403632 408065 411658 412628
5 Global Credit Exposure 602905 568782 584920 580063 631290
6 Credit Exposure (Domestic FB) 528134 492537 498158 500254 543398
7 RWA/Advances 67.11% 70.96% 69.76% 70.97% 65.36%
8 Credit RWA Density (Domestic FB) 50.0% 52.7% 50.2% 50.8% 46.8%
9 Total NFB O/S 56520 55802 54620 63442 66940
10 NFB RWA 21070 22977 23859 23755 24592
11 Leverage Ratio 3.72% 3.89% 5.95% 5.73% 5.82%
49

Page I
Share holding Pattern
Capital & Share Holding4
83.2%
5.6%
2.3%5.7%
2.2% 1.1%
Mar‘20
Govt. of India FIs/Banks/Insurance Mutual Funds
Resident Individual FIIs Non-institutions
50

Page I
PNB One: ‘One for All’ ‘All for One’
Digitalization & Financial Inclusion5
Interactive
Interface
Scan and Pay
through QR
Code
Simplified
Dashboard to
manage key
Banking
Activities
Value Added
Services with
Complaint
Service
Management
Pay
Bills/Recharge
Available in
English and
Hindi
Manage Debit
and Credit
Card
Bio-metric
authentication
for greater
Security
Unified Mobile application with advanced features
51

Page I
Expanding Digital Footprints
Digitalization & Financial Inclusion5
Users Crossed179.51 Lakh YoY Gr: 13.5%
Internet Banking
Total issued346663
Credit Card
Total Installed170334YoY Gr: 141%
Bharat/BHIM QR Code
Total Installed86823YoY:21.65%
PoS
Digital Solution in Villages without internet connectivity
PNB E-Rupaya
43.68 CroreYoY Gr 150%
UPI txns
PNB’s Instant Help for yoUAvailable on IBS & MBS
PIHU
52

Page I
Transactions
Digitalization & Financial Inclusion5
Sl.Parameters
Q4 FY’19 Q4 FY’20
Transaction (in lakhs)% Share to Total
TransactionTransaction (in lakhs)
% Share to Total Transaction
1 ATM 830 17.6 893 13.7
2 POS 76 1.6 471 7.2
3 Internet Banking 47 1.0 60 0.9
4 Mobile Banking 7 0.1 12 0.2
5 UPI 801 17.0 1370 21.1
6 IMPS 22 0.5 29 0.4
7 RTGS & NEFT 149 3.2 147 2.3
8 Cash Deposit Kiosk 59 1.3 56 0.9
Total ADC (1 to 8) 1991 42.2 3038 46.7
9 Branches & Others 2727 57.8 3465 53.3
Total Transaction 4718 100.0 6503 100.0
53

Page I
Alternate Delivery Channels
Digitalization & Financial Inclusion5
41%
32%
27%
Transaction share%
Digital Transaction ATM Withdrawl
Other Transaction
73% of financial transactions are through ADC in FY20 Transactions on various digital channels
2.47 0.46
9.55
21.37
53.55
1.243.46
0.94
6.71
0.24
Internet Banking
Mobile Banking
AEPS
Debit Card
UPI
IMPS
NACH
Credit Card
NEFTR/RTGS
Others
54

Page I
Social Media Presence
Digitalization & Financial Inclusion5
9.24 lakhs 52093 150572
3224322100
55

Page I
Pan India Presence
Digitalization & Financial Inclusion556
1273/1726
103/149
246/408
338/421
680/668
515/726
184/161 295/462
514/614
207/725
579/695
120/211
126/243
173/258
236/380
72/94
63/9085/101
179/255164/212
3/2
63/80
13/7
3/51/1
5/6
2/1
273/393
3/3
7/12
4/4
1/1
1/1
30/51
No. of Branches/ No. of ATMs6563/ 9168
2/2
37
25
20
18
RuralSemi-UrbanUrbanMetro
Population Group wise Break up of Dom. branches
ATM9168
Branches6563Other Offices477
BCs7500

Page I
Financial Inclusion : Profitable Business Proposition
Digitalization & Financial Inclusion5
23972891
Mar'19 Mar'20
PMJDY Avg. BalanceAmt. in ₹
231247
Mar'19 Mar'20
No. of DBT Txns (Quarterly)
No. in Lakhs
Sl. Jansuraksha Schemes Enrollment Up To Mar’19 Mar’20
1 Pradhan Mantri Jeevan Jyoti Bima Yojana 15.7 17.5
2 Pradhan Mantri Suraksha Bima Yojana 69.6 74.0
3 Atal Pension Yojana 4.1 5.1
No. in Lac
198 200
Mar'19 Mar'20
PMJDY AccountsNo. in Lakhs
3334
4269
Mar'19 Mar'20
Deposit Mobilized by BCsAmt. in ₹ Crore
57

Page I
Covid-19 Measures taken to proactively manage risks
Way Forward6
Credit Risk Rating Models Scoring Models
Early Warning Signals Credit Policy
Key focus area: Use of In-house developed Credit Risk RatingModels for independent risk assessment for CorporateBorrowers
Covid Response/ Readiness: Dynamic Review Rating ofBorrowers/Industries impacted due to Covid -19 pandemic tocapture increased riskiness in the portfolio.
Key focus area: Use of In-house developed Scoring Models forRetail/MSME/Farm Sector for independent risk assessment forRetail Borrowers.
Covid Response/ Readiness: Bureau scores impact taken intoScoring Models for tracking delinquencies/new enquires.Behaviour Score Model is in place for assessing impact ontransactional behavior changes
Key focus area: Use of In-house developed Early warning Signal +Preventive Monitoring System to address the issue of monitoringof causes of build-up of stress in assets.
Covid Response/ Readiness: The system covers comprehensive127 early warning signals including 42 RBI prescribed signals forcapturing build up stress in borrowers due to Covid-19 pandemic.
Key focus area: Lending in Thrust Areas i.e.Retail, Segment, Priority Sector & MSMEs
Covid Response/ Readiness: Readiness to support economicreversal and growth.
58

Page I
Readiness during COVID-19
Way Forward6
Employees
• Quick Response Team created atdifferent level to deal withsituation.
• Staggered working hours andWork from Home were exercisedwherever feasible.
• Person with disabilities wereexempted for physically attendingoffices.
• Compensation to staff in case ofuntimely Death due to Covid.
Operations
Bank’s operations were intact duringlockdown• 94% branches were operational*
(on any given day)
• 90% ATMs were operational*(on any given day)
• Alternate Digital Channels werefully operational.
• Extensive use of VideoConferencing for internaloperations.
*Closure due to declaration of containmentzone/strict lockdown by authorities.
Customers
Special Credit Scheme:• Guaranteed emergency credit
Loan/Covid-19 Emergency CreditFacility/liberalized working capitalassessment.
• PNB Kisan Tatkal Rin Yojana: Aninstant credit for farmingcommunity
• SHG Covid Tatkal Sahayata Rin.• Personal Loan Scheme for Public
(PNB Sahyog COVID) and forPensioners (PNB Aabhar COVID)for meeting emergentconsumption or medical needbecause of COVID 19 outbreak.
• Rs. 17000 crore loan sanctionedrelated to COVID-19.
.
59

Page I
New FinTech Initiatives
Way Forward6
Alliance Partners
Thumb work Technologies:Walnut: Expense Manager which also facilitates fund transfer via
PNB UPI services.UPI handle: pnbpay
Oracle: Chatbot Solution: PIHU integrated with PNB Net Banking and PNB ONE to resolve customer
queries.
India Innovation (KITE): PNB KITE: Co branded Prepaid Card with two
flavors i.e. Corporate Card and Gift Card
NSCSPL (E Rupaya): Closed group card setup for small transactions.
It can work in offline mode.
60

Page I
Use of Data Analytics
Way Forward661
Business growth through targeted leads for financial products
Predictive Analytics
To develop Early Warning System using Machine Learning algorithms in the areas of
Operations, Risk, Products and Processes using transactional and behavioral analytics.
Sales Targeting
Process Improvisation
Use of Enriched
Data
Preventing Revenue Leakages by improving process
Transaction Analysis
Targeted potential leads for Cross / Up Sell of Retail, wealth management products and Credit Cards to 8.75 lakh individual customers who received Income
Tax Refund during FY 2018-19 and 2019-20
Potential Takeover leads of Housing loans for Rs. 25980 Cr
using CICs drawn by the branches during last 2 years
Fraud Risk Management
Deploy Dynamic Risk rating models using external data sources and manage fraud risk through advanced
analytics solution.

Crore
Page I
Performance of Subsidiaries, Joint Venture and Associates
62Subsidiaries, JVs, Associates & RRBs8
Type Name of the entityCountry of
IncorporationProportion of Ownership%
ResultsFY/9M
Total Income
Total Expenses
GrossProfit
Net Profit
Associates PNB MetLife India Insurance Co. Ltd India 30.00 Mar-20 (12M) 5834 5740 94 93
Associates PNB Housing Finance LTD India 32.65 Mar-20 (12M) 8490 7679 811 646
Subsidiaries PNB (International) Ltd. UK 100 Mar-20 (12M) 354 227 127 21
Subsidiaries PNB Gilts Ltd. India 74.07 Mar-20 (12M) 883 552 331 186
Subsidiaries PNB Investment Services Ltd. India 100 Mar-20 (12M) 8 7 1 1
Subsidiaries Druk PNB Bank Ltd. Bhutan 51.00 Dec-19 (12M) 120 95 25 19
JV Everest Bank Ltd. Nepal 20.03 July 19 - April-20 (9M) 248 173 75 53
Associates JSC Tengri Bank. Kazakhstan 41.64 Dec-19 (12M) 243 257 23 -14
RRBs Consolidated 35.00 Mar’20 (FY) 7183 6981 1368 141

Crore
Page I
PNB MetLife Finance Ltd
Subsidiaries, JVs, Associates & RRBs763
Parameter FY2019 Q4-2019 Q3-2020 Q4-2020 FY2020
Total Income 6367 2346 1862 1136 5834
Total Expenses 6215 2273 1833 1088 5740
Operating profit 152 73 29 48 94
Net Profit 143 73 29 48 93
Capital adequacy ratio/
Solvency Ratio197% 197% 197% 189% 189%

Crore
Page I
PNB Housing Finance LTD
Subsidiaries, JVs, Associates & RRBs764
Parameter FY2019 Q4-2019 Q3-2020 Q4-2020 FY2020
Loans and advances 74288 74288 69194 66628 66628
Deposits 14023 14023 16470 16132 16132
Capital adequacy ratio 13.98 13.98 17.06 17.98% 17.98%
Total Income 7683 2148 2075 1952 8490
Total Expenses 5949 1603 17772279 7679
Operating profit 1734 545 298 -327 811
Net Profit 1192 380 237 -242 646

Crore
Page I
PNB (International) Ltd.
Subsidiaries, JVs, Associates & RRBs765
Parameter FY'2019
(Audited)Q4'2019 Q3'2020 Q4'2020
FY'2020
(Unaudited)
Loans and advances 6339 6339 6512 6399 6399
Deposits 5003 5003 5266 5124 5124
Capital adequacy ratio 29.63 29.63 29.43 29.82 29.82
Total Income 323 82 56 148 354
Total Expenses 209 34 60 57 227
Operating profit 114 48 -4 91 127
Net Profit 58 56 -9 16 21

Crore
Page I
PNB Gilts Ltd.
Subsidiaries, JVs, Associates & RRBs766
Parameter FY2019 Q4-2019 Q3-2020 Q4-2020 FY2020
Total Income 508 146 217 276 883
Total Expenses 425 124 147 144 552
Operating profit 83 22 70 132 331
Net Profit 53 -8 57 99 186
Capital adequacy ratio 36.58% 36.58% 25.18% 32.66% 32.66%

Crore
Page I
PNB Investment Services Ltd.
Subsidiaries, JVs, Associates & RRBs767
Parameter FY2019 Q4-2019 Q3-2020 Q4-2020 FY2020
Total Income 8.70 2.54 3.60 1.31 7.47
Total Expenses 6.29 1.65 1.52 1.89 6.71
Net interest income 2.90 0.70 0.67 0.72 2.81
Operating profit 2.41 0.89 2.08 -0.58 0.76
Net Profit 1.75 0.09 1.74 -0.48 0.57

Crore
Page I
Druk PNB Bank Ltd.
Subsidiaries, JVs, Associates & RRBs768
ParameterFY'2018 (Jan-Dec) (Audited)
Q4'2018 (Oct-Dec)
Q3'2019 (July-Sept)
Q4'2019 (Oct-Dec)
FY'2019 (Jan-Dec)(Audited)
Loans and advances 847 847 976 1091 1091
Deposits 1251 1251 1425 1430 1430
Capital adequacy ratio 17.97% 17.97% 14.89% 12.57% 12.57%
Total Income 101 29 31 30 120
Total Expenses 67 20 21 30 95
Operating profit 34 9 10 -0.46 25
Net Profit 23 6 3 0.22 19

Crore
Page I
Everest Bank Ltd
Subsidiaries, JVs, Associates & RRBs7
Parameter FY2019(16.07.2018-15.07.2019)
Q4-2019(16.04.2019-15.07.2019)
Q3-2020(16.01.2019-
15.04.2020)
Loans and advances 6987 6987 7417
Deposits 8136 8136 8863
Capital adequacy ratio 13.74 13.74 12.63
Total Income 903 246 248
Total Expenses 631 172 173
Operating profit 272 74 75
Net Profit 191 52 53
69
Crore
Page I
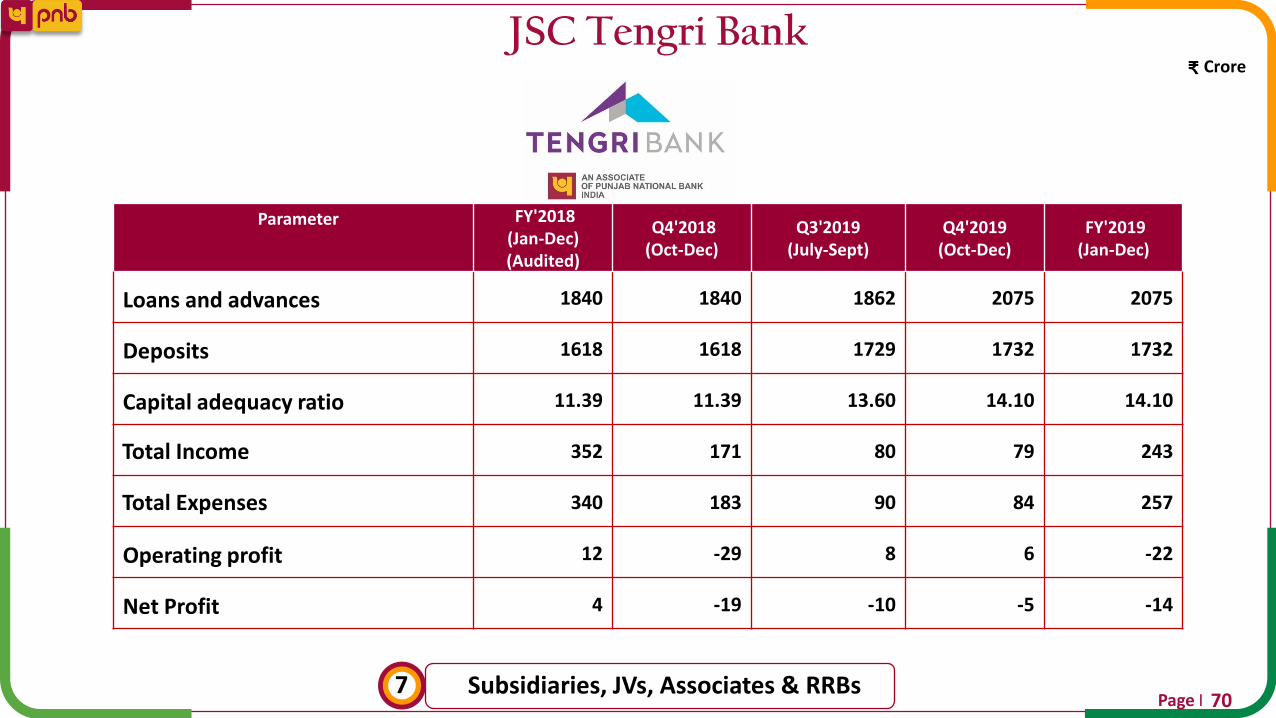
JSC Tengri Bank
Subsidiaries, JVs, Associates & RRBs770
Parameter FY'2018 (Jan-Dec) (Audited)
Q4'2018 (Oct-Dec)
Q3'2019 (July-Sept)
Q4'2019 (Oct-Dec)
FY'2019 (Jan-Dec)
Loans and advances 1840 1840 1862 2075 2075
Deposits 1618 1618 1729 1732 1732
Capital adequacy ratio 11.39 11.39 13.60 14.10 14.10
Total Income 352 171 80 79 243
Total Expenses 340 183 90 84 257
Operating profit 12 -29 8 6 -22
Net Profit 4 -19 -10 -5 -14

Crore
Page I
Performance of RRB
Subsidiaries, JVs, Associates & RRBs7
Consolidated Position FY2019 Q4-2019 Q3-2020 Q4-2020 FY2020
Loans and advances 41683 18407 16709 18843 44200
Deposits 60804 29186 30059 30986 69452
Capital adequacy ratio 5.9 5.9 5.7 5.04 5.04
Total Income 6418 1559 1708 1887 7183
Total Expenses 6920 2128 1595 2021 6981
Operating profit 1017 137 191 444 1368
Net Profit -418 -602 72 -86 141
RRBs: 1.DBGB: Dakshin Bihar Gramin Bank, Patna2.SHGB: Sarva Haryana Gramin Bank, Rohtak
3.HPGB: Himachal Pradesh Gramin Bank, Mandi4.PGB: Punjab Gramin Bank, Kapurthala5.PUPGB: Prathama Uttar Pradesh Gramin Bank, Moradabad
71

Page I
Summary of Amalgamated Entity8
PNB 2.0 - A New Beginning
72

Page I
Objective with a new beginning
Amalgamation8
Creation of Strong Next-Gen Bank With State-of-the-Art Products and Services
Opportunity to re-engineer its process and strengthen control measures
Cohesive, Customer Friendly and Efficient Bank with Strong And Stable Footing
Augmented Capacity, Capability and Reach With Synergistic Benefits
Enhancing Value For Stakeholders
73

Page I
Amalgamation Benefits for Customers
Amalgamation8
Geographical Proximity Products & Services Technology Customer Centricity
1 2 3 4
1. Nationwide reach ofcustomers withincreased number ofBranches/ATMs.
2. Increased number oftouch points enablingtrust building ofcustomers.
1. Organization structurereflecting targetedcustomersegmentation in orderto have dedicated endto end service models.
2. Organization processessupporting a singlewindow for deliveringvalue throughintegrated solutions.
1. Remodeled productswith customers at thecenter of the overallecosystem
2. Product rangeaddressing new ageaspirations of thecustomers
3. Competitive ServiceCharges and Rate ofInterest
1. Best in Class DigitalProducts and Services
2. End to end DigitalJourneys
3. Maximizing AlternativeDelivery Channels forwider outreach ofCustomers.
74

Page I
Amalgamation Benefits for Investors
Amalgamation8
1. Increase in Market Share.2. Increase in Customer Base.
Scalability: Built for future growth
1. Stronger Balance Sheet & controls.2. Better risk rating curves given large
scale, more experience and bettermodels.
Span of Control
1. Increase in operational efficiency byreducing cost of lending.
2. LEAN and efficient operations
Operational Efficiency
1. Increase in Brand Value.2. Enhanced global competitiveness.
Enhanced Brand Name
1. Improvement in financials on Supplementary segments i.e. Netting off of CD Ratio of eUNI & eOBC to the levels of PNB, thus reducing Cost of Funds for eOBC & Increasing Return on Assets for eUNI segment.
Improved Financials
Harmonization and Rationalization of:1. Branches2. ATMs3. Vendors4. Softwares5. Fixed Assets6. Systems
Reduced Costs
75

Page I
PNB 2.0 and Way Forward
Amalgamation876
1
ORGANISATION STRUCTURE: For improving operational efficiency: HO Divisions have been reorganized.
Number of Zones & Circles has been increased to 24 and 161 respectively.
2
VERTICALIZATION: Different business and control functions have been segregated and made part of the verticals for creating focused approach for business
development and improving customer service.
3
CREDIT DELIVERY MODEL: It is structured in 4 tiers model:1. 23 LCB/ELCBs for focus on Accounts above Rs. 50
Cr. 2. 116 MCCs for accounts above Rs. 1 cr to upto Rs. 50 Cr. 3. 135 PNB Loan Point (RAM/ iRAM) for
Retail, Agriculture and MSME credit from above Rs.10 lac to upto Rs. 1 Cr. 4. General Banking Branches.
4
CUSTOMER ACQUISITION CENTRES: 50 Customer Acquisition Centres operationalized for focusing on
liability business from Corporates, Institutions, HNIs, NRIs including Wealth
Management and Retail Business.
5
SASTRA: Separate vertical for Focused Recovery & Resolution of NPA accounts formed at field level for
focused Recovery & Resolution action. 161 Circle SASTRA & 24 Zonal SASTRA Centres being opened for
the same.
6 ZONAL RISK MANAGEMENT CENTRE: Created 24 centers to completely segregate Risk Assessment.
7
CULTURAL SURVEY: A cultural survey is designed to understand sentiments of employees about
organization culture and bring in the desired cultural elements to life in the amalgamated entity.
8PNB 2.0 ROLL OUT: Going live with Functioning of
different verticals and new organization structure from 01/07/2020.

Page I
Pan India Presence PNB 2.0
Amalgamation877
1778/2246
122/107
330/494
372/453
1088/1066
759/966
287/250387/535
783/852360/899
723/826
232/281
199/304
371/450
420/551
140/194
134/167164/185
276/345200/243
8/4
329/387
29/17
68/939/10
23/29
5/4
1218/1429
10/10
19/23
8/11
3/3
2/2
4/3
46/91
No. of Branches / No. of ATMs10910 / 13530
ATM13530
Branches10910Other Offices(1012)
BCs12733
4/4

Page I
Dominant Presence: PNB 2.0
Amalgamation878
3533, [PERCENTAGE]
2694, [PERCENTAGE]
2558, [PERCENTAGE]
922, [PERCENTAGE]
735, 7%
468, [PERCENTAGE]
Geographic Region wise Branch DistributionTotal Branches: 10910
Northern Region
Central Region
Eastern Region
Western Region
North Eastern Region
Southern Region

Page I
Market Share of Branches: PNB 2.0 vis-à-vis SCBs
Amalgamation8
States PNB 2.0
Northern Region 13.0
Himachal Pradesh 23.0
Punjab 16.7
Haryana 15.5
Chandigarh 11.7
Rajasthan 10.0
NCT of Delhi 10.0
Jammu & Kashmir 7.0
Ladakh 5.9
Central Region 10.4
Uttarakhand 15.5
Uttar Pradesh 10.1
Chhattisgarh 7.2
Madhya Pradesh 5.5
States PNB 2.0
Eastern Region 10.3
West Bengal 13.5
Bihar 9.9
Jharkhand 7.5
Odisha 7.3
Sikkim 6.1
Andaman & Nicobar Islands 5.8
Western Region 9.1
Dadra & Nagar Haveli & Daman & Diu 4.5
Gujarat 3.4
Maharashtra 3.2
Goa 2.8
79
State wise Distribution
States PNB 2.0North Eastern Region 7.7
Tripura 12.1
Manipur 11.4
Assam 11.4
Meghalaya 8.1
Arunachal Pradesh 4.9
Mizoram 4.5
Nagaland 2.9Southern Region 2.2
Puducherry 3.1
Kerala 3.0
Telangana 2.7
Tamil Nadu 2.4
Andhra Pradesh 1.9
Karnataka 1.6

Page I
Market Share of ATMs: PNB 2.0 vis-à-vis SCBs
Amalgamation8
25
18
1615 14
1312
11 10 10 109 9 8 8
7 6 6 5 5 5
State wise Distribution % Market share
80

Page I
Greater Management Depth
Amalgamation8
Punjab National Bank 2.0 (PNB, e-OBC, e-UNI) to have better succession planning withwider talent pool and greater management depth
Punjab National Bank 2.0 (PNB, e-OBC, e-UNI)
Staff scale PNB e-OBC e-UNI Total % Share
Officers 31521 13251 7181 51953 50.54
SWO/Clerk 20761 5606 3456 29853 29.04
Sub-Staff 16249 2137 2612 20998 20.42
Total Staff 68531 20994 13279 102804 100.0
68531
20994
13279 102804
PNB e-OBC e-UNI Total
Staff Strength (No.)
81
Staff Strength (No.)

Page I
Advisor and Consultants – on Board
Amalgamation8
Deloitte
Consultant for Financial and Tax due diligence
Cyrill Amarchand Mangaldas
Consultant for legal due diligence
IDBI Capital
Consultant for Fairness Opinion on the Share
Exchange Ratio
S.R. Batilboi & Co.
Consultant for the Enterprise to determine
SWAP ratio
Ernst & Young
Consultant for Overall Amalgamation
Wipro
Consultant for System integrator for EDW
Capgemini
Consultant for Overall IT/ITES Integration and
Migration
82

Page I
Disclaimer
This presentation has been prepared by Punjab National Bank (the“Bank”) solely for information purposes, without
regard to any specific objectives, financial situations or informational needs of any particular person. Except for the
historical information contained herein, statements in this release which contain words or phrases such as
“will”, “aim”, “will likely result”, “would”, “believe”, “may”, “expect”, “will
continue”, “anticipate”, “estimate”, “intend”, “plan”, “contemplate”, “seek
to”, “future”, “objective”, “goal”, “strategy”, “philosophy”, “project”, “should”, “will pursue” and similar expressions or
variations of such expressions may constitute "forward-looking statements". These forward-looking statements involve
a number of risks, uncertainties and other factors that could cause actual results to differ materially from those
suggested by the forward-looking statements. These risks and uncertainties include, but are not limited to our ability to
successfully implement our strategy, future levels of non-performing loans, our growth and expansion, the adequacy of
our allowance for credit losses, our provisioning policies, technological changes, investment income, cash flow
projections, our exposure to market risks as well as other risks. Punjab National Bank undertakes no obligation to
update the forward-looking statements to reflect events or circumstances after the date thereof.
Note: All financial numbers in the presentation are from Audited Financials or Limited Reviewed financials or based on
Management estimates.
83

Page I
Thank You!
84
Related Documents