Q4 Financial Presentation 2017 DOF ASA

Welcome message from author
This document is posted to help you gain knowledge. Please leave a comment to let me know what you think about it! Share it to your friends and learn new things together.
Transcript

Q4 Financial Presentation 2017
DOF ASA

2DOF ASA – Q4 presentation 2017
Highlights Group

DOF ASA – Q4 presentation 2017 3
➢ Refinancing completed in DOF and DOF Subsea:
Private Placement and repair issue NOK 700 million
Extended ownership in DOF Subsea
Extension maturity DOFSUB07
Extension soft terms DOF Rederi and credit facility in DOF
➢ Average utilization fleet 76% in Q4
➢ Skandi Darwin on-hire on a 5-year contract with Shell at the Prelude field in Australia
➢ NOK 5 billion in firm backlog for 2018
All numbers based on management reporting
EBITDA Q4 MNOK 649 (excl hedge accounting)
Highlights
DOF ASA – Q4 presentation 2017
0
500
1000
1500
2000
2012 2013 2014 2015 2016 2017 2019
0
500
1000
1500
2000
2012 2013 2014 2015 2016 2017 2019
~9 vessels in
operation by Q1’19
4
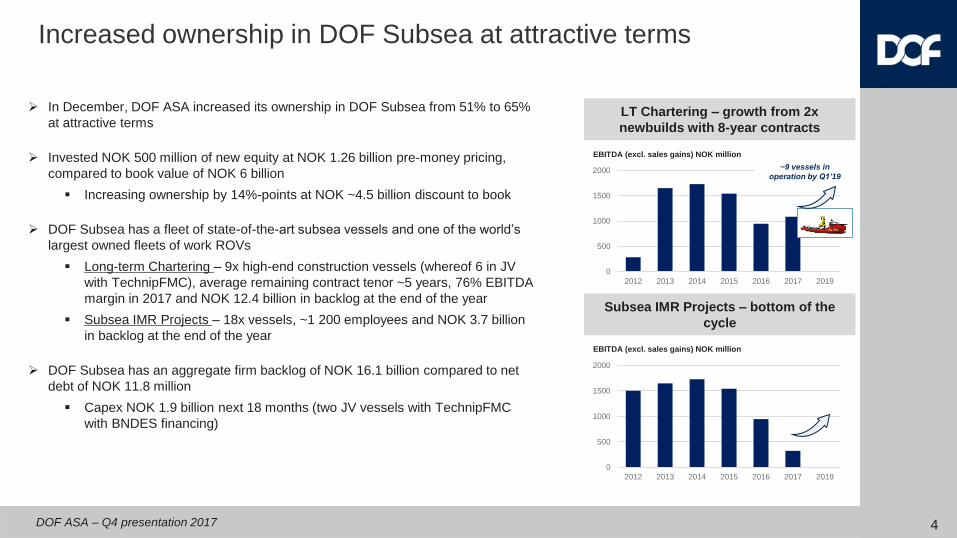
➢ In December, DOF ASA increased its ownership in DOF Subsea from 51% to 65%
at attractive terms
➢ Invested NOK 500 million of new equity at NOK 1.26 billion pre-money pricing,
compared to book value of NOK 6 billion
▪ Increasing ownership by 14%-points at NOK ~4.5 billion discount to book
➢ DOF Subsea has a fleet of state-of-the-art subsea vessels and one of the world’s
largest owned fleets of work ROVs
▪ Long-term Chartering – 9x high-end construction vessels (whereof 6 in JV
with TechnipFMC), average remaining contract tenor ~5 years, 76% EBITDA
margin in 2017 and NOK 12.4 billion in backlog at the end of the year
▪ Subsea IMR Projects – 18x vessels, ~1 200 employees and NOK 3.7 billion
in backlog at the end of the year
➢ DOF Subsea has an aggregate firm backlog of NOK 16.1 billion compared to net
debt of NOK 11.8 million
▪ Capex NOK 1.9 billion next 18 months (two JV vessels with TechnipFMC
with BNDES financing)
LT Chartering – growth from 2x
newbuilds with 8-year contracts
Subsea IMR Projects – bottom of the
cycle
EBITDA (excl. sales gains) NOK million
Increased ownership in DOF Subsea at attractive terms
EBITDA (excl. sales gains) NOK million

DOF ASA – Q4 presentation 2017
Total of 3,953 employees• Subsea employees 1 214
• Supply employees 2 739
Positioned globally✓ Head office in Norway
✓ Operating from 6 continents
✓ 20 offices near key O&G markets
✓ 67 vessels globally
Our vessels and subsea equipment▪ Subsea 31
▪ AHTS 20
▪ PSV 16
▪ Total fleet 67
▪ ROV / AUV 71
DOF ASA, a global player
23 billion backlog
Approx 4 000 employees
67 vessels
55
DOF ASA – Q4 presentation 2017
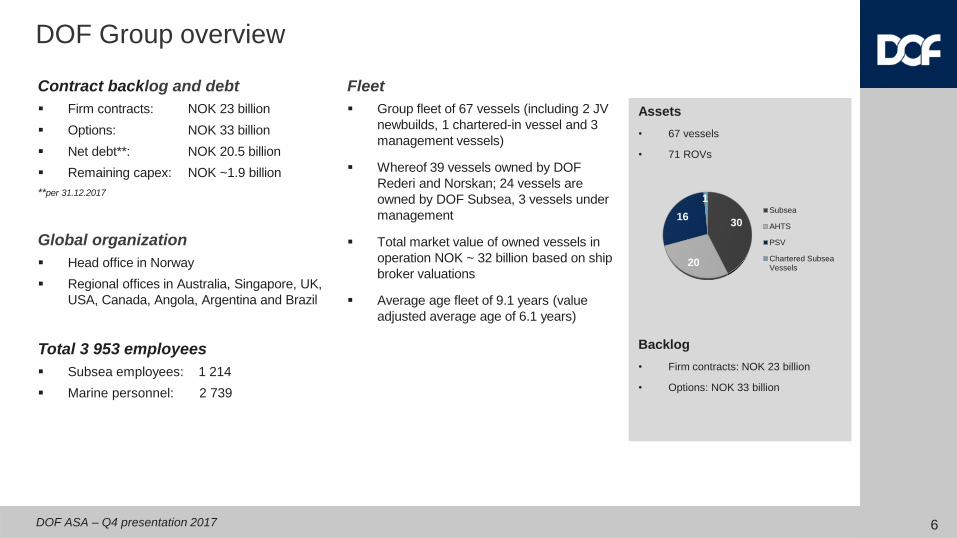
DOF Group overview
Fleet
▪ Group fleet of 67 vessels (including 2 JV
newbuilds, 1 chartered-in vessel and 3
management vessels)
▪ Whereof 39 vessels owned by DOF
Rederi and Norskan; 24 vessels are
owned by DOF Subsea, 3 vessels under
management
▪ Total market value of owned vessels in
operation NOK ~ 32 billion based on ship
broker valuations
▪ Average age fleet of 9.1 years (value
adjusted average age of 6.1 years)
Contract backlog and debt
▪ Firm contracts: NOK 23 billion
▪ Options: NOK 33 billion
▪ Net debt**: NOK 20.5 billion
▪ Remaining capex: NOK ~1.9 billion
**per 31.12.2017
Global organization
▪ Head office in Norway
▪ Regional offices in Australia, Singapore, UK,
USA, Canada, Angola, Argentina and Brazil
Total 3 953 employees
▪ Subsea employees: 1 214
▪ Marine personnel: 2 739
Assets
• 67 vessels
• 71 ROVs
Backlog
• Firm contracts: NOK 23 billion
• Options: NOK 33 billion
30
20
16
1Subsea
AHTS
PSV
Chartered SubseaVessels
6
DOF ASA – Q4 presentation 2017
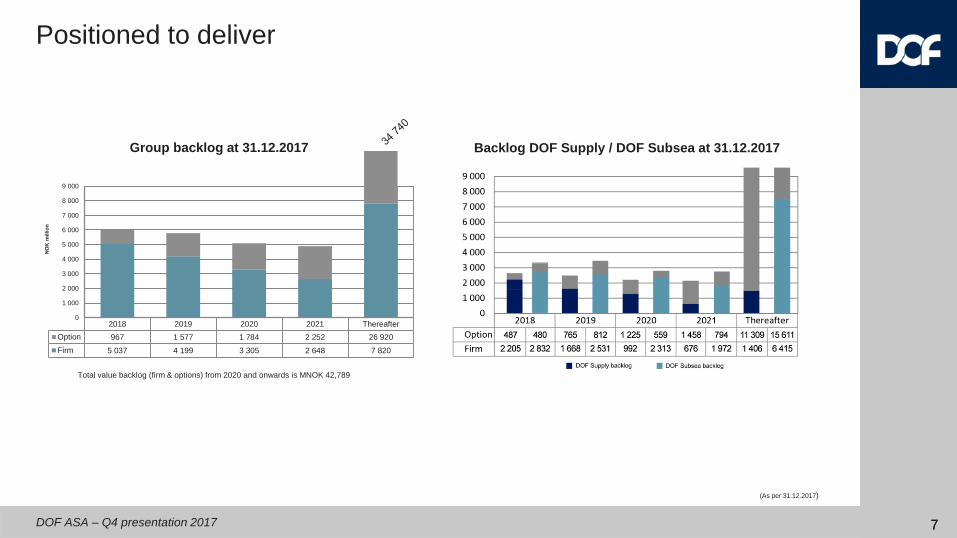
Positioned to deliver
Total value backlog (firm & options) from 2020 and onwards is MNOK 42,789
77
(As per 31.12.2017)
Group backlog at 31.12.2017 Backlog DOF Supply / DOF Subsea at 31.12.2017
2018 2019 2020 2021 Thereafter
Option 967 1 577 1 784 2 252 26 920
Firm 5 037 4 199 3 305 2 648 7 820
0
1 000
2 000
3 000
4 000
5 000
6 000
7 000
8 000
9 000
NO
K m
illio
n

DOF ASA – Q4 presentation 2017
DOF Supply – Highlights Contracts
8
New contracts in the Atlantic region
➢ Skandi Foula (PSV) awarded 2 month contract + option in the Black Sea
➢ Skandi Olympia (RSV) extended with Fugro until September 2018
➢ Skandi Gamma (PSV) extended until March
➢ Skandi Iceman (AHTS) awarded 60 + 40 days in West-Africa securing work parts of the winter season
➢ Skandi Captain (PSV) awarded 1-year contract with Peterson, commencement in February 2018
New contracts in Brazil
➢ 265 days extension Skandi Admiral (AHTS) contract, from June 2018
New contract in the Asia Pacific
➢ Skandi Sotra (PSV) secured 75 days with Chevron in Australia
Vessels sold
➢ Skandi Møgster (AHTS) built in 1998 sold in November
➢ Skandi Marstein (PSV) built in 1996, sold in December
DOF ASA – Q4 presentation 2017
DOF Subsea – Highlights Contracts
9
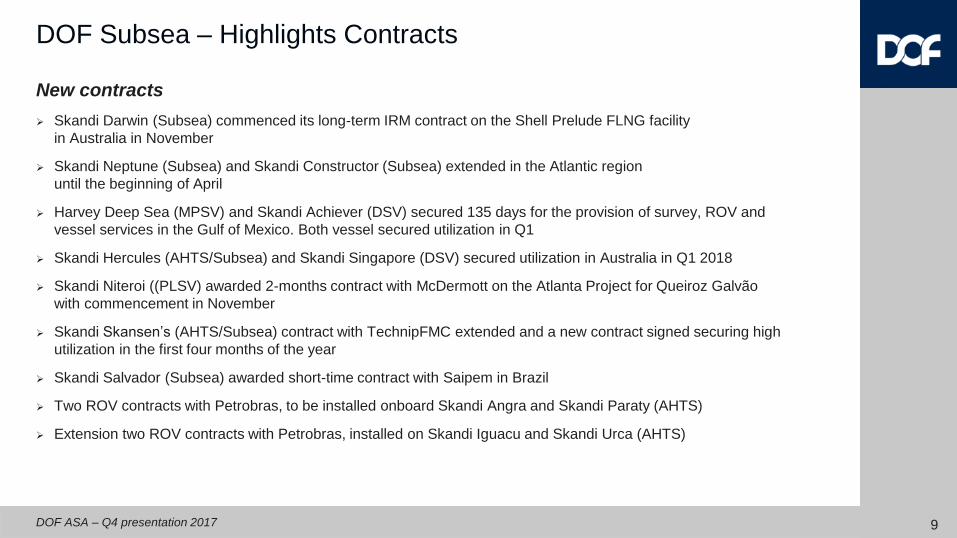
New contracts
➢ Skandi Darwin (Subsea) commenced its long-term IRM contract on the Shell Prelude FLNG facility
in Australia in November
➢ Skandi Neptune (Subsea) and Skandi Constructor (Subsea) extended in the Atlantic region
until the beginning of April
➢ Harvey Deep Sea (MPSV) and Skandi Achiever (DSV) secured 135 days for the provision of survey, ROV and
vessel services in the Gulf of Mexico. Both vessel secured utilization in Q1
➢ Skandi Hercules (AHTS/Subsea) and Skandi Singapore (DSV) secured utilization in Australia in Q1 2018
➢ Skandi Niteroi ((PLSV) awarded 2-months contract with McDermott on the Atlanta Project for Queiroz Galvão
with commencement in November
➢ Skandi Skansen’s (AHTS/Subsea) contract with TechnipFMC extended and a new contract signed securing high
utilization in the first four months of the year
➢ Skandi Salvador (Subsea) awarded short-time contract with Saipem in Brazil
➢ Two ROV contracts with Petrobras, to be installed onboard Skandi Angra and Skandi Paraty (AHTS)
➢ Extension two ROV contracts with Petrobras, installed on Skandi Iguacu and Skandi Urca (AHTS)

DOF ASA – Q4 presentation 2017
Vessel Yard Delivery Type Contract Financing
Skandi Recife Vard Brazil Q2 2018 PLSV 8 years Petrobras Loan agreement signed with BNDES
Skandi Olinda Vard Brazil Q1 2019 PLSV 8 years Petrobras Loan agreement signed with BNDES
Two newbuildings remaining with 8-year contracts
Co-owned 50/50 with TechnipFMC
10

DOF ASA – Q4 presentation 2017 11
Opportunities in a challenging market
Agreement with the new owner for management and operation of three vessels.
Options to purchase vessels at a price corresponding to the outstanding debt (approx. 50-60% of historical build costs).
Skandi Hera
• Built: 2009
• LOA: 93.8 m
• Crane: prepared for 250 t
• Bollard pull: 263 t
Skandi Hera will give good exposure in both
AHTS and Subsea markets.
Skandi Darwin
• Built: 2012
• LOA: 93.8 m
• Crane: 70 t
• Accommodation: 60 persons
To be utilized for the Shell Prelude IMR contract in
the Asia Pacific region.
Skandi Bergen
• Built: 2010
• LOA: 87.4 m
• Bollard pull: 250 t
Skandi Bergen is a well-regarded vessel in the
Asia Pacific region but can also be utilized in the
South America or Atlantic regions.
Vessels added to the fleet
12DOF ASA – Q4 presentation 2017
FinancialsManagement Reporting
DOF ASA – Q4 presentation 2017
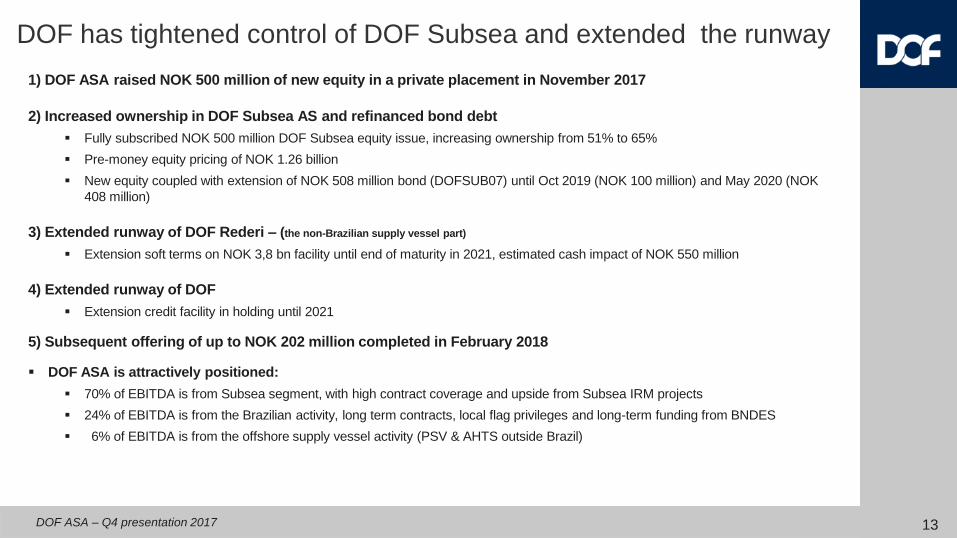
DOF has tightened control of DOF Subsea and extended the runway
1) DOF ASA raised NOK 500 million of new equity in a private placement in November 2017
2) Increased ownership in DOF Subsea AS and refinanced bond debt
▪ Fully subscribed NOK 500 million DOF Subsea equity issue, increasing ownership from 51% to 65%
▪ Pre-money equity pricing of NOK 1.26 billion
▪ New equity coupled with extension of NOK 508 million bond (DOFSUB07) until Oct 2019 (NOK 100 million) and May 2020 (NOK
408 million)
3) Extended runway of DOF Rederi – (the non-Brazilian supply vessel part)
▪ Extension soft terms on NOK 3,8 bn facility until end of maturity in 2021, estimated cash impact of NOK 550 million
4) Extended runway of DOF
▪ Extension credit facility in holding until 2021
5) Subsequent offering of up to NOK 202 million completed in February 2018
▪ DOF ASA is attractively positioned:
▪ 70% of EBITDA is from Subsea segment, with high contract coverage and upside from Subsea IRM projects
▪ 24% of EBITDA is from the Brazilian activity, long term contracts, local flag privileges and long-term funding from BNDES
▪ 6% of EBITDA is from the offshore supply vessel activity (PSV & AHTS outside Brazil)
13

DOF ASA – Q4 presentation 2017 14
• Average utilization total fleet 76% in Q4
• 82% PSV segment
• 67% AHTS segment
• 80% Subsea segment (project fleet 75%)
• All numbers based on management reporting
• DOF Supply is DOF Rederi and Norskan consolidated
EBITDA Q4 MNOK 649 (excl hedge)
Main Financial Highlights
Comments to highlights
Performance
• DOF Subsea EBITDA: MNOK 402
• DOF Supply EBITDA: MNOK 247
Operations
• Avg. utilization of DOF Subsea fleet: 78%
• Avg. utilization of DOF Supply fleet: 75%
• Five vessels in lay-up end December
• Reduced earnings and variable utilization in
the North Sea spot market, stable utilization
in Brazil, and variable utilization subsea
IRM projects in the various regions
38%
62%
EBITDA ex Hedge Q4 2017
DOF Supply
DOF Subsea
45 %
55 %
EBITDA ex Hedge Q4 2016
DOF Supply
DOF Subsea

DOF ASA – Q4 presentation 2017
Profit & Loss Q4 2017
Main events in Q4
Operational performance:
PSV:• Stable utilization spot fleet in the North Sea• One vessel in lay-up by end Q4
AHTS:• Stable earnings and utilization in Brazil• Reduced earnings and utilization in spot
fleet in the North Sea• Low utilization in APAC• Four vessels in lay-up by end Q4
Subsea:• Variable utilization Subsea IRM fleet
• Improved activity in APAC and in North America
• Lower activity in the Atlantic and Brazil region
• Impairment represent a drop in values in the PSV and small-medium sized AHTS and Subsea fleet
1515
All figures in NOK million Q4 2017 Q4 2016 2017 2016
Operating income 2 034 1 955 7 547 8 776 Operating expenses -1 379 -1 319 -5 076 -5 745
Net profit/loss from TS and JV -10 5 -15 -10
Net gain on sale of vessel 3 98 2 171 EBITDA before hedge 649 738 2 458 3 193 Hedge operating income -39 -43 -171 -207
Operating profit - EBITDA 610 695 2 287 2 986
Depreciation -285 -304 -1 145 -1 142 Impairment -340 -413 -1 322 -1 932 Operating profit- EBIT -15 -21 -180 -89
Financial income 9 29 51 1 116
Financial costs -321 -337 -1 118 -1 190
Net currency gain/loss -59 -200 -227 -483 Net profit/loss before unrealized currency -386 -530 -1 474 -646
Net unrealized currency gain/loss -215 20 299 800 Net unrealized gain/loss on market instr. -49 -116 64 249
Profit/loss before tax -649 -625 -1 111 403
Tax -203 -89 -244 -202 Net profit/loss -853 -714 -1 355 201 According to management reporting
DOF ASA – Q4 presentation 2017
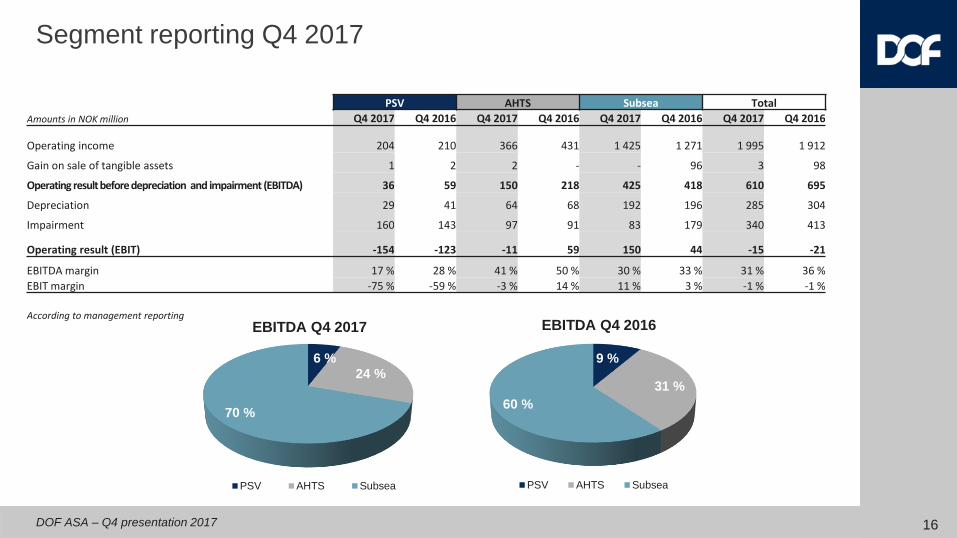
Segment reporting Q4 2017
PSV AHTS Subsea Total
Amounts in NOK million Q4 2017 Q4 2016 Q4 2017 Q4 2016 Q4 2017 Q4 2016 Q4 2017 Q4 2016
Operating income 204 210 366 431 1 425 1 271 1 995 1 912
Gain on sale of tangible assets 1 2 2 - - 96 3 98
Operating result before depreciation and impairment (EBITDA) 36 59 150 218 425 418 610 695
Depreciation 29 41 64 68 192 196 285 304
Impairment 160 143 97 91 83 179 340 413
Operating result (EBIT) -154 -123 -11 59 150 44 -15 -21
EBITDA margin 17 % 28 % 41 % 50 % 30 % 33 % 31 % 36 %
EBIT margin -75 % -59 % -3 % 14 % 11 % 3 % -1 % -1 %
According to management reporting
16
6 %
24 %
70 %
EBITDA Q4 2017
PSV AHTS Subsea
9 %
31 %
60 %
EBITDA Q4 2016
PSV AHTS Subsea

DOF ASA – Q4 presentation 2017
Balance as of 31.12.2017Main events balance sheet YTD
Non current assets:• Two newbuilds delivered and on-hire firm
contracts YTD• Three vessels sold – two in Q4
Current assets:• Operating cash flow MNOK 1,150 • Investments MNOK -1,292 • Financing activity MNOK 218
Equity:• Convertible bond loan MNOK 275 by end Q4
Non current liabilities:• Two new loans drawn upon delivery newbuild• DOFSUB08, USD 175 million, drawn in February• Extension DOFSUB07 until 2019/2020
Current liabilities:• Short term IBD:
Amortisation MNOK 1,979 (next 12 months)Credit facilities and accrued interests
• No balloons before 2019
17
Amounts in NOK million 31.12.2017 31.12.2016
ASSETSTangible assets 25 793 27 469Goodwill 324 330Deferred taxes 779 1 023Investment in associated and joint ventures 71 70Other non-current receivables 635 619Non-current assets 27 604 29 511
Receivables 2 165 2 243Cash and cash equivalents 2 434 2 370Current assets 4 599 4 614Total assets 32 203 34 125
EQUITY AND LIABILITIESSubscripted equity 3 393 2 675Retained equity 1 444 1 950Non-controlling equity 2 505 3 521Equity 7 342 8 146
Non-current interest bearing debt 20 596 21 901Other non-current liabilities 173 222Non-current liabilities 20 769 22 123
Current part of interest bearing debt 2 558 2 081
Other current liabilities 1 534 1 775
Current liabilities 4 092 3 856
Total equity and liabilities 32 203 34 125
According to management reporting

DOF ASA – Q4 presentation 2017 18
• All numbers based on management reporting
• DOF Supply is DOF Rederi and Norskan consolidated
DOF Group is reducing net debt quarter by quarter
NOK million
• DOF Supply has reduced
net debt from NOK 9.6
billion post the 2016-
restructuring, to 8.9 billion
• DOF Subsea has reduced
net debt from NOK 12.0
billion Q3’16 to Q4’17 NOK
11.6 billion
8 000
8 500
9 000
9 500
10 000
10 500
11 000
11 500
12 000
12 500
13 000
Q2'16 Q3'16 Q4'16 Q1'17 Q2'17 Q3'17 Q4'17
DOF Supply DOF Subsea (ex deliveries) DOF Subsea newbuilds w/contract

19DOF ASA – Q4 presentation 2017
DOF Subsea

DOF ASA – Q4 presentation 2017 201) Note: Long-term Chartering comprises 5 PLSVs in operation, 2 PLSVs under construction, Skandi
Acergy and Skandi Patagonia
2) Note: According to management reporting
3) Note: According to management reporting
4) Note: Firm backlog as at end of Q4’17
5) Note: Including 3 chartered-in vessels
DOF Subsea has two business segments
DOF Subsea Group
Long-term Chartering1)
Revenues 20172)
NOK 1 423 million
EBITDA 20173)
NOK 1 084 million
~76% margin
Firm backlog4)
NOK 12.4bn
2 newbuilds
Q4’17
7 vessels in
operation Q4’17
Long-term
charters
Vessel
capabilitiesCapex
spending
Subsea IMR Projects
Revenues 20172)
NOK 3 127 million
EBITDA 20173)
NOK 323 million
~10% margin*
Firm backlog4)
NOK 3.7bn
1 214 Employees
Q4’17
18 vessels in
operation5) Q4’17
Engineering
capabilities
Framework
agreements
Opex
spending
* Reduced EBITDA margin due to one-off events in North America and APAC

DOF ASA – Q4 presentation 2017 21
Subsea
vessel
Built
year
Current
client
Firm
end
Option
end
~5 years
Average contract coverage
NOK 0.8bn and 1.0bn
EBITDA contribution
in 2016 and 2017
6 and 7
Operational vessels
end of 20161) and 20172)
✓
9
Vessels in operation
from Q1’19
DOF SubseaLong-term chartering fleet provides solid backlog
1) Note: Skandi Acu delivered August 2016
2) Note: Skandi Buzios delivered April 2017

DOF ASA – Q4 presentation 2017 22
0
500
1000
1500
2000
2012 2013 2014 2015 2016 2017 2019
Commencement
in 2017
✓Gaining market share and reputation in core offshore regions a key enabler for
access to new project opportunities
✓Strong influx of new contracts – commencement of 3 long-term contracts and
framework agreements in 2017
Increasing opportunities for repeatable revenue related to additional project scope
under existing contracts✓
Leverage significant access to highly-skilled subsea personnel in order to position
for expected market upturn in 2018/2019✓
IMR market expected to grow due to aging subsea infrastructure and low spending
during recent market downturn✓
DOF SubseaSignificant upside potential from Subsea IMR Projects
EBITDA (excl. sales gains) NOK million
DOF ASA – Q4 presentation 2017 23
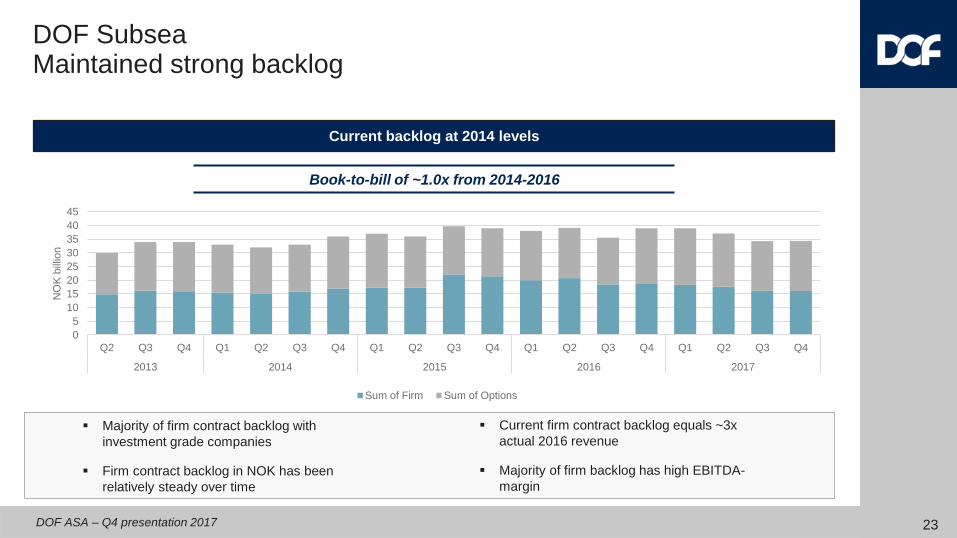
DOF SubseaMaintained strong backlog
Current backlog at 2014 levels
Book-to-bill of ~1.0x from 2014-2016
0
5
10
15
20
25
30
35
40
45
Q2 Q3 Q4 Q1 Q2 Q3 Q4 Q1 Q2 Q3 Q4 Q1 Q2 Q3 Q4 Q1 Q2 Q3 Q4
2013 2014 2015 2016 2017
NO
K b
illio
n
Sum of Firm Sum of Options
▪ Majority of firm contract backlog with
investment grade companies
▪ Firm contract backlog in NOK has been
relatively steady over time
▪ Current firm contract backlog equals ~3x
actual 2016 revenue
▪ Majority of firm backlog has high EBITDA-
margin

DOF ASA – Q4 presentation 2017
Actuals in line with guidance for 2017 (MNOK 2 400 – MNOK 2 800)
Firm backlog of NOK 5 billion in 2018
The refinancing completed in February has extended the Group’s runway
to sustain a continuing challenging markets
The two remaining newbuild to be delivered in 2018 and 2019 are committed
on firm contracts
Increased tendering activity and signs of higher activity within some regions and
segments. Still uncertainty on where the market is heading.
High uncertainty to guide for 2018, best estimate today is an operational EBITDA
of MNOK 2 400 – MNOK 2 800
Outlook
24

Thank youPresented by
Mons Aase - CEO
Hilde Drønen - CFO

DOF ASA – Q4 presentation 2017
DISCLAIMER
This presentation by DOF ASA designed to provide a high level overview of aspects of the operations of the DOF ASA Group.
The material set out in the presentation is current as at 23 February 2018.
This presentation contains forward-looking statements relating to operations of the DOF ASA Group that are based on management’s owncurrent expectations, estimates and projections about matters relevant to DOF ASA‘s future financial performance. Words such as “likely”,“aims”, “looking forward”, “potential”, “anticipates”, “expects”, “predicts”, “plans”, “targets”, “believes” and “estimates” and similarexpressions are intended to identify forward-looking statements.
References in the presentation to assumptions, estimates and outcomes and forward-looking statements about assumptions, estimatesand outcomes, which are based on internal business data and external sources, are uncertain given the nature of the industry, businessrisks, and other factors. Also, they may be affected by internal and external factors that may have a material effect on future businessperformance and results.
No assurance or guarantee is, or should be taken to be, given in relation to the future business performance or results of the DOF ASAGroup or the likelihood that the assumptions, estimates or outcomes will be achieved.
While management has taken every effort to ensure the accuracy of the material in the presentation, the presentation is provided forinformation only. DOF ASA , its officers and management exclude and disclaim any liability in respect of anything done in reliance on thepresentation.
All forward-looking statements made in this presentation are based on information presently available to management and DOF ASAassumes no obligation to update any forward looking- statements. Nothing in this presentation constitutes investment advice and thispresentation shall not constitute an offer to sell or the solicitation of any offer to buy any securities or otherwise engage in any investmentactivity.
You should make your own enquiries and take your own advice (including financial and legal advice) before making an investment in thecompany's shares or in making a decision to hold or sell your shares.
26
Related Documents