Q4-2021: Performance review April 24, 2021

Welcome message from author
This document is posted to help you gain knowledge. Please leave a comment to let me know what you think about it! Share it to your friends and learn new things together.
Transcript

Q4-2021:
Performance review
April 24, 2021

2
Certain statements in this release relating to a future period of time (including inter alia concerning our future
business plans or growth prospects) are forward-looking statements intended to qualify for the 'safe harbor'
under applicable securities laws including the US Private Securities Litigation Reform Act of 1995. Such
forward looking statements involve a number of risks and uncertainties that could cause actual results to
differ materially from those in such forward-looking statements. These risks and uncertainties include, but are
not limited to statutory and regulatory changes, international economic and business conditions, political or
economic instability in the jurisdictions where we have operations, increase in non-performing loans,
unanticipated changes in interest rates, foreign exchange rates, equity prices or other rates or prices, our
growth and expansion in business, the adequacy of our allowance for credit losses, the actual growth in
demand for banking products and services, investment income, cash flow projections, our exposure to
market risks, changes in India’s sovereign rating, and the impact of the Covid-19 pandemic which could result
in fewer business opportunities, lower revenues, and an increase in the levels of non-performing assets and
provisions, depending inter alia upon the period of time for which the pandemic extends, the remedial
measures adopted by governments and central banks, and the time taken for economic activity to resume at
normal levels after the pandemic, as well as other risks detailed in the reports filed by us with the United
States Securities and Exchange Commission. Any forward-looking statements contained herein are based on
assumptions that we believe to be reasonable as of the date of this release. ICICI Bank undertakes no
obligation to update forward-looking statements to reflect events or circumstances after the date thereof.
Additional risks that could affect our future operating results are more fully described in our filings with the
United States Securities and Exchange Commission. These filings are available at www.sec.gov.

Highlights for Q4-2021
3

4
Key highlights (1/2)
• 19.8% y-o-y growth in core operating profit1
to ` 85.65 billion in Q4-2021
• 16.9% y-o-y growth in core operating profit to ` 313.51 billion in FY2021
Deposit growth
• Average savings account deposits increased by 21.2% y-o-y in Q4-2021
• Average current account deposits increased by 33.9% y-o-y in Q4-2021
• Total deposits increased by 21.0% y-o-y at March 31, 2021
Loan growth
• Domestic loans grew by 17.7% y-o-y and 6.1% q-o-q at Mar 31, 2021
• Retail loans grew by 19.9% y-o-y and 6.6% q-o-q at Mar 31, 2021
• Domestic performing corporate portfolio grew by 13.2% y-o-y and 4.7% q-o-q at
Mar 31, 2021
1. Profit before provision and taxes, excluding treasury income

5
Key highlights (2/2)
Asset quality
• Gross NPA additions of ` 55.23 billion (excluding proforma NPAs as of Dec 31, 2020)
• Gross NPA additions of ` 161.23 billion (2.2% of opening customer assets) in FY2021
• Utilised ` 35.09 billion of contingency provisions made on proforma NPAs
• Net NPA ratio declined to 1.14% at Mar 31, 2021 from 1.26%1
at Dec 31, 2020
• Provision coverage was robust at 77.7% at Mar 31, 2021
• Further, made additional Covid-19 related provision of ` 10.00 billion in Q4-2021
• Covid-19 related provision of ` 74.75 billion held at Mar 31, 2021
• Profit after tax of ` 44.03 billion in Q4-2021 (Q4-2020: ` 12.21 billion)
• Profit after tax of ` 161.93 billion in FY2021 (FY2020: ` 79.31 billion2)
• The Board has recommended a dividend of ` 2 per share, subject to requisite approvals
• Common Equity Tier 1 ratio of 16.80%3
1. On a proforma basis
2. Includes impact of one-time additional charge of ` 13.91 billion due to re-measurement of accumulated deferred tax asset at the
revised marginal tax rate
3. Post reckoning the impact of proposed dividend

Operating performance
6

Net interest income (NII) Net interest margin (%)
Total provisions
P&L trends: Q4-2021
Growth of 16.8% y-o-y to ` 104.31 billon
Fee income
Profit after tax
` 44.03 billion
(Q4-2020: ` 12.21 billion)
7
Decreased by 51.7% y-o-y to ` 28.83 billon
Core operating profit to average assets
2.95% in Q4-2021
(Q3-2021: 2.77%, Q4-2020: 2.84%)Growth of 6.0% y-o-y to ` 38.15 billon
3.84 in Q4-2021
(Q3-2021: 3.67, Q4-2020: 3.87)

Profit & loss statement
(` billion) FY
2020
Q4-
2020
Q3-
2021
Q4-
2021
FY
2021
Q4-o-Q4
(%)
Net interest income1
332.67 89.27 99.12 104.312
389.892
16.8%
Non-interest income 151.56 40.13 39.21 41.37 139.23 3.1%
- Fee income 137.11 35.98 36.01 38.15 126.59 6.0%
- Dividend income from subsidiaries 12.73 3.38 3.56 3.57 12.34 5.6%
- Others 1.72 0.77 (0.36) (0.35) 0.30 -
Core operating income 484.23 129.40 138.33 145.68 529.12 12.6%
Operating expenses 216.15 57.92 57.79 60.03 215.61 3.6%
- Employee expenses 82.71 22.35 19.50 20.08 80.91 (10.2)%
- Non-employee expenses 133.44 35.57 38.29 39.95 134.70 12.3%
Core operating profit 268.08 71.48 80.54 85.65 313.51 19.8%
8
1. Includes interest on income tax refund ` 0.11 bn in Q4-2021 and ` 2.57 bn in FY2021 (Q3-2021: ` 1.96 bn, Q4-2020: ₹ 0.27 bn,
FY2020: ` 2.70 bn)
2. Estimated impact of ` 1.75 billion of the required refund of interest on interest and other related amount charged in the
moratorium period as per Supreme Court’s judgement has been reduced from interest income

Profit & loss statement
(` billion) FY2020 Q4-2020 Q3-2021 Q4-2021 FY2021 Q4-o-Q4 (%)
Core operating profit 268.08 71.48 80.54 85.65 313.51 19.8%
Treasury income 12.93 2.42 7.661
(0.25) 50.461
-
Operating profit 281.01 73.90 88.20 85.40 363.97 15.5%
Net provisions 140.53 59.67 27.422
28.832
162.142
(51.7)%
- Covid-19 related
provisions27.25 27.25 (18.00) 10.00 47.50 (63.3)%
- Other provisions 113.28 32.42 45.423 18.83 114.64 (41.9)%
Profit before tax 140.48 14.23 60.78 56.57 201.83 -
Tax 61.174
2.02 11.38 12.54 39.90 -
Profit after tax 79.31 12.21 49.40 44.03 161.93 -
9
1. Includes profit of ` 3.29 bn in Q3-2021 and ₹ 36.70 bn in FY2021 from sale of shareholding in subsidiaries
2. Net provisions includes the impact of application of more conservative provisioning policy adopted in Q3-2021
3. Includes provisions of ` 30.12 bn on borrower accounts not classified as NPA pursuant to the Supreme Court’s interim order
4. Includes impact of one-time additional charge due to re-measurement of accumulated deferred tax asset at the revised
marginal tax rate
Consolidated P&L and ratios: slide 55-57
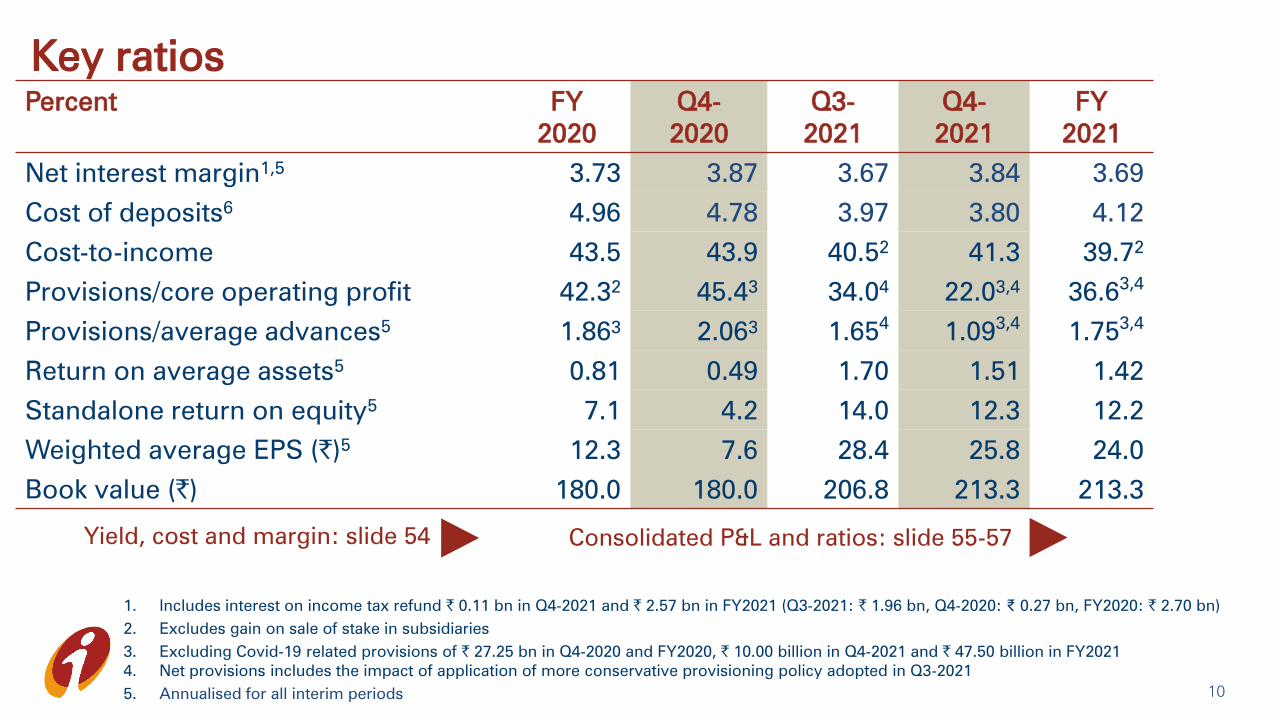
1. Includes interest on income tax refund ` 0.11 bn in Q4-2021 and ` 2.57 bn in FY2021 (Q3-2021: ` 1.96 bn, Q4-2020: ₹ 0.27 bn, FY2020: ` 2.70 bn)
2. Excludes gain on sale of stake in subsidiaries
3. Excluding Covid-19 related provisions of ` 27.25 bn in Q4-2020 and FY2020, ` 10.00 billion in Q4-2021 and ` 47.50 billion in FY2021
4. Net provisions includes the impact of application of more conservative provisioning policy adopted in Q3-2021
5. Annualised for all interim periods
Key ratios
Percent FY
2020
Q4-
2020
Q3-
2021
Q4-
2021
FY
2021
Net interest margin1,5
3.73 3.87 3.67 3.84 3.69
Cost of deposits6
4.96 4.78 3.97 3.80 4.12
Cost-to-income 43.5 43.9 40.52
41.3 39.72
Provisions/core operating profit 42.32
45.43
34.04
22.03,4
36.63,4
Provisions/average advances5
1.863
2.063
1.654
1.093,4
1.753,4
Return on average assets5
0.81 0.49 1.70 1.51 1.42
Standalone return on equity5
7.1 4.2 14.0 12.3 12.2
Weighted average EPS (`)5
12.3 7.6 28.4 25.8 24.0
Book value (`) 180.0 180.0 206.8 213.3 213.3
Yield, cost and margin: slide 54
10

Unconsolidated segment-wise PBT
Profit before tax
(` billion)
FY2020 Q4-2020 Q3-2021 Q4-2021 FY2021
Retail 89.93 18.99 (3.29) 22.98 77.40
Wholesale 9.27 (3.12) 15.96 25.25 58.20
Treasury 50.55 12.74 23.65 18.09 110.80
Others 5.83 0.72 1.49 0.25 2.93
Unallocated1
(15.10) (15.10) 22.97 (10.00) (47.50)
Total 140.48 14.23 60.78 56.57 201.83
111. Represents Covid-19 related provision

Balance sheet growth
12

Healthy funding profile
(` billion) Mar 31,
2020
Dec 31,
2020
Mar 31,
2021
Y-o-Y
growth
% share at
Mar 31, 2021
CASA 3,478.18 3,954.16 4,316.23 24.1% 46.3%
- Current 1,022.27 1,167.41 1,361.70 33.2% 14.6%
- Savings 2,455.91 2,786.74 2,954.53 20.3% 31.7%
Term 4,231.51 4,789.32 5,008.99 18.4% 53.7%
Total deposits 7,709.69 8,743.48 9,325.22 21.0% 100.0%
Q4-2020 Q3-2021 Q4-2021
Average CASA ratio 42.3% 41.8% 42.5% - -
Cost of deposits 4.78% 3.97% 3.80% - -
• 33.9% y-o-y growth in average CA and 21.2% y-o-y growth in average SA in Q4-2021
• 25.5% y-o-y growth in average CA and 16.7% y-o-y growth in average SA in FY2021
Balance sheet-liabilities: slide 58-59
Consolidated balance sheet: slide 60 Extensive franchise: slide 61
13
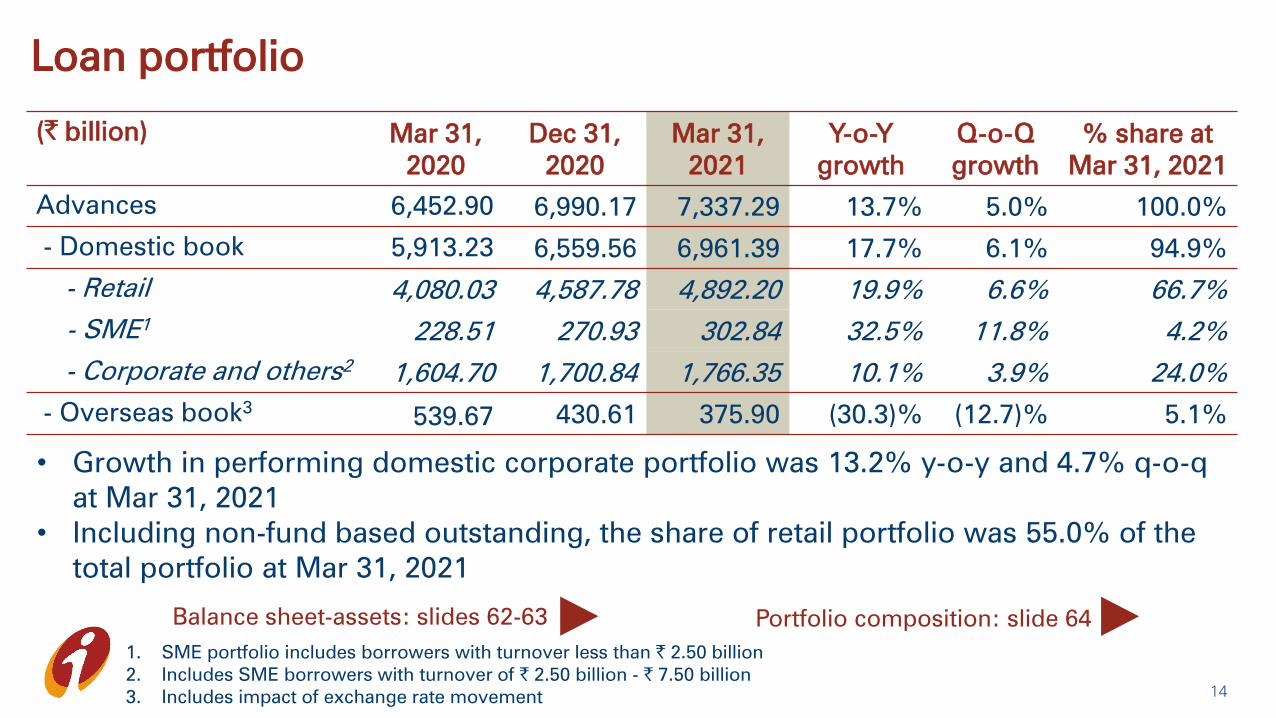
Loan portfolio
(` billion) Mar 31,
2020
Dec 31,
2020
Mar 31,
2021
Y-o-Y
growth
Q-o-Q
growth
% share at
Mar 31, 2021
Advances 6,452.90 6,990.17 7,337.29 13.7% 5.0% 100.0%
- Domestic book 5,913.23 6,559.56 6,961.39 17.7% 6.1% 94.9%
- Retail 4,080.03 4,587.78 4,892.20 19.9% 6.6% 66.7%
- SME1
228.51 270.93 302.84 32.5% 11.8% 4.2%
- Corporate and others2
1,604.70 1,700.84 1,766.35 10.1% 3.9% 24.0%
- Overseas book3
539.67 430.61 375.90 (30.3)% (12.7)% 5.1%
• Growth in performing domestic corporate portfolio was 13.2% y-o-y and 4.7% q-o-q
at Mar 31, 2021
• Including non-fund based outstanding, the share of retail portfolio was 55.0% of the
total portfolio at Mar 31, 2021
Balance sheet-assets: slides 62-63 Portfolio composition: slide 64
14
1. SME portfolio includes borrowers with turnover less than ` 2.50 billion
2. Includes SME borrowers with turnover of ` 2.50 billion - ` 7.50 billion
3. Includes impact of exchange rate movement
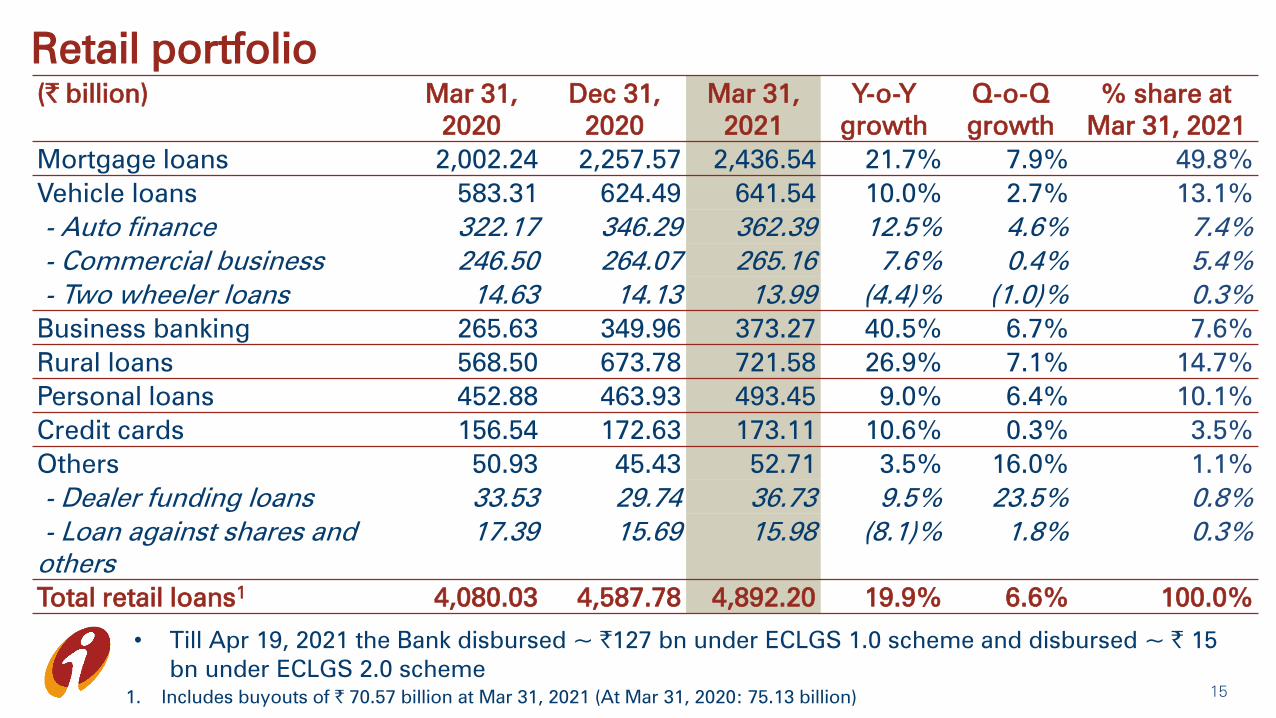
Retail portfolio
(` billion) Mar 31,
2020
Dec 31,
2020
Mar 31,
2021
Y-o-Y
growth
Q-o-Q
growth
% share at
Mar 31, 2021
Mortgage loans 2,002.24 2,257.57 2,436.54 21.7% 7.9% 49.8%
Vehicle loans 583.31 624.49 641.54 10.0% 2.7% 13.1%
- Auto finance 322.17 346.29 362.39 12.5% 4.6% 7.4%
- Commercial business 246.50 264.07 265.16 7.6% 0.4% 5.4%
- Two wheeler loans 14.63 14.13 13.99 (4.4)% (1.0)% 0.3%
Business banking 265.63 349.96 373.27 40.5% 6.7% 7.6%
Rural loans 568.50 673.78 721.58 26.9% 7.1% 14.7%
Personal loans 452.88 463.93 493.45 9.0% 6.4% 10.1%
Credit cards 156.54 172.63 173.11 10.6% 0.3% 3.5%
Others 50.93 45.43 52.71 3.5% 16.0% 1.1%
- Dealer funding loans 33.53 29.74 36.73 9.5% 23.5% 0.8%
- Loan against shares and
others
17.39 15.69 15.98 (8.1)% 1.8% 0.3%
Total retail loans1
4,080.03 4,587.78 4,892.20 19.9% 6.6% 100.0%
15
• Till Apr 19, 2021 the Bank disbursed ~ `127 bn under ECLGS 1.0 scheme and disbursed ~ ` 15
bn under ECLGS 2.0 scheme
1. Includes buyouts of ` 70.57 billion at Mar 31, 2021 (At Mar 31, 2020: 75.13 billion)

Portfolio of overseas branches
16
Total outstanding1 at Mar 31, 2021: USD 4.14 billion
1. Corporate fund and non-fund outstanding of overseas branches, net of cash/bank/insurance backed lending
Progressively exiting exposures that are not linked to India, in a planned manner
The overseas non-India linked
corporate portfolio reduced by
56.0% year-on-year or about USD
1.6 billion and 24.0% sequentially or
about USD 391 million at March 31,
2021
Technology and digital trends
17
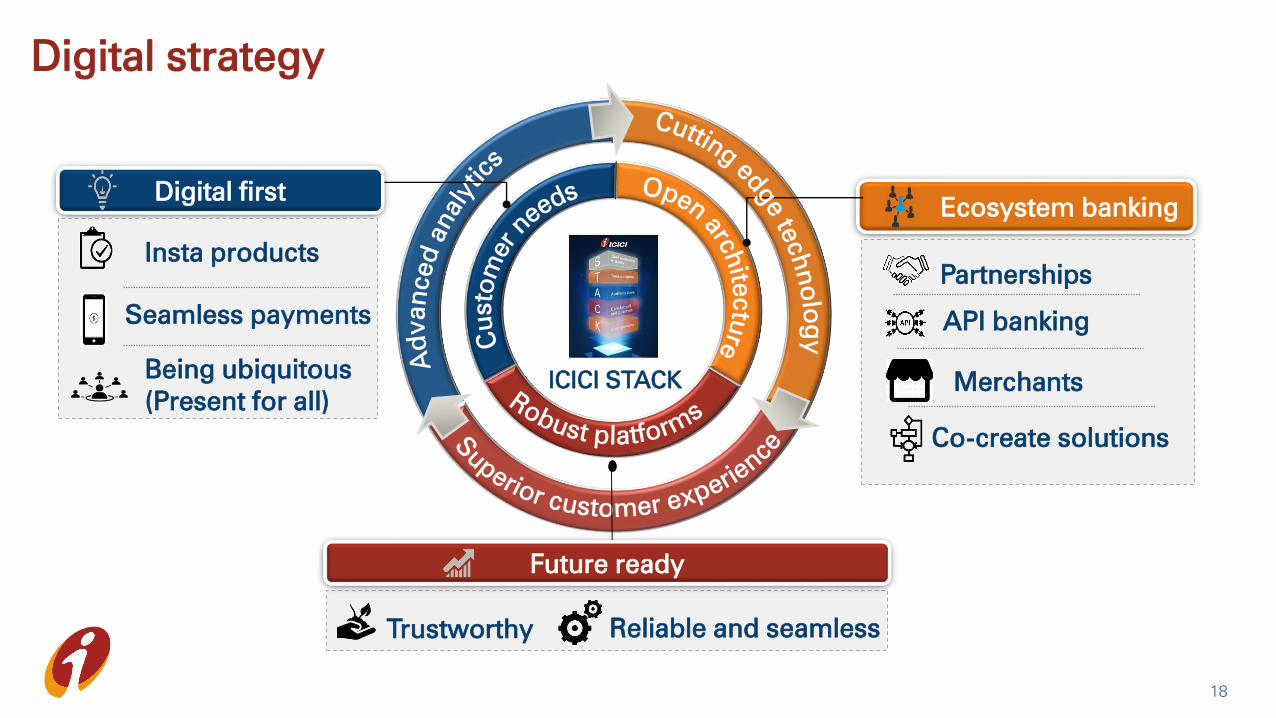
Digital strategy
18
ICICI STACK
Ecosystem banking
Partnerships
Co-create solutions
Reliable and seamlessTrustworthy
Future ready
API banking
Digital first
Being ubiquitous
(Present for all)
Insta products
Seamless payments
Merchants

19
iMobile Pay – A platform for All
The volume of mobile banking transactions grew by
61.3% y-o-y in Q4-2021
Add other
bank a/c
Pay2
contact,
scan & pay
Do UPI & bill
payments
Daily use
cases
(recharge,
FasTag)
Open
savings a/c
instantly
Apply for
instant
loans
Now available for non-ICICI
Bank customers
3x increase in monthly
volumes in Mar 2021 (over
Feb 2021) for Pay2contact
feature
In a span of four
months, 1.5 mn +
activations from non-
ICICI Bank customers
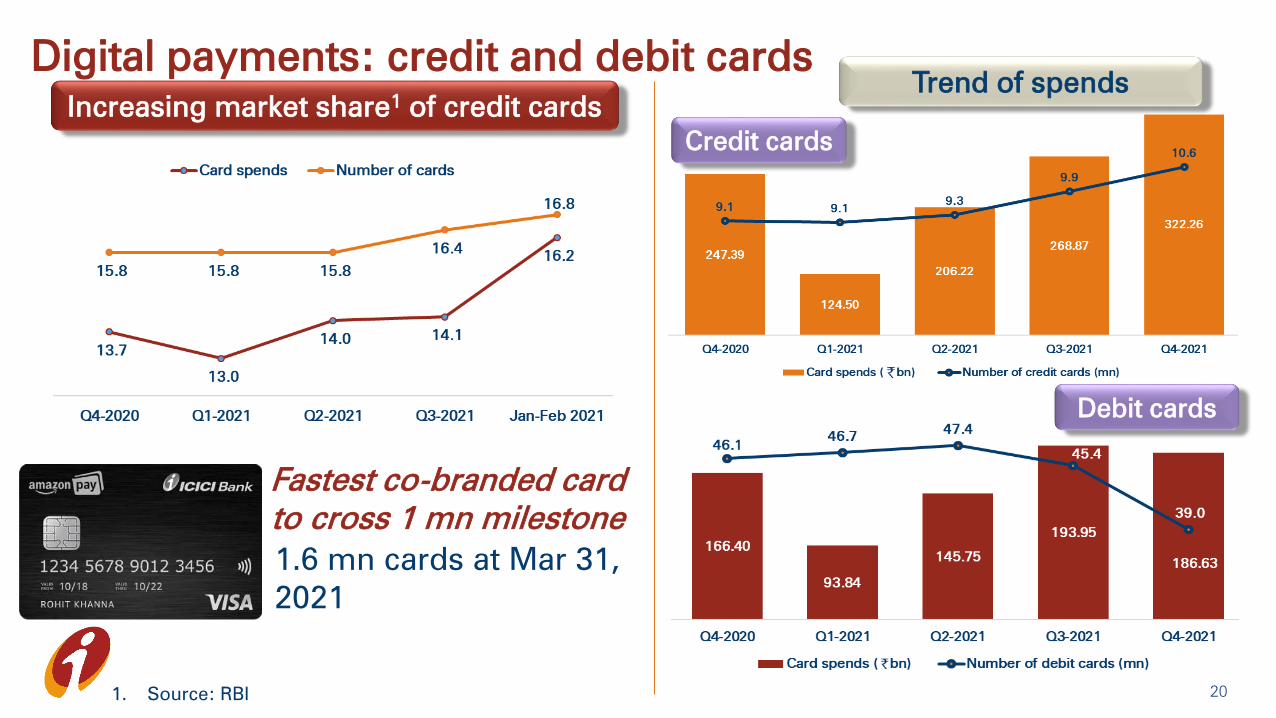
Digital payments: credit and debit cards
20
Trend of spends
Credit cards
Debit cards
Increasing market share1
of credit cards
1. Source: RBI
1.6 mn cards at Mar 31,
2021
Fastest co-branded card
to cross 1 mn milestone

Digital payments: Eazypay and API banking
21
Merchant acquisition app: Eazypay
4X increase in the monthly transaction
values in Mar 2021 over Jun 2020
API1
banking
1. Application Programme Interface
Enables partners to integrate various
payment and product solutions; APIs
available across an arrays of categories
including payments & collections
10X increase in the monthly transaction
values in Mar 2021 over Apr 2020
Greater fund flows, growth in CASA deposits and more opportunities to
cross-sell
One-stop solution for merchants to collect
payments, order supplies, avail distributor
offers, inventory & billing and store analytics

Digital payments: UPI and FASTag
22
UPI: P2M1
transactions
Value up by 2.5x y-o-y;
Volume up by 1.4x y-o-y
Electronic toll collections
1. Payments to merchants
Market share by volume was 14% in Mar
2021; ranked 3rd
in the industry
50.7% y-o-y
Market share by value was 37% in
Q4-2021; ranked 1st
in the industry

Digital sourcing and transactions in FY2021
90% sourced via
Insta1
Personal loans
75% sourced
digitally1
Credit cards
33% protection
policies sold online
Term life
insurance
56% sourced via
digital channels
Fixed deposits
64% initiated via
digital channels
SIPs initiated
1. Percentage share based on count of customers. Includes insta and digitally on boarded
2. Financial and non-financial
3. Includes internet, mobile, POS, touch banking, phone banking and debit cards e-commerce transactions 23
• In Mar 2021, ~45% of the Amazon Pay credit card customers were
onboarded using video KYC
Over 90% of savings account transactions2
through digital channels3
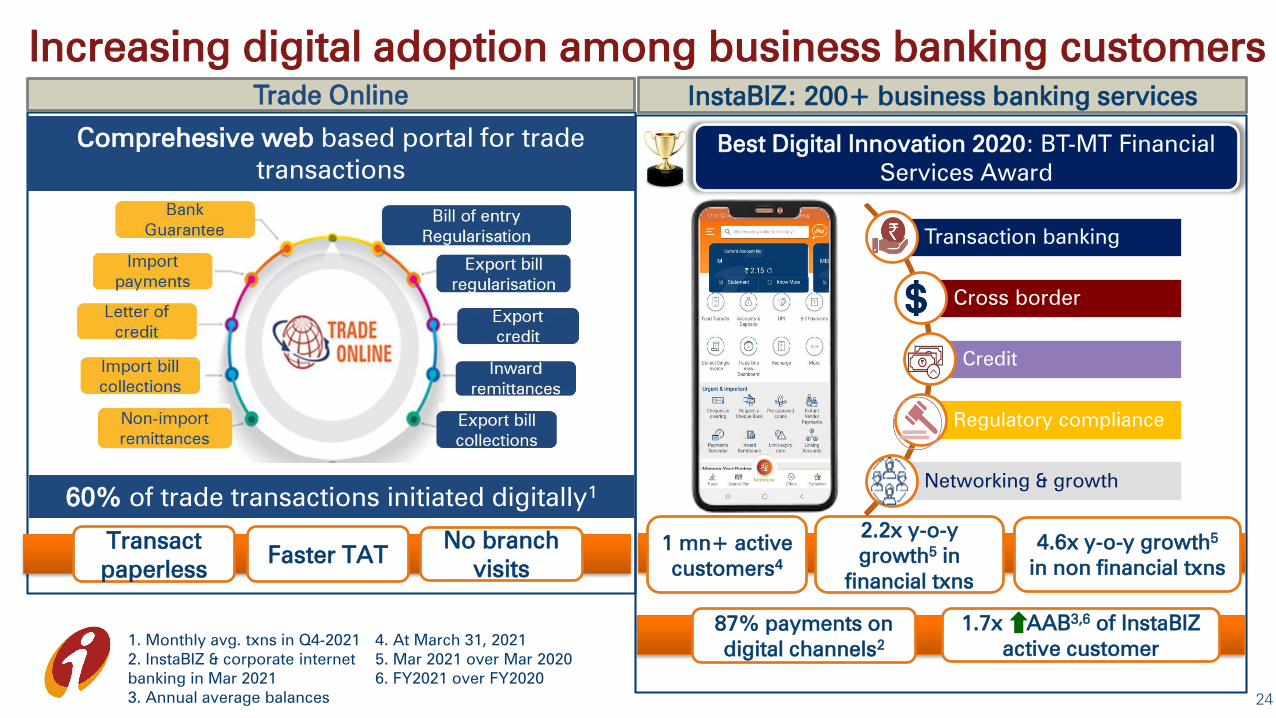
Increasing digital adoption among business banking customers
24
Trade Online InstaBIZ: 200+ business banking services
1. Monthly avg. txns in Q4-2021
2. InstaBIZ & corporate internet
banking in Mar 2021
3. Annual average balances
Comprehesive web based portal for trade
transactions
60% of trade transactions initiated digitally1
Transact
paperlessFaster TAT
No branch
visits
Best Digital Innovation 2020: BT-MT Financial
Services Award
1 mn+ active
customers4
2.2x y-o-y
growth5
in
financial txns
4.6x y-o-y growth5
in non financial txns
4. At March 31, 2021
5. Mar 2021 over Mar 2020
6. FY2021 over FY2020
87% payments on
digital channels2
1.7x AAB3,6
of InstaBIZ
active customer
Transaction banking
Cross border
Credit
Regulatory compliance
Networking & growth
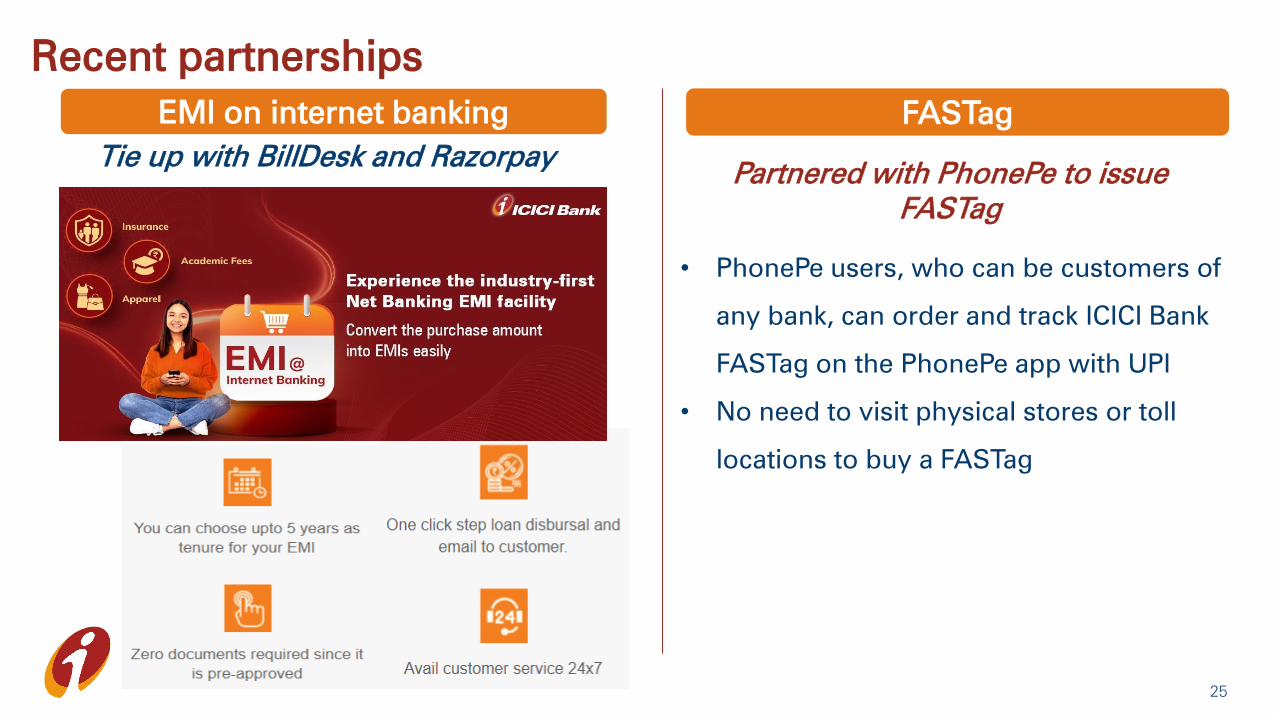
Recent partnerships
25
Partnered with PhonePe to issue
FASTag
• PhonePe users, who can be customers of
any bank, can order and track ICICI Bank
FASTag on the PhonePe app with UPI
• No need to visit physical stores or toll
locations to buy a FASTag
EMI on internet banking FASTag
Tie up with BillDesk and Razorpay

Asset quality trends
26

NPA trends
(` billion) Mar 31,
2020
Dec 31,
2020
(Proforma)
Dec 31,
2020
(Reported)
Mar 31,
2021
Gross NPAs1 414.09 431.40 348.60 413.73
Less: cumulative provisions 312.95 335.08 299.99 321.93
Net NPAs1 101.14 96.32 48.61 91.80
Gross NPA ratio1 5.53% 5.42% 4.38% 4.96%
Net NPA ratio1 1.41% 1.26% 0.63% 1.14%
Provision coverage ratio 75.7% 77.6% 86.0% 77.7%
Non-fund o/s to NPAs 50.63 44.07 44.05
Provisions on non-fund o/s to NPAs 11.82 13.97 14.92
271. Based on customer assets
• Net investment in security receipts of ARCs was ` 17.29 billion at Mar 31, 2021
(Dec 31, 2020: ₹ 18.44 billion)
• Net standard restructured loans were ` 31.79 billion at Mar 31, 2021
(Dec 31, 2020: ₹ 3.80 billion)Retail NPAs: slide 65
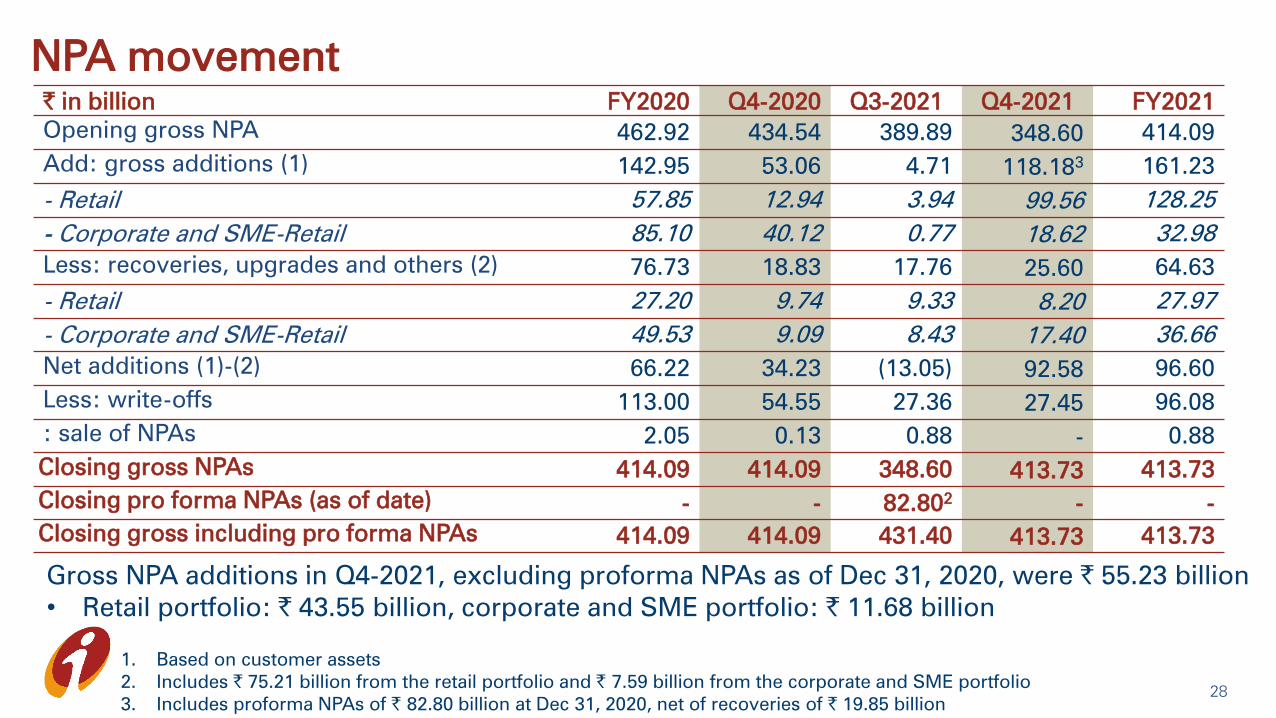
NPA movement
28
1. Based on customer assets
2. Includes ` 75.21 billion from the retail portfolio and ` 7.59 billion from the corporate and SME portfolio
3. Includes proforma NPAs of ` 82.80 billion at Dec 31, 2020, net of recoveries of ` 19.85 billion
` in billion FY2020 Q4-2020 Q3-2021 Q4-2021 FY2021
Opening gross NPA 462.92 434.54 389.89 348.60 414.09
Add: gross additions (1) 142.95 53.06 4.71 118.183 161.23
- Retail 57.85 12.94 3.94 99.56 128.25
- Corporate and SME-Retail 85.10 40.12 0.77 18.62 32.98
Less: recoveries, upgrades and others (2) 76.73 18.83 17.76 25.60 64.63
- Retail 27.20 9.74 9.33 8.20 27.97
- Corporate and SME-Retail 49.53 9.09 8.43 17.40 36.66
Net additions (1)-(2) 66.22 34.23 (13.05) 92.58 96.60
Less: write-offs 113.00 54.55 27.36 27.45 96.08
: sale of NPAs 2.05 0.13 0.88 - 0.88
Closing gross NPAs 414.09 414.09 348.60 413.73 413.73
Closing pro forma NPAs (as of date) - - 82.802
- -
Closing gross including pro forma NPAs 414.09 414.09 431.40 413.73 413.73
Gross NPA additions in Q4-2021, excluding proforma NPAs as of Dec 31, 2020, were ` 55.23 billion
• Retail portfolio: ` 43.55 billion, corporate and SME portfolio: ` 11.68 billion
Resolution under RBI frameworks
29
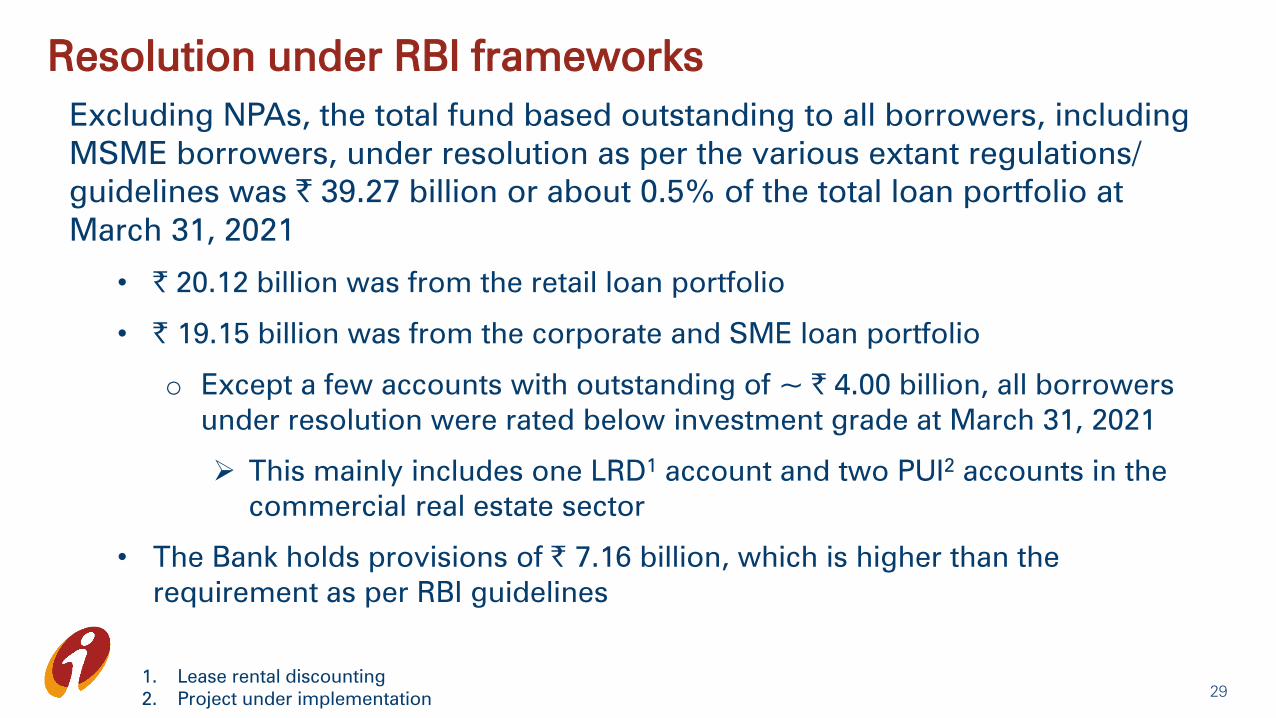
Excluding NPAs, the total fund based outstanding to all borrowers, including
MSME borrowers, under resolution as per the various extant regulations/
guidelines was ` 39.27 billion or about 0.5% of the total loan portfolio at
March 31, 2021
• ` 20.12 billion was from the retail loan portfolio
• ` 19.15 billion was from the corporate and SME loan portfolio
o Except a few accounts with outstanding of ~ ` 4.00 billion, all borrowers
under resolution were rated below investment grade at March 31, 2021
This mainly includes one LRD1
account and two PUI2
accounts in the
commercial real estate sector
• The Bank holds provisions of ` 7.16 billion, which is higher than the
requirement as per RBI guidelines
1. Lease rental discounting
2. Project under implementation

Standard asset and other provisions
30
(` billion) Jun 30,
2020
Sep 30,
2020
Dec 31,
2020
Mar 31,
2021
Covid-19 related contingency provisions1
- 4.97 35.09 -
Covid-19 related other provisions 82.75 82.75 64.75 74.75
Provision on non-fund based o/s to NPAs 13.98 14.37 13.97 14.92
General provisions on standard assets
and other provisions
46.95 45.22 50.20 51.77
Total 143.68 147.31 164.01 141.44
Total as a % of net advances 2.3% 2.3% 2.3% 1.9%
1. Represents provisions on borrower accounts not classified as non-performing pursuant to the Supreme Court’s interim
order

Loan portfolio information
31

Diversified and granular loan book
32
Retail portfolio largely secured and
built on proprietary data and
analytics in addition to bureau
checks and well-priced in relation
to risk
1. Includes dealer funding, loan against shares and others
2. Including non-fund based outstanding, the share of retail portfolio was 55.0% of the total portfolio at Mar 31, 2021
1
Focus on granular exposures and
higher rated corporates; provide
full suite of banking products to
corporate clients and their
ecosystems
66.7% of total loans are retail2
At March 31, 2021
Rating-wise total loan book
33
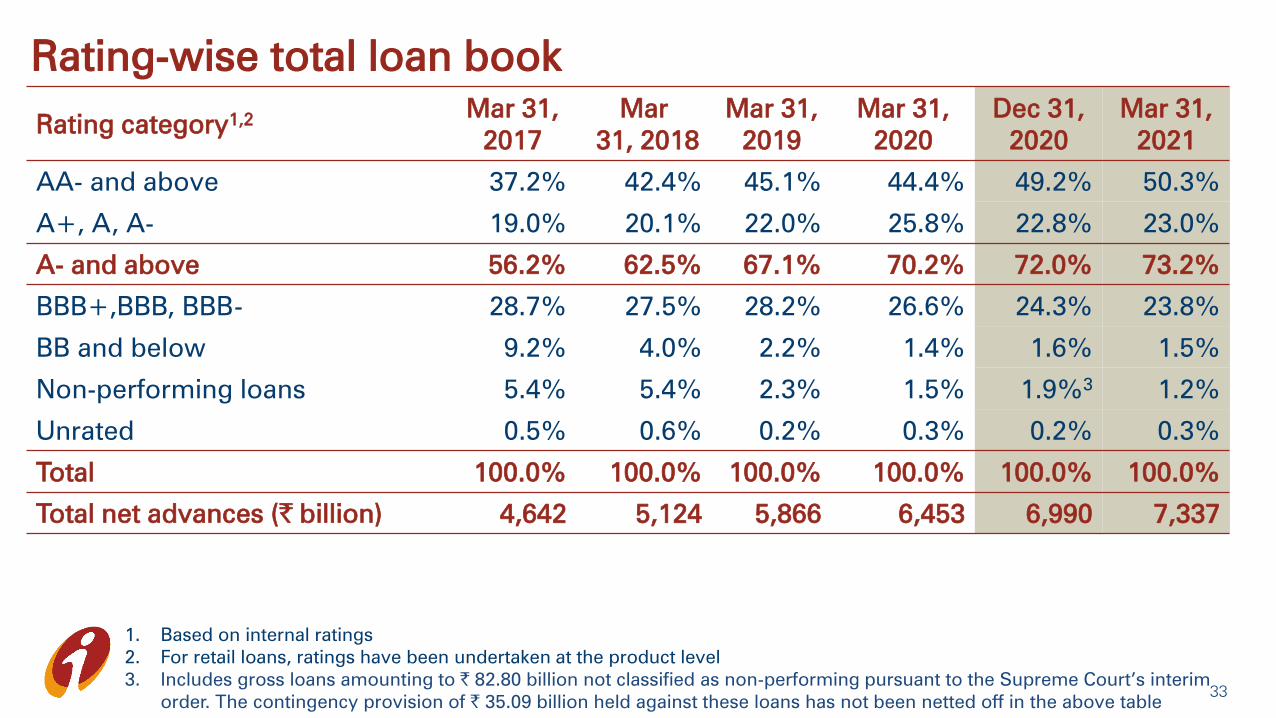
Rating category1,2
Mar 31,
2017
Mar
31, 2018
Mar 31,
2019
Mar 31,
2020
Dec 31,
2020
Mar 31,
2021
AA- and above 37.2% 42.4% 45.1% 44.4% 49.2% 50.3%
A+, A, A- 19.0% 20.1% 22.0% 25.8% 22.8% 23.0%
A- and above 56.2% 62.5% 67.1% 70.2% 72.0% 73.2%
BBB+,BBB, BBB- 28.7% 27.5% 28.2% 26.6% 24.3% 23.8%
BB and below 9.2% 4.0% 2.2% 1.4% 1.6% 1.5%
Non-performing loans 5.4% 5.4% 2.3% 1.5% 1.9%3
1.2%
Unrated 0.5% 0.6% 0.2% 0.3% 0.2% 0.3%
Total 100.0% 100.0% 100.0% 100.0% 100.0% 100.0%
Total net advances (` billion) 4,642 5,124 5,866 6,453 6,990 7,337
1. Based on internal ratings
2. For retail loans, ratings have been undertaken at the product level
3. Includes gross loans amounting to ` 82.80 billion not classified as non-performing pursuant to the Supreme Court’s interim
order. The contingency provision of ` 35.09 billion held against these loans has not been netted off in the above table

• Other than two accounts, one each in construction and telecom sector, the
maximum single borrower outstanding in the BB and below portfolio was about ` 6
billion at Mar 31, 2021
Corporate and SME: BB and below
34
` billion Mar 31,
20201
Dec 31,
20202
Mar 31,
20211
BB and below outstanding 116.05 136.54 130.98
- Fund and non-fund o/s to restructured loans 1.80 1.64 14.05
- Borrowers under RBI resolution schemes2
15.33 12.22 7.99
- Other borrowers with o/s greater than ` 1.00 bn2
65.98 83.01 71.17
- Other borrowers with o/s less than ` 1.00 bn2
32.94 39.67 37.76
1. Excludes banks, investments and fund and non-fund based outstanding to NPAs
2. Excludes banks, investments and fund and non-fund based outstanding to NPAs and borrowers which were not classified as
non-performing pursuant to the Supreme Court’s interim order
3. Fund-based and non-fund based outstanding
From Q4-2021, non-fund outstanding to NPA is being excluded from the BB and below
portfolio and reported separately

35
Movement in Corporate & SME BB and below in Q4-2021
1. Fund-based and non-fund based outstanding
2. Excludes banks, investments and fund and non-fund based outstanding to NPAs and borrowers which were not
classified as non-performing pursuant to the Supreme Court’s interim order
3. Excludes banks, investments and fund and non-fund based outstanding to NPAs
(` billion)
1,2 1,3

Mortgage portfolio
36
Total mortgage portfolio includes home loans ~70%, top-up loans given to
existing home loan customers 6%, office premises loans ~5% and loan against
property ~19%
Mortgage disbursements increased sequentially; driven by digitization of entire
underwriting process with instant loan approvals
‘iHome loans’, an app designed to smoothen the home loans journey for the
customer and the internal sourcing team with features like instant sanction
letter, video KYC, eligibility calculators
~70%
mortgage customers
have liability relationship
with the Bank
~ ` 3.3 mn
Average ticket
size of home
loan
~65%
Average loan-to-
value ratio of
home loan
~55%
Average loan-to-value
ratio of loan against
property
‘Trackmyloan’, an online mortgage loan application tracking platform for
customers that showcases loan journey and notifies about application status
from login to sanction stage

Vehicle loans
37
Auto finance
Disbursements continue to rise since
September levels; demand from tier II
locations and increasing adoption of
technological initiatives to increase
outreach and market share along with
digitization of credit decision
Auto loan comprises 86% new
vehicles and 14% used vehicles
~64%
Commercial business
Disbursements grew sequentially
in Q4-2021
Growth attributed to demand from rural
areas and e-comm segment, government
spending on areas like roads & highways,
power, port development + focus on faster
development of infrastructure at the border
and development of dedicated freight
corridor
~3%
Contribution of top
20 customers in the
commercial vehicle
portfolio
~65%
Customers with long
vintage, well
seasoned and have
witnessed multiple
business cycles
Customers have a liability
relationship with the Bank

Rural and personal loan and credit card portfolio
38
Rural loans Personal loans and credit cards
Disbursements in personal loans
grew sequentially in Q4-2021
Credit card spends in Q4-2021
increased substantially over Q3-
2021 driven by spends across
electronics, wellness and jewelry
categories
~75%
Portfolio to
existing
customers
~85%
Portfolio
comprises of
salaried
individuals
~70%
Of salaried
customers from well
rated corporates,
MNCs, and
government entities
Gold loans and kisan credit cards comprise
3% each of the total loan book; overall
micro finance loans are negligible
Disbursements across portfolio
continue to remain robust driven
by jewel loans and business loans
Express Agri: An app enabling
employees to capture and submit loan
applications from applicant’s doorstep,
check indicative eligibility, eKYC, pre-
approved offers; reduces TAT and cost
to service new loan applications;
usage of satellite imagery for credit
decision and monitoring is integral
SME and business banking portfolio
39
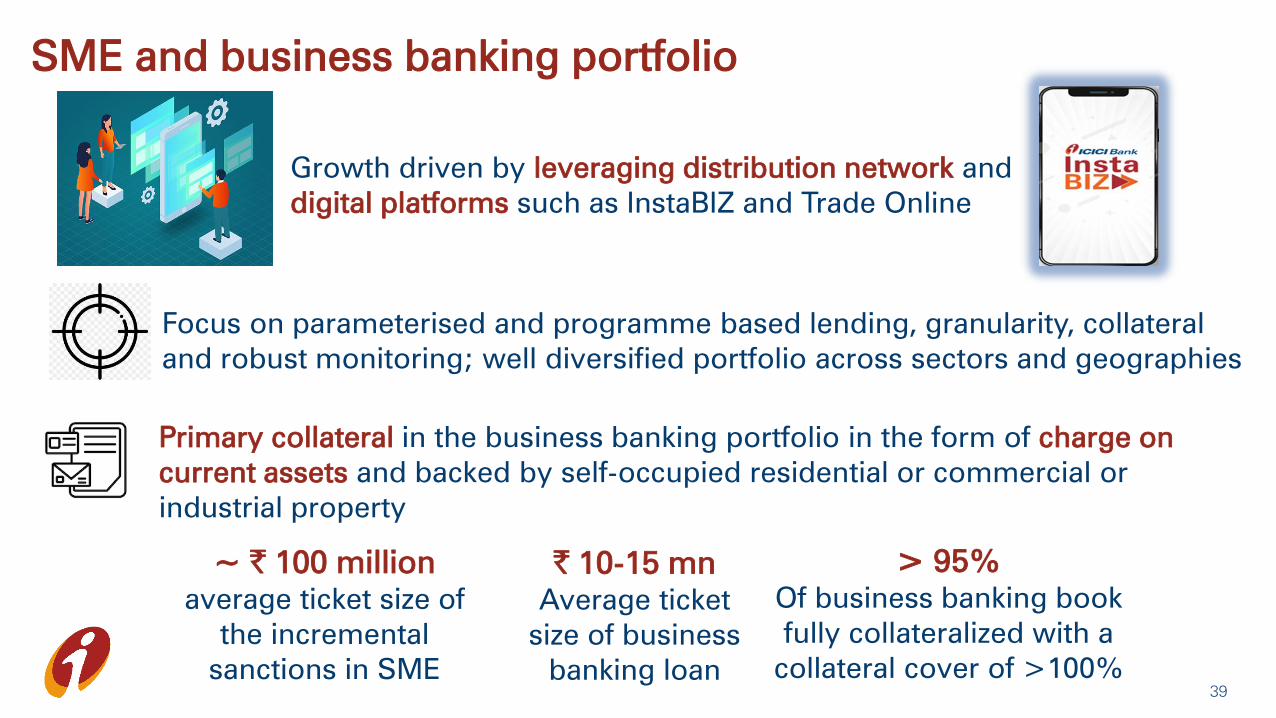
` 10-15 mn
Average ticket
size of business
banking loan
~ ` 100 million
average ticket size of
the incremental
sanctions in SME
> 95%
Of business banking book
fully collateralized with a
collateral cover of >100%
Focus on parameterised and programme based lending, granularity, collateral
and robust monitoring; well diversified portfolio across sectors and geographies
Growth driven by leveraging distribution network and
digital platforms such as InstaBIZ and Trade Online
Primary collateral in the business banking portfolio in the form of charge on
current assets and backed by self-occupied residential or commercial or
industrial property

Exposure to power sector
(` billion) Mar 31,
2020
Dec 31,
2020
Mar 31,
2021
Share at Mar
31, 2021 (%)
Borrowers classified as proforma NPA or
part of BB and below portfolio1
92.33 84.70 82.21 22.9%
Other borrowers 287.95 255.28 276.39 77.1%
Total 380.28 339.98 356.59 100.0%
• Of the other borrowers aggregating ` 276.39 billion, excluding exposure to State
Electricity Boards, ~86% was rated A- and above
Sector-wise exposures: slide 66
401. Including loans restructured or under a RBI resolution scheme
NBFCs, HFCs and builder portfolio
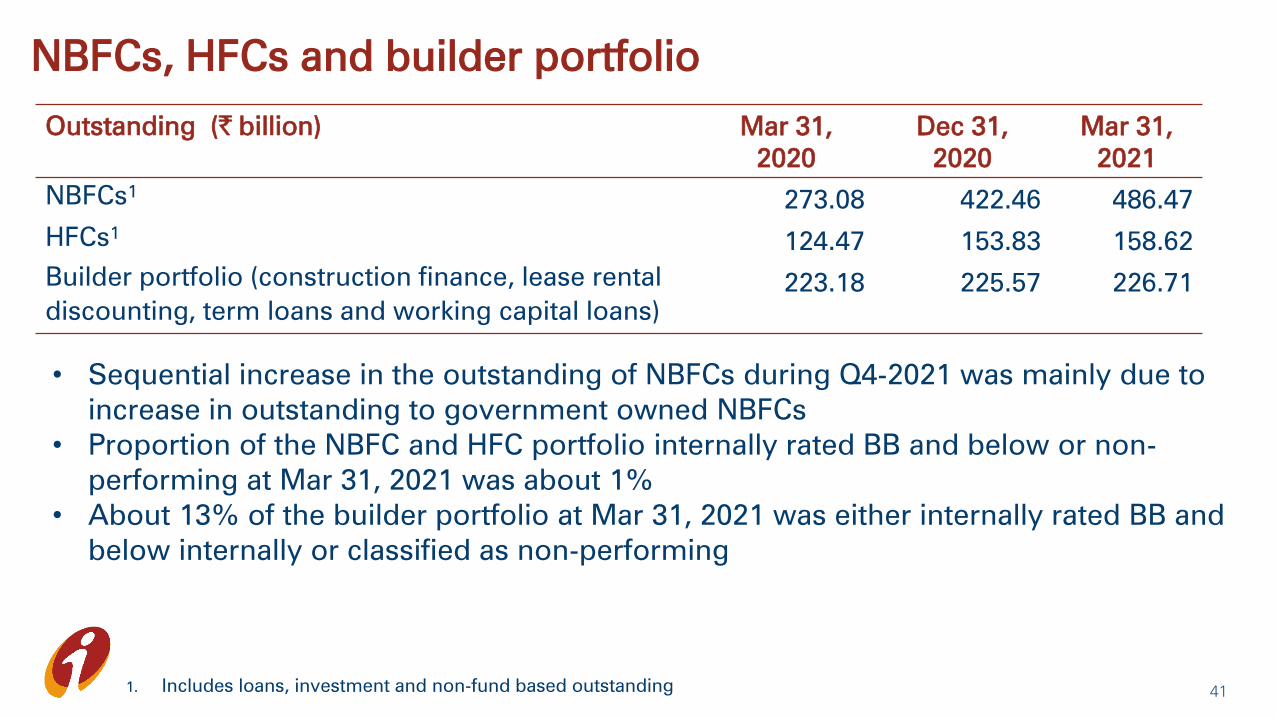
Outstanding (` billion) Mar 31,
2020
Dec 31,
2020
Mar 31,
2021
NBFCs1
273.08 422.46 486.47
HFCs1
124.47 153.83 158.62
Builder portfolio (construction finance, lease rental
discounting, term loans and working capital loans)
223.18 225.57 226.71
411. Includes loans, investment and non-fund based outstanding
• Sequential increase in the outstanding of NBFCs during Q4-2021 was mainly due to
increase in outstanding to government owned NBFCs
• Proportion of the NBFC and HFC portfolio internally rated BB and below or non-
performing at Mar 31, 2021 was about 1%
• About 13% of the builder portfolio at Mar 31, 2021 was either internally rated BB and
below internally or classified as non-performing

Reduction in concentration risk
• Hard limit on borrower groups based on turnover and track record, lower than the
regulatory limits
Details Mar 31,
2017
Mar 31,
2018
Mar 31,
2019
Mar 31,
2020
Mar 31,
2021
Exposure to top 20 borrowers1
as a % of total exposure
12.4% 12.5% 10.8% 11.0% 12.1%2
Exposure to top 10 groups as a
% of total exposure
16.8% 14.3% 13.6% 12.1% 11.6%
42
1. Excludes banks
2. Reflects increase in exposure to PSUs and highly rated entities
• All top 20 borrowers as of March 31, 2021 are rated A- and above internally

Capital
43

Strong capital position
Dec 31, 20201
Mar 31, 20212
(` billion) % (` billion) %
Total capital 1,371.20 18.04% 1,501.50 19.12%
- Tier I 1,265.36 16.65% 1,418.75 18.06%
- of which: CET1 1,164.16 15.32% 1,319.43 16.80%
- Tier II 105.84 1.39% 82.75 1.06%
Risk weighted assets 7,599.83 7,854.03
- On balance sheet 6,808.28 7,037.51
- Off balance sheet 791.55 816.52
• Including profits for 9M-2021, CET1 ratio was 16.79%, Tier I ratio was 18.12% and total
capital adequacy ratio was 19.51% at December 31, 2020
• Capital adequacy ratios well above the minimum regulatory requirement of CET1 ratio of
7.58%, Tier I ratio of 9.08% and total capital adequacy ratio of 11.08%
1. Excluding profits for 9M-2021
2. After reckoning the impact of proposed dividend
Consolidated capital adequacy: slide 67
44

Subsidiaries
45

Profit after tax of subsidiaries
Profit after tax (` billion) FY2020 Q4-2020 Q3-2021 Q4-2021 FY2021
ICICI Prudential Life Insurance 10.69 1.79 3.06 0.64 9.60
ICICI Lombard General Insurance 11.94 2.82 3.14 3.46 14.73
ICICI Prudential Asset Management1
10.46 2.17 3.58 3.48 12.45
ICICI Securities (Consolidated)1
5.42 1.56 2.67 3.29 10.68
ICICI Securities Primary Dealership1,2
3.31 0.26 1.32 0.66 5.70
ICICI Home Finance1
0.003
0.64 0.03 0.15 0.22
ICICI Venture 0.13 (0.07) (0.02) (0.12) 0.04
ICICI Bank UK (USD million) 23.2 (6.8) 2.2 2.8 14.8
ICICI Bank Canada (CAD million) 40.6 (7.5) 5.1 5.1 20.0
1. As per Ind AS
2. Represents total comprehensive income
3. Represents insignificant amount
Details on subsidiaries: slides 68-73
46
Insurance subsidiaries
1. Value of New Business
2. Annualised premium equivalent
3. Gross Direct Premium Income
ICICI Prudential Life Insurance
• VNB1
grew by 25.7% y-o-y to ` 5.91 billion in Q4-2021 and 1.0% y-o-y to ` 16.21 billion
in FY2021
• VNB margins increased from 21.7% in FY2020 to 25.1% in FY2021
• New business premium grew by 22.9% y-o-y to ` 51.33 billion in Q4-2021 and 5.5% y-
o-y to ` 130.32 billion in FY2021
• Total APE2
grew by 27.1% y-o-y to ` 25.09 billion in Q4-2021
• Protection APE2
was ` 10.46 billion and accounted for 16.2% of total APE in FY2021
ICICI Lombard General Insurance
• GDPI3
grew by 9.4% y-o-y to ` 34.78 billion in Q4-2021 and 5.2% y-o-y to ` 140.03
billion in FY2021
• Combined ratio was 101.8% in Q4-2021 (Q4-2020: 100.1%) and 99.8% in FY2021
(FY2020: 100.4%)
• Solvency ratio was 2.90x at March 31, 2021 compared to 2.17x at March 31, 2020
47
Environmental, Social and Governance (ESG)
initiatives
48

ESG at ICICI Bank (1/3)
Bank is committed to conduct its business responsibly
and promote sustainable environmental practices
49
• Financing capacity creation in the renewable energy sector continued in fiscal 2021
• 28 KWp of new solar power capacity added at the Bank’s premises during FY2021;
total onsite renewable energy capacity of 2.9 MWp at March 31, 2021
• 9 MWp of total contracted capacity under the open access mechanism for sourcing
power from renewable energy sources
• The Bank ensures green building features of Indian Green Building Council (IGBC) in
all its new offices and branches at the time of set up
• Replacement of DG sets with lithium ion battery storage system and carbon dioxide
based fire extinguishers with clean agent fire extinguishers underway at branches
Environment
ESG at ICICI Bank (2/3)
The Bank has participated extensively in Covid-19 relief
efforts during FY2021
50
• The Bank and ICICI Foundation responded to efforts on the ground to fight Covid-19;
covered over 550 districts in 36 states and union territories for providing support and
critical material
• Several social and environmental projects relating to water conservation, healthcare,
empowering women undertaken through ICICI Foundation during FY2021
• The Bank enabled direct transfer of benefits from government schemes to the
beneficiaries in rural areas; our business correspondents continued to offer financial
services, including doorstep services, to beneficiaries through the pandemic
• SHG lending empowering rural women entrepreneurs; total 4.6 million women
beneficiaries were first time borrowers of the Bank as on March 31, 2021
Social
ESG at ICICI Bank (3/3)
Being responsible and transparent in our business, and
continuously strive to create value for all stakeholders
51
• Majority independent Board to oversee critical areas and functions of executive
management
• Separation of Board’s supervisory role from the executive management
• Board-approved environmental, social and governance framework
• Bank is committed to act professionally, fairly and with integrity in all its dealings;
principle of “Fair to Customer, Fair to Bank” to deliver fair value to customers
• Periodic review of governance practices and frameworks; during FY2021
enhancements were made to the Bank’s Group Code of Business Conduct and
Ethics
Governance

Thank you

Additional financial information
53

Yield, cost and margin
Movement in yield, costs &
margins (Percent)1
FY2020 Q4-2020 Q3-2021 Q4-2021 FY2021
Yield on total interest-earning
assets2
8.38 8.32 7.30 7.31 7.49
- Yield on advances 9.45 9.41 8.44 8.45 8.76
Cost of funds 5.09 4.92 4.11 3.95 4.25
- Cost of deposits 4.96 4.78 3.97 3.80 4.12
Net interest margin2
3.73 3.87 3.67 3.84 3.69
- Domestic 4.01 4.14 3.78 3.94 3.84
- Overseas 0.35 0.28 0.34 0.44 0.34
1. Annualised for all interim periods
2. Includes interest on income tax refund ` 0.11 bn in Q4-2021 and ` 2.57 bn in FY2021 (Q3-2021: ` 1.96 bn, Q4-2020: ₹ 0.27
bn, FY2020: ` 2.70 bn) 54
slide 10
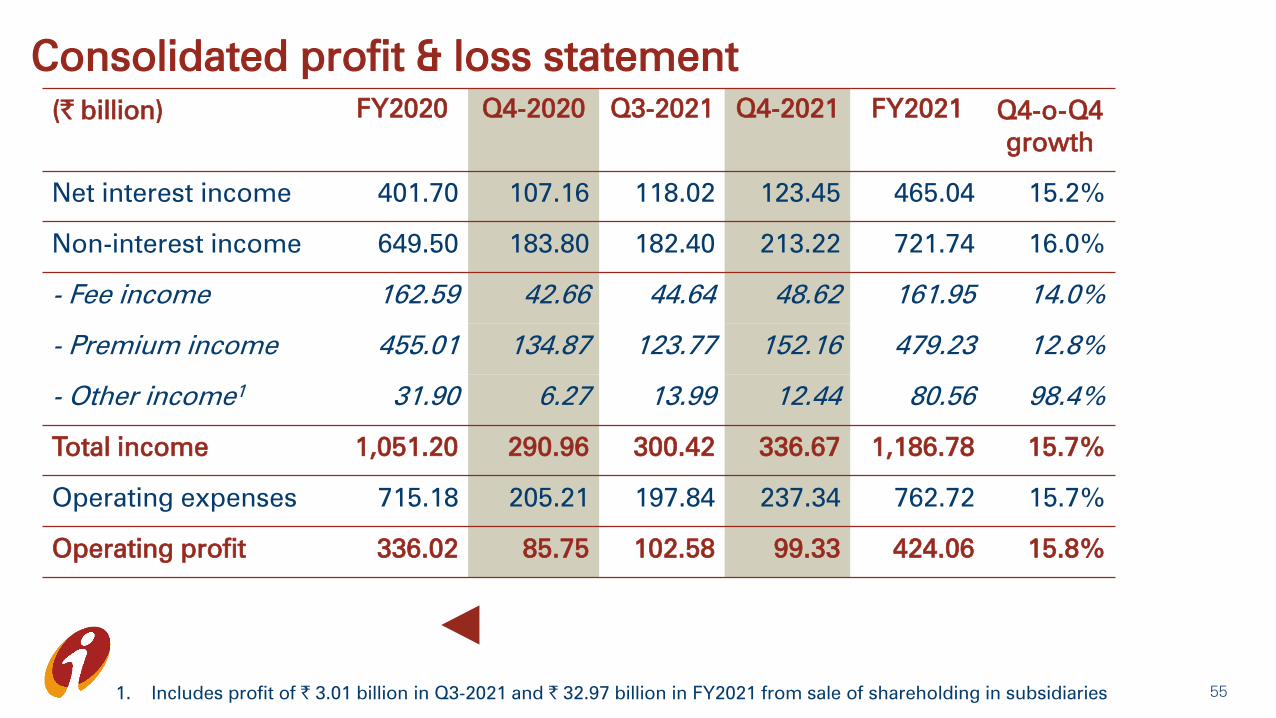
Consolidated profit & loss statement
(` billion) FY2020 Q4-2020 Q3-2021 Q4-2021 FY2021 Q4-o-Q4
growth
Net interest income 401.70 107.16 118.02 123.45 465.04 15.2%
Non-interest income 649.50 183.80 182.40 213.22 721.74 16.0%
- Fee income 162.59 42.66 44.64 48.62 161.95 14.0%
- Premium income 455.01 134.87 123.77 152.16 479.23 12.8%
- Other income1
31.90 6.27 13.99 12.44 80.56 98.4%
Total income 1,051.20 290.96 300.42 336.67 1,186.78 15.7%
Operating expenses 715.18 205.21 197.84 237.34 762.72 15.7%
Operating profit 336.02 85.75 102.58 99.33 424.06 15.8%
551. Includes profit of ` 3.01 billion in Q3-2021 and ` 32.97 billion in FY2021 from sale of shareholding in subsidiaries
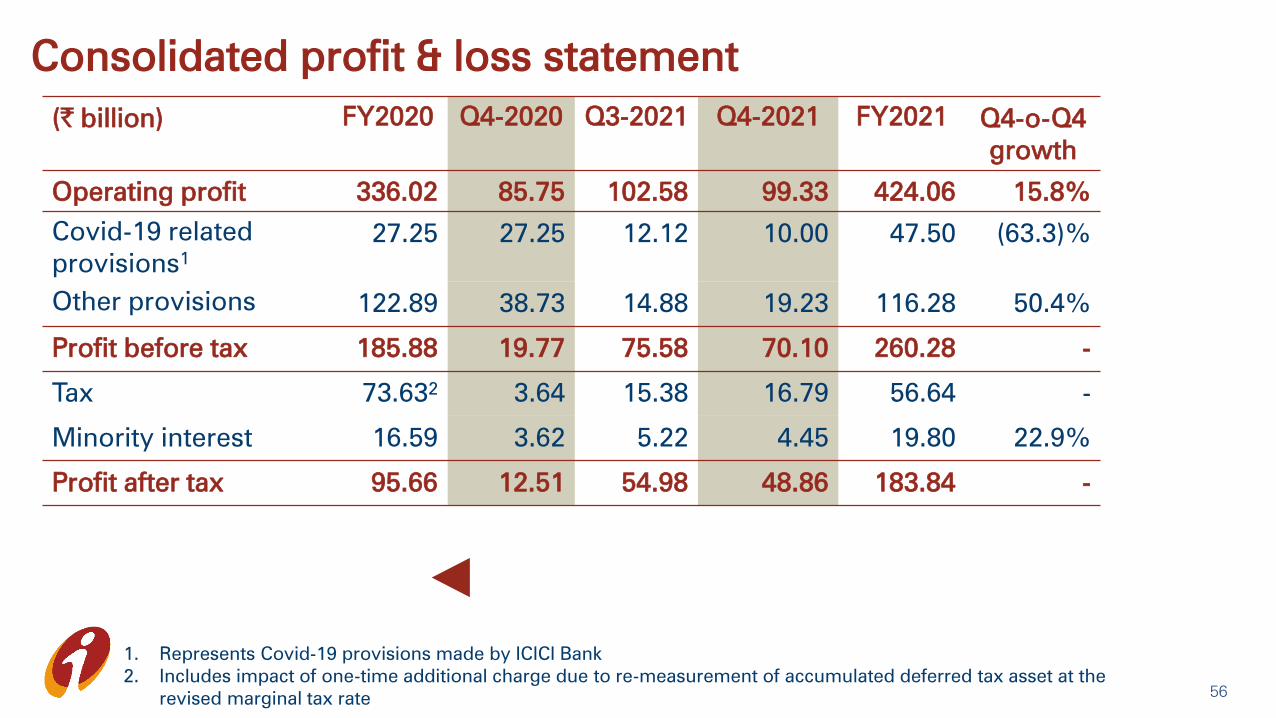
Consolidated profit & loss statement
(` billion) FY2020 Q4-2020 Q3-2021 Q4-2021 FY2021 Q4-o-Q4
growth
Operating profit 336.02 85.75 102.58 99.33 424.06 15.8%
Covid-19 related
provisions1
27.25 27.25 12.12 10.00 47.50 (63.3)%
Other provisions 122.89 38.73 14.88 19.23 116.28 50.4%
Profit before tax 185.88 19.77 75.58 70.10 260.28 -
Tax 73.632
3.64 15.38 16.79 56.64 -
Minority interest 16.59 3.62 5.22 4.45 19.80 22.9%
Profit after tax 95.66 12.51 54.98 48.86 183.84 -
56
1. Represents Covid-19 provisions made by ICICI Bank
2. Includes impact of one-time additional charge due to re-measurement of accumulated deferred tax asset at the
revised marginal tax rate
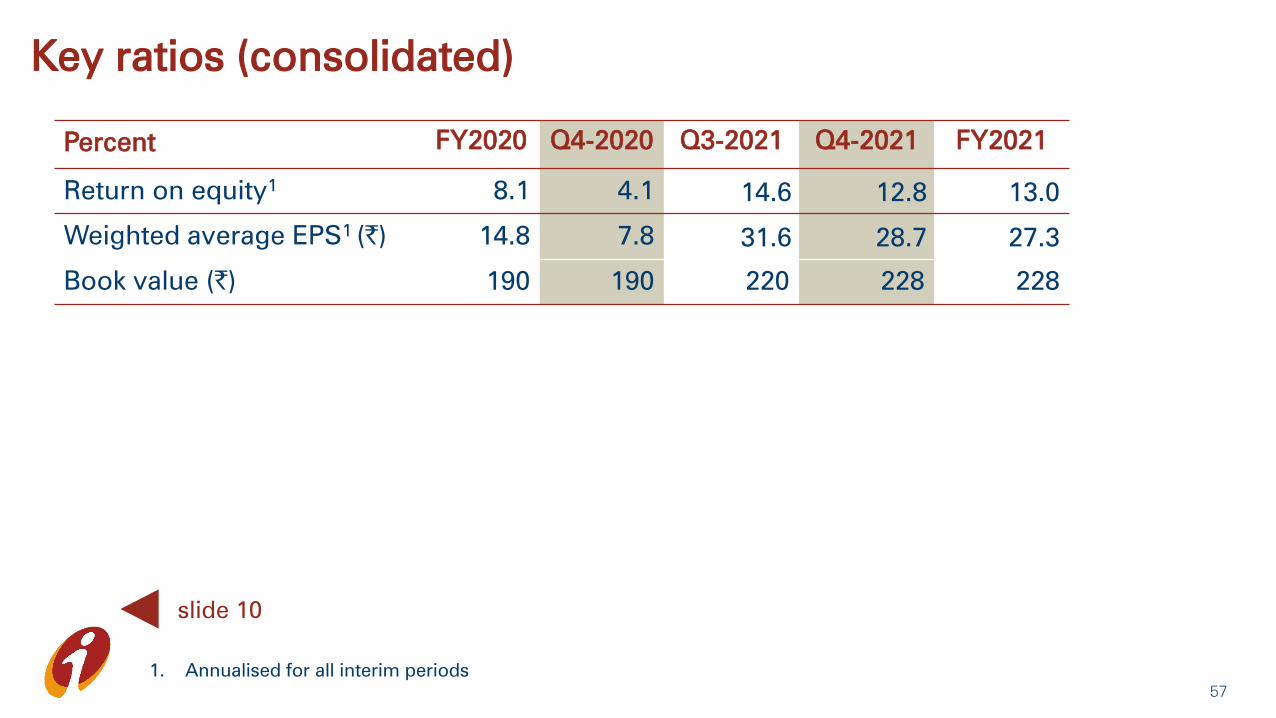
Key ratios (consolidated)
Percent FY2020 Q4-2020 Q3-2021 Q4-2021 FY2021
Return on equity1
8.1 4.1 14.6 12.8 13.0
Weighted average EPS1 (`) 14.8 7.8 31.6 28.7 27.3
Book value (`) 190 190 220 228 228
57
1. Annualised for all interim periods
slide 10

Balance sheet: liabilities
(` billion) Mar 31, 2020 Dec 31, 2020 Mar 31, 2021
Net worth 1,165.04 1,427.68 1,475.09
- Equity capital 12.95 13.81 13.83
- Reserves 1,152.09 1,413.87 1,461.26
Deposits 7,709.69 8,743.48 9,325.22
- Current 1,022.28 1,167.41 1,361.70
- Savings 2,455.91 2,786.74 2,954.53
- Term 4,231.51 4,789.32 5,008.99
Borrowings1
1,628.97 1,116.08 916.31
Other liabilities 479.95 644.93 587.71
Total liabilities 10,983.65 11,932.17 12,304.33
• Credit/deposit ratio of 75.3% on the domestic balance sheet at Mar 31,
2021 (Dec 31, 2020: 75.6%)
1. Including impact of rupee depreciation 58

Composition of borrowings
(` billion) Mar 31,
2020
Dec 31,
2020
Mar 31,
2021
Domestic 1,029.43 811.04 616.88
- Capital instruments 218.17 192.75 172.46
- Other borrowings 811.26 618.29 444.42
- Long term infrastructure bonds 194.77 194.97 194.67
Overseas borrowings1
599.53 305.04 299.43
Total borrowings 1,628.97 1,116.08 916.31
1. Including impact of rupee depreciation59
slide 13

Consolidated balance sheet
(` billion) Mar 31, 2020 Dec 31, 2020 Mar 31, 2021
Cash & bank balances 1,278.53 1,482.80 1,475.71
Investments 4,434.73 5,131.39 5,365.79
Advances 7,062.46 7,577.46 7,918.01
Fixed & other assets 997.20 1,001.88 978.61
Total assets 13,772.92 15,193.53 15,738.12
Net worth 1,229.60 1,522.07 1,575.88
Minority interest 67.95 92.57 95.88
Deposits 8,007.84 9,043.33 9,599.40
Borrowings 2,138.52 1,547.18 1,439.00
Liabilities on policies in force 1,454.86 1,942.27 2,031.80
Other liabilities 874.15 1,046.11 996.16
Total liabilities 13,772.92 15,193.53 15,738.12
60
slide 13
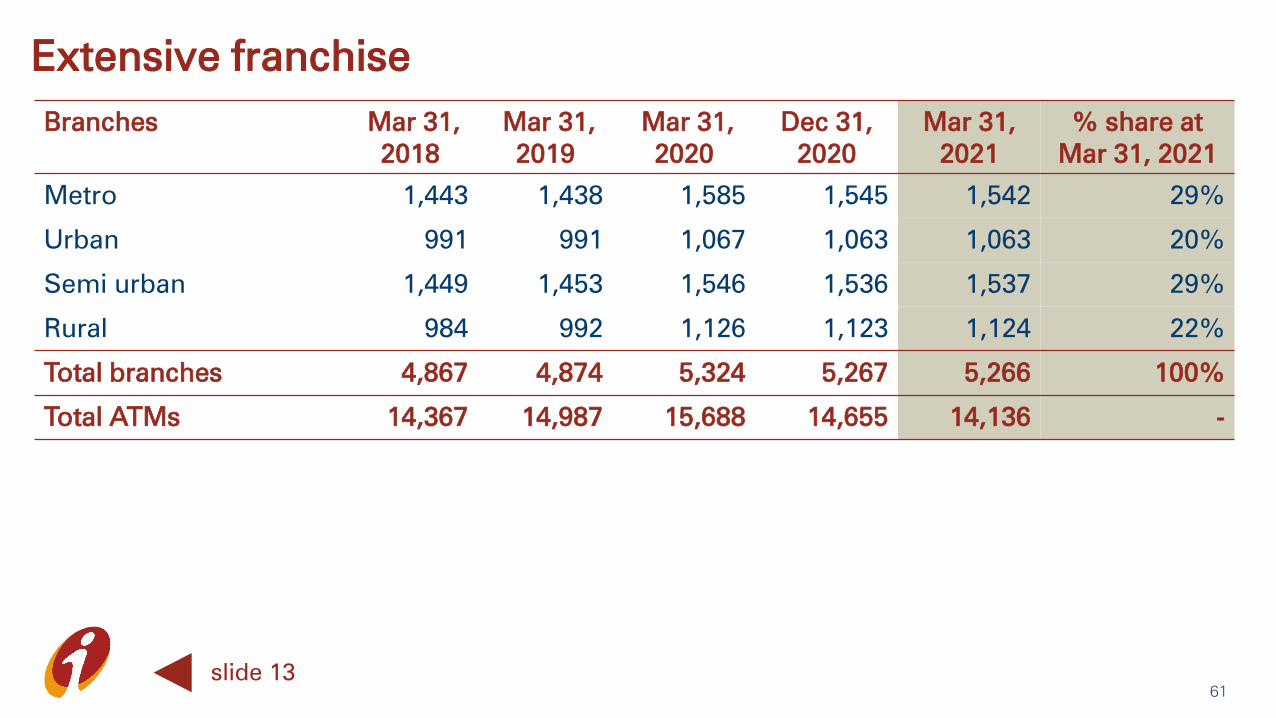
Extensive franchise
Branches Mar 31,
2018
Mar 31,
2019
Mar 31,
2020
Dec 31,
2020
Mar 31,
2021
% share at
Mar 31, 2021
Metro 1,443 1,438 1,585 1,545 1,542 29%
Urban 991 991 1,067 1,063 1,063 20%
Semi urban 1,449 1,453 1,546 1,536 1,537 29%
Rural 984 992 1,126 1,123 1,124 22%
Total branches 4,867 4,874 5,324 5,267 5,266 100%
Total ATMs 14,367 14,987 15,688 14,655 14,136 -
61
slide 13

• Floating rate loan book was ~70% of total domestic loans at Mar 31, 2021; of
which ~41% is linked to MCLR and ~45% is linked to repo rate/T-bills
Balance sheet: assets
(` billion) Mar 31,
2020
Dec 31,
2020
Mar 31,
2021
Cash & bank balances 1,191.56 1,342.70 1,331.28
Investments 2,495.31 2,752.61 2,812.87
- SLR investments 1,883.20 2,109.47 2,136.10
- Equity investment in subsidiaries 98.03 97.57 97.57
Advances 6,452.90 6,990.17 7,337.29
Fixed & other assets 843.88 846.69 822.89
- RIDF 1and related 287.57 296.48 311.78
Total assets 10,983.65 11,932.17 12,304.33
1. Rural Infrastructure Development Fund 62

Equity investment in subsidiaries
(` billion) Mar 31,
2020
Dec 31,
2020
Mar 31,
2021
ICICI Prudential Life Insurance 32.97 32.75 32.75
ICICI Bank Canada 18.74 18.74 18.74
ICICI Bank UK 18.05 18.05 18.05
ICICI Lombard General Insurance 13.49 13.31 13.31
ICICI Home Finance 11.12 11.12 11.12
ICICI Securities Limited 1.28 1.22 1.22
ICICI Securities Primary Dealership 1.58 1.58 1.58
ICICI AMC 0.61 0.61 0.61
ICICI Venture Funds Mgmt 0.05 0.05 0.05
Others 0.14 0.14 0.14
Total 98.03 97.57 97.57
63
slide 14

Portfolio composition
Mar 31, 2020 Dec 31, 2020 Mar 31, 2021
Domestic 85.8% 88.6% 90.0%
International 14.2% 11.4% 10.0%
Total consolidated advances
(` billion)
7,062 7,577 7,918
64
slide 14

Retail NPAs
65
slide 27
` in billionMar 31,
2020
Sep 30,
2020
Sep 30,
2020
(Proforma)1
Dec 31,
2020
Dec 31,
2020
(Proforma)1
Mar 31,
2021
Gross retail NPAs 83.321
92.63 106.40 68.88 144.09 151.30
- as a % of gross retail
advances
2.02% 2.13% 2.44% 1.49% 3.11% 3.04%
Net retail NPAs 36.80 33.73 42.58 17.84 60.25 62.63
- as a % of net retail
advances
0.90% 0.79% 0.99% 0.39% 1.31% 1.28%
1. Includes cases that have not been classified as non-performing pursuant to the Supreme Court’s interim order
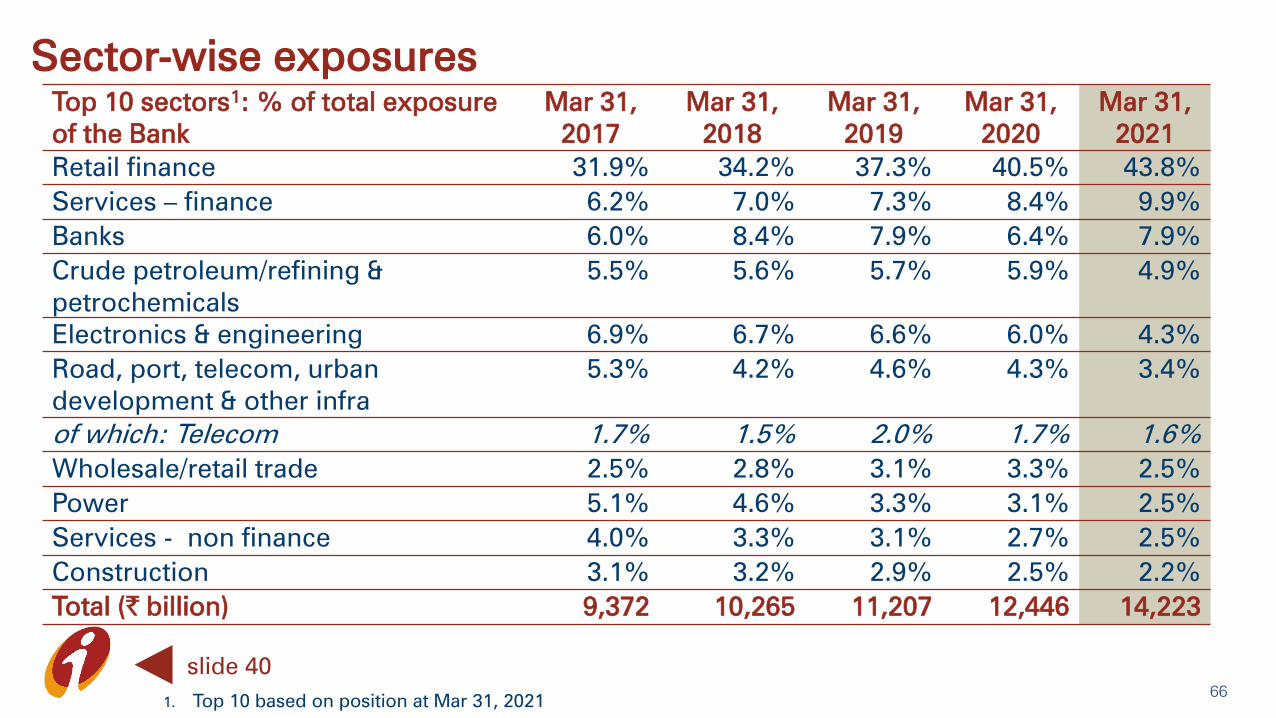
Sector-wise exposures
Top 10 sectors1: % of total exposure
of the Bank
Mar 31,
2017
Mar 31,
2018
Mar 31,
2019
Mar 31,
2020
Mar 31,
2021
Retail finance 31.9% 34.2% 37.3% 40.5% 43.8%
Services – finance 6.2% 7.0% 7.3% 8.4% 9.9%
Banks 6.0% 8.4% 7.9% 6.4% 7.9%
Crude petroleum/refining &
petrochemicals
5.5% 5.6% 5.7% 5.9% 4.9%
Electronics & engineering 6.9% 6.7% 6.6% 6.0% 4.3%
Road, port, telecom, urban
development & other infra
5.3% 4.2% 4.6% 4.3% 3.4%
of which: Telecom 1.7% 1.5% 2.0% 1.7% 1.6%
Wholesale/retail trade 2.5% 2.8% 3.1% 3.3% 2.5%
Power 5.1% 4.6% 3.3% 3.1% 2.5%
Services - non finance 4.0% 3.3% 3.1% 2.7% 2.5%
Construction 3.1% 3.2% 2.9% 2.5% 2.2%
Total (` billion) 9,372 10,265 11,207 12,446 14,223
1. Top 10 based on position at Mar 31, 202166
slide 40
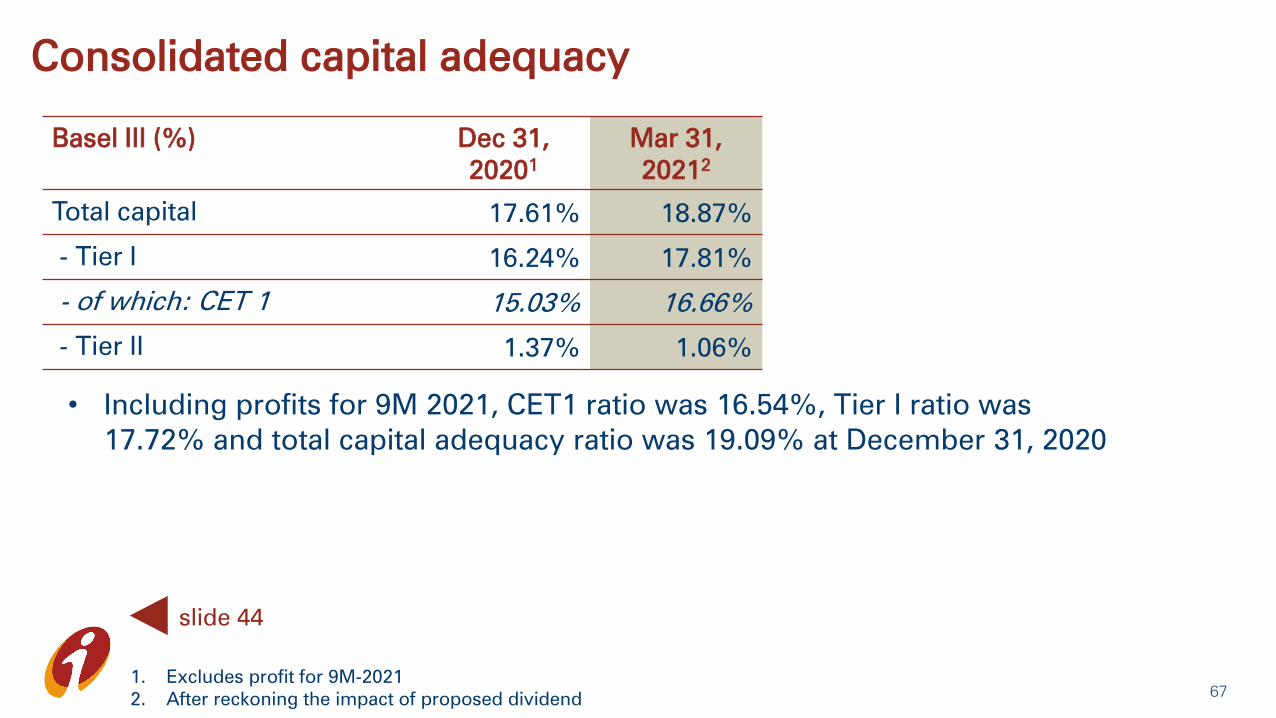
Consolidated capital adequacy
Basel III (%) Dec 31,
20201
Mar 31,
20212
Total capital 17.61% 18.87%
- Tier I 16.24% 17.81%
- of which: CET 1 15.03% 16.66%
- Tier II 1.37% 1.06%
1. Excludes profit for 9M-2021
2. After reckoning the impact of proposed dividend67
slide 44
• Including profits for 9M 2021, CET1 ratio was 16.54%, Tier I ratio was
17.72% and total capital adequacy ratio was 19.09% at December 31, 2020
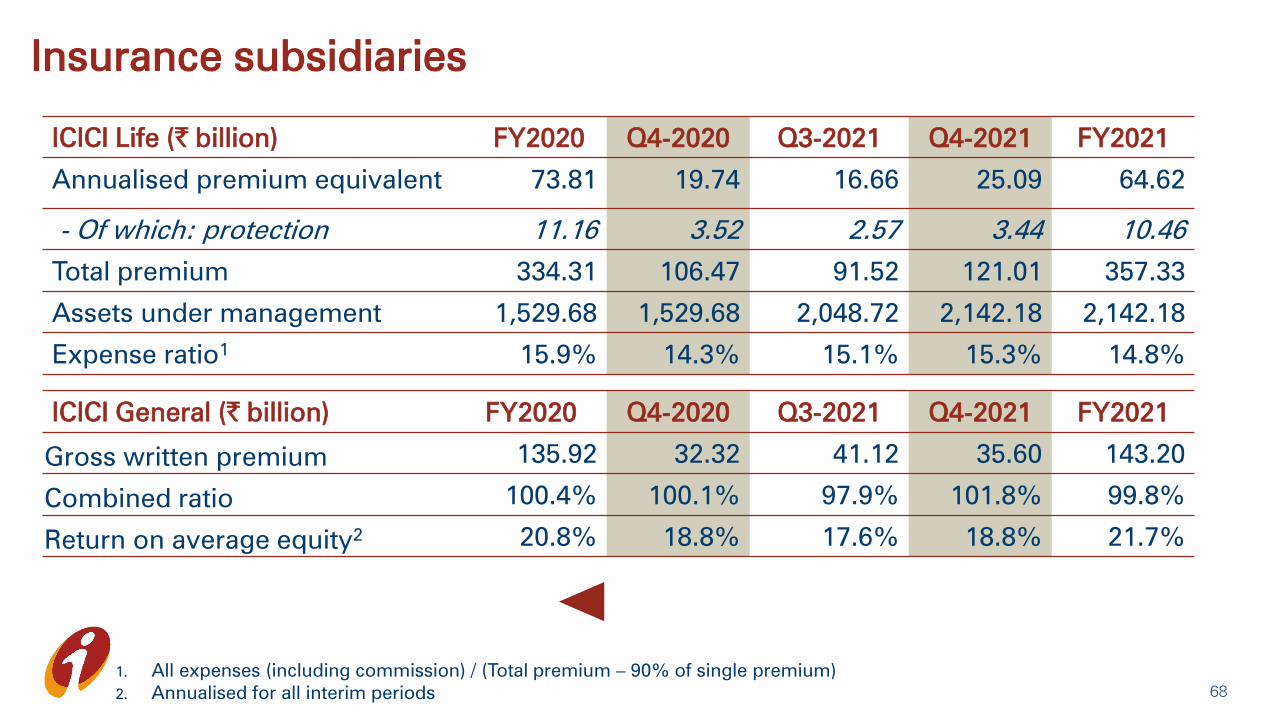
Insurance subsidiaries
ICICI Life (` billion) FY2020 Q4-2020 Q3-2021 Q4-2021 FY2021
Annualised premium equivalent 73.81 19.74 16.66 25.09 64.62
- Of which: protection 11.16 3.52 2.57 3.44 10.46
Total premium 334.31 106.47 91.52 121.01 357.33
Assets under management 1,529.68 1,529.68 2,048.72 2,142.18 2,142.18
Expense ratio1
15.9% 14.3% 15.1% 15.3% 14.8%
1. All expenses (including commission) / (Total premium – 90% of single premium)
2. Annualised for all interim periods
ICICI General (` billion) FY2020 Q4-2020 Q3-2021 Q4-2021 FY2021
Gross written premium 135.92 32.32 41.12 35.60 143.20
Combined ratio 100.4% 100.1% 97.9% 101.8% 99.8%
Return on average equity2 20.8% 18.8% 17.6% 18.8% 21.7%
68
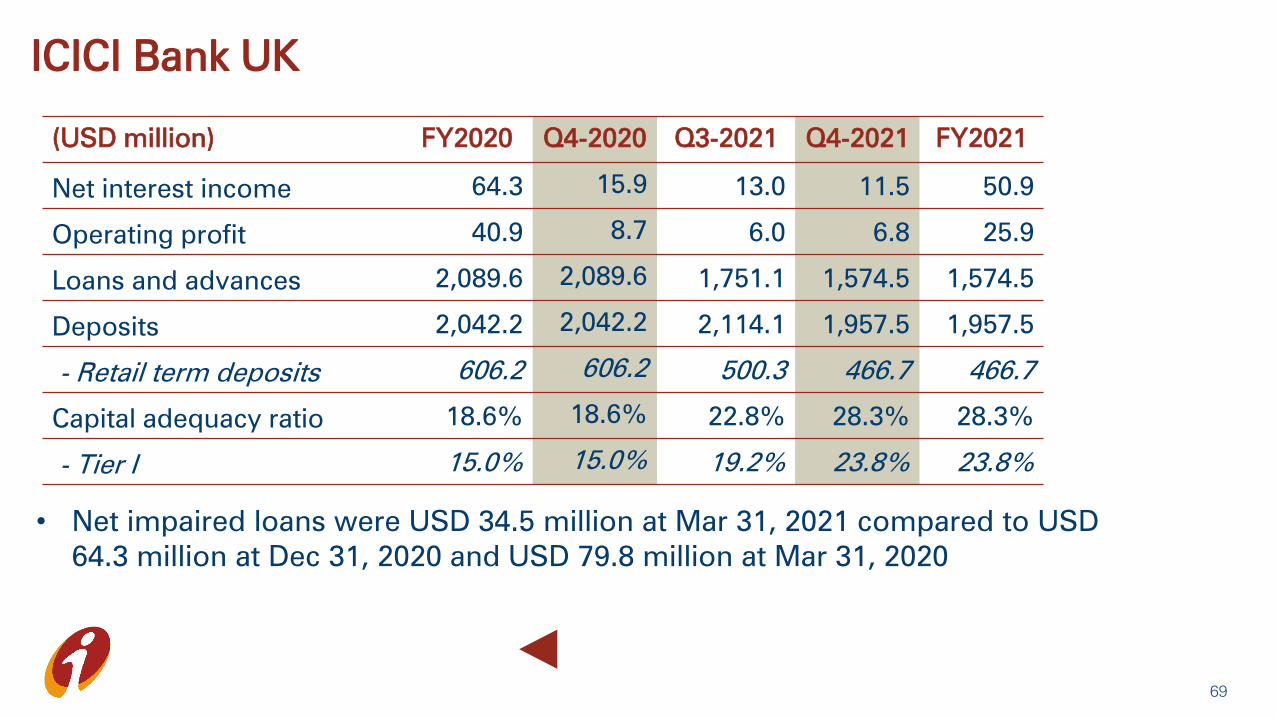
ICICI Bank UK
(USD million) FY2020 Q4-2020 Q3-2021 Q4-2021 FY2021
Net interest income 64.3 15.9 13.0 11.5 50.9
Operating profit 40.9 8.7 6.0 6.8 25.9
Loans and advances 2,089.6 2,089.6 1,751.1 1,574.5 1,574.5
Deposits 2,042.2 2,042.2 2,114.1 1,957.5 1,957.5
- Retail term deposits 606.2 606.2 500.3 466.7 466.7
Capital adequacy ratio 18.6% 18.6% 22.8% 28.3% 28.3%
- Tier I 15.0% 15.0% 19.2% 23.8% 23.8%
• Net impaired loans were USD 34.5 million at Mar 31, 2021 compared to USD
64.3 million at Dec 31, 2020 and USD 79.8 million at Mar 31, 2020
69

ICICI Bank UK1
Asset profileLiability profile
Total liabilities: USD 2.96 bnTotal assets: USD 2.96 bn
70
1. At Mar 31, 2021
2. Includes cash & advances to banks and T Bills
3. Includes securities re-classified to loans & advances
2
3
2
3
2
3
3
2

ICICI Bank Canada
(CAD million) FY2020 Q4-2020 Q3-2021 Q4-2021 FY2021
Net interest income 95.3 20.0 10.3 10.1 46.3
Operating profit 76.1 18.1 (8.1) 6.2 13.7
Loans and advances 5,742.6 5,742.6 5,249.9 5,086.7 5,086.7
- Residential mortgages 3,686.5 3,686.5 3,671.8 3,627.32 3,627.32
Deposits 3,015.4 3,015.4 2,822.3 2,716.4 2,716.4
Capital adequacy ratio 19.1% 19.1% 22.9% 24.1% 24.1%
- Tier I 18.4% 18.4% 22.2% 23.3% 23.3%
• Net impaired loans at Mar 31, 2021 were CAD 1.1 million compared to CAD 7.8
million at Dec 31, 2020 and CAD 4.4 million at Mar 31, 2020
71

ICICI Bank Canada1
Liability profileAsset profile
Total liabilities: CAD 5.96 bnTotal assets: CAD 5.96 bn
72
1. At Mar 31, 2021
2. Includes cash & placements with banks and government securities
3. Insured mortgages include CAD 2,572.33 million at Mar 31, 2021 (Dec 31, 2020: CAD 2,599.0 million) of securitised mortgages
4. As per IFRS, proceeds of CAD 2,541.7 million at Mar 31, 2021 (Dec 31, 2020: CAD 2,569.6 million) on securitisation of
residential mortgages are considered a part of borrowings
2
3
4
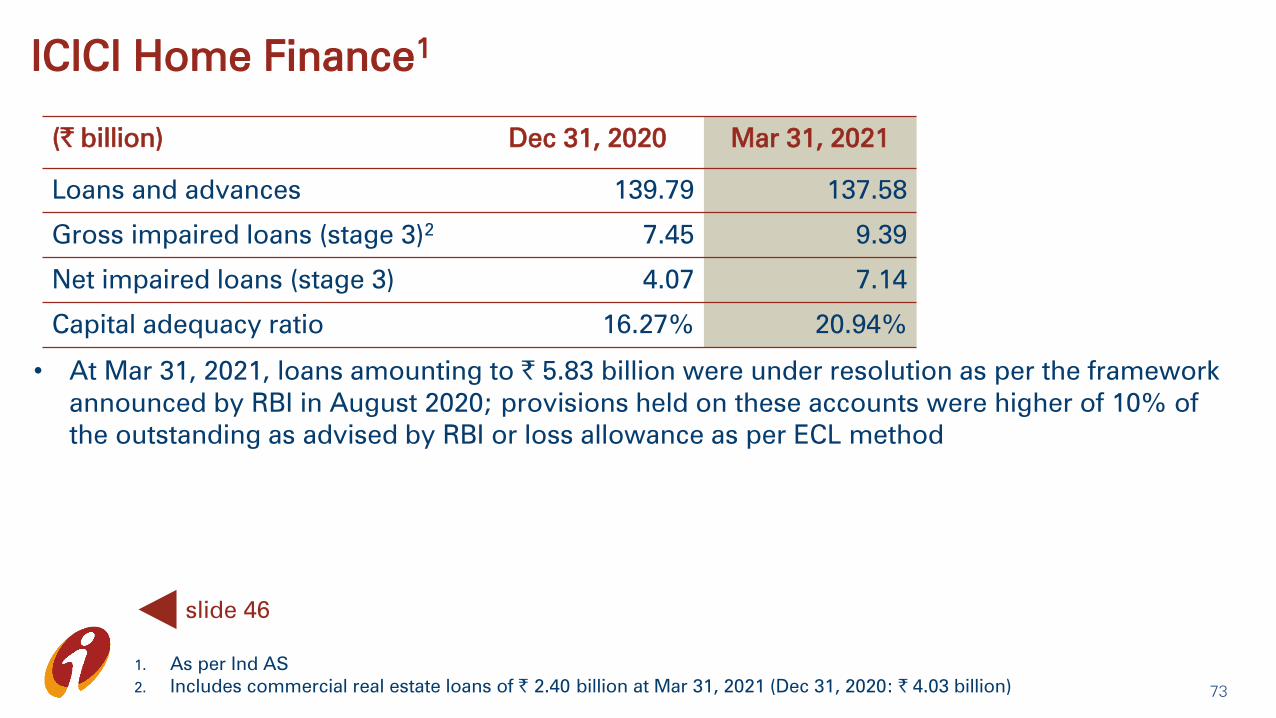
ICICI Home Finance1
(` billion) Dec 31, 2020 Mar 31, 2021
Loans and advances 139.79 137.58
Gross impaired loans (stage 3)2
7.45 9.39
Net impaired loans (stage 3) 4.07 7.14
Capital adequacy ratio 16.27% 20.94%
1. As per Ind AS
2. Includes commercial real estate loans of ` 2.40 billion at Mar 31, 2021 (Dec 31, 2020: ` 4.03 billion)73
slide 46
• At Mar 31, 2021, loans amounting to ` 5.83 billion were under resolution as per the framework
announced by RBI in August 2020; provisions held on these accounts were higher of 10% of
the outstanding as advised by RBI or loss allowance as per ECL method
Related Documents