2020 Fourth Quarter and Full Year Earnings Call Presentation March 12, 2021 Greg Yull | President & CEO Jeff Crystal | CFO

Welcome message from author
This document is posted to help you gain knowledge. Please leave a comment to let me know what you think about it! Share it to your friends and learn new things together.
Transcript

2020 Fourth Quarter and Full Year Earnings Call PresentationMarch 12, 2021
Greg Yull | President & CEOJeff Crystal | CFO

INTERTAPE POLYMER GROUP 2March 12, 2021
Safe Harbor Statement Certain statements and information included in this presentation constitute "forward-looking information" within the meaning of applicable Canadian securities legislation and "forward-looking statements" within the meaning of Section 27A of the Securities Act of 1933, as amended, and Section 21E of the Securities Exchange Act of 1934, as amended (collectively, "forward-looking statements"), which are made in reliance upon the protections provided by such legislation for forward-looking statements. All statements other than statements of historical facts included in this presentation, including statements regarding the Company's 2021 expected capital expenditure projects and related expenses, the Company's 2021 outlook, including its expected revenue, free cash flow, adjusted EBITDA and total capex, and the Company's growth strategy to deliver durable long-term value and its related positioning for such growth, may constitute forward-looking statements. These forward-looking statements are based on current beliefs, assumptions, expectations, estimates, forecasts and projections made by the Company's management. Words such as "may," "will," "should," "expect," "continue," "intend," "estimate," "anticipate," "plan," "foresee," "believe," or "seek" or the negatives of these terms or variations of them or similar terminology are intended to identify such forward-looking statements. Although the Company believes that the expectations reflected in these forward-looking statements are reasonable, these statements, by their nature, involve risks and uncertainties and are not guarantees of future performance. Such statements are also subject to assumptions concerning, among other things: business conditions and growth or declines in the Company's industry, the Company's customers' industries and the general economy, including as a result of the impact of COVID-19; the anticipated benefits from the Company's greenfield developments and manufacturing facility expansions; the anticipated benefits from the Company’s acquisitions and partnerships; accounting adjustments; the anticipated benefits from the Company’s capital expenditures; the quality and market reception of the Company's products; the effective tax rate and income tax expenses; the Company's anticipated business strategies; risks and costs inherent in litigation; legal and regulatory developments, including as related to COVID-19; risks and costs inherent in the Company’s intellectual property; the Company’s ability to maintain and improve quality and customer service; the Company’s ability to retain, and adequately develop and incentivize, its management team and key employees; anticipated trends in the Company's business; anticipated cash flows from the Company’s operations; the Company’s flexibility to allocate capital as a result of the Notes Offering; availability of funds under the Company’s 2018 Credit Facility; the Company's ability to continue to control costs; the impact of raw material price fluctuations; movements in the prices of key inputs such as raw material, freight, energy and labor; government policies, including those specifically regarding the manufacturing industry, such as industrial licensing, environmental regulations, labor and safety regulations, import restrictions and duties, intellectual property laws, excise duties, sales taxes, and value added taxes; accidents and natural disasters; changes to accounting rules and standards; expected strategic and financial benefits from the Company’s ongoing capital investment and mergers and acquisitions programs; and other factors beyond the Company's control. The Company can give no assurance that these statements and expectations will prove to have been correct. Actual outcomes and results may, and often do, differ from what is expressed, implied or projected in such forward-looking statements, and such differences may be material. You are cautioned not to place undue reliance on any forward-looking statement.
For additional information regarding important factors that could cause actual results to differ materially from those expressed in these forward-looking statements and other risks and uncertainties, and the assumptions underlying the forward-looking statements, you are encouraged to read "Item 3. Key Information - Risk Factors," "Item 5. Operating and Financial Review and Prospects (Management's Discussion & Analysis)" and statements located elsewhere in the Company's annual report on Form 20-F for the year ended December 31, 2019 and the other statements and factors contained in the Company's filings with the Canadian securities regulators and the US Securities and Exchange Commission. Each of these forward-looking statements speaks only as of the date of this presentation. The Company will not update these statements unless applicable securities laws require it to do so.
This presentation contains certain non-GAAP financial measures as defined under applicable securities legislation, including Adjusted EBITDA, Adjusted EBITDA Margin, Adjusted Net Earnings, Adjusted Earnings Per Share, Total Leverage Ratio and Free Cash Flow. The Company has included these non-GAAP financial measures because it believes that they allow investors to make a more meaningful comparison between periods of the Company’s performance, underlying business trends and the Company’s ongoing operations. The Company further believes these measures may be useful in comparing its operating performance with the performance of other companies that may have different financing and capital structures, and tax rates. Adjusted EBITDA excludes costs that are not considered by management to be representative of the Company’s underlying core operating performance, including certain non-operating expenses, non-cash expenses and non-recurring expenses. In addition, adjusted EBITDA is used by management to set targets and is a metric that, among others, can be used by the Company’s Compensation Committee to establish performance bonus metrics and payout, and by the Company’s lenders and investors to evaluate the Company’s performance and ability to service its debt, finance capital expenditures and acquisitions, and provide for the payment of dividends to shareholders. The Company has included Adjusted Net Earnings and Adjusted Earnings Per Share because it believes that they permit investors to make a more meaningful comparison of the Company’s performance between periods presented by excluding certain non-cash expenses and nonrecurring expenses. In addition, Adjusted Net Earnings and Adjusted Earnings Per Share are used by management in evaluating the Company’s performance because it believes they provide indicators of the Company’s performance that are often more meaningful than GAAP financial measures for the reasons stated in the previous sentence. The Company has included Free Cash Flows because it is used by management and investors in evaluating the Company’s performance and liquidity. The Company has included Total Leverage Ratio because it believes that it allows investors to make a meaningful comparison of the Company’s liquidity level and borrowing flexibility. In addition, Total Leverage Ratio is used by management in evaluating the Company’s performance because it believes that it allows management to monitor the Company's liquidity level and borrowing flexibility as well as evaluate its capacity to deploy capital to meet its strategic objectives. As required by applicable securities legislation, the Company has provided definitions of these non-GAAP measures contained in this presentation, as well as a reconciliation of each of them to the most directly comparable GAAP measure, on its website at http://www.itape.com under “Investor Relations” and “Events and Presentations” and “Investor Presentations”. You are encouraged to review the related GAAP financial measures and the reconciliation of non-GAAP measures to their most directly comparable GAAP measures set forth on the website and should consider non-GAAP measures only as a supplement to, not as a substitute for or as a superior measure to, measures of financial performance prepared in accordance with GAAP.
Variance, ratio and percentage changes in this presentation are based on unrounded numbers. All dollar amounts are in US dollars.

INTERTAPE POLYMER GROUP 3March 12, 2021
2020 Overview
Revenue growth to $1,213 million(1)
5%
Adjusted EBITDA(2) growthto $211 million(1)
23%
$134MFree Cash Flow (2)
2.2x
(1) 2020 vs. 2019 year-end comparison periods(2) Non-GAAP financial measure. Please see the “Safe Harbor Statement” for an explanation of the Company’s use of these measures
throughout this presentation and a cross-reference to a reconciliation to their respective most directly comparable GAAP measure.
Total Leverage Ratio (2) Adjusted EBITDA margin(2)
up 250+ bps(1)
IPG: Structurally changed in last 5 years
17.4%
INTERTAPE POLYMER GROUP 4March 12, 2021
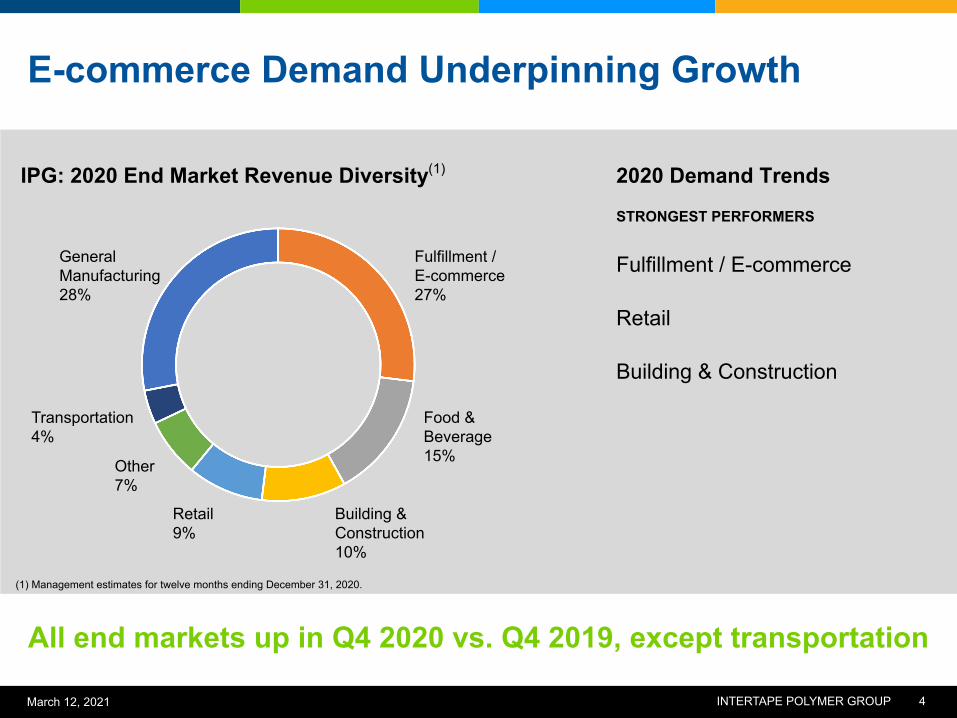
E-commerce Demand Underpinning Growth
Fulfillment / E-commerce27%
2020 Demand TrendsIPG: 2020 End Market Revenue Diversity(1)
General Manufacturing28%
Transportation4%
Retail9%
Other 7%
Building & Construction10%
Food & Beverage 15%
(1) Management estimates for twelve months ending December 31, 2020.
All end markets up in Q4 2020 vs. Q4 2019, except transportation
STRONGEST PERFORMERS
Fulfillment / E-commerce
Retail
Building & Construction
INTERTAPE POLYMER GROUP 5March 12, 2021
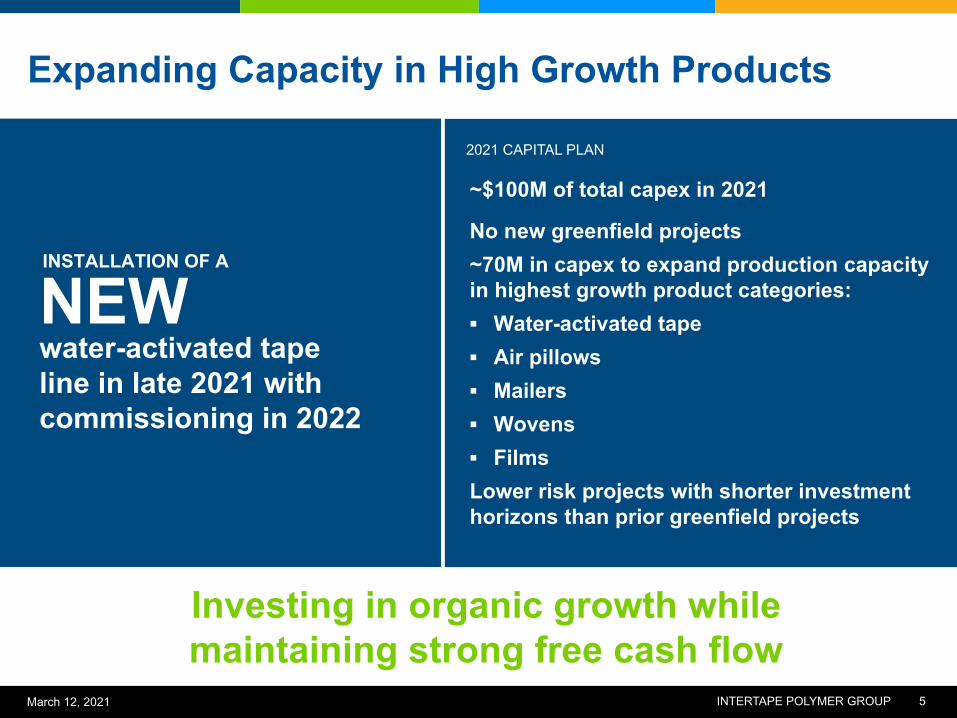
Investing in organic growth whilemaintaining strong free cash flow
Expanding Capacity in High Growth Products
Cost savings measures implemented - matched production with demand in Q2Productivity and cost savings performance tracking ahead of expectation
2021 CAPITAL PLAN
~$100M of total capex in 2021
No new greenfield projects~70M in capex to expand production capacity in highest growth product categories:▪ Water-activated tape▪ Air pillows ▪ Mailers▪ Wovens▪ FilmsLower risk projects with shorter investment horizons than prior greenfield projects
INSTALLATION OF A
NEWwater-activated tapeline in late 2021 with commissioning in 2022

INTERTAPE POLYMER GROUP 6March 12, 2021
$100M$220-240Mtotal capexadjusted EBITDA(2)
2021 Outlook
revenue(1)$1.3-1.4B
Track record of managing spreadto retain dollar contribution margin
(1) The figure includes recent increases in raw material prices, which are expected to have a direct impact on selling prices.(2) Non-GAAP financial measure. Please see the “Safe Harbor Statement” for an explanation of the Company’s use of these measures and a cross-reference to a reconciliation to their respective most directly comparable GAAP measure.
free cash flow(2)$80-100M

INTERTAPE POLYMER GROUP 7March 12, 2021
Embracing Sustainability Across the Organization
▪ Water-activated tape
▪ Exlfilmplus® shrink film
▪ NovaShield® structure membrane
▪ StretchFLEX® stretch film
▪ SuperFLEX® stretch film
CRADLE TO CRADLE CERTIFIEDTM
IPG PRODUCTS
1. Product and material innovation2. Circular economy solutions3. Operational footprint4. People and communities
Core growth driver for packaging and protective solutions to meet the needs of customers
CONTINUOUS IMPROVEMENTS IN DAY TO DAY OPERATIONS DEMONSTRATE SUSTAINABILITY AND TRANSPARENCY AS CORE TENETS

INTERTAPE POLYMER GROUP 8March 12, 2021
Q4 2019 to Q4 2020 FY2019 to FY2020Beginning 291.5 1,158.5 Volume/Mix effect 46.4 15.9 % 54.0 4.7 %Price effect 2.8 1.0 % (10.3) (0.9) %Acquisitions (1) 2.5 0.8 % 11.7 1.0 %Foreign exchange impact 0.9 0.3 % (1.0) (0.1) %Ending 344.1 18.0 % 1,213.0 4.7 %
Revenue Analysis
+ E-COMMERCE+ BUILDING & CONSTRUCTION + Water activated tape+ Protective packaging+ Machines+ Certain industrial and carton sealing tapes
Q4 2020 to Q4 2019 FY 2020 to FY 2019
+ E-COMMERCE+ BUILDING & CONSTRUCTION+ Water activated tape+ Protective packaging+ Machines+ Certain industrial tapes
(USD Millions)
(1) Results for Nortech reflected beginning on the date acquired, February 11, 2020.

INTERTAPE POLYMER GROUP 9March 12, 2021
Q4 2020 Q4 2019Q4 2020 vs
Q4 2019Full Year
2020Full Year
20192020 vs
2019Revenue 344.1 291.5 18.0 % 1,213.0 1,158.5 4.7 %Gross margin 25.7 % 20.7 % 502 bps 23.8 % 21.3 % 250 bpsSG&A 53.4 32.5 64.2 % 157.5 136.7 15.2 %SG&A excluding share-based compensation 35.0 34.1 2.8 % 134.6 136.2 -1.2 %IPG Net Earnings 17.1 11.6 46.9 % 72.7 41.2 76.3 %IPG EPS, fully diluted 0.28 0.20 44.3 % 1.22 0.70 74.4 %Adjusted net earnings (2) 32.4 13.6 138.6 % 89.7 57.8 55.2 %Adjusted EPS, fully diluted (2) 0.54 0.23 134.4 % 1.50 0.98 53.5 %Adjusted EBITDA (2) 67.7 43.8 54.7 % 211.1 172.2 22.6 %Adjusted EBITDA margin (2) 19.7 % 15.0 % 466 bps 17.4 % 14.9 % 254 bpsEffective tax rate 22.2 % 17.3 % 487 bps 20.7 % 28.3 % -769 bps
Summary Q4 2020 and Annual 2020 Results(USD Millions) (1)
(1) Excluding earnings per share (“EPS”).(2) Non-GAAP financial measure. Please see the “Safe Harbor Statement” for an explanation of the Company’s use of these measures and a cross-
reference to a reconciliation to their respective most directly comparable GAAP measure.

INTERTAPE POLYMER GROUP 10March 12, 2021
High Performing Team with Strong Business Fundamentals Positioned for Growth
▪ World class, low cost manufacturing base
▪ Stronger & sustainable margin profile
▪ Stronger free cash flow
▪ Solid balance sheet
Executing our growth strategyto deliver durable long-term value
HOW IPG IS DIFFERENT IN 2021
▪ E-commerce adoption pulled forward by COVID
▪ End market demand stronger across multiple product categories
▪ Demand growth driving capacity expansion
MARKET DRIVERS
INTERTAPE POLYMER GROUP 11March 12, 2021
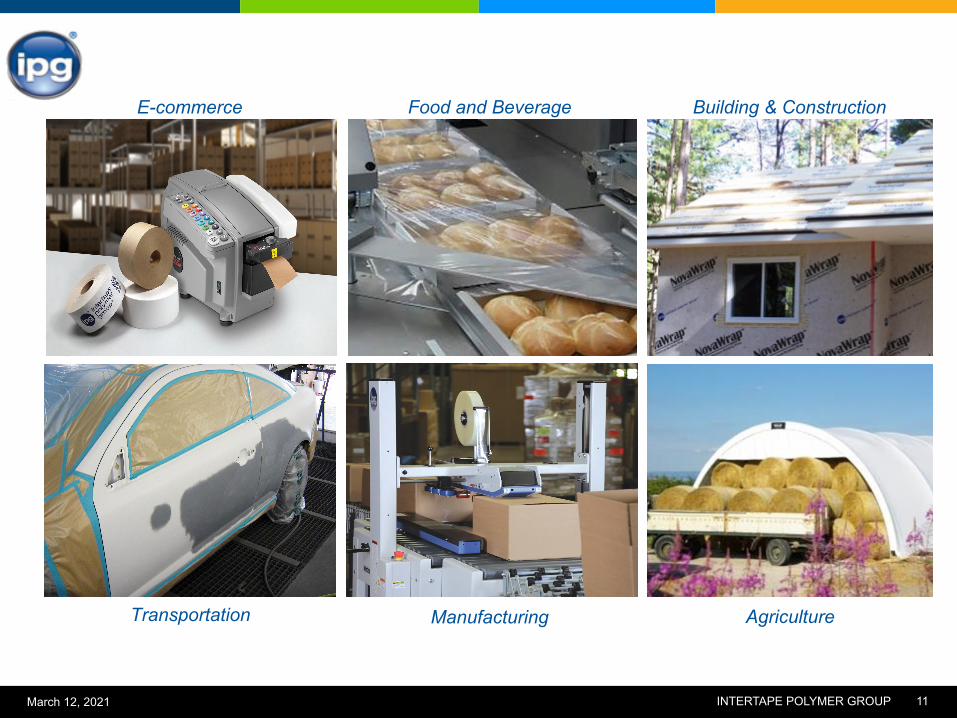
E-commerce Food and Beverage Building & Construction
Transportation Manufacturing Agriculture
Related Documents