Q4 2019 Financial Results Presentation March 13, 2020

Welcome message from author
This document is posted to help you gain knowledge. Please leave a comment to let me know what you think about it! Share it to your friends and learn new things together.
Transcript

Q4 2019 Financial Results PresentationMarch 13, 2020

Forward Looking Statements and Disclaimer
1
This presentation contains certain statements that may be deemed to be “forward-looking statements” within the meaning of applicable federal securities laws.All statements included in this presentation which are not historical or current facts (including our financial forecast and any other statements concerning plansand objectives of management for future operations, cash flows, financial position and economic performance, or assumptions related thereto, including inparticular, the likelihood of our success in developing and expanding our business) are forward-looking statements. Statements that are predictive in nature, thatdepend upon or refer to future events or conditions, or that include words such as “expects,” “anticipates,” “intends,” “plans,” “believes,” “estimates,” “projects,”“forecasts,” “may,” “should” and similar expressions are forward-looking statements.
This presentation of the Dynagas LNG Partners LP (the "Partnership") also includes forecasts, projections and other predictive statements that represent thePartnership's assumptions and expectations in light of currently available information. Forecasts and projections are inherently subject to numerous risks,variables, uncertainties and other market influences which may be outside of the Partnership's control. Therefore, the actual results that the Partnership achievesmay differ significantly from the projections contained in this presentation and there is no guarantee as to the accuracy of the predictive statements containedherein. The projections and forecasts contained in this presentation were not prepared in compliance with published guidelines of the U.S. Securities andExchange Commission or the guidelines established by the American Institute of Certified Public Accountants regarding projections or forecasts. ThePartnership's independent public accountants have not examined or compiled these projections or forecasts, and have not expressed an opinion or assurancewith respect to these figures and accordingly assume no responsibility for them. The Partnership undertakes no obligation to update or revise this forward-looking information to reflect events or circumstances that arise after the date of this Presentation or to reflect the occurrence of unanticipated events. Inevitably,some assumptions will not materialize, and unanticipated events and circumstances may materially affect the Partnership's ultimate financial results.
Although the “Partnership” believes that its expectations stated in this presentation are based on reasonable assumptions, forward-looking statements involverisks and uncertainties that may cause actual future activities and results of operations to be materially different from those suggested or described in thispresentation. Among the important factors that could cause actual results to differ materially from those in the forward-looking statements are: changes in liquidnatural gas (LNG) market trends, including charter rates; changes in the supply and demand for LNG; changes in trading patterns that affect the opportunitiesfor the profitable operation of LNG carriers; our anticipated growth strategies; the Partnership’s ability to acquire new vessels from its sponsor, Dynagas HoldingLtd., or third parties; increases in costs; the potential for the exercise of purchase options or early termination of charters by the Partnership’s charterers and thePartnership’s inability to replace assets and/or long-term contracts; and changes in the ability of the Partnership to obtain additional financing; the effect of theworldwide economic slowdown; turmoil in the global financial markets; turmoil created from pandemics, epidemics and quarantines; fluctuations in currencies andinterest rates; general market conditions, including fluctuations in charter hire rates and vessel values; changes in our operating expenses, including drydockingand insurance costs and bunker prices; forecasts of our ability to make cash distributions on the units or any increases or decreases in our cash distributions; ourfuture financial condition or results of operations and our future revenues and expenses; the repayment of debt and settling of interest rate swaps; our ability tomake additional borrowings and to access debt and equity markets; planned capital expenditures and availability of capital resources to fund capital expenditures;our ability to maintain long-term relationships with major LNG traders; our ability to leverage our Sponsor’s relationships and reputation in the shipping industry;our ability to realize the expected benefits from acquisitions; our ability to maximize the use of our vessels, including the re-deployment or disposition of vesselsno longer under long-term time charters; future purchase prices of newbuildings and secondhand vessels and timely deliveries of such vessels; our ability tocompete successfully for future chartering and newbuilding opportunities; acceptance of a vessel by its charterer; termination dates and extensions of charters;
2
In addition, unpredictable or unknown factors herein also could have material adverse effects on forward-looking statements. Please read the Partnership’s filings withthe Securities and Exchange Commission for more information regarding these factors and the risks faced by the Partnership. You may obtain these documents forfree by visiting EDGAR on the SEC website at www.sec.gov. This presentation is for informational purposes only and does not constitute an offer to sell securities ofthe Partnership. The Partnership expressly disclaims any intention or obligation to revise or publicly update any forward-looking statements whether as a result of newinformation, future events or otherwise. The forward-looking statements contained herein are expressly qualified by this cautionary notice to recipients.
Forward Looking Statements and Disclaimer

3
Recent Developments
Quarter Highlights Net Income of $5.5 million and earnings per common unit of $0.07;
Adjusted Net Income(1) and Adjusted EBITDA(1) of $5.6 million and $24.0 million respectively.Distributable Cash Flow(1) of $10.2 million;
100% fleet utilization;
Repayment of the $250 million 6.25% senior unsecured notes on October 30, 2019; and
Cash distribution of $0.5625 per unit on its Series A Preferred Units (NYSE: “DLNG PR A”) forthe period from August 12, 2019 to November 11, 2019 and $0.546875 per unit on the SeriesB Preferred Units (NYSE: “DLNG PR B”) for the period from August 22, 2019 to November21, 2019.
Subsequent Highlights Paid in February 2020 cash distribution of $0.5625 to each Series A Preferred Unit holder forthe period from November12, 2019 to February 11, 2020; and
Paid in February 2020 cash distribution of $0.546875 to each Series B Preferred Unit holderfor the period from November 22, 2019 to February 21, 2020.
(1) Adjusted Net Income, Adjusted EBITDA and Distributable Cash Flow are not recognized measures under U.S. GAAP. Please refer tothe definitions and reconciliation of these measures to the most directly comparable financial measures calculated and presented inaccordance with U.S. GAAP in the Appendix.

4
Q4’ 19 Financial Highlights
(1) Adjusted Net Income, Adjusted EBITDA and Distributable Cash Flow are not recognized measures under U.S. GAAP. Please refer to the definitions and reconciliation of these measures to the most directlycomparable financial measures calculated and presented in accordance with U.S. GAAP in the Appendix.(2) Average daily hire gross of commissions represents voyage revenue without taking into consideration the non-cash time charter amortization expense, divided by the Available Days in the Partnership’s fleet.
USD in thousands (except for unit, average daily hire and other operational data)
Q4 2019 Q3 2019 Q4 2018
Revenues 34,317 34,364 31,019
Adjusted Net Income (1) 5,637 2,775 1,292
Adjusted EBITDA (1) 23,991 23,775 21,587
Distributable Cash Flow (1) 10,165 7,007 5,522
Annualized cash distributions per unit - - $0.25
Average daily hire per LNG carrier (2) $62,200 $62,200 57,500
Fleet utilization 100% 99.4% 99.7%
Available Days 552.0 552.0 535.2
Average Number of Vessels 6 6 6

5
Liquidity and Key Balance Sheet Data
US$ million December 31, 2019
Cash(1) 66.2
Debt Outstanding 663
Partner’s Book Capital 314
Net Debt/Capitalization 61%
(1) Including $50 million restricted cash pursuant to the terms of the $675 million Credit Facility(2) Estimated figures based on company projections. Assumptions: 3 month LIBOR at 0.9%, 100% utilization, average daily per vessel operating expenses of $12,970 per day
Debt amortizing at 1.5x the rate our ships depreciate,creating equity value and building balance sheetcapacity.
Net Debt to Total Book Capitalization of 61% and NetDebt to LTM EBITDA at 6.6x as of December 31,2019.
Leverage metrics to gradually improve over time on asteady state basis.
$48 $48 $48 $48
$471
2020 2021 2022 2023 2024
($) millions
Current Debt maturity profile
3
3.5
4
4.5
5
5.5
6
6.5
7
54%
55%
56%
57%
58%
59%
60%
61%
62%
q4 2019 q2 2020 q4 2020 q2 2021
Net
Debt
to L
TM
EB
ITD
A
Net
Debt
to T
ota
l B
ook C
ap (
%)
Net Debt / Total Book cap Net Debt / LTM EBITDA
Indicative Example of Credit Metrics Trajectory(1)
6
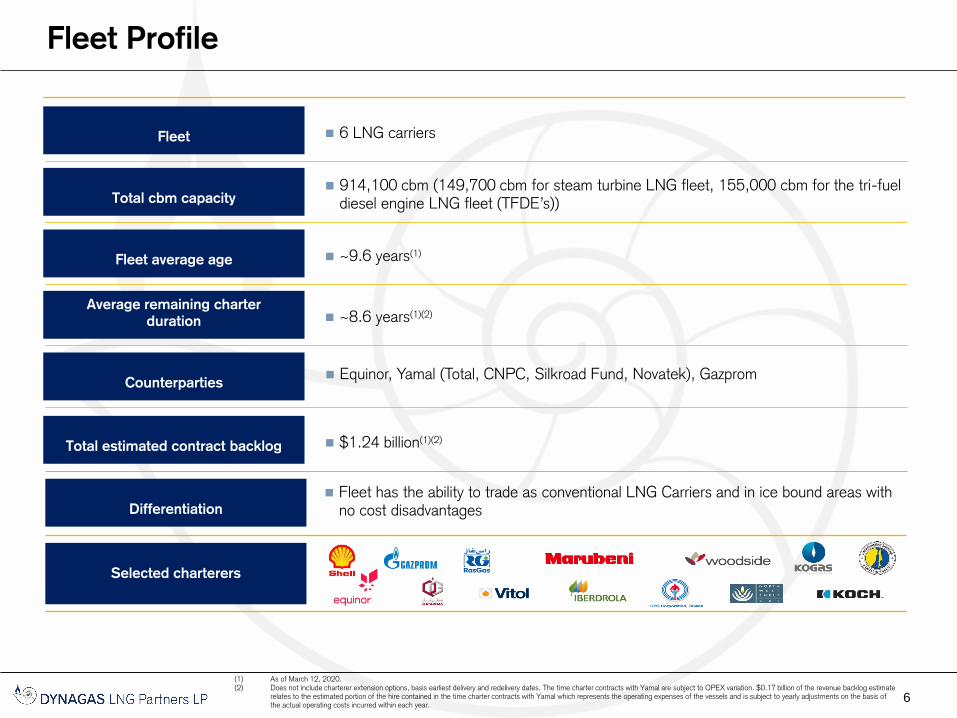
Fleet Profile
6 LNG carriers
Average remaining charter
duration ~8.6 years(1)(2)
Total cbm capacity 914,100 cbm (149,700 cbm for steam turbine LNG fleet, 155,000 cbm for the tri-fuel
diesel engine LNG fleet (TFDE’s))
Fleet average age ~9.6 years(1)
Counterparties
Fleet
Total estimated contract backlog $1.24 billion(1)(2)
Differentiation
Fleet has the ability to trade as conventional LNG Carriers and in ice bound areas with no cost disadvantages
Equinor, Yamal (Total, CNPC, Silkroad Fund, Novatek), Gazprom
Selected charterers
(1) As of March 12, 2020. (2) Does not include charterer extension options, basis earliest delivery and redelivery dates. The time charter contracts with Yamal are subject to OPEX variation. $0.17 billion of the revenue backlog estimate
relates to the estimated portion of the hire contained in the time charter contracts with Yamal which represents the operating expenses of the vessels and is subject to yearly adjustments on the basis of the actual operating costs incurred within each year.

LNG
Carrier
Name
Year
Built
Capacity
(cbm) Charterer 2020 2021 2022
Clean
Energy2007 149,700
Ob River 2007 149,700
Amur
River2008 149,700
Arctic
Aurora2013 155,000
Yenisei
River2013 155,000
Lena
River2013 155,000
7
100% contracted fleet for 2020, 92% for 2021 and 83% for 2022 (basis earliest delivery)
2028
Five out of six LNG carriers with ice class specification
Total estimated contract backlog of approximately $1.24 billion(2) ~ 8.6 years remaining average duration
2028
2033/34
2034/35
Firm charter
2026
(1)
(1) Amur River and Ob River are sub-charted to Sakhalin Energy Investment Company as the project requires ice class vessels to load cargoes during the winter season.(2) As of March 12, 2020. $0.17 billion of the revenue backlog estimate relates to the estimated portion of the hire contained in certain time charter contracts with Yamal which represents the operatingexpenses of the vessels and is subject to yearly adjustments on the basis of the actual operating costs incurred within each year.
(1)
Optional Period
Long Term Contracts Provide Stable, Visible Cash Flows
(1)

8
Market Share: Leader in Ice Class Trades
Dynagas Group (DLNG and Sponsor) has an 82% market share of the LNG carriers with ice class 1A FS or equivalent notations
The Company’s Arc-4 LNG/ice class 1A FS vessels may trade in conventional open water areas and in ice bound areas
No material difference in operational cost of ice class and conventional LNG carriers
Vessels trade in icebound and conventional open water areas
Discharge: SouthKorea
Discharge:Japan
Loading:Norway
Suez Canal
Loading: Sakhalin
Yamal
Discharge: China
Discharge: South Korea
…for ice bound LNG export projectsVery limited ice class 1A FS vessel supply…
Lena River(1)Yenisei River(1)
Amur River(1)
Ob River(1)
Clean Vision(2) Clean Ocean(2) Clean Horizon(2)
Clean Planet(2)Arctic Aurora(1)
Northern Sea route (Norway to Japan)
– 6,800 miles
Alternate route (Norway to Japan)
– 12,000 miles
(1) Owned by Dynagas LNG Partners(2) Owned by Sponsor
Terminals in ice bound area

9
Dynagas LNG Partners LP Overview
6 Vessels
The Partnership operates six large LNGcarriers with five of the six vesselsmaintaining ice class 1A FS specifications
9.6 Years Average Fleet Age
The Partnership’s fleet is younger relativeto the average age of the world LNG fleet.
High Quality Fleet Stable, Contracted Cash Flow Attractive Financial Profile
100% Contracted Revenue
All six of the Partnership’s vessels areemployed on long-term charter contractswith an average remaining duration of 8.6years.
~$1.24B Contract Backlog
Long Term contracts with major,international energy companies includingEquinor, Yamal and Gazprom.
Global Refinancing and
Deleveraging
Traditional amortizing term loan sets thePartnership on the path to gradualdeleveraging and building equity value.
10
Appendix

11
(In thousands of U.S. Dollars, except for units and per unit data)
Three Months Ended
December 31,
2019 2018
Net Income / (Loss) $ 5,529 $ (924)
Amortization of deferred revenue 53 (201)
Amortization of deferred charges 55 37
Class survey costs — 2,380
Adjusted Net Income $ 5,637 $ 1,292
Less: Adjusted Net Income attributable to subordinated, preferred and GP unitholders (2,893) (2,596)
Common unitholders’ interest in Adjusted Net Income $ 2,744 $ (1,304)
Weighted average number of common units outstanding, basic and diluted 35,490,000 35,490,000
Adjusted Earnings / (Loss) per common unit, basic and diluted $ 0.08 $ (0.04)
Adjusted Net Income represents net income before non recurring expenses (if any), amortization of fair value of time charters acquired and charter hire amortization related to time charterswith escalating time charter rates. Adjusted Net Income available to common unitholders represents the common unitholders interest in Adjusted Net Income for each period presented.Adjusted Earnings per common unit represents Adjusted Net Income attributable to common unitholders divided by the weighted average common units outstanding during each periodpresented.
Adjusted Net Income and Adjusted Earnings per common unit, basic and diluted, are not recognized measures under U.S. GAAP and should not be regarded as substitutes for net incomeand earnings per unit, basic and diluted. The Partnership’s definition of Adjusted Net Income and Adjusted Earnings per common unit, basic and diluted, may not be the same at thatreported by other companies in the shipping industry or other industries. The Partnership believes that the presentation of Adjusted Net Income and Adjusted earnings per unit available tocommon unitholders are useful to investors because they facilitate the comparability and the evaluation of companies in its industry. In addition, the Partnership believes that Adjusted NetIncome is useful in evaluating its operating performance compared to that of other companies in our industry because the calculation of Adjusted Net Income generally eliminates theaccounting effects of items which may vary for different companies for reasons unrelated to overall operating performance. The Partnership’s presentation of Adjusted Net Income availableto common unitholders and Adjusted Earnings per common unit should not be construed as an inference that its future results will be unaffected by unusual or non-recurring items.
Reconciliation of net income to adjusted Net Income and Adjusted
Earnings / (loss) per Common Unit

12
1
(In thousands of U.S. Dollars)
Three Months Ended
December 31,
2019 2018
Net income / (loss) $ 5,529 $ (924)
Net interest and finance costs, excluding amortization 10,362 12,649
Depreciation 7,992 7,646
Class survey costs — 2,380
Amortization of deferred revenue 53 (201)
Amortization of deferred charges 55 37
Adjusted EBITDA $ 23,991 $ 21,587
The Partnership defines Adjusted EBITDA as earnings/(losses) before interest and finance costs, net of interest income (if any), gains/losses on derivative financial instruments (if any),taxes (when incurred), depreciation and amortization (when incurred), class survey costs and significant non-recurring items (if any). Adjusted EBITDA is used as a supplemental financialmeasure by management and external users of financial statements, such as investors, to assess its operating performance.
The Partnership believes that Adjusted EBITDA assists its management and investors by providing useful information that increases the comparability of its performance operating fromperiod to period and against the operating performance of other companies in its industry that provide Adjusted EBITDA information. This increased comparability is achieved by excluding thepotentially disparate effects between periods or companies of interest, other financial items, depreciation and amortization and taxes, which items are affected by various and possiblychanging financing methods, capital structure and historical cost basis and which items may significantly affect net income between periods. The Partnership believes that including AdjustedEBITDA as a measure of operating performance benefits investors in (a) selecting between investing in the Partnership and other investment alternatives and (b) monitoring its ongoingfinancial and operational strength.
Adjusted EBITDA is not a measure of financial performance under U.S. GAAP, does not represent and should not be considered as an alternative to net income, operating income, cashflow from operating activities or any other measure of financial performance presented in accordance with U.S. GAAP. Adjusted EBITDA excludes some, but not all, items that affect netincome and these measures may vary among other companies. Therefore, Adjusted EBITDA as presented below may not be comparable to similarly titled measures of other companies.
Reconciliation of Net income to Adjusted EBITDA
Related Documents