1 Investor Presentation | Q4 FY 2017

Welcome message from author
This document is posted to help you gain knowledge. Please leave a comment to let me know what you think about it! Share it to your friends and learn new things together.
Transcript

1I n v e s t o r P r e s e n t a t i o n | Q 4 F Y 2 0 1 7

2
D . R . H O R T O N , I N C .
By closings volume for fiscal years 2002 to 2017

3
F O R W A R D - L O O K I N G S TAT E M E N T S
This presentation may include “forward‐looking statements” as defined by the Private Securities LitigationReform Act of 1995. Although D.R. Horton believes any such statements are based on reasonableassumptions, there is no assurance that actual outcomes will not be materially different. Factors that maycause the actual results to be materially different from the future results expressed by the forward‐lookingstatements include, but are not limited to: the cyclical nature of the homebuilding industry and changes ineconomic, real estate and other conditions; constriction of the credit markets, which could limit our ability toaccess capital and increase our costs of capital; reductions in the availability of mortgage financing providedby government agencies, changes in government financing programs, a decrease in our ability to sellmortgage loans on attractive terms or an increase in mortgage interest rates; the risks associated with ourland and lot inventory; our ability to effect our growth strategies, acquisitions or investments successfully;home warranty and construction defect claims; the effects of a health and safety incident; the effects ofnegative publicity; supply shortages and other risks of acquiring land, building materials and skilled labor; theimpact of an inflationary, deflationary or higher interest rate environment; reductions in the availability ofperformance bonds; increases in the costs of owning a home; the effects of governmental regulations andenvironmental matters on our homebuilding operations; the effects of governmental regulations on ourfinancial services operations; our significant debt and our ability to comply with related debt covenants,restrictions and limitations; competitive conditions within the homebuilding and financial services industries;the effects of the loss of key personnel; and information technology failures and data security breaches.Additional information about issues that could lead to material changes in performance is contained in D.R.Horton’s annual report on Form 10‐K which is filed with the Securities and Exchange Commission.
4
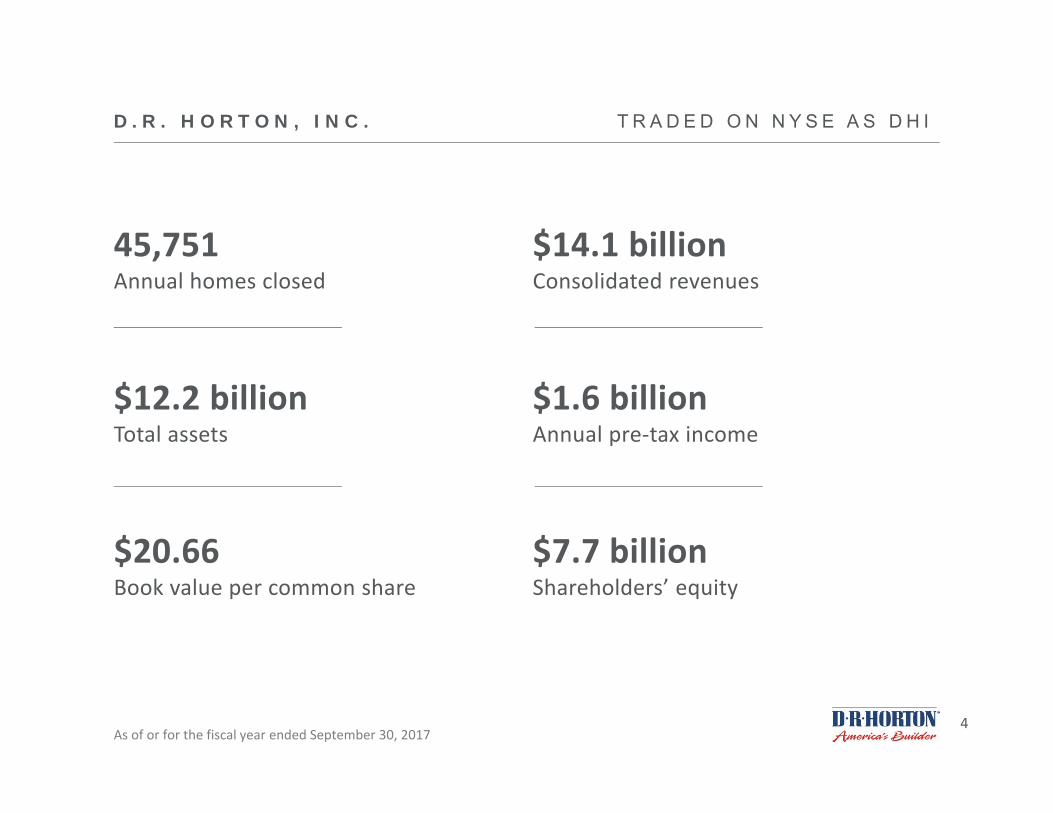
D . R . H O R T O N , I N C . T R A D E D O N N Y S E A S D H I
45,751Annual homes closed
$12.2 billionTotal assets
$20.66Book value per common share
$14.1 billionConsolidated revenues
$1.6 billionAnnual pre‐tax income
$7.7 billionShareholders’ equity
As of or for the fiscal year ended September 30, 2017

5
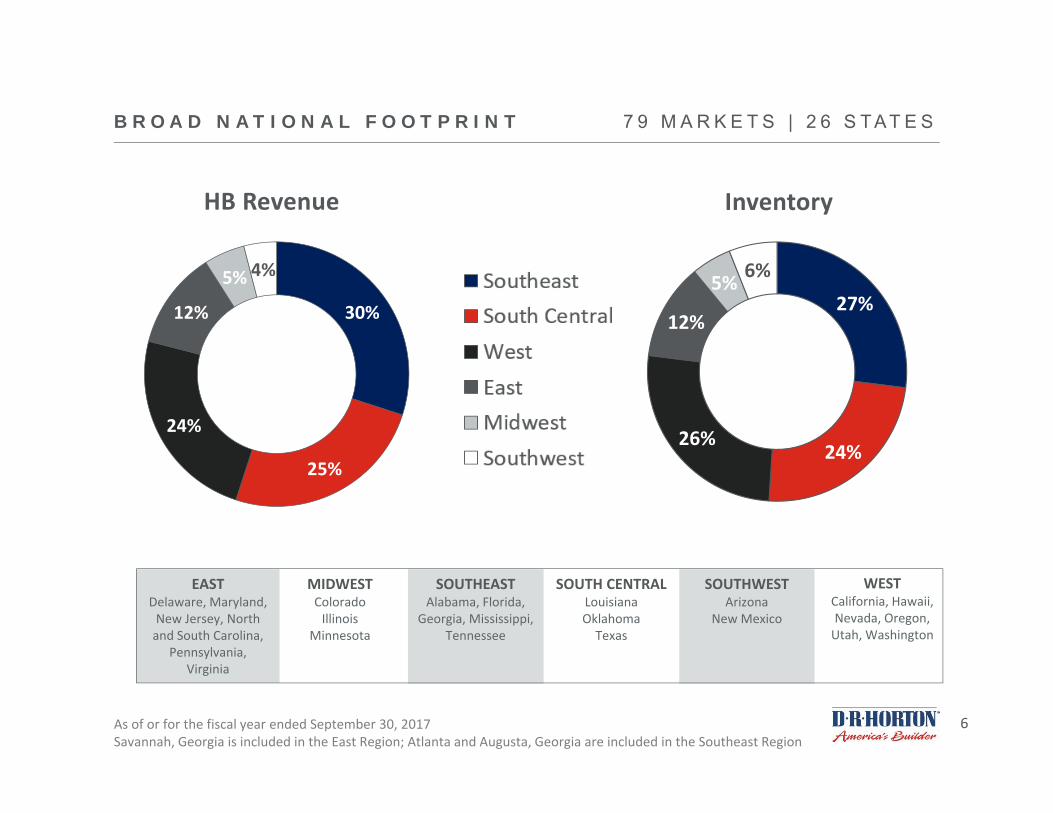
B R O A D N AT I O N A L F O O T P R I N T 7 9 M A R K E T S | 2 6 S T A T E S
6
27%
24%26%
12%
5% 6%
B R O A D N AT I O N A L F O O T P R I N T 7 9 M A R K E T S | 2 6 S T A T E S
HB Revenue
30%
25%
24%
12%
5% 4%
Inventory
As of or for the fiscal year ended September 30, 2017Savannah, Georgia is included in the East Region; Atlanta and Augusta, Georgia are included in the Southeast Region
EASTDelaware, Maryland, New Jersey, North and South Carolina,
Pennsylvania,Virginia
MIDWESTColoradoIllinois
Minnesota
SOUTH CENTRALLouisianaOklahomaTexas
SOUTHEASTAlabama, Florida,
Georgia, Mississippi, Tennessee
WESTCalifornia, Hawaii, Nevada, Oregon, Utah, Washington
SOUTHWESTArizona
New Mexico

7
D I V E R S E P R O D U C T O F F E R I N G S A N D P R I C E P O I N T S
21%
26%
20%
26%
7%
$0$500k
Represents homes closed for the fiscal year ended 9/30/17
Homes for entry‐level, move‐up, active adult and luxury buyers
$200k
$250k
$300k

8
FA M I LY O F B R A N D S
FIRST TIME / MOVE UP ENTRY LEVEL LUXURY ACTIVE ADULT
58%
37%
4% 1%
HomesSold
61%
34%
4% 1%
HomesClosed
65%
26%
8% 1%
Home SalesRevenue
79 markets | 26 states ASP $327k
58 markets | 21 states ASP $232k
40 markets | 17 states ASP $636k
21 markets | 12 statesASP $265k
Based on Q4 FY 2017 results

9
M A N A G E M E N T T E N U R E A N D E X P E R I E N C E
City managersover 10 years
Executive team andregion presidents
approx. 25 years
Division presidentsover 13 years
Average employee tenure
10
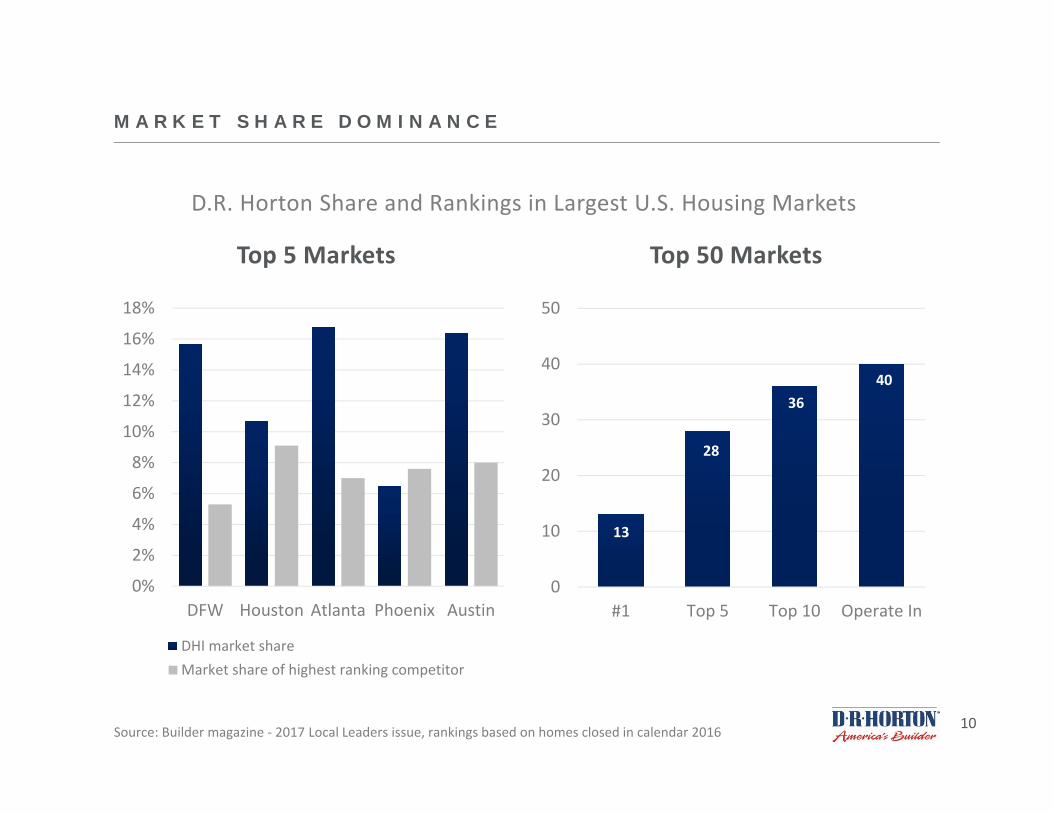
M A R K E T S H A R E D O M I N A N C E
Top 5 Markets Top 50 Markets
0
10
20
30
40
50
#1 Top 5 Top 10 Operate In
Source: Builder magazine ‐ 2017 Local Leaders issue, rankings based on homes closed in calendar 2016
13
28
3640
0%
2%
4%
6%
8%
10%
12%
14%
16%
18%
DFW Houston Atlanta Phoenix Austin
DHI market shareMarket share of highest ranking competitor
D.R. Horton Share and Rankings in Largest U.S. Housing Markets

11
F Y 2 0 1 7 H I G H L I G H T S
• Consolidated pre‐tax income increased 18% to $1.6 billion
• Net income increased 17% to $1.0 billion or $2.74 per share
• Consolidated pre‐tax profit margin improved 30 basis points to 11.4%
• The value of net homes sold and homes closed both increased by 16%
• 46,605 net homes sold and 45,751 homes closed
• 12,329 homes in backlog at 9/30/17
• Book value per common share increased 13% to $20.66
• Homebuilding return on inventory improved 120 basis points to 16.6%
• Cash flow provided by operations of $435 million

12
S A L E S , C L O S I N G S A N D B A C K L O G
Net Sales Orders and Homes Closed increased 14% and Homes in Backlog increased 7% in FY 2017 compared to FY 2016
05,000
10,00015,00020,00025,00030,00035,00040,00045,00050,000
Sales Closings Backlog
FY 2015 FY 2016 FY 2017
# of Homes

13
O P E R AT I O N A L F O C U S
• Maximize returns by managing inventory levels and balancing sales pace and pricing in each community
• Generate consistent positive annual cash flow from operations
• Maintain inventories of land, lots and homes that support double‐digit annual growth in both revenues and profits
• Underwriting expectations for each community:
• Minimum 20% annual pre‐tax return on inventory (ROI)
• Initial cash investment returned within 24 months or less
• Increase optioned land and lots by expanding relationships with land developers
• Grow Forestar’s platform in support of land strategy
• Control SG&A while ensuring infrastructure supports growth
14
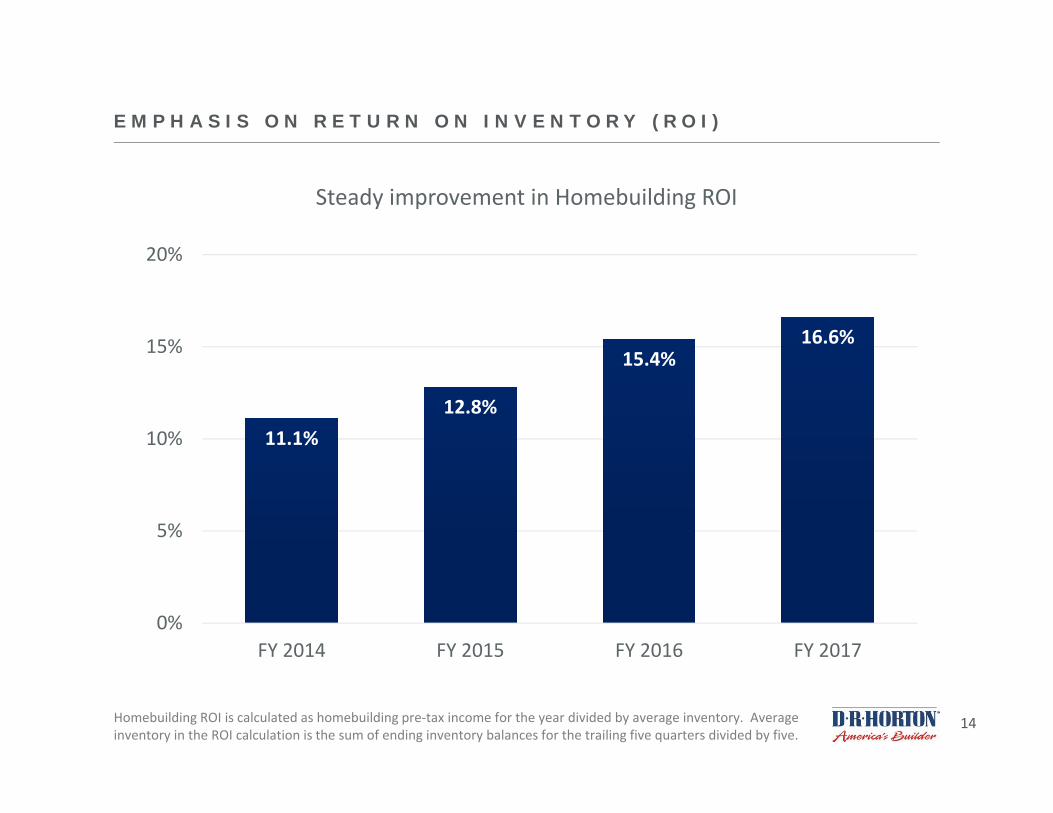
E M P H A S I S O N R E T U R N O N I N V E N T O R Y ( R O I )
11.1%12.8%
15.4%16.6%
0%
5%
10%
15%
20%
FY 2014 FY 2015 FY 2016 FY 2017
Steady improvement in Homebuilding ROI
Homebuilding ROI is calculated as homebuilding pre‐tax income for the year divided by average inventory. Average inventory in the ROI calculation is the sum of ending inventory balances for the trailing five quarters divided by five.
15
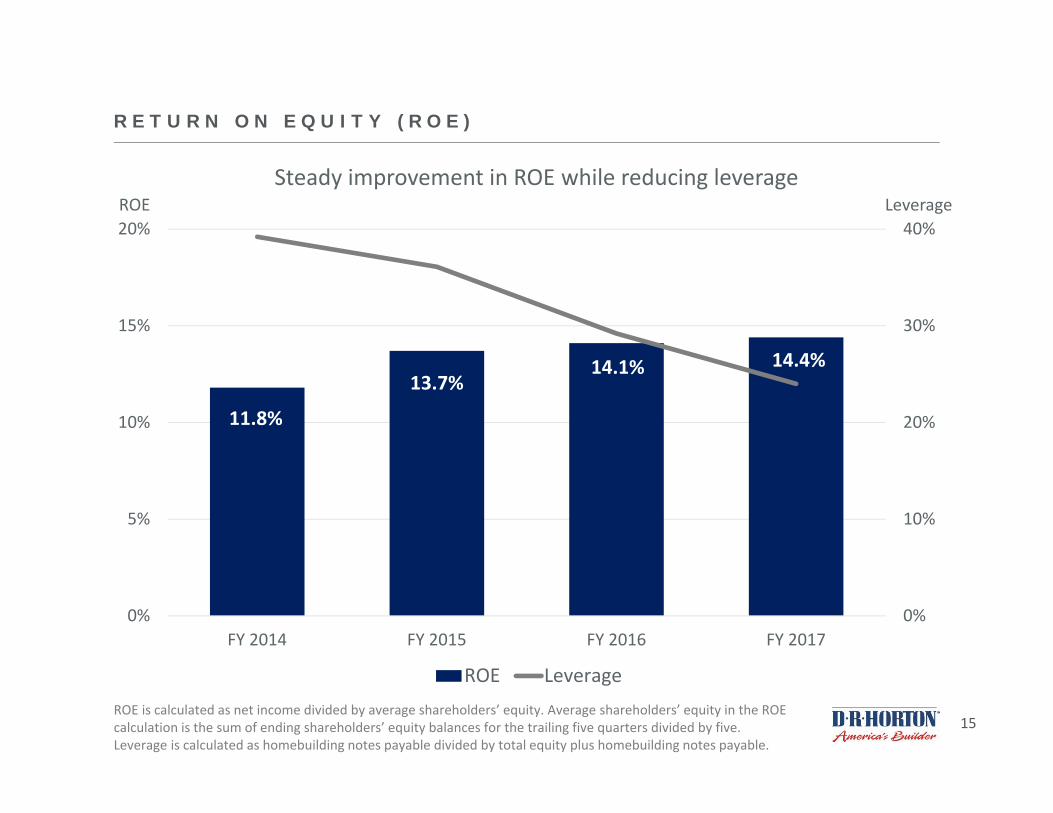
R E T U R N O N E Q U I T Y ( R O E )
11.8%
13.7%14.1% 14.4%
0%
10%
20%
30%
40%
0%
5%
10%
15%
20%
FY 2014 FY 2015 FY 2016 FY 2017
ROE Leverage
Steady improvement in ROE while reducing leverageLeverage
ROE is calculated as net income divided by average shareholders’ equity. Average shareholders’ equity in the ROE calculation is the sum of ending shareholders’ equity balances for the trailing five quarters divided by five.Leverage is calculated as homebuilding notes payable divided by total equity plus homebuilding notes payable.
ROE

16
B A L A N C E D A P P R O A C H
Consolidated Revenues
$10.8 $12.2
$14.1
$0
$4
$8
$12
$16
FY 2015 FY 2016 FY 2017 FY 2018e
Land Investment
$2.2$2.7
$3.5
>$4.0
$0
$1
$2
$3
$4
$5
FY 2015 FY 2016 FY 2017 FY 2018e
$ in billions
Expect to generate positive cash flow from operations for the fourth consecutive year while growing revenues and replenishing land investments
$15.5 – $16.3

17
F Y 2 0 1 8 C A P I TA L A N D C A S H F L O W P R I O R I T I E S
• Disciplined, flexible and opportunistic• Invest in homebuilding opportunities, including acquisitions, to
generate acceptable returns and consolidate market share• Acquired 75% of Forestar for approximately $560 million in October
2017• Reduce or maintain debt levels and leverage
• Refinanced $400 million of senior notes due February 2018 • Consistent dividends to shareholders
• Increased quarterly dividend by 25% compared to most recent dividend paid ‐ approximately $190 million annually at new rate
• Share repurchases to partially offset dilution• Repurchased 1.85 million shares during FY 2017 for $60.6 million• Current Board authorization of $200 million

18
F O R E S TA R A C Q U I S I T I O N
• On October 5, 2017, D.R. Horton (“DHI”) completed the acquisition of 75% of the outstanding shares of Forestar (“FOR”) for approximately $560 million in cash
• FOR is and will continue to be a publicly‐traded residential real estate company, with operations currently in 14 markets and 10 states, where it owns, directly or through joint ventures, interests in 44 residential and mixed‐use projects
• The strategic relationship will significantly grow FOR into a large, national residential land development company, selling lots to D.R. Horton and other homebuilders
• Advances DHI’s strategy of increasing its access to optioned land and lots to enhance operational efficiency and returns
• FOR is led by new Executive Chairman Don Tomnitz, DHI’s CEO for over 15 years, and is supported by an experienced management team and board of directors
• Over the longer term, DHI intends to gradually reduce its ownership position and increase the public float of FOR stock
• DHI believes FOR’s growth is likely to exceed the original projections outlined in the “DHI Proposal to FOR” slide deck dated 6/5/17 on the presentations section of DHI’s investor relations site at investor.drhorton.com
19
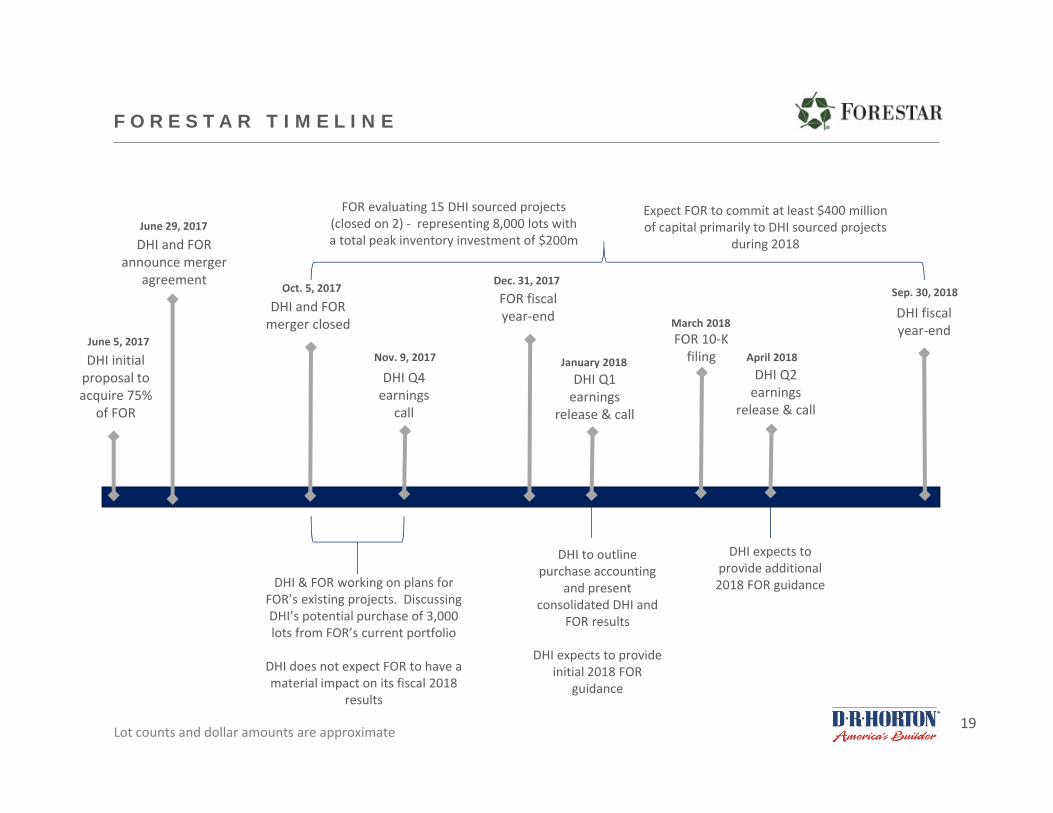
F O R E S TA R T I M E L I N E
DHI initial proposal to acquire 75%
of FOR
June 5, 2017
DHI and FOR announce merger
agreement
June 29, 2017
DHI and FOR merger closed
Oct. 5, 2017
DHI Q4 earnings
call
Nov. 9, 2017
FOR evaluating 15 DHI sourced projects (closed on 2) ‐ representing 8,000 lots with a total peak inventory investment of $200m
DHI Q1 earnings
release & call
January 2018
DHI expects to provide additional 2018 FOR guidance
FOR 10‐K filing
March 2018
DHI to outline purchase accounting
and present consolidated DHI and
FOR results
DHI expects to provide initial 2018 FOR
guidance
FOR fiscal year‐end
Dec. 31, 2017
DHI fiscal year‐end
Sep. 30, 2018
Expect FOR to commit at least $400 million of capital primarily to DHI sourced projects
during 2018
DHI & FOR working on plans for FOR’s existing projects. Discussing DHI’s potential purchase of 3,000 lots from FOR’s current portfolio
DHI does not expect FOR to have a material impact on its fiscal 2018
results
Lot counts and dollar amounts are approximate
DHI Q2 earnings
release & call
April 2018
20
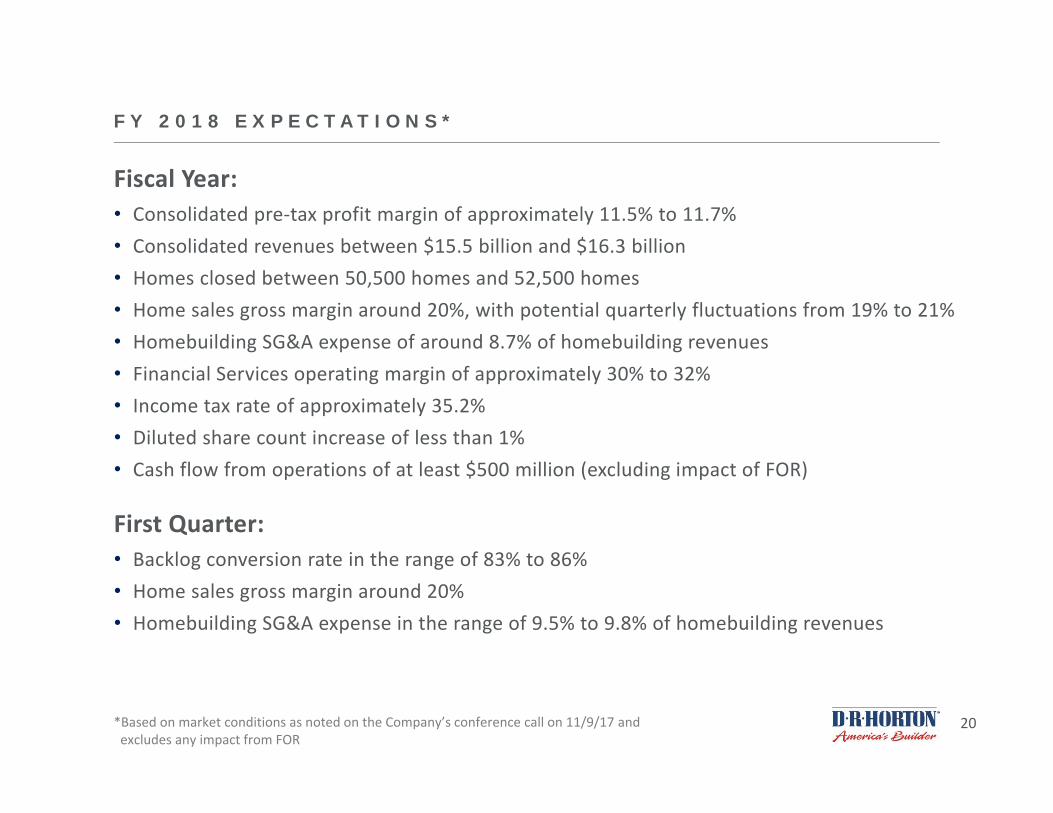
F Y 2 0 1 8 E X P E C TAT I O N S *
Fiscal Year:• Consolidated pre‐tax profit margin of approximately 11.5% to 11.7%• Consolidated revenues between $15.5 billion and $16.3 billion• Homes closed between 50,500 homes and 52,500 homes• Home sales gross margin around 20%, with potential quarterly fluctuations from 19% to 21%• Homebuilding SG&A expense of around 8.7% of homebuilding revenues• Financial Services operating margin of approximately 30% to 32%• Income tax rate of approximately 35.2%• Diluted share count increase of less than 1%• Cash flow from operations of at least $500 million (excluding impact of FOR)
First Quarter:• Backlog conversion rate in the range of 83% to 86%• Home sales gross margin around 20%• Homebuilding SG&A expense in the range of 9.5% to 9.8% of homebuilding revenues
*Based on market conditions as noted on the Company’s conference call on 11/9/17 and excludes any impact from FOR

21
T H R E E Y E A R O U T L O O K *
FY 18 – FY 20:
• Increase consolidated revenues and pre‐tax profits at a double‐digit annual pace
• Improve return on inventory
• Increase optioned lots to 60% of total land and lot position by 2020
• Cash flow from operations growing to over $1 billion annually in 2020
• Maintain or reduce debt and leverage
• Increase dividends
• Repurchase shares to offset dilution with a target to keep our outstanding share count flat beginning in 2020
*Based on market conditions as noted on the Company’s conference call on 11/9/17 and excludes any impact from FOR
22
F O U R T H Q U A R T E R D ATA
23
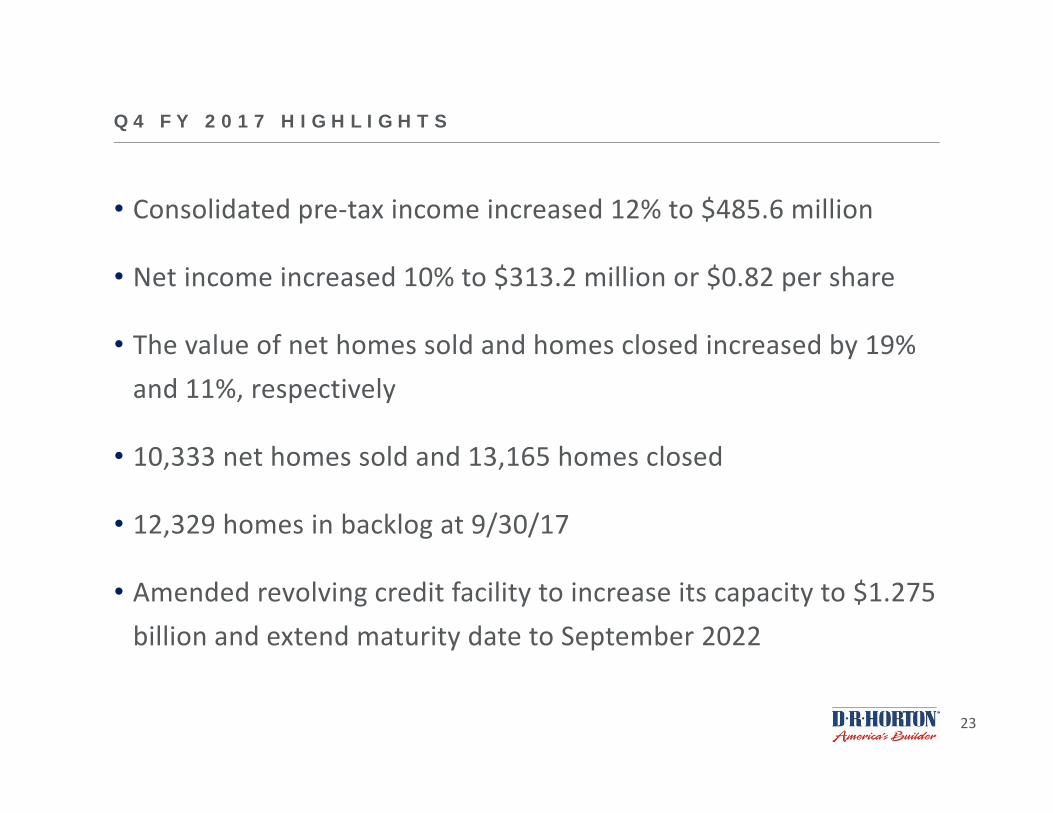
Q 4 F Y 2 0 1 7 H I G H L I G H T S
• Consolidated pre‐tax income increased 12% to $485.6 million
• Net income increased 10% to $313.2 million or $0.82 per share
• The value of net homes sold and homes closed increased by 19%and 11%, respectively
• 10,333 net homes sold and 13,165 homes closed
• 12,329 homes in backlog at 9/30/17
• Amended revolving credit facility to increase its capacity to $1.275 billion and extend maturity date to September 2022

24
S A L E S , C L O S I N G S A N D B A C K L O G
Net Sales Orders, Homes Closed and Homes in Backlog increased 18%, 7% and 7%, respectively, in Q4 of FY 2017 compared to Q4 of FY 2016
0
2,000
4,000
6,000
8,000
10,000
12,000
14,000
Sales Closings Backlog4Q FY 2015 4Q FY 2016 4Q FY 2017
# of Homes
25
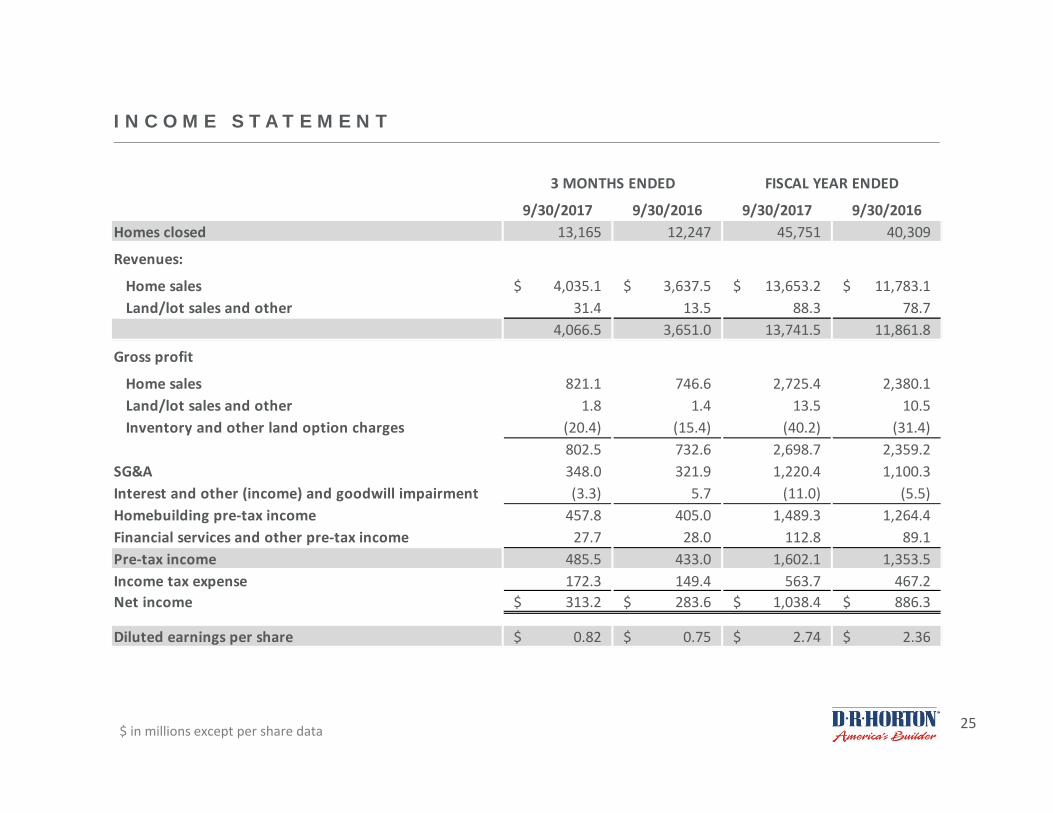
I N C O M E S TAT E M E N T
$ in millions except per share data
9/30/2017 9/30/2016 9/30/2017 9/30/2016Homes closed 13,165 12,247 45,751 40,309
Revenues:
Home sales $ 4,035.1 $ 3,637.5 $ 13,653.2 $ 11,783.1 Land/lot sales and other 31.4 13.5 88.3 78.7
4,066.5 3,651.0 13,741.5 11,861.8
Gross profit
Home sales 821.1 746.6 2,725.4 2,380.1 Land/lot sales and other 1.8 1.4 13.5 10.5 Inventory and other land option charges (20.4) (15.4) (40.2) (31.4)
802.5 732.6 2,698.7 2,359.2 SG&A 348.0 321.9 1,220.4 1,100.3 Interest and other (income) and goodwill impairment (3.3) 5.7 (11.0) (5.5)Homebuilding pre‐tax income 457.8 405.0 1,489.3 1,264.4 Financial services and other pre‐tax income 27.7 28.0 112.8 89.1 Pre‐tax income 485.5 433.0 1,602.1 1,353.5 Income tax expense 172.3 149.4 563.7 467.2 Net income $ 313.2 $ 283.6 $ 1,038.4 $ 886.3
Diluted earnings per share $ 0.82 $ 0.75 $ 2.74 $ 2.36
3 MONTHS ENDED FISCAL YEAR ENDED

26
H O M E S A L E S G R O S S M A R G I N
19.8% 20.2% 19.8% 19.8% 19.8% 20.3% 20.0%
0%
3%
6%
9%
12%
15%
18%
21%
FY15 FY16 Q1 FY17 Q2 FY17 Q3 FY17 Q4 FY17 FY17
Shown as a % of home sales revenuesIncludes interest amortized to cost of sales
Home sales gross margin of around 20%
27
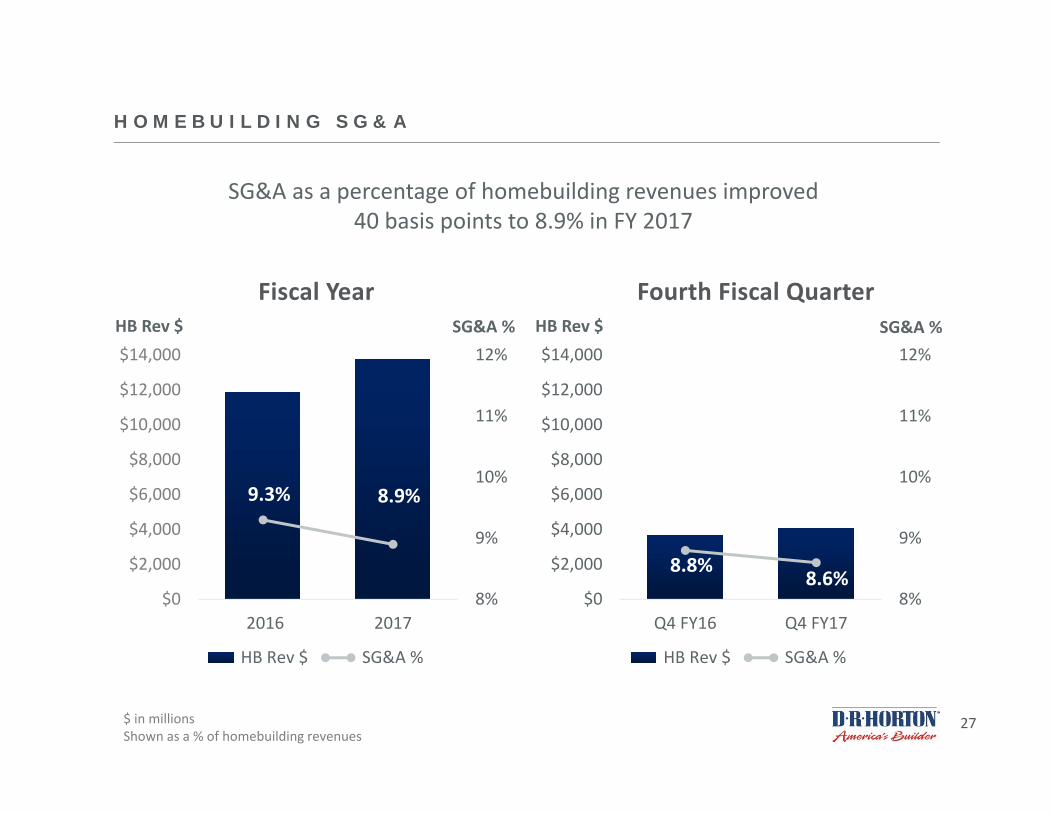
H O M E B U I L D I N G S G & A
Fiscal Year Fourth Fiscal Quarter
SG&A as a percentage of homebuilding revenues improved 40 basis points to 8.9% in FY 2017
9.3% 8.9%
8%
9%
10%
11%
12%
$0
$2,000
$4,000
$6,000
$8,000
$10,000
$12,000
$14,000
2016 2017
HB Rev $ SG&A %
8.8%8.6%
8%
9%
10%
11%
12%
$0
$2,000
$4,000
$6,000
$8,000
$10,000
$12,000
$14,000
Q4 FY16 Q4 FY17
HB Rev $ SG&A %
HB Rev $ SG&A % HB Rev $ SG&A %
$ in millionsShown as a % of homebuilding revenues

28
$1,353.5$1,602.1
$0$200$400$600$800
$1,000$1,200$1,400$1,600$1,800
2016 2017
11.1%
11.4%
C O N S O L I D AT E D P R E - TA X I N C O M E
Fiscal Year Fourth Fiscal Quarter
Consolidated pre‐tax profit margin improved 30 basis points to 11.4% in FY 2017
$433.0 $485.5
$0$200$400$600$800
$1,000$1,200$1,400$1,600$1,800
Q4 FY16 Q4 FY17
11.6% 11.7%
PTI $ PTI $
$ in millionsShown as a % of consolidated revenues
29
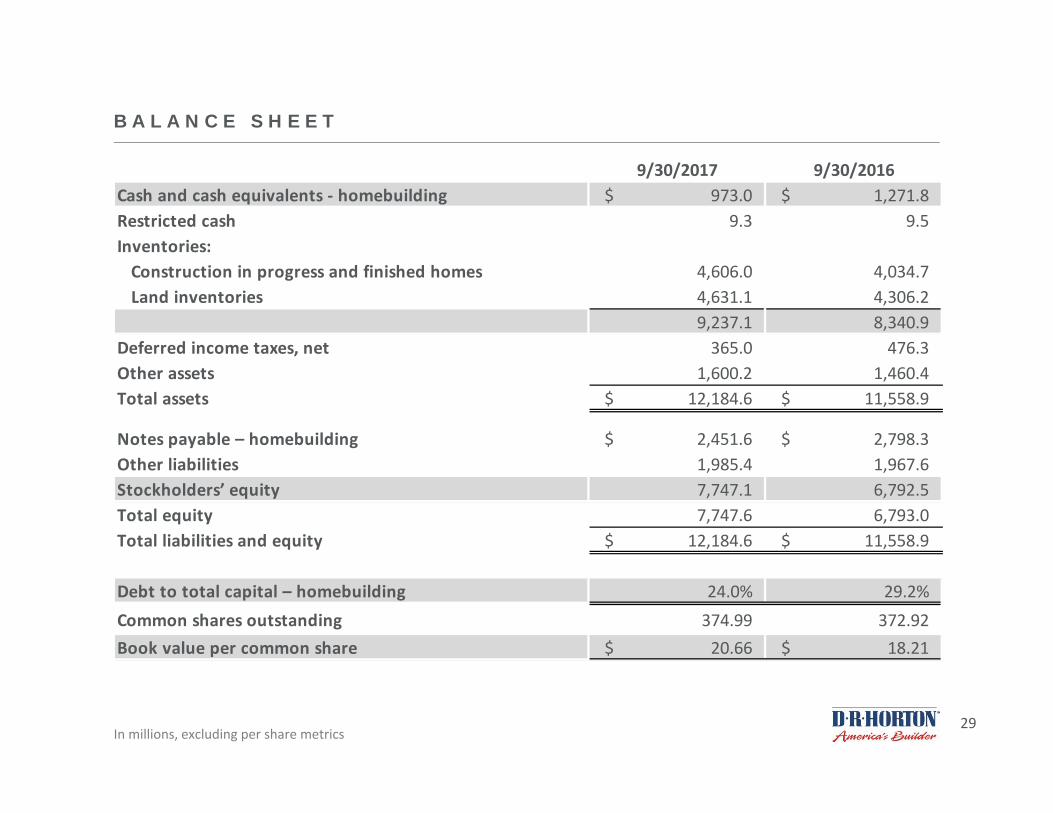
B A L A N C E S H E E T
In millions, excluding per share metrics
9/30/2017 9/30/2016Cash and cash equivalents ‐ homebuilding $ 973.0 $ 1,271.8 Restricted cash 9.3 9.5Inventories: Construction in progress and finished homes 4,606.0 4,034.7 Land inventories 4,631.1 4,306.2
9,237.1 8,340.9 Deferred income taxes, net 365.0 476.3Other assets 1,600.2 1,460.4 Total assets $ 12,184.6 $ 11,558.9
Notes payable – homebuilding $ 2,451.6 $ 2,798.3 Other liabilities 1,985.4 1,967.6Stockholders’ equity 7,747.1 6,792.5 Total equity 7,747.6 6,793.0 Total liabilities and equity $ 12,184.6 $ 11,558.9
Debt to total capital – homebuilding 24.0% 29.2%Common shares outstanding 374.99 372.92Book value per common share $ 20.66 $ 18.21
30
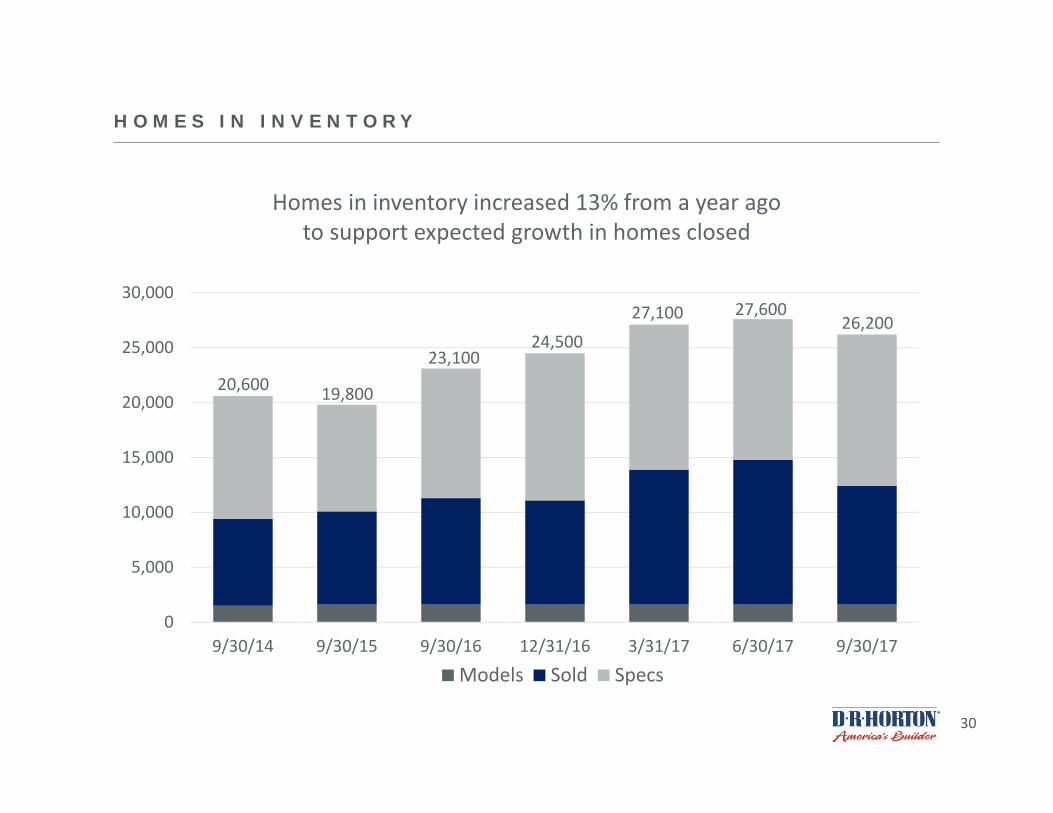
H O M E S I N I N V E N T O R Y
0
5,000
10,000
15,000
20,000
25,000
30,000
9/30/14 9/30/15 9/30/16 12/31/16 3/31/17 6/30/17 9/30/17
Models Sold Specs
23,100
19,80020,600
27,600
Homes in inventory increased 13% from a year agoto support expected growth in homes closed
24,50027,100 26,200
31
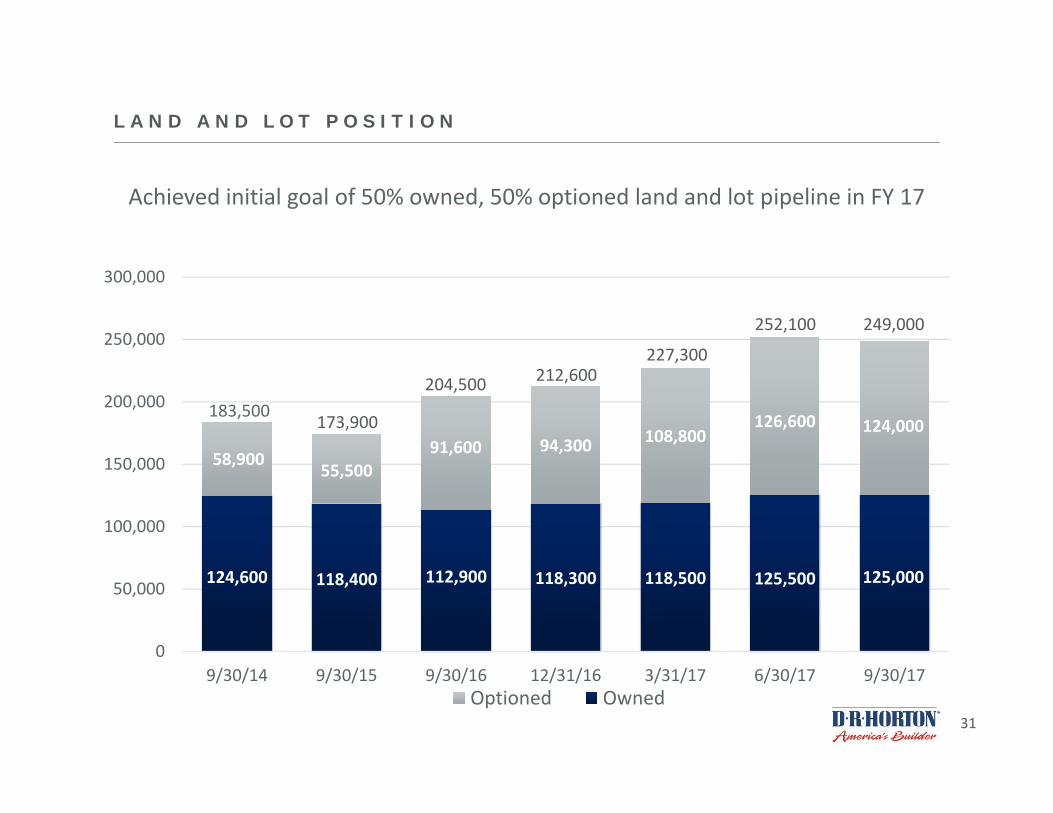
L A N D A N D L O T P O S I T I O N
124,600 118,400 112,900 118,300 118,500 125,500 125,000
58,900 55,50091,600 94,300 108,800
126,600 124,000
0
50,000
100,000
150,000
200,000
250,000
300,000
9/30/14 9/30/15 9/30/16 12/31/16 3/31/17 6/30/17 9/30/17Optioned Owned
183,500 173,900
212,600
Achieved initial goal of 50% owned, 50% optioned land and lot pipeline in FY 17
204,500
252,100
227,300
249,000
32
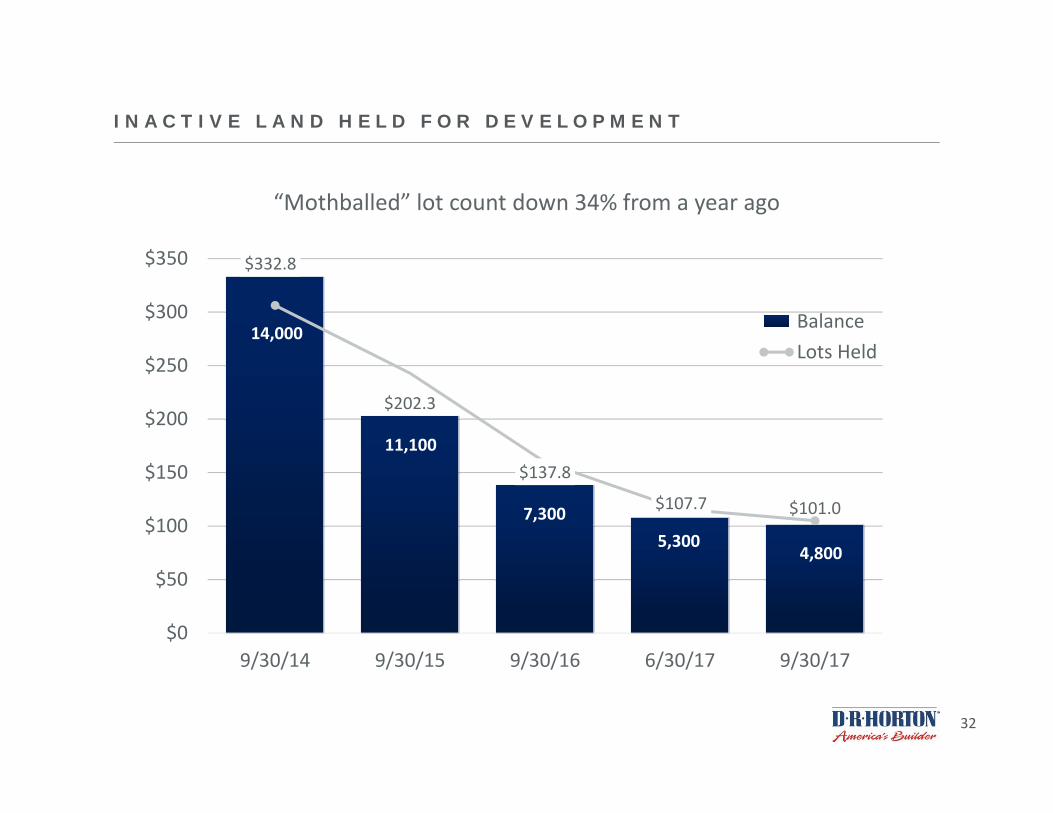
I N A C T I V E L A N D H E L D F O R D E V E L O P M E N T
$332.8
$202.3
$137.8
$107.7 $101.0
14,000
11,100
7,3005,300
4,800
0
2000
4000
6000
8000
10000
12000
14000
16000
$0
$50
$100
$150
$200
$250
$300
$350
9/30/14 9/30/15 9/30/16 6/30/17 9/30/17
Balance Lots Held
“Mothballed” lot count down 34% from a year ago
33
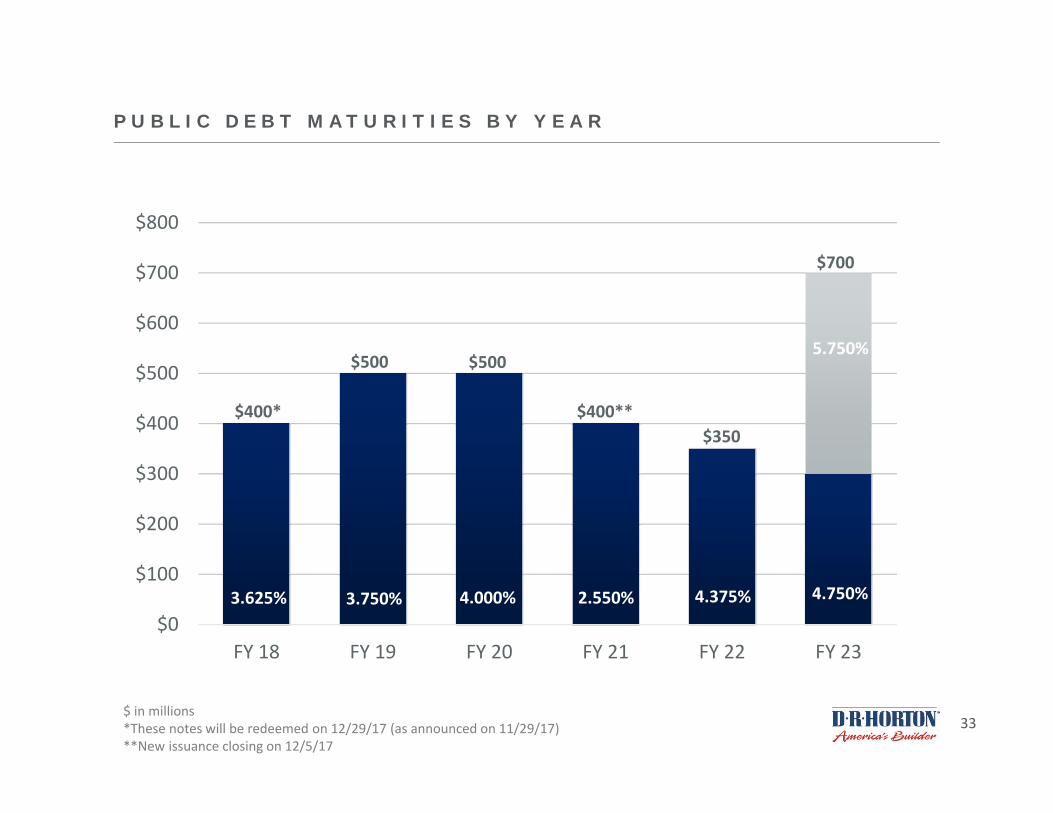
P U B L I C D E B T M AT U R I T I E S B Y Y E A R
$0
$100
$200
$300
$400
$500
$600
$700
$800
FY 18 FY 19 FY 20 FY 21 FY 22 FY 23
4.750%
$350
$500 $500
2.550%3.750% 4.000% 4.375%
5.750%
$700
$ in millions*These notes will be redeemed on 12/29/17 (as announced on 11/29/17)**New issuance closing on 12/5/17
$400**
3.625%
$400*
Related Documents