February 25, 2015 Fourth Quarter 2014 Results and 2015 Strategic Priorities and Guidance

Welcome message from author
This document is posted to help you gain knowledge. Please leave a comment to let me know what you think about it! Share it to your friends and learn new things together.
Transcript
February 25, 2015
Fourth Quarter 2014 Results and 2015 Strategic Priorities and Guidance

Safe Harbor Statement Under the Private Securities Litigation Reform Act of 1995
All information set forth in this presentation, except historical and factual information, represents forward-looking statements. This includes all statements about the company’s plans, beliefs, estimates, and expectations. These statements are based on current estimates, projections, and assumptions, which involve certain risks and uncertainties that could cause actual results to differ materially from those in the forward-looking statements. Important factors that may affect these forward-looking statements include, but are not limited to: impacts of any pending acquisition and divestiture transactions, including, but not limited to, the ability to obtain regulatory approvals, successfully complete the transactions and the financial impacts of such transactions; the ability of the company to successfully manage and grow its markets; the overall economy; competition; the access to and pricing of unbundled network elements; the ability to obtain or maintain roaming arrangements with other carriers on acceptable terms; the state and federal telecommunications regulatory environment; the value of assets and investments; adverse changes in the ratings afforded TDS and U.S. Cellular debt securities by accredited ratings organizations; industry consolidation; advances in telecommunications technology; uncertainty of access to the capital markets; pending and future litigation; changes in income tax rates, laws, regulations or rulings; changes in customer growth rates, average monthly revenue per user, churn rates, roaming revenue and terms, the availability of wireless devices, or the mix of products and services offered by U.S. Cellular and TDS Telecom. Investors are encouraged to consider these and other risks and uncertainties that are discussed in documents furnished to the Securities and Exchange Commission (“SEC”).
2

Upcoming conferences
• March 3: Raymond James Institutional Shareholder Conference (Orlando)
• March 5: Morgan Stanley Technology, Media & Telecom Conference (San Francisco)
• March 10: Deutsche Bank 23rd Annual Media, Internet & Telecom Conference (Palm Beach)
3
TDS – Executing on Strategic Imperatives
Execute Capital Allocation Strategy
• Invest in our business to improve returns
• Oversight of cable and HMS growth initiatives
• Acquisition of BendBroadband; focus on expanding broadband offerings; leverage wireline expertise, infrastructure and product set
• HMS; integrating acquisitions to drive stronger growth and profitability
• Return value to shareholders through dividends and share repurchases
• Pursue strategic initiatives consistent with long-term strategies
• Support growth initiatives through sound and disciplined financing strategies
4

Positioning U.S. Cellular for success
• Postpaid subscriber growth in 2014
• Stabilized billing system; improving speed to market for new plans and product offerings and increasing operational efficiencies
• Expanded Equipment Installment Plan offerings to meet customers needs
• Introduced “Best Value In Wireless “ pricing
• Best device portfolio in our history
• Launched all iconic Samsung and Apple devices
• Growing portfolio of tablets and connected devices
• Over 94% of postpaid customers have access to 4G/LTE
• Continue to monetize non-strategic assets to support investment in the business
6
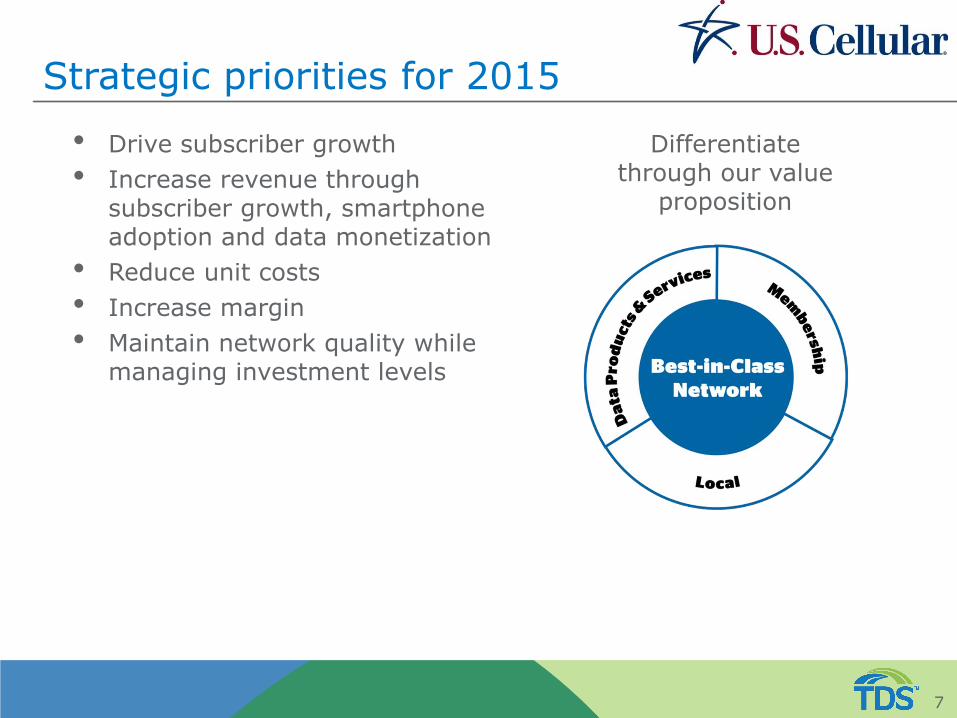
Strategic priorities for 2015
• Drive subscriber growth
• Increase revenue through subscriber growth, smartphone adoption and data monetization
• Reduce unit costs
• Increase margin
• Maintain network quality while managing investment levels
7
Differentiate through our value
proposition
Drive subscriber growth
• Increase gross additions with high-quality network, strong device portfolio, higher penetration of connected devices, product and pricing initiatives, win-back programs
• Reduce churn through device portfolio, including Apple devices, membership experience, customer lifecycle management
• Evolve and expand Equipment Installment Plan offerings
• Enhance and expand distribution
8
Drive revenue growth
• Grow subscriber base
• Increase smartphone penetration
• Launch new products and services that utilize and monetize our data network
• Connected devices
• Connected home
• Continue penetration of Shared Connect plans and increase number of devices per account
• Build existing and new product revenue streams
• Device protection plans
• Device activation fees
• Accessory sales
• Growth in data traffic to drive revenue and ARPA growth
9
Focus on margin improvement
• Manage subsidies
• Continued aggressive adoption of EIPs
• Offer attractive lower-cost devices, including used devices
• Manage upgrade cycle
• Manage costs
• Focused on reducing unit costs
• Leverage revenue growth and LOE/cost reduction to drive margin improvement in 2015 and beyond
10
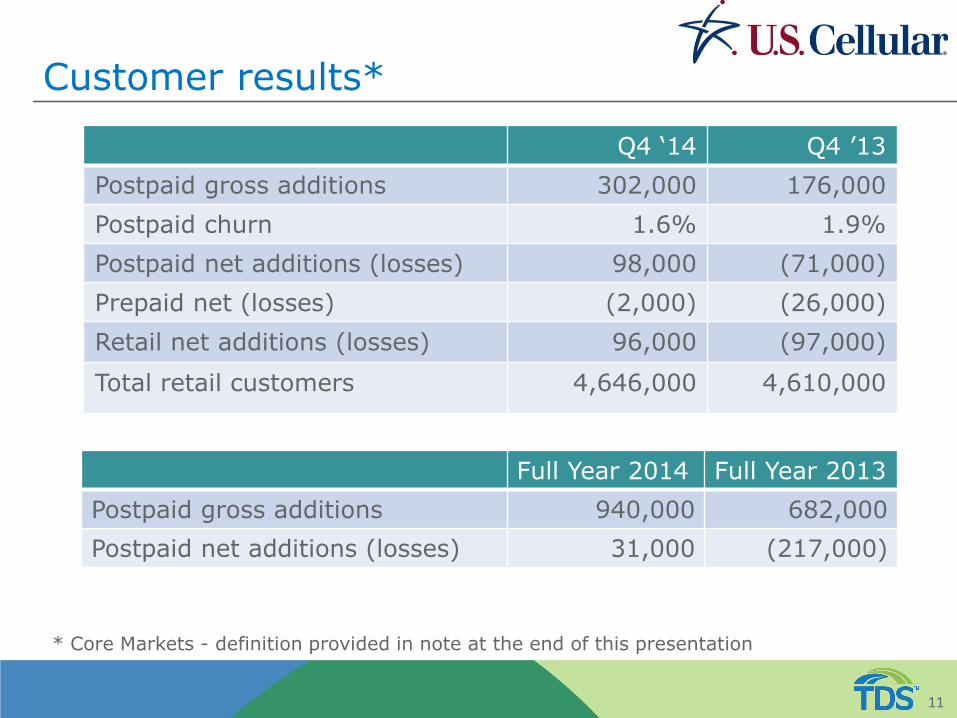
Customer results*
Q4 ‘14 Q4 ’13
Postpaid gross additions 302,000 176,000
Postpaid churn 1.6% 1.9%
Postpaid net additions (losses) 98,000 (71,000)
Prepaid net (losses) (2,000) (26,000)
Retail net additions (losses) 96,000 (97,000)
Total retail customers 4,646,000 4,610,000
11
* Core Markets - definition provided in note at the end of this presentation
Full Year 2014 Full Year 2013
Postpaid gross additions 940,000 682,000
Postpaid net additions (losses) 31,000 (217,000)
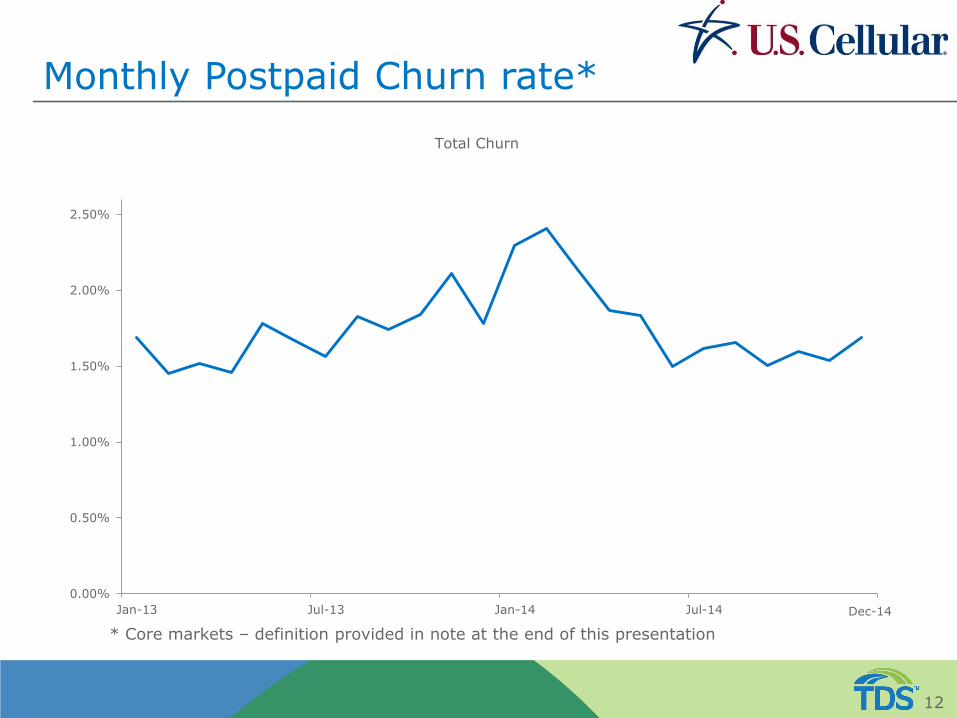
Monthly Postpaid Churn rate*
12
* Core markets – definition provided in note at the end of this presentation
0.00%
0.50%
1.00%
1.50%
2.00%
2.50%
Jan-13 Jul-13 Jan-14 Jul-14
Total Churn
Dec-14
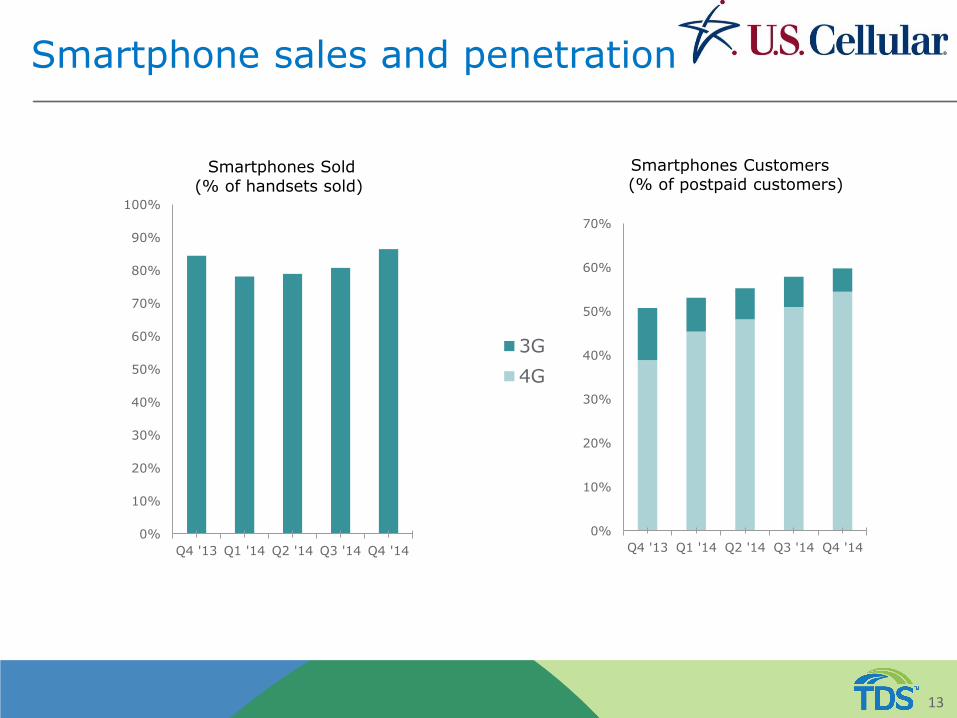
Smartphone sales and penetration*
0%
10%
20%
30%
40%
50%
60%
70%
Q4 '13 Q1 '14 Q2 '14 Q3 '14 Q4 '14
3G
4G
Smartphones Customers (% of postpaid customers)
13
0%
10%
20%
30%
40%
50%
60%
70%
80%
90%
100%
Q4 '13 Q1 '14 Q2 '14 Q3 '14 Q4 '14
Smartphones Sold (% of handsets sold)
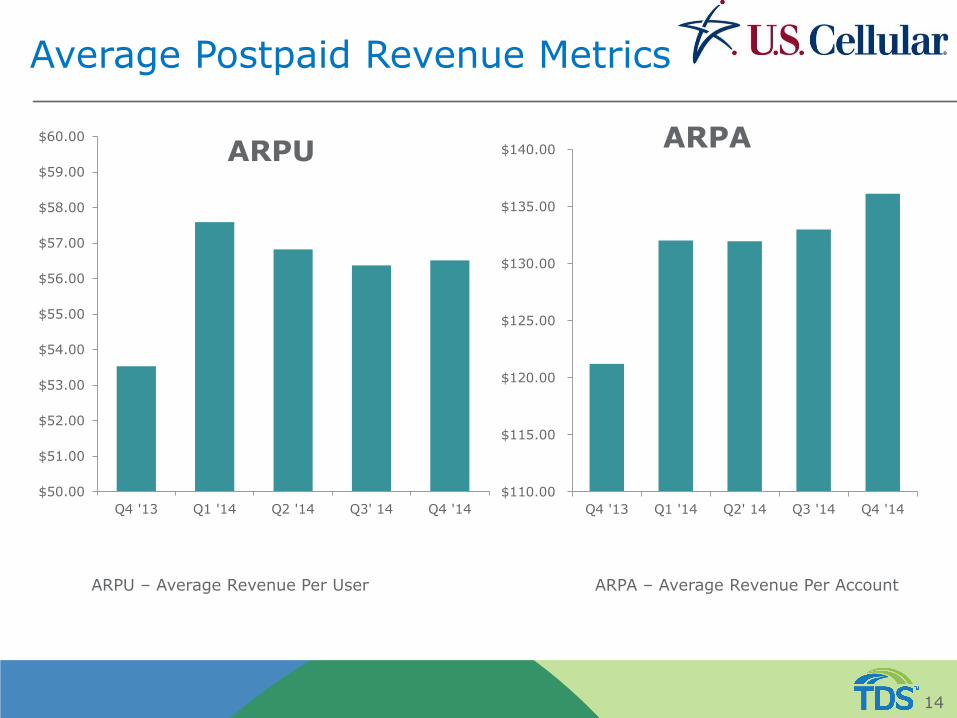
Average Postpaid Revenue Metrics
$50.00
$51.00
$52.00
$53.00
$54.00
$55.00
$56.00
$57.00
$58.00
$59.00
$60.00
Q4 '13 Q1 '14 Q2 '14 Q3' 14 Q4 '14
ARPU
14
$110.00
$115.00
$120.00
$125.00
$130.00
$135.00
$140.00
Q4 '13 Q1 '14 Q2' 14 Q3 '14 Q4 '14
ARPA
ARPU – Average Revenue Per User ARPA – Average Revenue Per Account
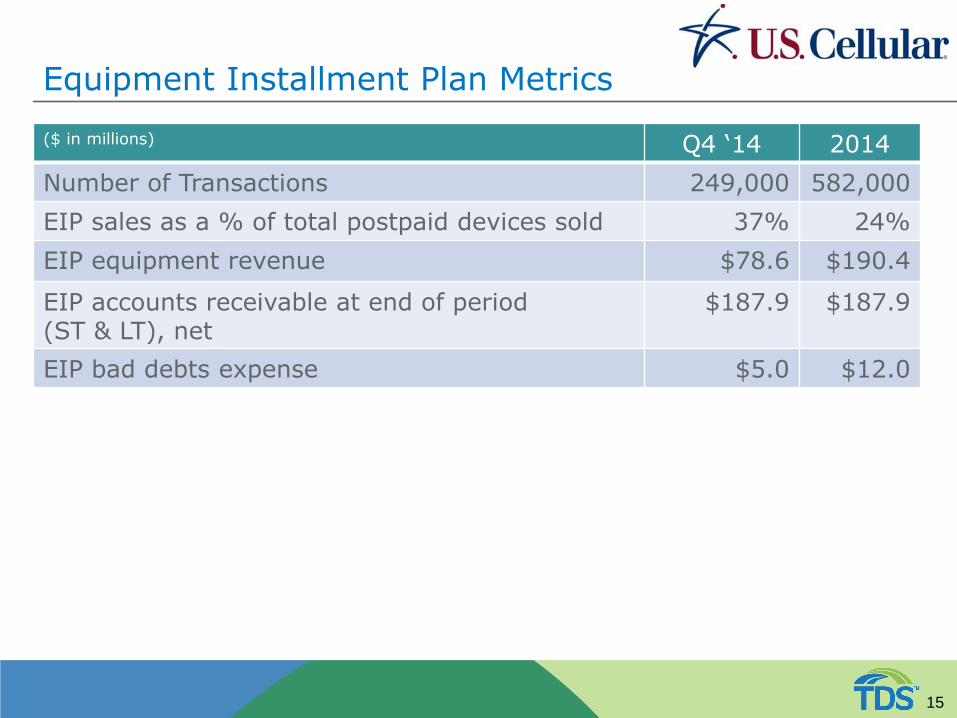
Equipment Installment Plan Metrics
($ in millions) Q4 ‘14 2014
Number of Transactions 249,000 582,000
EIP sales as a % of total postpaid devices sold 37% 24%
EIP equipment revenue $78.6 $190.4
EIP accounts receivable at end of period (ST & LT), net
$187.9 $187.9
EIP bad debts expense $5.0 $12.0
15
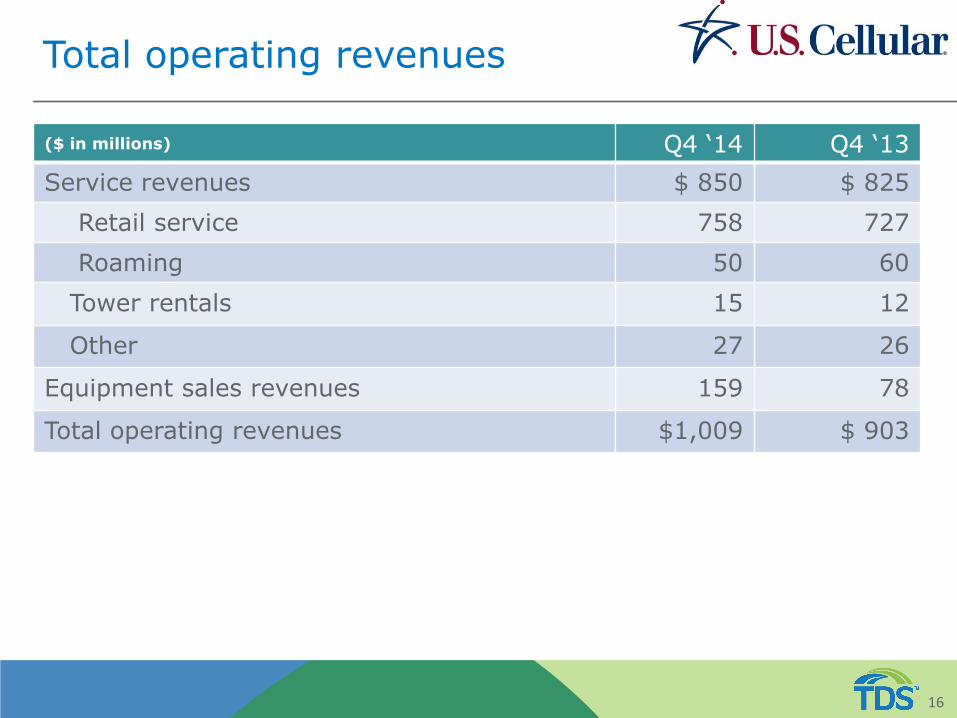
Total operating revenues
($ in millions) Q4 ‘14 Q4 ‘13
Service revenues $ 850 $ 825
Retail service 758 727
Roaming 50 60
Tower rentals 15 12
Other 27 26
Equipment sales revenues 159 78
Total operating revenues $1,009 $ 903
16
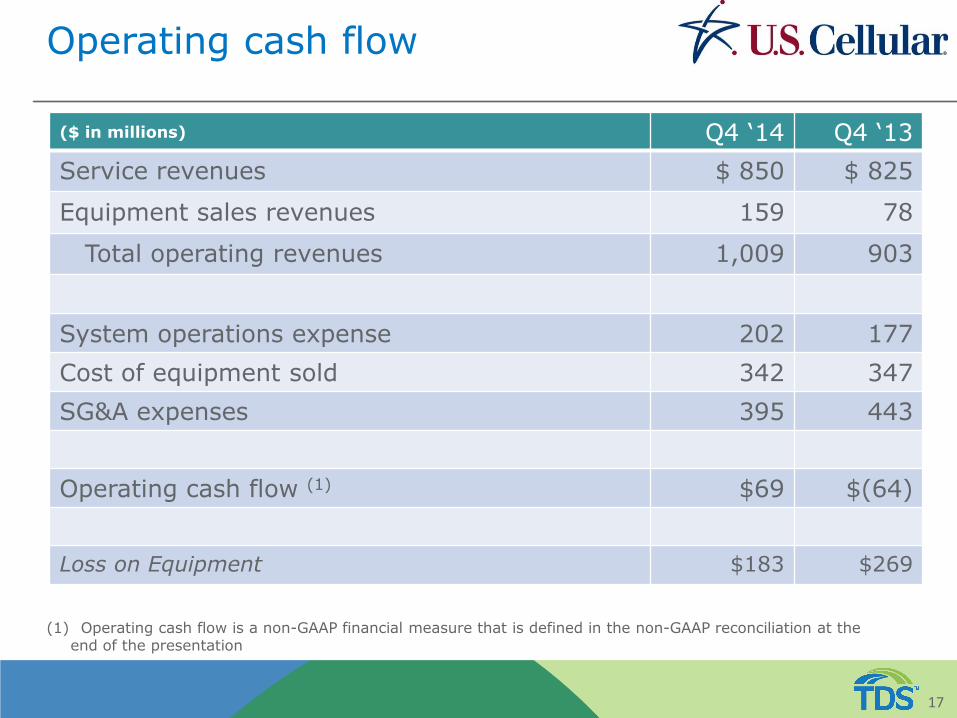
Operating cash flow
17
($ in millions) Q4 ‘14 Q4 ‘13
Service revenues $ 850 $ 825
Equipment sales revenues 159 78
Total operating revenues 1,009 903
System operations expense 202 177
Cost of equipment sold 342 347
SG&A expenses 395 443
Operating cash flow (1) $69 $(64)
Loss on Equipment $183 $269
(1) Operating cash flow is a non-GAAP financial measure that is defined in the non-GAAP reconciliation at the end of the presentation
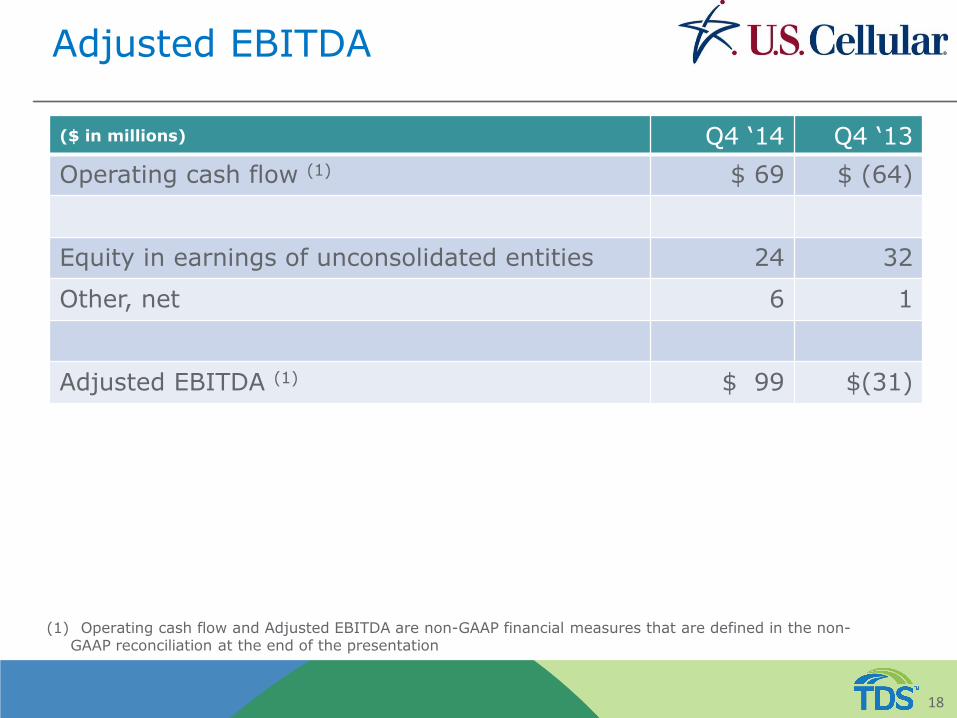
Adjusted EBITDA
18
($ in millions) Q4 ‘14 Q4 ‘13
Operating cash flow (1) $ 69 $ (64)
Equity in earnings of unconsolidated entities 24 32
Other, net 6 1
Adjusted EBITDA (1) $ 99 $(31)
(1) Operating cash flow and Adjusted EBITDA are non-GAAP financial measures that are defined in the non-GAAP reconciliation at the end of the presentation
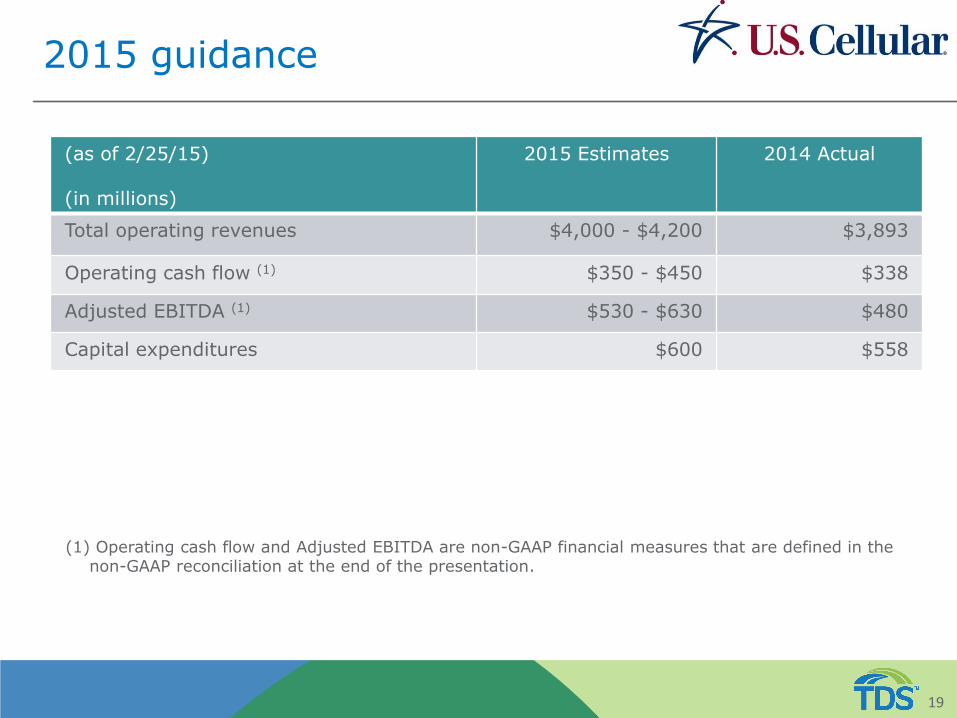
2015 guidance
(as of 2/25/15) (in millions)
2015 Estimates 2014 Actual
Total operating revenues $4,000 - $4,200 $3,893
Operating cash flow (1) $350 - $450 $338
Adjusted EBITDA (1) $530 - $630 $480
Capital expenditures $600 $558
19
(1) Operating cash flow and Adjusted EBITDA are non-GAAP financial measures that are defined in the non-GAAP reconciliation at the end of the presentation.
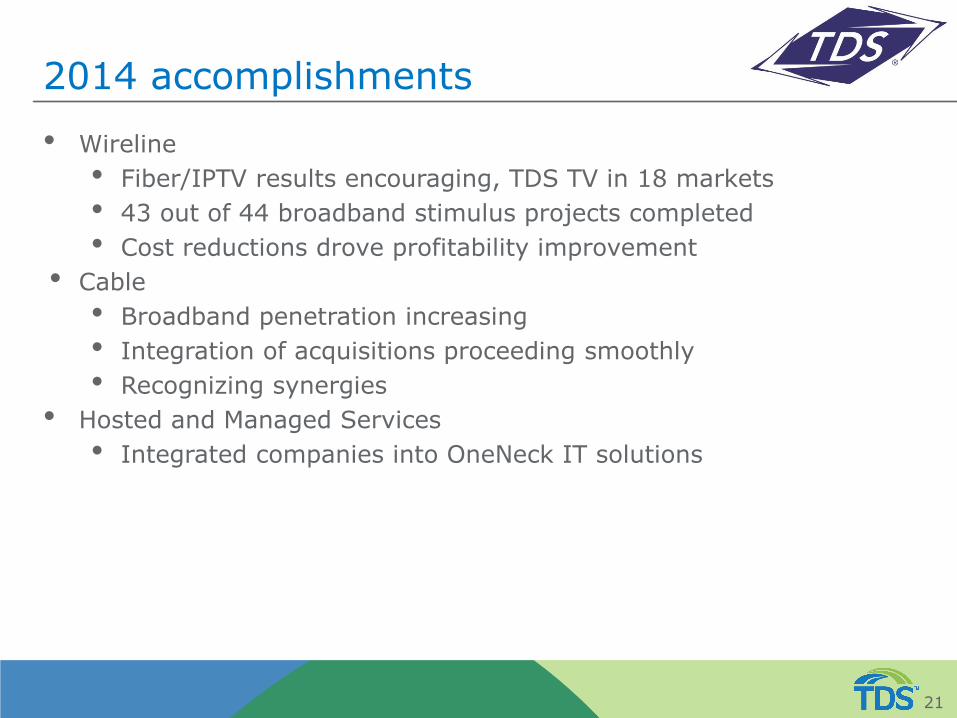
2014 accomplishments
• Wireline
• Fiber/IPTV results encouraging, TDS TV in 18 markets
• 43 out of 44 broadband stimulus projects completed
• Cost reductions drove profitability improvement
• Cable
• Broadband penetration increasing
• Integration of acquisitions proceeding smoothly
• Recognizing synergies
• Hosted and Managed Services
• Integrated companies into OneNeck IT solutions
21
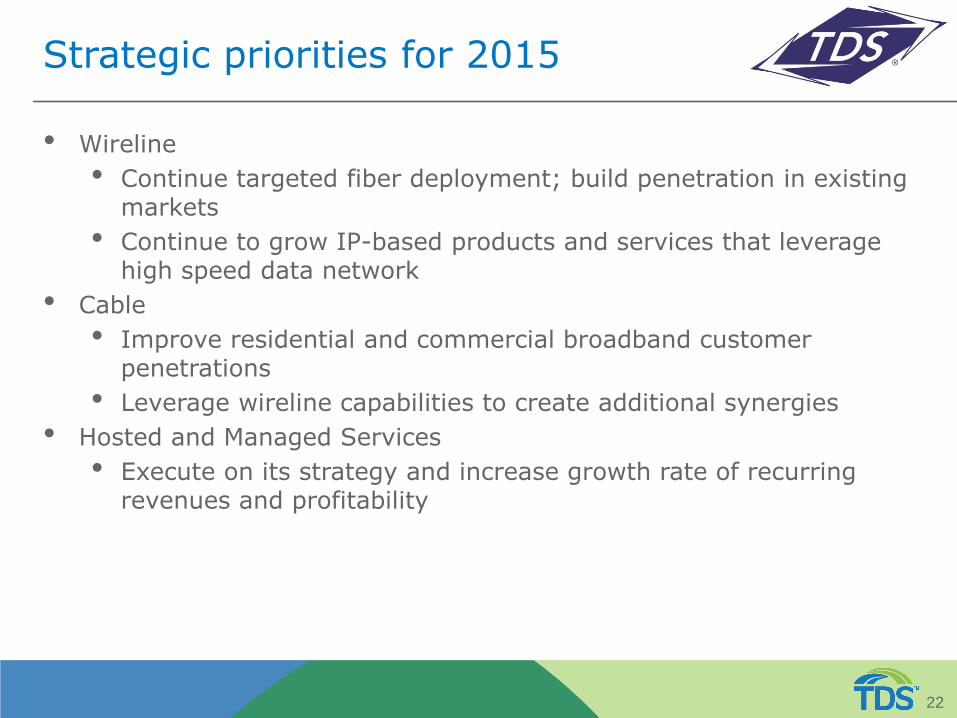
Strategic priorities for 2015 • Wireline
• Continue targeted fiber deployment; build penetration in existing markets
• Continue to grow IP-based products and services that leverage high speed data network
• Cable
• Improve residential and commercial broadband customer penetrations
• Leverage wireline capabilities to create additional synergies
• Hosted and Managed Services
• Execute on its strategy and increase growth rate of recurring revenues and profitability
22
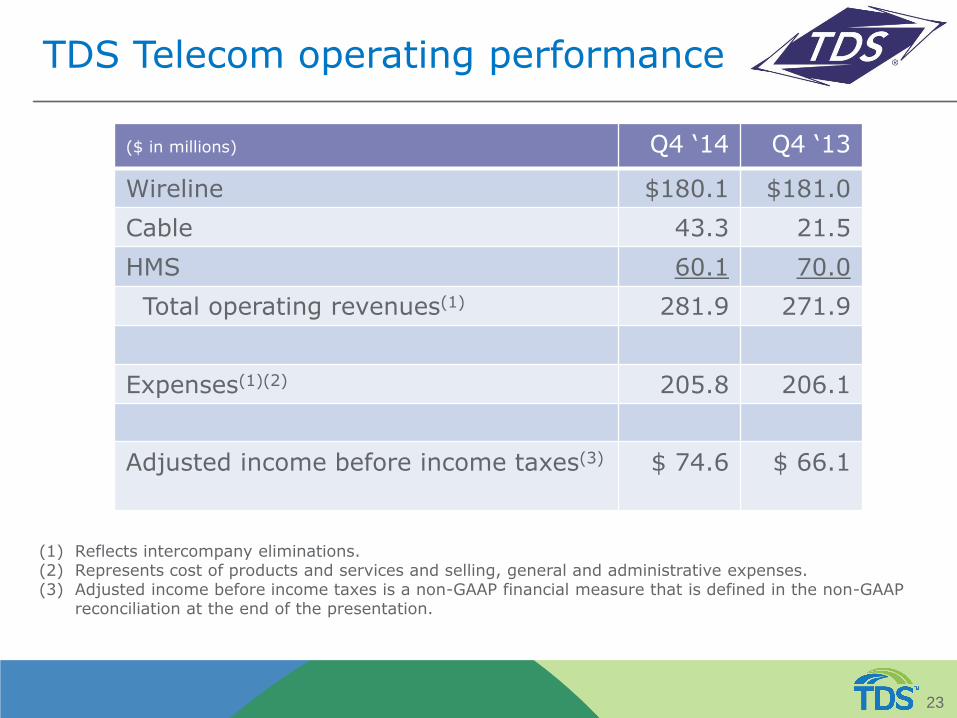
TDS Telecom operating performance
($ in millions) Q4 ‘14 Q4 ‘13
Wireline $180.1 $181.0
Cable 43.3 21.5
HMS 60.1 70.0
Total operating revenues(1) 281.9 271.9
Expenses(1)(2) 205.8 206.1
Adjusted income before income taxes(3) $ 74.6 $ 66.1
23
(1) Reflects intercompany eliminations. (2) Represents cost of products and services and selling, general and administrative expenses. (3) Adjusted income before income taxes is a non-GAAP financial measure that is defined in the non-GAAP
reconciliation at the end of the presentation.
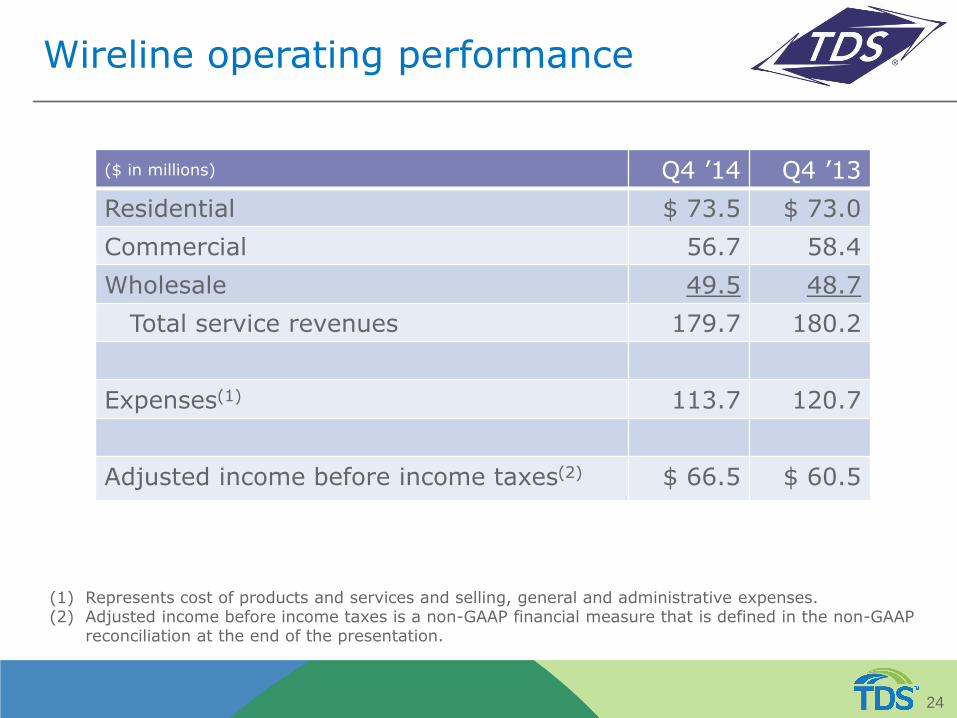
Wireline operating performance
($ in millions) Q4 ’14 Q4 ’13
Residential $ 73.5 $ 73.0
Commercial 56.7 58.4
Wholesale 49.5 48.7
Total service revenues 179.7 180.2
Expenses(1) 113.7 120.7
Adjusted income before income taxes(2) $ 66.5 $ 60.5
24
(1) Represents cost of products and services and selling, general and administrative expenses. (2) Adjusted income before income taxes is a non-GAAP financial measure that is defined in the non-GAAP
reconciliation at the end of the presentation.
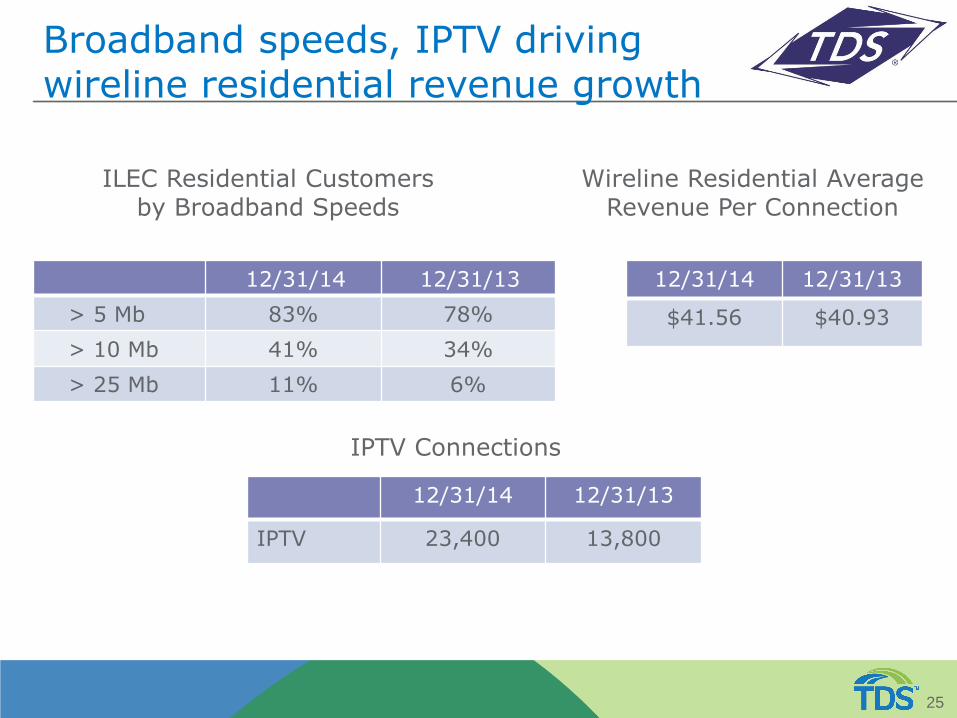
Broadband speeds, IPTV driving wireline residential revenue growth
12/31/14 12/31/13
> 5 Mb 83% 78%
> 10 Mb 41% 34%
> 25 Mb 11% 6%
25
12/31/14 12/31/13
$41.56 $40.93
Wireline Residential Average Revenue Per Connection
ILEC Residential Customers by Broadband Speeds
12/31/14 12/31/13
IPTV 23,400 13,800
IPTV Connections
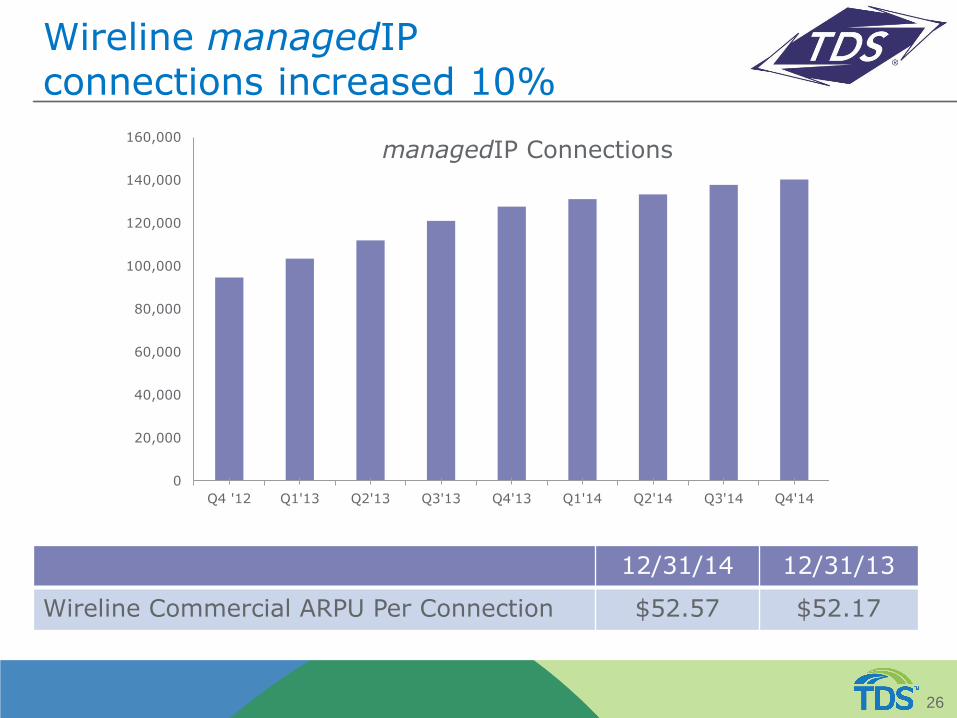
Wireline managedIP connections increased 10%
0
20,000
40,000
60,000
80,000
100,000
120,000
140,000
160,000
Q4 '12 Q1'13 Q2'13 Q3'13 Q4'13 Q1'14 Q2'14 Q3'14 Q4'14
managedIP Connections
26
12/31/14 12/31/13
Wireline Commercial ARPU Per Connection $52.57 $52.17
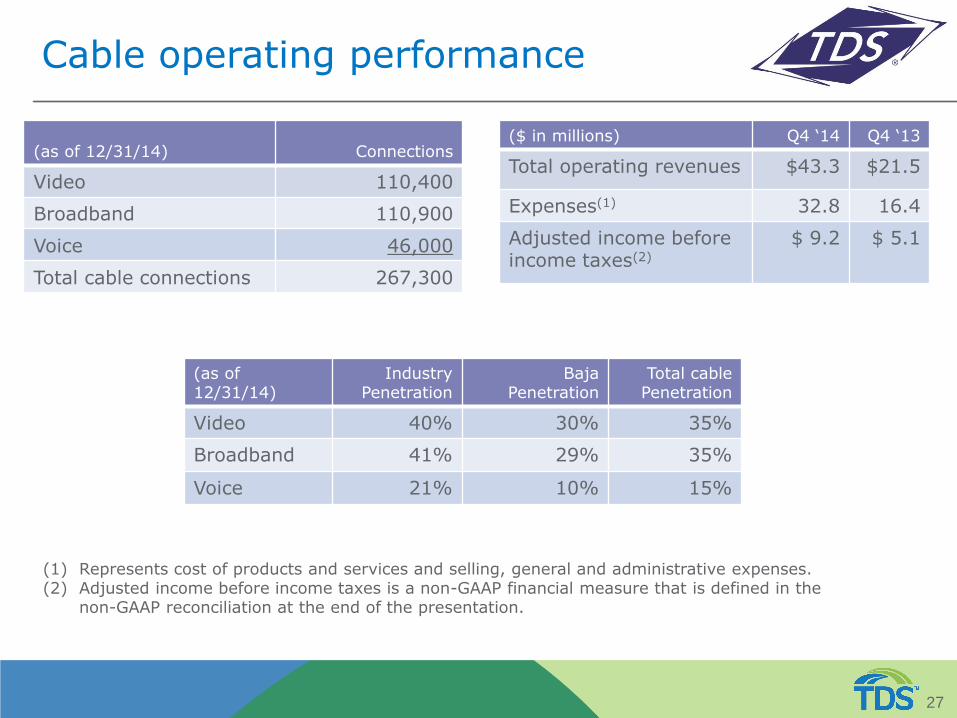
Cable operating performance
27
(as of 12/31/14) Connections
Video 110,400
Broadband 110,900
Voice 46,000
Total cable connections 267,300
(as of 12/31/14)
Industry Penetration
Baja Penetration
Total cable Penetration
Video 40% 30% 35%
Broadband 41% 29% 35%
Voice 21% 10% 15%
(1) Represents cost of products and services and selling, general and administrative expenses. (2) Adjusted income before income taxes is a non-GAAP financial measure that is defined in the
non-GAAP reconciliation at the end of the presentation.
($ in millions) Q4 ‘14 Q4 ‘13
Total operating revenues $43.3 $21.5
Expenses(1) 32.8 16.4
Adjusted income before income taxes(2)
$ 9.2 $ 5.1
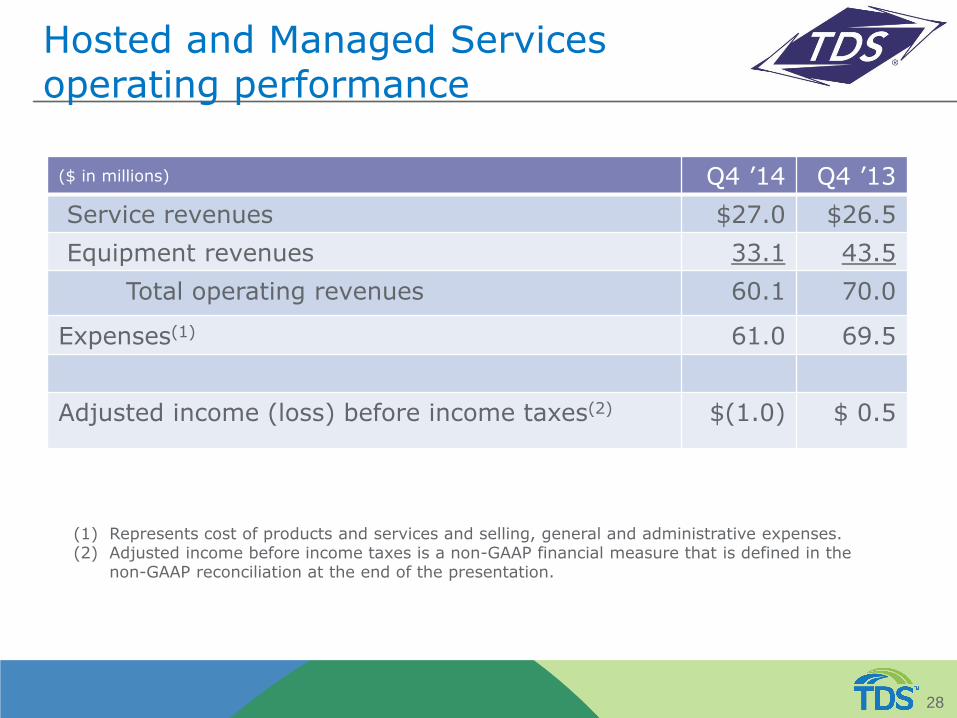
Hosted and Managed Services operating performance
($ in millions) Q4 ’14 Q4 ’13
Service revenues $27.0 $26.5
Equipment revenues 33.1 43.5
Total operating revenues 60.1 70.0
Expenses(1) 61.0 69.5
Adjusted income (loss) before income taxes(2) $(1.0) $ 0.5
28
(1) Represents cost of products and services and selling, general and administrative expenses. (2) Adjusted income before income taxes is a non-GAAP financial measure that is defined in the
non-GAAP reconciliation at the end of the presentation.
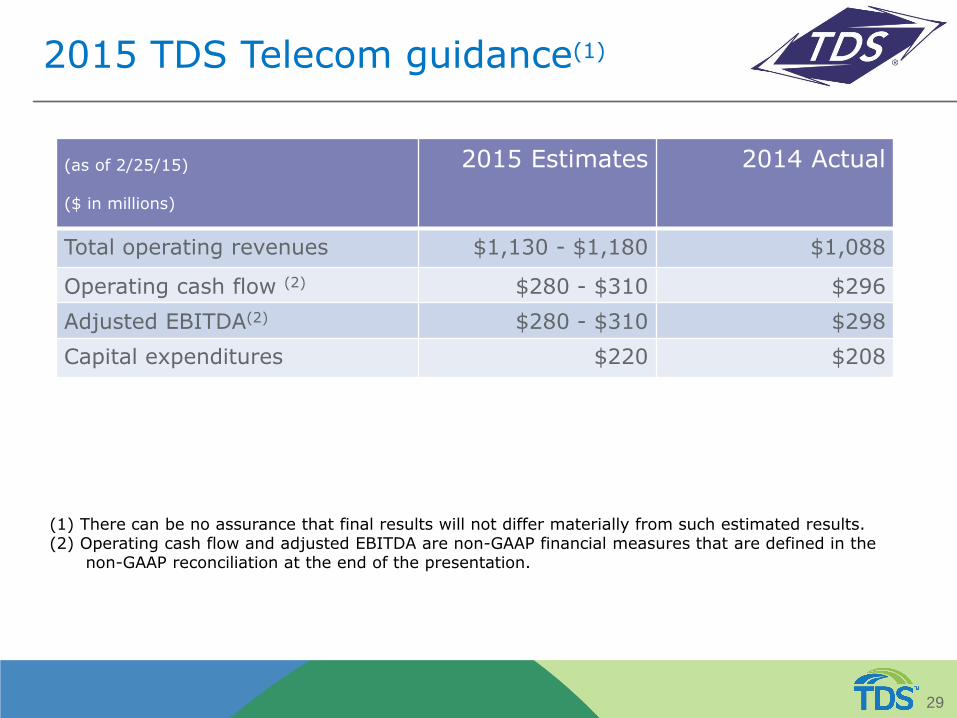
2015 TDS Telecom guidance(1)
(as of 2/25/15) ($ in millions)
2015 Estimates
2014 Actual
Total operating revenues $1,130 - $1,180 $1,088
Operating cash flow (2) $280 - $310 $296
Adjusted EBITDA(2) $280 - $310 $298
Capital expenditures $220 $208
29
(1) There can be no assurance that final results will not differ materially from such estimated results. (2) Operating cash flow and adjusted EBITDA are non-GAAP financial measures that are defined in the
non-GAAP reconciliation at the end of the presentation.

Appendix
30
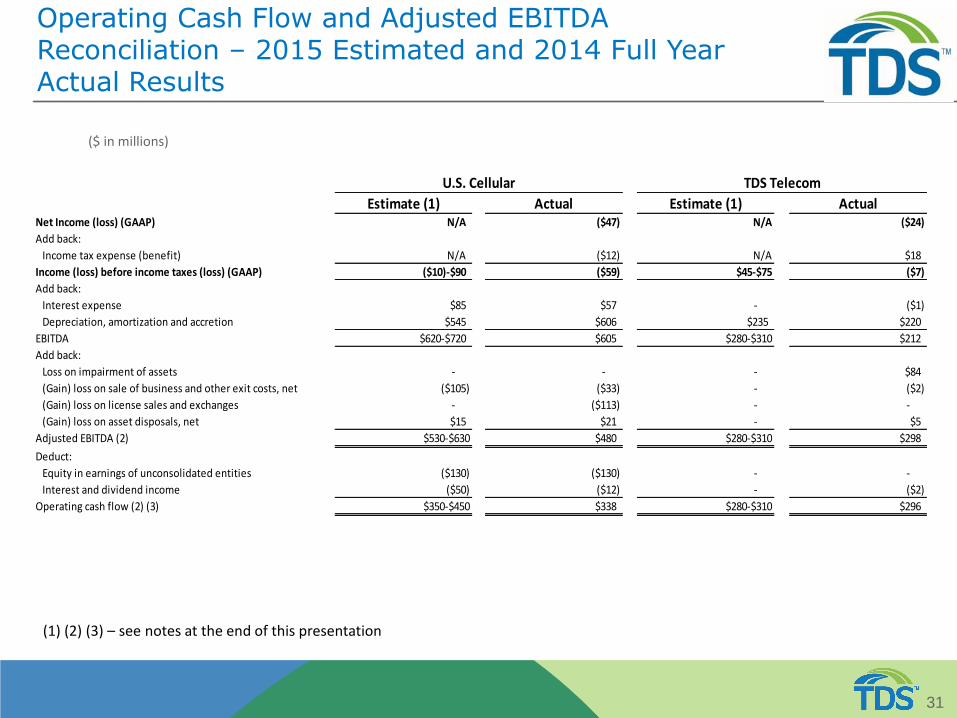
Operating Cash Flow and Adjusted EBITDA Reconciliation – 2015 Estimated and 2014 Full Year Actual Results
31
($ in millions)
(1) (2) (3) – see notes at the end of this presentation
Estimate (1) Actual Estimate (1) ActualNet Income (loss) (GAAP) N/A ($47) N/A ($24)
Add back:
Income tax expense (benefit) N/A ($12) N/A $18
Income (loss) before income taxes (loss) (GAAP) ($10)-$90 ($59) $45-$75 ($7)
Add back:
Interest expense $85 $57 - ($1)
Depreciation, amortization and accretion $545 $606 $235 $220
EBITDA $620-$720 $605 $280-$310 $212
Add back:
Loss on impairment of assets - - - $84
(Gain) loss on sale of business and other exit costs, net ($105) ($33) - ($2)
(Gain) loss on license sales and exchanges - ($113) - -
(Gain) loss on asset disposals, net $15 $21 - $5
Adjusted EBITDA (2) $530-$630 $480 $280-$310 $298
Deduct:
Equity in earnings of unconsolidated entities ($130) ($130) - -
Interest and dividend income ($50) ($12) - ($2)
Operating cash flow (2) (3) $350-$450 $338 $280-$310 $296
U.S. Cellular TDS Telecom
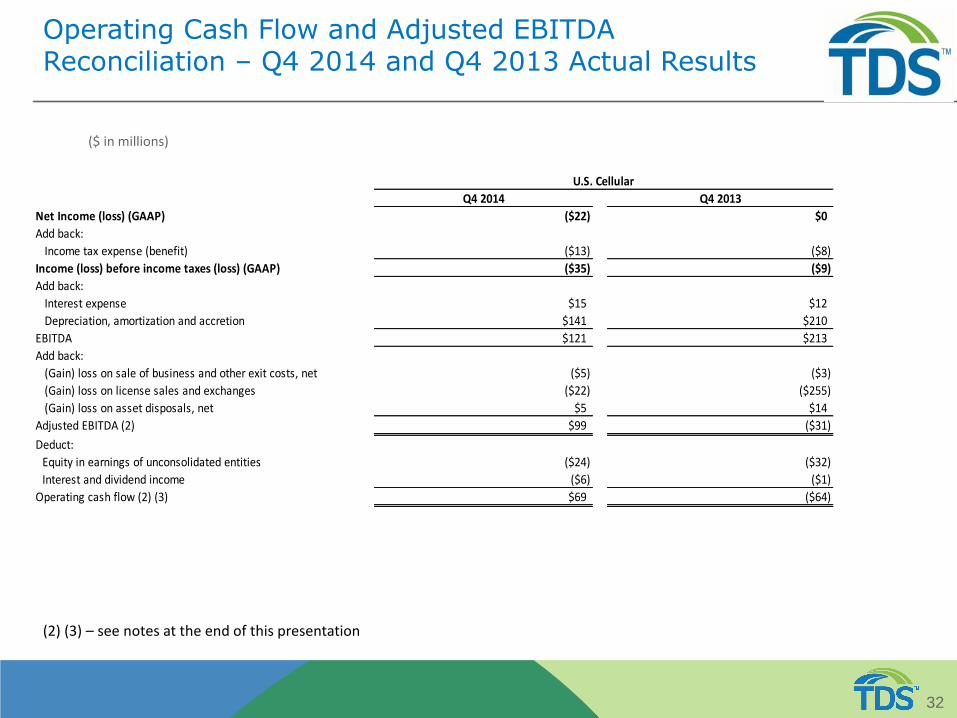
Operating Cash Flow and Adjusted EBITDA Reconciliation – Q4 2014 and Q4 2013 Actual Results
32
($ in millions)
(2) (3) – see notes at the end of this presentation
Q4 2014 Q4 2013
Net Income (loss) (GAAP) ($22) $0
Add back:
Income tax expense (benefit) ($13) ($8)
Income (loss) before income taxes (loss) (GAAP) ($35) ($9)
Add back:
Interest expense $15 $12
Depreciation, amortization and accretion $141 $210
EBITDA $121 $213
Add back:
(Gain) loss on sale of business and other exit costs, net ($5) ($3)
(Gain) loss on license sales and exchanges ($22) ($255)
(Gain) loss on asset disposals, net $5 $14
Adjusted EBITDA (2) $99 ($31)
Deduct:
Equity in earnings of unconsolidated entities ($24) ($32)
Interest and dividend income ($6) ($1)
Operating cash flow (2) (3) $69 ($64)
U.S. Cellular
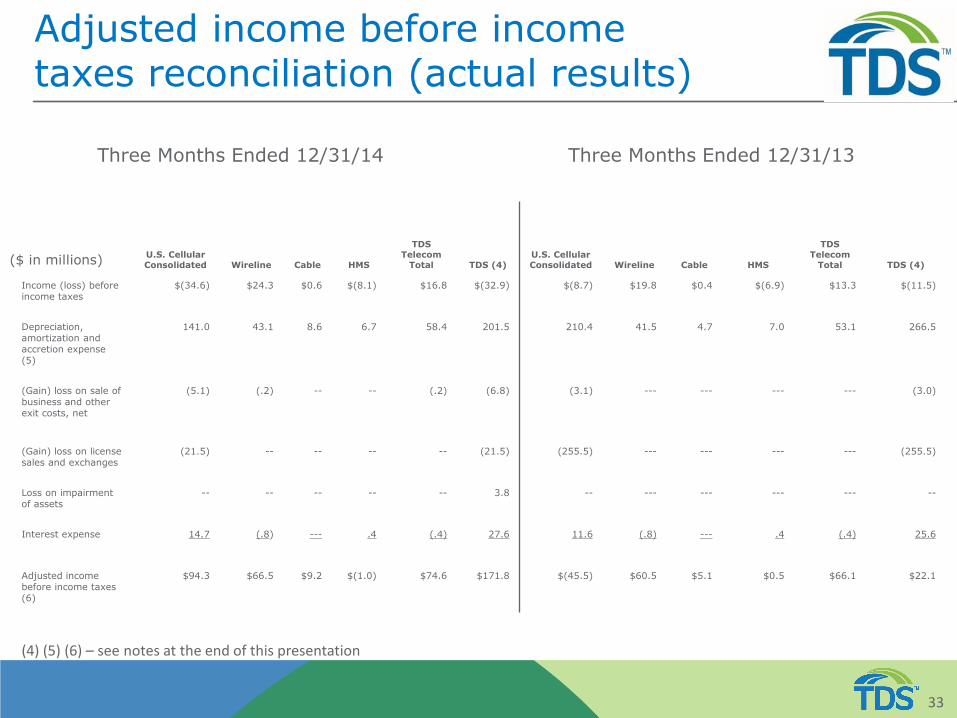
Adjusted income before income taxes reconciliation (actual results)
33
U.S. Cellular Consolidated Wireline Cable HMS
TDS Telecom
Total TDS (4) U.S. Cellular Consolidated Wireline Cable HMS
TDS Telecom
Total TDS (4)
Income (loss) before income taxes
$(34.6) $24.3 $0.6 $(8.1) $16.8 $(32.9) $(8.7) $19.8 $0.4 $(6.9) $13.3 $(11.5)
Depreciation, amortization and accretion expense (5)
141.0 43.1 8.6 6.7 58.4 201.5 210.4 41.5 4.7 7.0 53.1 266.5
(Gain) loss on sale of business and other exit costs, net
(5.1) (.2) -- -- (.2) (6.8) (3.1) --- --- --- --- (3.0)
(Gain) loss on license sales and exchanges
(21.5) -- -- -- -- (21.5) (255.5) --- --- --- --- (255.5)
Loss on impairment of assets
-- -- -- -- -- 3.8 -- --- --- --- --- --
Interest expense 14.7 (.8) --- .4 (.4) 27.6 11.6 (.8) --- .4 (.4) 25.6
Adjusted income before income taxes (6)
$94.3 $66.5 $9.2 $(1.0) $74.6 $171.8 $(45.5) $60.5 $5.1 $0.5 $66.1 $22.1
Three Months Ended 12/31/14
($ in millions)
Three Months Ended 12/31/13
(4) (5) (6) – see notes at the end of this presentation

(1) In providing 2015 Estimated Results, TDS has not completed the above reconciliation to net income because it does not provide guidance for income taxes. TDS believes that the impact of income taxes cannot be reasonably predicted; therefore, the company is unable to provide such guidance.
(2) Operating cash flow is defined as net income, adjusted for the items set forth in the reconciliation above. Adjusted EBITDA (earnings before interest, taxes, depreciation, amortization and accretion), is defined as net income, adjusted for the items set forth in the reconciliation above. Operating cash flow and Adjusted EBITDA exclude these items in order to show operating results on a more comparable basis from period to period. From time to time, TDS may exclude other items from Operating cash flow and/or Adjusted EBITDA if such items help reflect operating results on a more comparable basis. TDS does not intend to imply that any such items that are excluded are non-recurring, infrequent or unusual; such items may occur in the future. Operating cash flow and Adjusted EBITDA are not measures of financial performance under Generally Accepted Accounting Principles in the United States (“GAAP”) and should not be considered as alternatives to net income as indicators of the company’s operating performance or as alternatives to cash flows from operating activities, determined in accordance with GAAP, as indicators of cash flows or as measures of liquidity. TDS believes Operating cash flow and Adjusted EBITDA are useful measures of TDS’ operating results before significant recurring non-cash charges, gains and losses, and other items as indicated above.
(3) A reconciliation of Operating cash flow (Non-GAAP) to operating income (GAAP) for full year 2014, 2013, and 2012 actual results can be found on the company's website at investors.tdsinc.com.
(4) The TDS column includes U.S. Cellular, TDS Telecom and also the impacts of consolidating eliminations, corporate operations and non-reportable segments, all of which are not presented above.
(5) Actual results for the three months ended December 31, 2013 includes $45 million of incremental accelerated depreciation, amortization and accretion resulting from the Divestiture Transaction.
(6) Adjusted income before income taxes is defined as income before income taxes, adjusted for the items set forth in the reconciliation above. Adjusted income before income taxes excludes these items in order to show operating results on a more comparable basis from period to period. TDS does not intend to imply that any such items that are excluded are non-recurring, infrequent or unusual; such items may occur in the future. Adjusted income before income taxes is not a measure of financial performance under Generally Accepted Accounting Principles in the United States (“GAAP”) and should not be considered as an alternative to income before income taxes as an indicator of the company’s operating performance or as an alternative to cash flows from operating activities, determined in accordance with GAAP, as an indicator of cash flows or as a measure of liquidity. TDS believes adjusted income before income taxes is a useful measure of TDS’ operating results before significant recurring non-cash charges, discrete gains and losses, and financing charges (interest expense).
* The U.S. Cellular Consolidated amounts represent GAAP financial measures and include the results of both the Core Markets and the Divestiture and
NY1 and NY2 Partnerships. The amounts for Divestiture Markets and NY1 and NY2 Partnerships, and for the Core Markets, represent non-GAAP financial measures. TDS believes that the amounts for the Divestiture Markets and NY1 and NY2 Partnerships, and for the Core Markets, may be useful to investors and other users of its financial information in evaluating the separate results for the Core Markets. Divestiture Markets are comprised of U.S. Cellular's Chicago, central Illinois, St. Louis and certain Indiana/Michigan/Ohio markets. Core Markets are comprised of all other markets in which U.S. Cellular conducts business including Peoria, Rockford and certain other areas in Illinois, and in Columbia, Joplin, Jefferson City and certain other areas in Missouri. Core Markets as defined also includes any other income or expenses due to U.S. Cellular’s direct or indirect ownership interests in other spectrum in the Divestiture Markets which was not included in the sale and other retained assets from the Divestiture Markets.
34

Related Documents