Dassault Systèmes Q3 & YTD 2019 Earnings Presentation Bernard Charlès, Vice-Chairman & CEO Pascal Daloz, EVP, CFO & Corporate Strategy Officer

Welcome message from author
This document is posted to help you gain knowledge. Please leave a comment to let me know what you think about it! Share it to your friends and learn new things together.
Transcript

Dassault SystèmesQ3 & YTD 2019 Earnings Presentation
Bernard Charlès,Vice-Chairman & CEO
Pascal Daloz, EVP, CFO & Corporate Strategy Officer
2
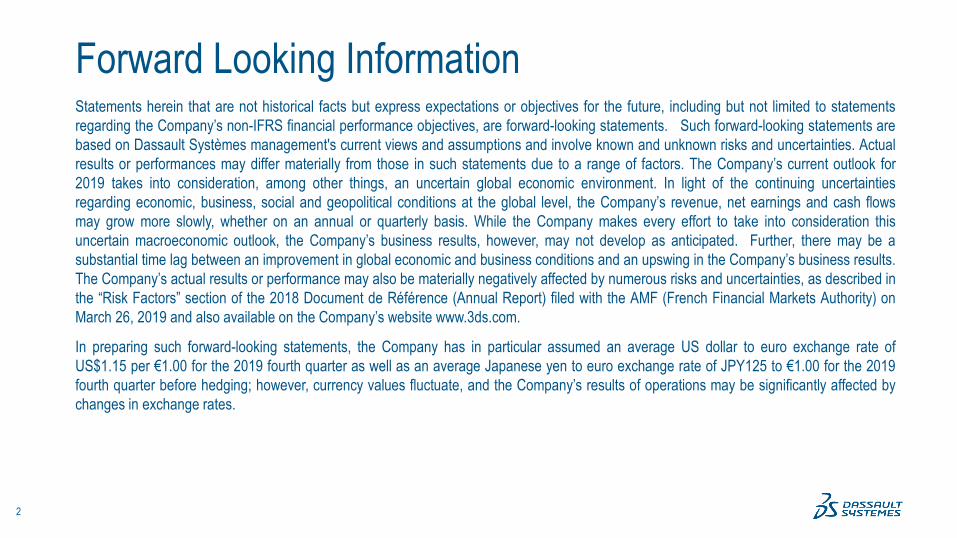
Forward Looking Information Statements herein that are not historical facts but express expectations or objectives for the future, including but not limited to statementsregarding the Company’s non-IFRS financial performance objectives, are forward-looking statements. Such forward-looking statements arebased on Dassault Systèmes management's current views and assumptions and involve known and unknown risks and uncertainties. Actualresults or performances may differ materially from those in such statements due to a range of factors. The Company’s current outlook for2019 takes into consideration, among other things, an uncertain global economic environment. In light of the continuing uncertaintiesregarding economic, business, social and geopolitical conditions at the global level, the Company’s revenue, net earnings and cash flowsmay grow more slowly, whether on an annual or quarterly basis. While the Company makes every effort to take into consideration thisuncertain macroeconomic outlook, the Company’s business results, however, may not develop as anticipated. Further, there may be asubstantial time lag between an improvement in global economic and business conditions and an upswing in the Company’s business results.The Company’s actual results or performance may also be materially negatively affected by numerous risks and uncertainties, as described inthe “Risk Factors” section of the 2018 Document de Référence (Annual Report) filed with the AMF (French Financial Markets Authority) onMarch 26, 2019 and also available on the Company’s website www.3ds.com.
In preparing such forward-looking statements, the Company has in particular assumed an average US dollar to euro exchange rate ofUS$1.15 per €1.00 for the 2019 fourth quarter as well as an average Japanese yen to euro exchange rate of JPY125 to €1.00 for the 2019fourth quarter before hedging; however, currency values fluctuate, and the Company’s results of operations may be significantly affected bychanges in exchange rates.
3
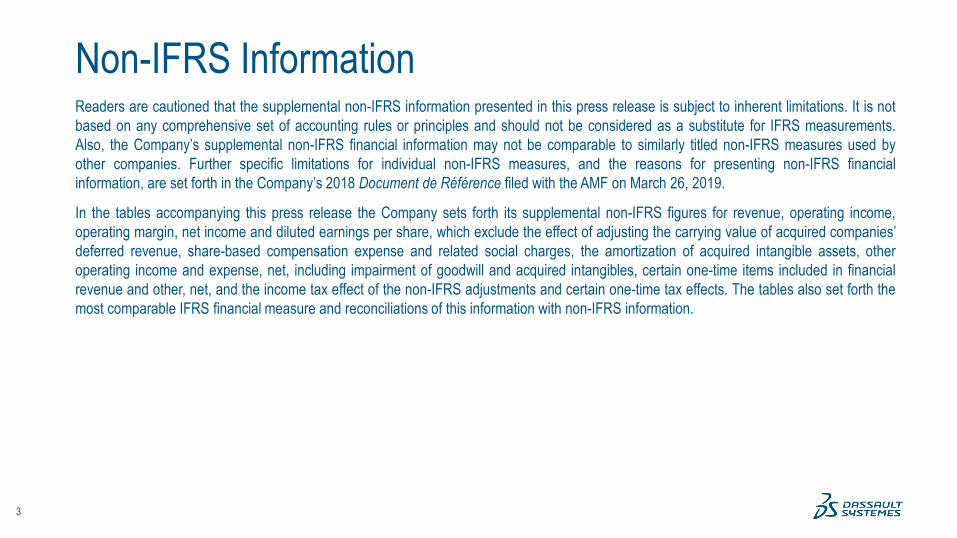
Non-IFRS InformationReaders are cautioned that the supplemental non-IFRS information presented in this press release is subject to inherent limitations. It is notbased on any comprehensive set of accounting rules or principles and should not be considered as a substitute for IFRS measurements.Also, the Company’s supplemental non-IFRS financial information may not be comparable to similarly titled non-IFRS measures used byother companies. Further specific limitations for individual non-IFRS measures, and the reasons for presenting non-IFRS financialinformation, are set forth in the Company’s 2018 Document de Référence filed with the AMF on March 26, 2019.
In the tables accompanying this press release the Company sets forth its supplemental non-IFRS figures for revenue, operating income,operating margin, net income and diluted earnings per share, which exclude the effect of adjusting the carrying value of acquired companies’deferred revenue, share-based compensation expense and related social charges, the amortization of acquired intangible assets, otheroperating income and expense, net, including impairment of goodwill and acquired intangibles, certain one-time items included in financialrevenue and other, net, and the income tax effect of the non-IFRS adjustments and certain one-time tax effects. The tables also set forth themost comparable IFRS financial measure and reconciliations of this information with non-IFRS information.
4
Glossary of DefinitionsInformation in Constant CurrenciesWe have followed a long-standing policy of measuring our revenue performance and setting our revenue objectives exclusive of currency in order to measure in a transparent manner theunderlying level of improvement in our total revenue and software revenue by type, industry, region and product lines. We believe it is helpful to evaluate our growth exclusive of currencyimpacts, particularly to help understand revenue trends in our business. Therefore, we provide percentage increases or decreases in our revenue and EPS (in both IFRS as well as non-IFRS) to eliminate the effect of changes in currency values, particularly the U.S. dollar and the Japanese yen, relative to the euro. When trend information is expressed by us "in constantcurrencies", the results of the "prior" period have first been recalculated using the average exchange rates of the comparable period in the current year, and then compared with the resultsof the comparable period in the current year.While constant currency calculations are not considered to be an IFRS measure, we do believe these measures are critical to understanding our global revenue results and to compare withmany of our competitors who report their financial results in U.S. dollars. Therefore, we are including this calculation for comparing IFRS revenue figures for comparable periods as well asfor comparing non-IFRS revenue figures for comparable periods. All constant currency information is provided on an approximate basis. Unless otherwise indicated, the impact of exchangerate fluctuations is approximately the same for both the Company’s IFRS and supplemental non-IFRS financial data.Information on Growth excluding acquisitions (“organic growth”)In addition to discussing total growth, we also provide financial information where we discuss growth excluding acquisitions or growth on an organic basis as used alternatively. In bothcases, growth excluding acquisitions have been calculated using the following restatements of the scope of consolidation: for entities entering the consolidation scope in the current year,subtracting the contribution of the acquisition from the aggregates of the current year, and for entities entering the consolidation scope in the previous year, subtracting the contribution of theacquisition from January 1st of the current year, until the last day of the month of the current year when the acquisition was made the previous year.Information on Industrial SectorsOur global customer base includes companies in 11 industrial sectors as of January 1, 2019: with “Core Industries” comprised of Transportation & Mobility; Industrial Equipment; Aerospace& Defense; and a portion of Business Services. “Diversification Industries” includes companies in High-Tech; Life Sciences; Energy & Materials; Home & Lifestyle, Construction, Cities &Territories; Consumer Packaged Goods & Retail, Marine & Offshore and a portion of Business Services.3DEXPERIENCE Licenses and Software ContributionTo measure the progressive penetration of 3DEXPERIENCE software, the Company utilizes the following ratios: a) for new licenses revenue, the Company calculates the percentagecontribution by comparing total 3DEXPERIENCE new licenses revenue to new licenses revenue for all product lines except SOLIDWORKS and acquisitions (“related new licensesrevenue”); and, b) for software revenue, the Company calculates the percentage contribution by comparing total 3DEXPERIENCE software revenue to software revenue for all product linesexcept SOLIDWORKS and acquisitions (“related software revenue”).
5
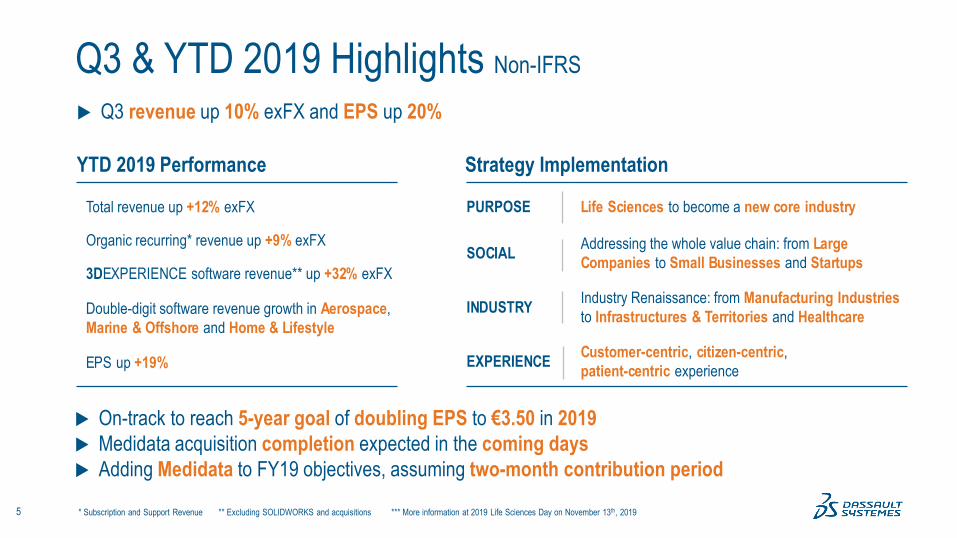
Q3 & YTD 2019 Highlights Non-IFRS
Q3 revenue up 10% exFX and EPS up 20%
YTD 2019 Performance Strategy Implementation
Total revenue up +12% exFX
Organic recurring* revenue up +9% exFX
3DEXPERIENCE software revenue** up +32% exFX
Double-digit software revenue growth in Aerospace,Marine & Offshore and Home & Lifestyle
EPS up +19%
PURPOSE Life Sciences to become a new core industry
SOCIAL Addressing the whole value chain: from Large Companies to Small Businesses and Startups
INDUSTRY Industry Renaissance: from Manufacturing Industries to Infrastructures & Territories and Healthcare
EXPERIENCE Customer-centric, citizen-centric,patient-centric experience
On-track to reach 5-year goal of doubling EPS to €3.50 in 2019 Medidata acquisition completion expected in the coming days Adding Medidata to FY19 objectives, assuming two-month contribution period
* Subscription and Support Revenue ** Excluding SOLIDWORKS and acquisitions *** More information at 2019 Life Sciences Day on November 13th, 2019
6
Strategy at Work
Q3 & YTD 2019 Business Review
Q3 & YTD 2019 Financial Highlights
Q4 & FY 2019 Financial Objectives
Financial Information Appendix
Agenda

7
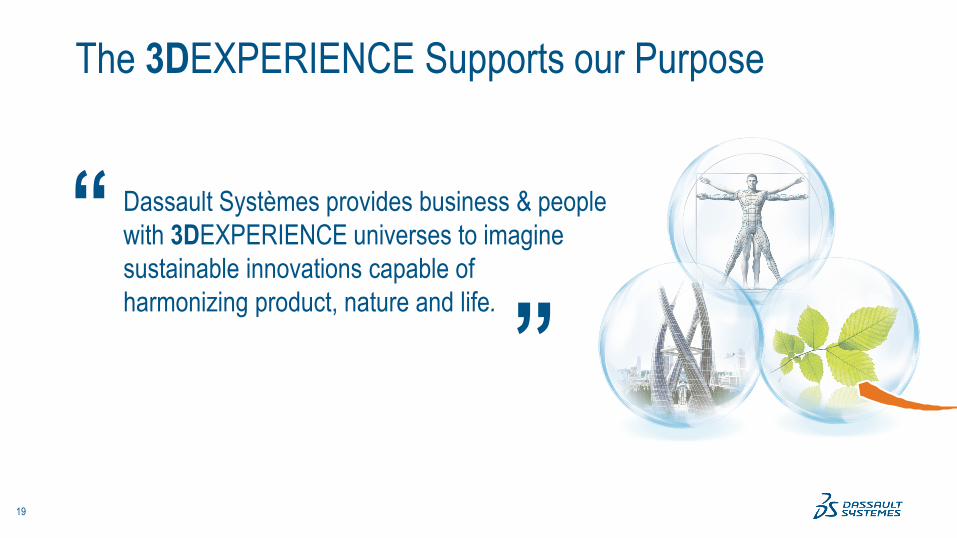
Dassault Systèmes provides business & people with 3DEXPERIENCE universes to imagine sustainable innovations capable of harmonizing product, nature and life.
“ “
The 3DEXPERIENCE Supports our Purpose

8
On-Demand ProductionVisibility, efficiency, and control of manufacturing
operations, within and across plants
Electric, Connected & Autonomous VehiclesIntelligent vehicle experience delivery
Electric Vehicles Batteries From chemistry to cell engineering, to moduleengineering and integration into full vehicles
Certification & Compliance
Compliance with global and local requirements
On-Target Vehicle LaunchEngineering, industrialization, manufacturing
Delivering on Transportation & Mobility Challenges

9
Solution:3DEXPERIENCE POWER'BY
Adopts 3DEXPERIENCE PlatformTOYOTAThe automotive industry is now undergoing a major transformation. OEMs are facing challenges of survival and sustainable growth. TMC decided to adopt 3DEXPERIENCE POWER’BY to reinvent its traditional car development and drastically improve its productivity.
Car electrification, smart & connected cars, new competition, AI, consumer digitalization, IoT Values:►Simultaneous development by timely sharing latest data►Single version of truth across R&D, design, production,
sales, customer services, alliance companies & suppliersAmbition:►Global deployment including suppliers for more than
40,000 users (deployment ramp-up 2019-2023)►Lead time reduction ►Business transformation (digital engineering)►Seamless collaboration with oversea sites, worldwide
suppliers and business partners
Business Values:

10
Spark Racing Technology commissioned to deliver an electric-powered racing car to all teams participatingin the fourth season of the Formula E racing series
►Designing and assembling the entire car with its completely new innovative architecture in less than two years, and delivering the finished vehicle to the 40 teams participating in the competition
► “By using the 3DEXPERIENCE platform, we have a reliable and high-performing solution […]. It has opened many doors for us in terms of new business.” Théophile Gouzin, CEO
Business Values:
Solution:
Adopts 3DEXPERIENCE
3DEXPERIENCE Platformwith several Industry Solution Experiences
Spark Racing Technology
Motorsport manufacturer specialized in the development and engineering of high-performance e-mobility cars and modules

11
Passenger ExperienceStand-out from the competition with customized, cost-efficient
and certified experiences
Production RateMeet demand for the next few years
Disruptive InnovationAccelerate from concept to delivery from years to months
Growing Complexity of
SystemsAccelerate program
integration while decreasing costs
After MarketIncrease fleet availability
and reduce parts inventory
Delivering on Aerospace Challenges

12
Business Values:
Solution:3DEXPERIENCE platform to become the standardengineering and manufacturing planning software forall new Advanced Development Programs in Aviation innovator Skunkworks
►Providing the end-to-end infrastructure needed to engineer new programs from concept to the handoffto the shop floor
►Multi-year digital transformation partnership to improve affordability and manufacturability of next generation products
Adopts 3DEXPERIENCE
3DEXPERIENCE Platform with Program Excellence, Winning Concept, Co-Design to Target, Ready to Rate and Cleared to Operate Industry Solution Experiences
Lockheed Martin Lockheed Martin Aeronautics Company, home of the world renowned Skunk Works®, turns visionary aircraft into reality and is known for building the finest military aircraft in the world

13
Asia’s leading food solutions and gateway services provider
Business Values:
Solution:Creating a 3D digital twin experience of a virtual kitchen that pairs virtual and physical operations to provide data-driven analytics for better resource planning
►Preventing bottlenecks and enhancing productivity
►Better forecasting ingredient usage
► Identifying new ways to boost efficiency and minimize food waste, for a more sustainable approach to operations
Adopts 3DEXPERIENCE on the Cloud
3DEXPERIENCE Platform with Industry Solution Experiences leveraging DELMIA Quintiqapplications
SATS

14
The Last MileUse agile new models for product delivery
The New ConsumerReact more quicklyto deliver meaningful innovation on shorter timelines
Margin PressureDrive sustainable growth and increase profits
Production ComplexityManage production
complexity to providethe right productat the right time
Regulatory ComplianceSupport health and wellness trends
and manage regulatory compliance efficiently
Delivering on Consumer Packaged Goods and Retail Challenges

15
Business Values:
Solution:Laboratoires M&L, the manufacturing divisionof L’Occitane Group, needed to improve production planning flexibility to deal with the fluctuations in natural raw materials and to deliver its products on time ►Optimizing global production and logistics
operations from raw material reception, weighing, production, packaging, and storage
►Anticipating early, issues that can adversely affect the quality and delivery of its products to market
►Reducing the rate of non-quality and waste by 50%
Adopts 3DEXPERIENCE
3DEXPERIENCE Platform with Perfect Production Industry Solution Experience leveraging DELMIA Apriso applications
Leading Health and Beauty Company
L’Occitane

16
The New ConsumerUnderstand consumers to meettheir expectationsand gain their loyalty
Limitless Innovation
Think without limitsin order to deliver
innovation for product, process, materials,
and experience
Delivering on Home & Lifestyle Challenges
Digital Manufacturing & Supply ChainBe flexible and adaptthe entire supply chainto evolving consumer demand
Personalized Experiences
From mass merchandising
to customized products and personalized
experiences

17
2016 20172007 – 2011 20152012 – 2013 2014 2018 YTD 2019
CENTRIC PLM: 1,000+ brandsMarket Adoptionin Home & Lifestyle
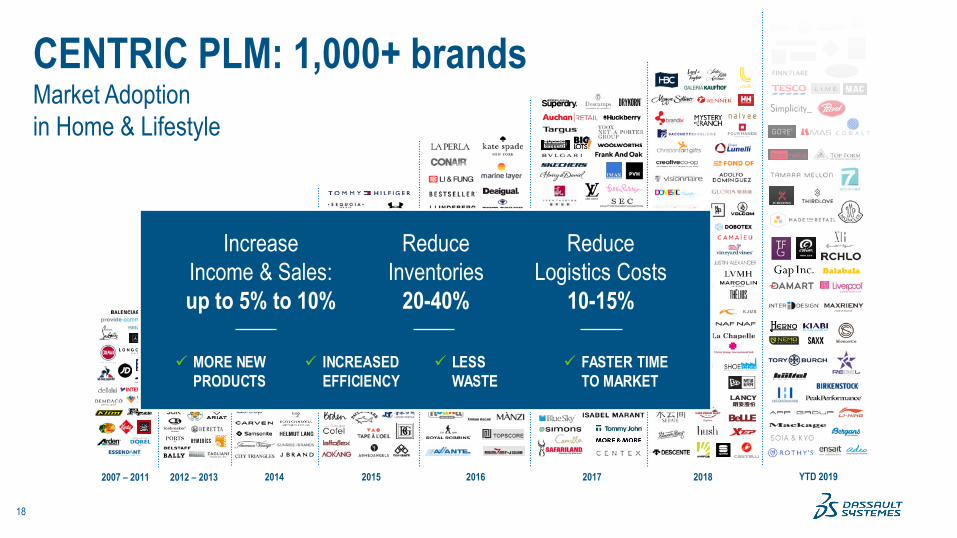
18
2016 20172007 – 2011 20152012 – 2013 2014 2018 YTD 2019
CENTRIC PLM: 1,000+ brandsMarket Adoptionin Home & Lifestyle
MORE NEW PRODUCTS
INCREASED EFFICIENCY
LESSWASTE
FASTER TIME TO MARKET
IncreaseIncome & Sales:up to 5% to 10%
ReduceInventories
20-40%
ReduceLogistics Costs
10-15%
19
The 3DEXPERIENCE Supports our Purpose
Dassault Systèmes provides business & people with 3DEXPERIENCE universes to imagine sustainable innovations capable of harmonizing product, nature and life.
“ “

20
Respect the ArtAchieve total creative flexibilityand win design competitions
Sustainable, Secure and Resilient FutureEstablish a digital referential to enable modeling and using scenario simulation
Create CollectivelyAccess to real-time information
and seamlessly exchange knowledge
Maximize Project
OutcomesDesign more effectively
and efficiently
Modernize CraftsmanshipAllow architecture, engineering and construction
professionals to gain precision and control
Delivering on Construction, Citiesand Territories Challenges
21
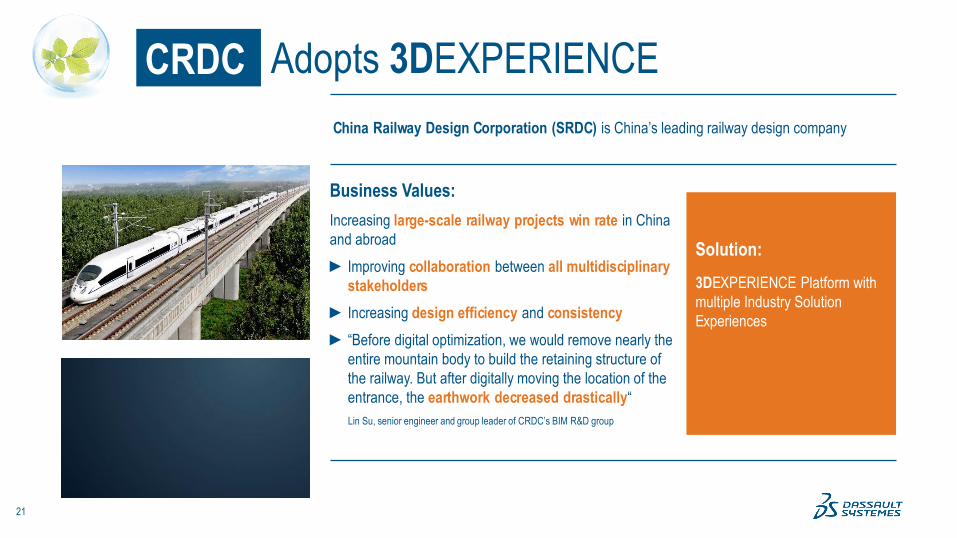
China Railway Design Corporation (SRDC) is China’s leading railway design company
Business Values:
Solution:Increasing large-scale railway projects win rate in China and abroad► Improving collaboration between all multidisciplinary
stakeholders ► Increasing design efficiency and consistency► “Before digital optimization, we would remove nearly the
entire mountain body to build the retaining structure of the railway. But after digitally moving the location of the entrance, the earthwork decreased drastically“ Lin Su, senior engineer and group leader of CRDC’s BIM R&D group
Adopts 3DEXPERIENCE
3DEXPERIENCE Platform with multiple Industry Solution Experiences
CRDC
22
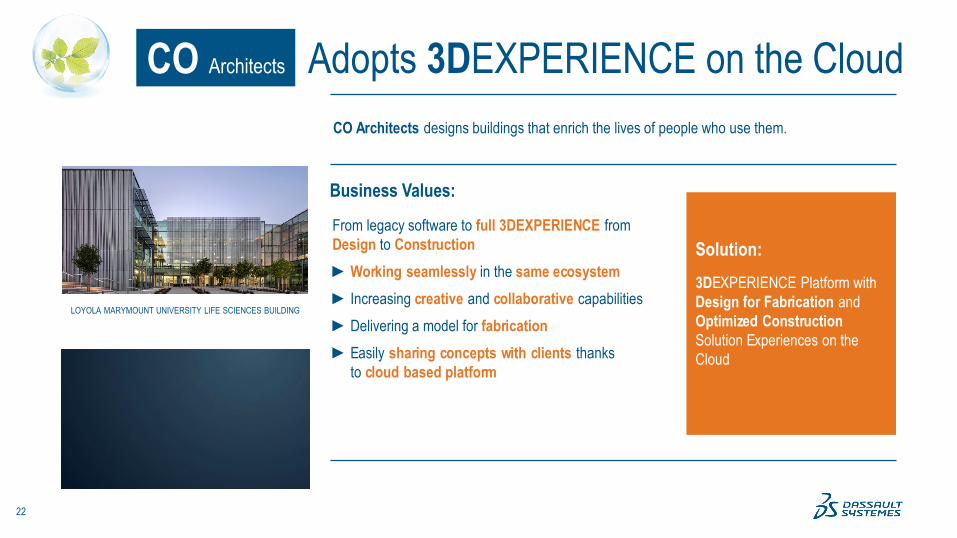
CO Architects designs buildings that enrich the lives of people who use them.
Business Values:
Solution:From legacy software to full 3DEXPERIENCE from Design to Construction►Working seamlessly in the same ecosystem ► Increasing creative and collaborative capabilities ►Delivering a model for fabrication►Easily sharing concepts with clients thanks
to cloud based platform
Adopts 3DEXPERIENCE on the Cloud
3DEXPERIENCE Platform with Design for Fabrication and Optimized Construction Solution Experiences on the Cloud
LOYOLA MARYMOUNT UNIVERSITY LIFE SCIENCES BUILDING
CO Architects

23
The 3DEXPERIENCE Supports our Purpose
Dassault Systèmes provides business & people with 3DEXPERIENCE universes to imagine sustainable innovations capable of harmonizing product, nature and life.
“ “

24
Delivering on Life Sciences Challenges
Reinventing the Value ChainCreate new, connected patient experiences
Personalized HealthDevelop a holistic approach to care that encompasses genomics, behavior andthe environment
Total QualityAchieve regulatory compliance
with exceptional quality standards
Knowledge Capitalization
Connect systems, people and data in
a virtual ecosystem
Development and Manufacturing ExcellenceSmart, predictive and adaptive manufacturing

25
IRBM is Italy’s largest independent partner research organization for drug discovery and preclinical development
Adopts 3DEXPERIENCE
3DEXPERIENCE Platform withOne Lab Design to Cure Industry Solution Experience
Solution:
Business Values:Global solution from research to development including lab informatics, cheminformatics, bioinformatics lab process management, chemical and materials inventory, lab execution, data analytics
► Improving efficiency and speed ►Reducing costs for research and development► Improving quality and compliance►Faster task execution & standardization ►Reducing in-house software development
IRBM

26
GC Pharma headquartered in South Korea; specializes in the development and commercialization of vaccines, protein therapies, and therapeutic antibodies for use in the fields of oncology and infectious disease
Adopts 3DEXPERIENCE
3DEXPERIENCE Platform withOne Lab Design to Cure Industry Solution Experience
Solution:
Business Values:Optimizing resources from research to manufacturing: digitalized laboratory activities, time-line, experiment, lab notebook and resources. Integrating regulatory affairs activity with project information and electronic laboratory notebook► Improving efficiency and speed ►Minimizing time-to-market on a fully digitalized R&D
platform ► Improving quality and compliance► Increasing collaboration & digitalizing throughout
the organization for science and research
GC Pharma

27
Medidata Acquisition Pushing the Bounds of Possibilities in 21st Century Healthcare
Poised to lead the digital transformation of Life Sciences in the ageof precision medicine and patient-centric experience
28
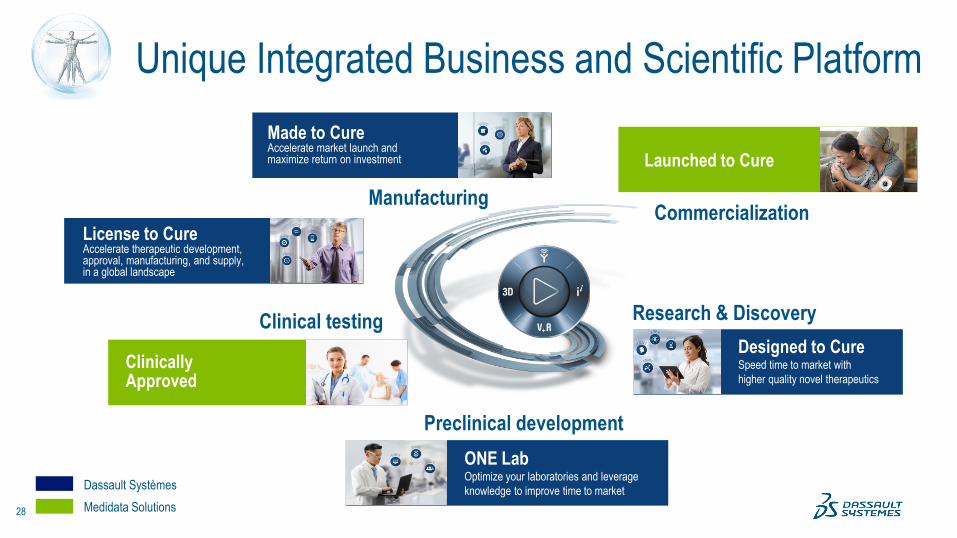
Unique Integrated Business and Scientific Platform
Manufacturing
Clinical testing Research & Discovery
Commercialization
ONE LabOptimize your laboratories and leverage knowledge to improve time to market
Clinically Approved
License to CureAccelerate therapeutic development, approval, manufacturing, and supply, in a global landscape
Made to CureAccelerate market launch and maximize return on investment Launched to Cure
Medidata Solutions Dassault Systèmes
Designed to CureSpeed time to market withhigher quality novel therapeutics
Preclinical development

29
Dassault Systèmes + MedidataMedidatato operate as a 3DS brand
Life SciencesNew Core Industry
DedicatedGo-to-market
To address
4,500 companies in pharma
and 50,000 in medical devices
~20% of combined software revenue*
Powering Smarter Treatmentsand Healthier People
* On an annual basis

30
Strategy at Work
Q3 & YTD 2019 Business Review
Q3 & YTD 2019 Financial Highlights
Q4 & FY 2019 Financial Objectives
Financial Information Appendix
Agenda

31
Q3 & YTD 2019 Performance at a Glance Non-IFRS
€ millions Q3 19 YTD 19Revenue 914 2,843Growth +13% +16%Growth exFX +10% +12%Software Growth exFX +9% +11%
Licenses* Growth exFX +2% +9%Recurring** Growth exFX +12% +12%
Operating Margin 30.3% 31.3%Operating Margin +1.4 pt +1.4 pt
EPS (€) 0.78 2.46EPS Evolution +20% +19%
+19% exFX
Q3 18 Q3 19
24% 27%
Q3 18 Q3 19
33% 40%
+21% exFX
+32% exFX
YTD 18 YTD 19
22% 27%
YTD 18 YTD 19
33% 43%
+40% exFX
3DEXPERIENCE***
Revenue growth % of related revenue
Accelerating recurring revenue growth
* Licenses and other software revenue ** Subscription & Support *** Excluding SOLIDWORKS and acquisitions
Q3 YTD
Softw
are
Licen
ses*
32
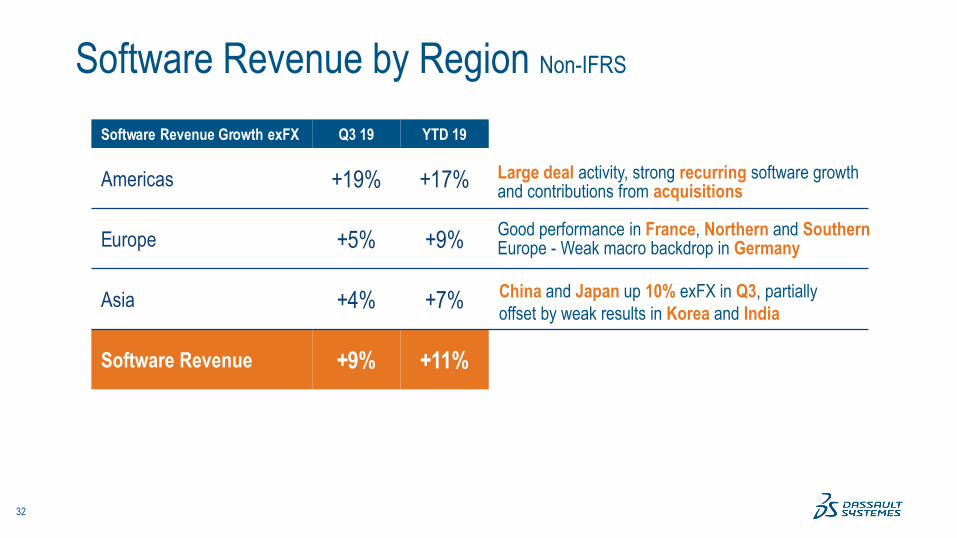
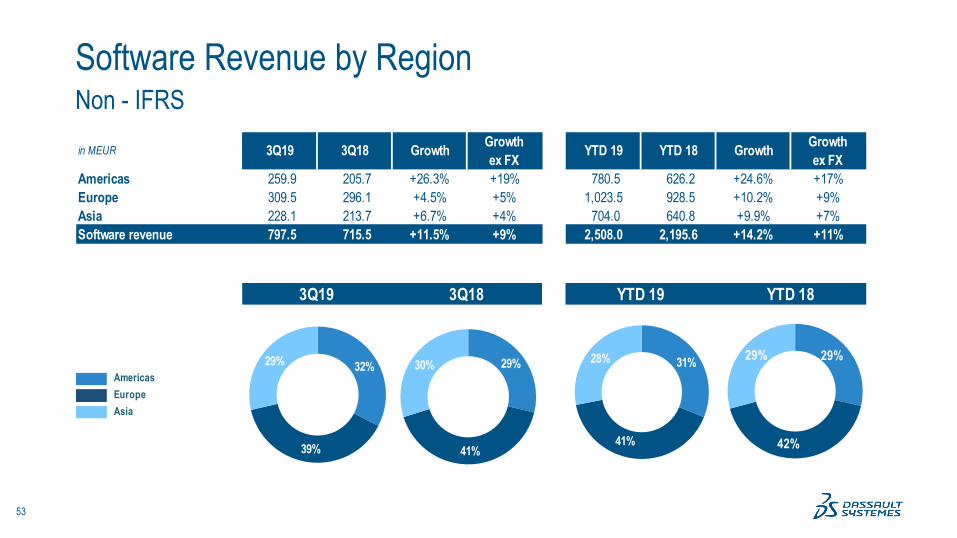
Software Revenue by Region Non-IFRS
Software Revenue Growth exFX Q3 19 YTD 19
Americas +19% +17%
Europe +5% +9%
Asia +4% +7%
Software Revenue +9% +11%
Large deal activity, strong recurring software growth and contributions from acquisitions
Good performance in France, Northern and SouthernEurope - Weak macro backdrop in Germany
China and Japan up 10% exFX in Q3, partially offset by weak results in Korea and India

33
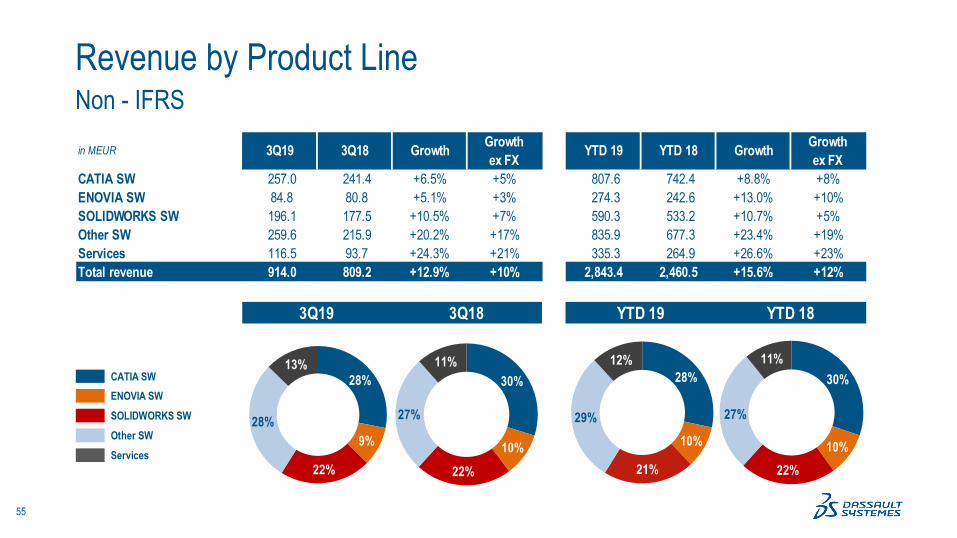
Software Revenue by Brand Non-IFRS
Software Revenue Growth exFX Q3 19 YTD 19
CATIA +5% +8%
ENOVIA +3% +10%
SOLIDWORKS +7% +5%
Other Software +17% +19%
Software Revenue +9% +11%
Limited number of large transactions in Q3
Continued double-digit revenue growth in Asia Improvement in Europe and America
Double-digit organic revenue growth ledby SIMULIA and DELMIA
Sustained growth of automotive OEMs Softening of automotive supply chain in Q3

34
SOLIDWORKS | A Reserve of Potential Growth
Authentic Design ExperienceSOLIDWORKS Addressable Market
40%
22%
38%
#1
1.5million
companies
2D3D

35
SOLIDWORKS 3DEXPERIENCE
1Mcommercial
users
2019
Business Innovation
+
SOLIDWORKS cumulativecommercial seats
Connecting SOLIDWORKS tothe 3DEXPERIENCE Platform
36
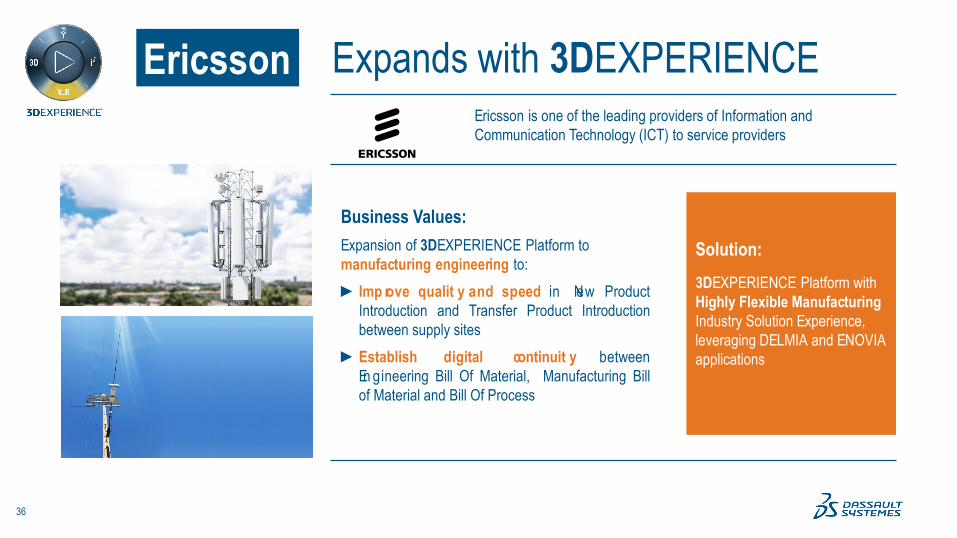
Ericsson is one of the leading providers of Information and Communication Technology (ICT) to service providers
Business Values: Solution:Expansion of 3DEXPERIENCE Platform to manufacturing engineering to:► Imp rove qualit y and speed in New Product
Introduction and Transfer Product Introductionbetween supply sites
►Establish digital continuit y betweenEn gineering Bill Of Material, Manufacturing Billof Material and Bill Of Process
3DEXPERIENCE Platform with Highly Flexible Manufacturing Industry Solution Experience, based on DELMIA and ENOVIA applications
Ericsson Expands with 3DEXPERIENCE
3DEXPERIENCE Platform with Highly Flexible Manufacturing Industry Solution Experience, leveraging DELMIA and ENOVIA applications
Solution:

37
Strategy at Work
Q3 & YTD 2019 Business Review
Q3 & YTD 2019 Financial Highlights
Q4 & FY 2019 Financial Objectives
Financial Information Appendix
Agenda

38
Total Revenue Software Revenue
Revenue Growth Non-IFRS
Organic revenue +8% exFX in Q3 and +9% in YTD Organic software revenue +7% exFX in Q3 and +8% in YTD
in MEUR in MEUR
YTD 18
2,460.52,843.4
+15.6%+12% ex FX
809.2 914.0
+12.9%+10% ex FX
3Q 18YTD 19 3Q 19 YTD 18
2,195.62,508.0
+14.2%+11% ex FX
715.5 797.5
+11.5%+9% ex FX
3Q 18YTD 19 3Q 19
39
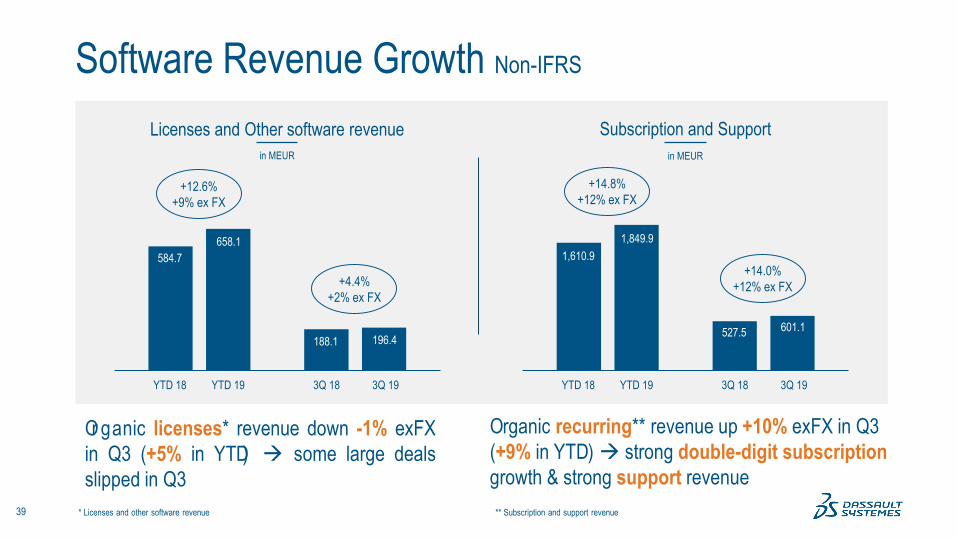
Software Revenue Growth Non-IFRS
Licenses and Other software revenue Subscription and Support in MEUR in MEUR
Or ganic licenses* revenue down -1% exFXin Q3 (+5% in YTD) some large dealsslipped in Q3
YTD 18
584.7658.1
+12.6%+9% ex FX
188.1 196.4
+4.4%+2% ex FX
3Q 18YTD 19 3Q 19 YTD 18
1,610.91,849.9
+14.8%+12% ex FX
527.5 601.1
+14.0%+12% ex FX
3Q 18YTD 19 3Q 19
Organic recurring** revenue up +10% exFX in Q3 (+9% in YTD) strong double-digit subscriptiongrowth & strong support revenue
* Licenses and other software revenue ** Subscription and support revenue

40
Services Revenue & Margin Evolution Non-IFRS
Organic services revenue up +16% exFX in Q3 and +14% in YTD
Serv. Gross Margin 7.0%
Services Revenuein MEUR
YTD 18
264.9
335.3
+26.6%+23% ex FX
93.7 116.5
+24.3%+21% ex FX
3Q 18YTD 19 3Q 19
9.0% 7.8% 13.5%

41
Operating Margin Evolution Non-IFRS
* bps: basis points
YTD 18 Margin Currencies Activity Acquisitions YTD 19 Margin
29.9% 31.3%
-100 bps*
200 bps*
40 bps*
42
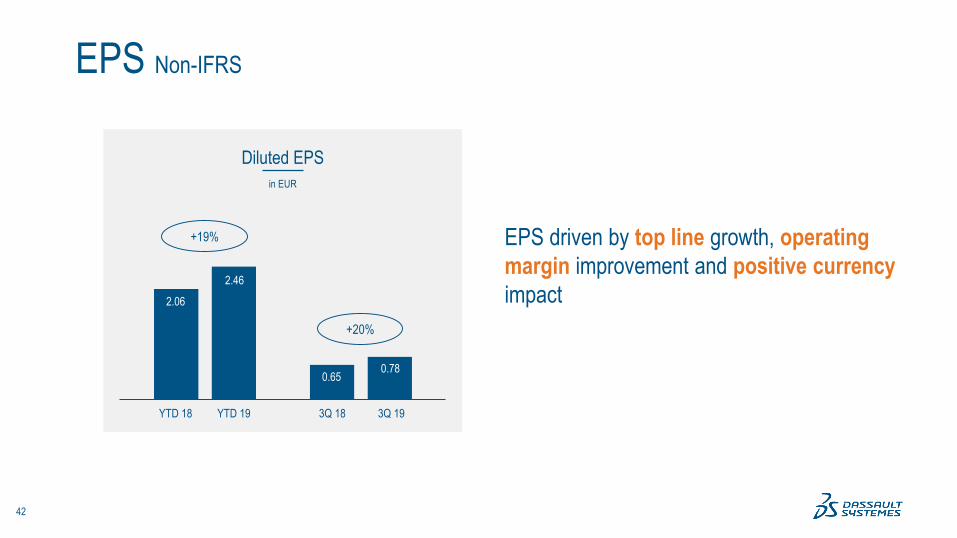
EPS Non-IFRS
EPS driven by top line growth, operating margin improvement and positive currency impact
Diluted EPSin EUR
YTD 18
2.06
2.46
+19%
0.650.78
+20%
3Q 18YTD 19 3Q 19
43
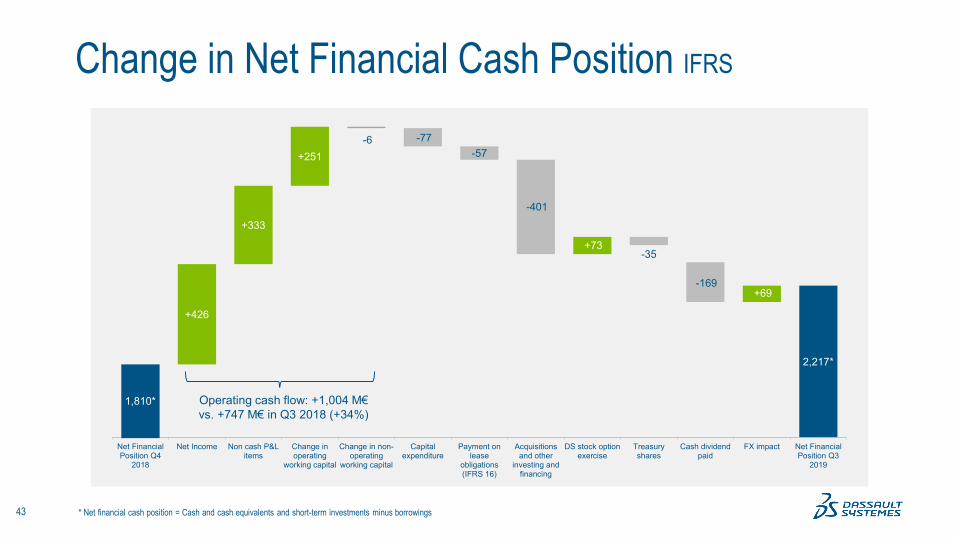
Change in Net Financial Cash Position IFRS
* Net financial cash position = Cash and cash equivalents and short-term investments minus borrowings
2,217*
1,810*
+426
+333
+251-6 -77
-57
-401
+73-35
-169+69
Net FinancialPosition Q4
2018
Net Income Non cash P&Litems
Change inoperating
working capital
Change in non-operating
working capital
Capitalexpenditure
Payment onlease
obligations(IFRS 16)
Acquisitionsand other
investing andfinancing
DS stock optionexercise
Treasuryshares
Cash dividendpaid
FX impact Net FinancialPosition Q3
2019
Operating cash flow: +1,004 M€vs. +747 M€ in Q3 2018 (+34%)

44
Operating Cash Flow Evolution IFRS
€ million YTD 19 YTD 18 ChangesOperating Cash Flow +1,004 +747 +257 Up 34% year on year
Net income adjusted for non cash items +759 +597 +162
Decrease in trade accounts receivableand contract assets +339 +269 +70 Balance up 12% exFX at constant perimeter
Increase in contract liability * -40 - -40 Balance up 7% exFX at constant perimeter
Decrease in accrued compensation -45 -21 -24
Increase (decrease) in accounts payable -4 -15 +11
Increase (decrease) in income taxes payable +38 -48 +86 Activity growth, lower taxable income in 2018and lower tax downpayments in 2019**
Other -43 -35 -8
* Previously named unearned revenue ** Due to 2018 FDII (foreign driven intangible income) revised estimation in the US
45
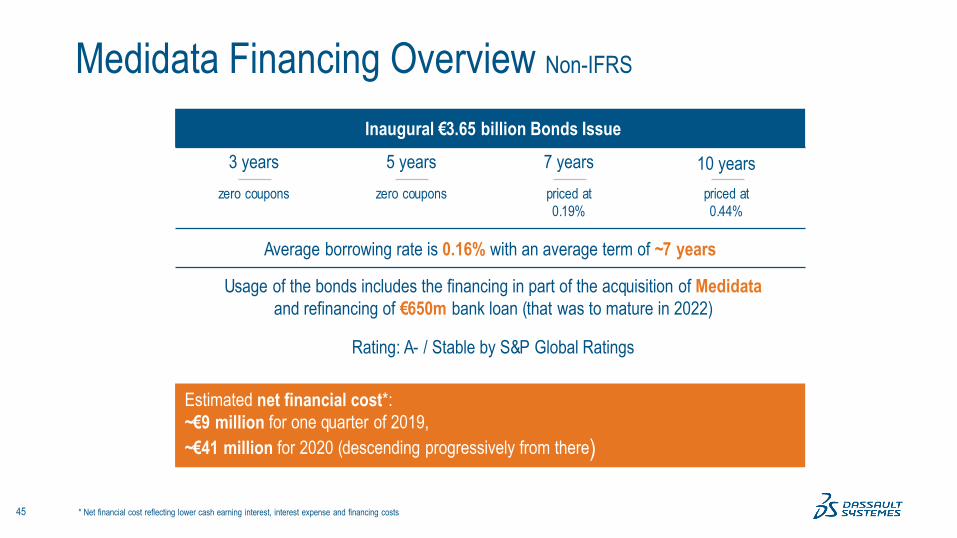
Medidata Financing Overview Non-IFRS
Inaugural €3.65 billion Bonds Issue3 years 5 years 7 years 10 years
zero coupons zero coupons priced at0.19%
priced at0.44%
Average borrowing rate is 0.16% with an average term of ~7 years
Usage of the bonds includes the financing in part of the acquisition of Medidataand refinancing of €650m bank loan (that was to mature in 2022)
Rating: A- / Stable by S&P Global Ratings
Estimated net financial cost*: ~€9 million for one quarter of 2019, ~€41 million for 2020 (descending progressively from there)
* Net financial cost reflecting lower cash earning interest, interest expense and financing costs

46
Strategy at Work
Q3 & YTD 2019 Business Review
Q3 & YTD 2019 Financial Highlights
Q4 & FY 2019 Financial Objectives
Financial Information Appendix
Agenda

47
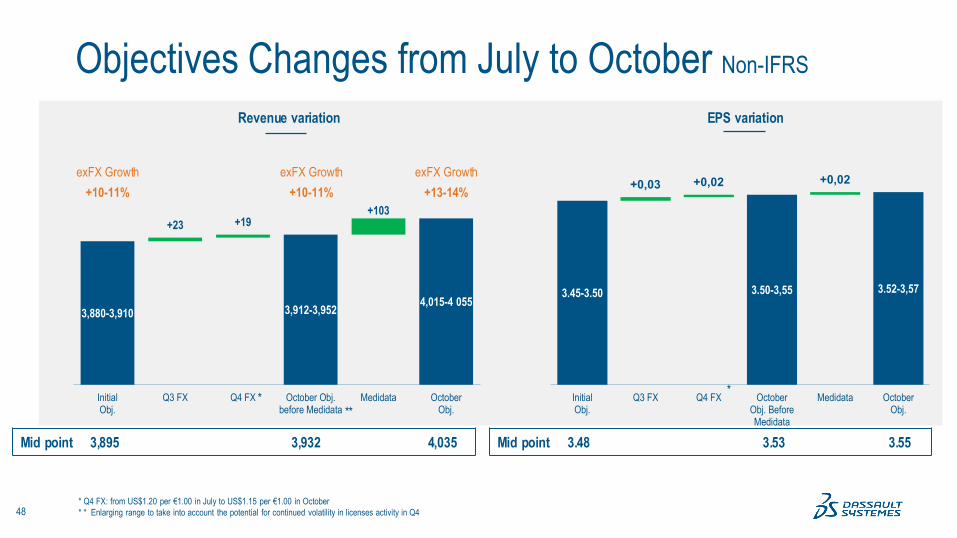
Objectives Changes from July to October Non-IFRS
►Before adding Medidata, reaffirming FY 19 revenue growth objectiveof 10%-11% exFX
►Updating for currenciesQ3: from US$1.15 per €1.00 in July guidance to US$1.11 per €1.00 in actual Q3Q4: from US$1.20 per €1.00 in July guidance to US$1.15 per €1.00 in October guidance
►Adding MedidataAssuming closing on October 31, 2019 with a two-month contribution
48
Objectives Changes from July to October Non-IFRS
Revenue variation EPS variation
* Q4 FX: from US$1.20 per €1.00 in July to US$1.15 per €1.00 in October* * Enlarging range to take into account the potential for continued volatility in licenses activity in Q4
Mid point 3,895 3,932 4,035
3,880-3,910 3,912-3,952 4,015-4 055
+23 +19+103
InitialObj.
Q3 FX Q4 FX October Obj.before Medidata
Medidata OctoberObj.
+10-11% +13-14%exFX Growth exFX Growth
+10-11%exFX Growth
3.45-3.50 3.50-3,55 3.52-3,57
+0,03 +0,02 +0,02
InitialObj.
Q3 FX Q4 FX OctoberObj. BeforeMedidata
Medidata OctoberObj.
Mid point 3.48 3.53 3.55
* ***
49
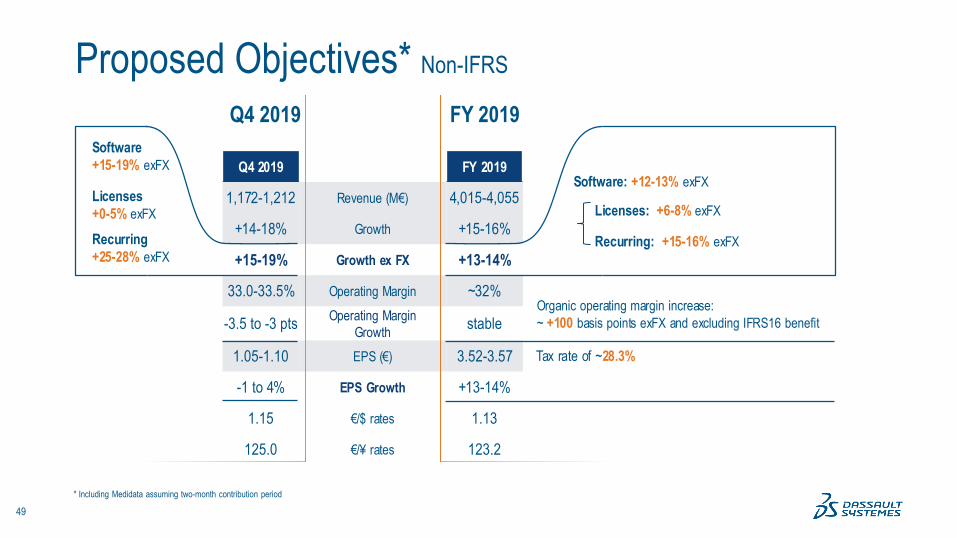
Proposed Objectives* Non-IFRS
Licenses+0-5% exFX
Recurring+25-28% exFX
Software+15-19% exFX Q4 2019 FY 2019
1,172-1,212 Revenue (M€) 4,015-4,055
+14-18% Growth +15-16%
+15-19% Growth ex FX +13-14%
33.0-33.5% Operating Margin ~32%
-3.5 to -3 pts Operating Margin Growth stable
1.05-1.10 EPS (€) 3.52-3.57
-1 to 4% EPS Growth +13-14%
1.15 €/$ rates 1.13
125.0 €/¥ rates 123.2
Tax rate of ~28.3%
Licenses: +6-8% exFX
Recurring: +15-16% exFX
Software: +12-13% exFX
Organic operating margin increase: ~ +100 basis points exFX and excluding IFRS16 benefit
FY 2019Q4 2019
* Including Medidata assuming two-month contribution period

50
Nov. 13, 2019New York

51
Strategy at Work
Q3 & YTD 2019 Business Review
Q3 & YTD 2019 Financial Highlights
Q4 & FY 2019 Financial Objectives
Financial Information Appendix
Agenda
52
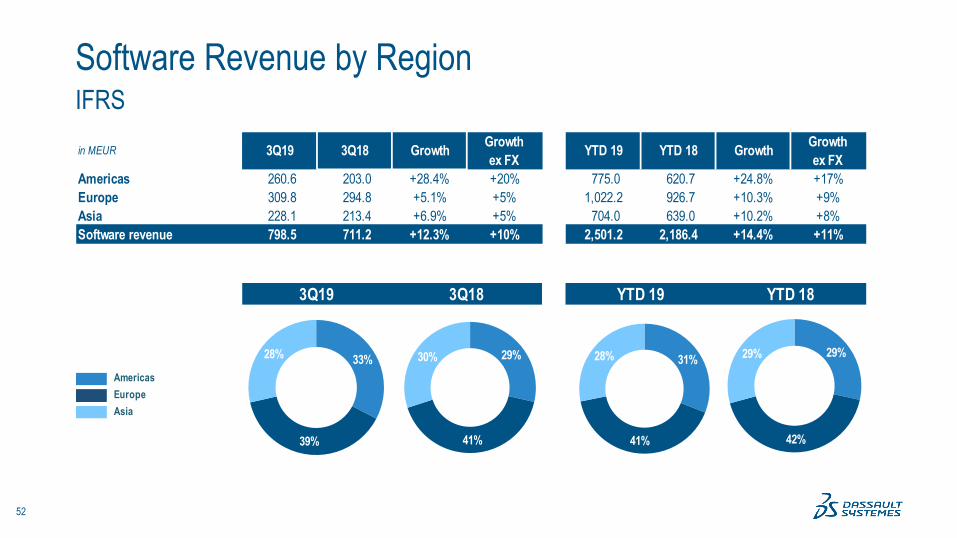
IFRS Software Revenue by Region
AmericasEuropeAsia
in MEUR 3Q19 3Q18 Growth Growthex FX YTD 19 YTD 18 Growth Growth
ex FXAmericas 260.6 203.0 +28.4% +20% 775.0 620.7 +24.8% +17%Europe 309.8 294.8 +5.1% +5% 1,022.2 926.7 +10.3% +9%Asia 228.1 213.4 +6.9% +5% 704.0 639.0 +10.2% +8%Software revenue 798.5 711.2 +12.3% +10% 2,501.2 2,186.4 +14.4% +11%
3Q19 3Q18 YTD 19 YTD 18
31%
41%
28% 29%
42%
29%33%
39%
28% 29%
41%
30%
53
Non - IFRS Software Revenue by Region
AmericasEuropeAsia
in MEUR 3Q19 3Q18 Growth Growthex FX YTD 19 YTD 18 Growth Growth
ex FXAmericas 259.9 205.7 +26.3% +19% 780.5 626.2 +24.6% +17%Europe 309.5 296.1 +4.5% +5% 1,023.5 928.5 +10.2% +9%Asia 228.1 213.7 +6.7% +4% 704.0 640.8 +9.9% +7%Software revenue 797.5 715.5 +11.5% +9% 2,508.0 2,195.6 +14.2% +11%
3Q19 3Q18 YTD 19 YTD 18
31%
41%
28% 29%
42%
29%32%
39%
29% 29%
41%
30%
54
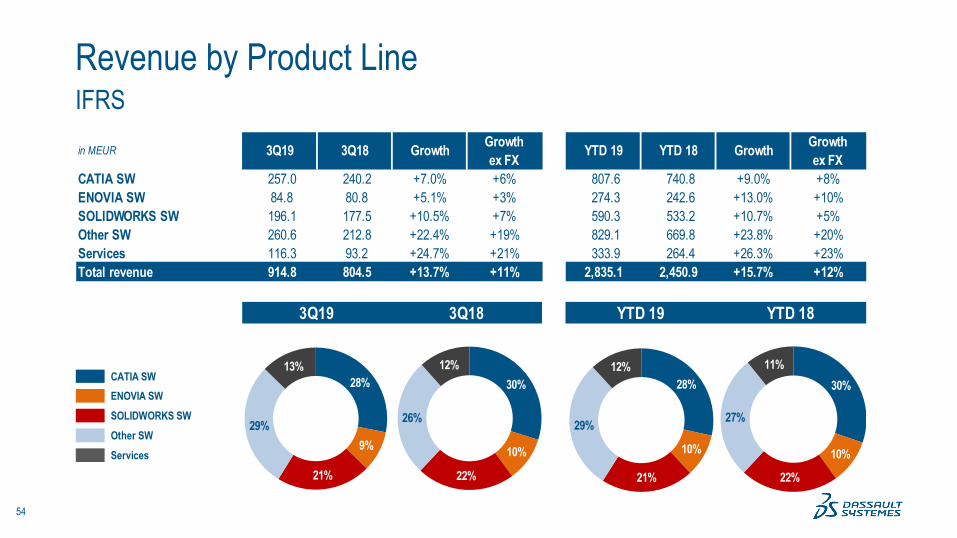
IFRS Revenue by Product Line
CATIA SW ENOVIA SW SOLIDWORKS SW Other SW Services
in MEUR 3Q19 3Q18 Growth Growthex FX YTD 19 YTD 18 Growth Growth
ex FXCATIA SW 257.0 240.2 +7.0% +6% 807.6 740.8 +9.0% +8%ENOVIA SW 84.8 80.8 +5.1% +3% 274.3 242.6 +13.0% +10%SOLIDWORKS SW 196.1 177.5 +10.5% +7% 590.3 533.2 +10.7% +5%Other SW 260.6 212.8 +22.4% +19% 829.1 669.8 +23.8% +20%Services 116.3 93.2 +24.7% +21% 333.9 264.4 +26.3% +23%Total revenue 914.8 804.5 +13.7% +11% 2,835.1 2,450.9 +15.7% +12%
3Q19 3Q18 YTD 19 YTD 18
28%
10%
21%
29%
12%30%
10%
22%
27%
11%28%
9%
21%
29%
13%30%
10%
22%
26%
12%
55
Non - IFRS Revenue by Product Line
CATIA SW ENOVIA SW SOLIDWORKS SW Other SW Services
in MEUR 3Q19 3Q18 Growth Growthex FX YTD 19 YTD 18 Growth Growth
ex FXCATIA SW 257.0 241.4 +6.5% +5% 807.6 742.4 +8.8% +8%ENOVIA SW 84.8 80.8 +5.1% +3% 274.3 242.6 +13.0% +10%SOLIDWORKS SW 196.1 177.5 +10.5% +7% 590.3 533.2 +10.7% +5%Other SW 259.6 215.9 +20.2% +17% 835.9 677.3 +23.4% +19%Services 116.5 93.7 +24.3% +21% 335.3 264.9 +26.6% +23%Total revenue 914.0 809.2 +12.9% +10% 2,843.4 2,460.5 +15.6% +12%
3Q19 3Q18 YTD 19 YTD 18
28%
9%
22%
28%
13%28%
10%
21%
29%
12%30%
10%22%
27%
11%30%
10%22%
27%
11%
56
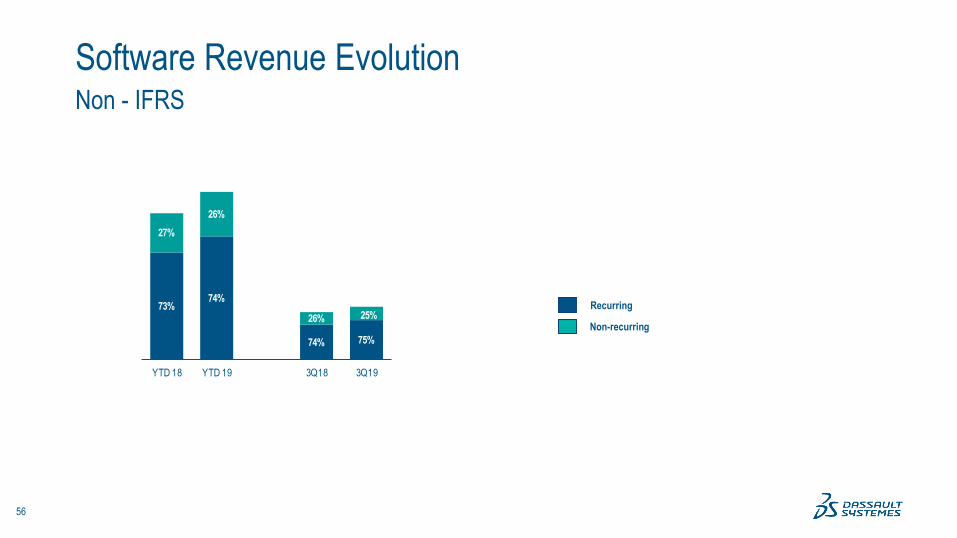
Non - IFRS Software Revenue Evolution
Recurring
Non-recurring
73%74%
74% 75%
27%26%
26% 25%
YTD 18 YTD 19 3Q18 3Q19

57
IFRS P<hree months ended September 30, Nine months ended September 30,
(In millions of €, except per share data) 2019 2018 YoY 2019 2018 YoY
Software revenue 798.5 711.2 +12.3% 2,501.2 2,186.4 +14.4%Licenses and Other software revenue 196.4 188.1 +4.4% 658.1 584.7 +12.6%Subscription and Support revenue 602.1 523.2 +15.1% 1,843.1 1,601.8 +15.1%
Services revenue 116.3 93.2 +24.7% 333.9 264.4 +26.3%Total revenue 914.8 804.5 +13.7% 2,835.1 2,450.9 +15.7%
Cost of Software revenue (42.2) (39.0) +8.1% (131.9) (118.0) +11.8%Cost of Services revenue (101.3) (87.2) +16.2% (307.6) (248.4) +23.9%Research and development (170.5) (153.8) +10.9% (527.7) (467.8) +12.8%Marketing and sales (283.8) (256.5) +10.6% (875.5) (772.3) +13.4%General and administrative (69.2) (70.1) (1.2)% (221.5) (209.6) +5.7%Amortization of acquired intangibles (51.1) (43.8) +16.7% (152.2) (126.3) +20.5%Other operating income and expense, net (4.4) (2.2) +94.8% (28.4) (9.1) N/A
Total operating expenses (722.5) (652.6) +10.7% (2,244.8) (1,951.6) +15.0%
Operating income 192.3 151.9 +26.6% 590.3 499.3 +18.2%Financial revenue and other, net 1.4 3.5 (59.1)% 6.7 12.6 (46.5)%Income tax expense (56.8) (45.1) +26.0% (170.8) (136.6) +25.1%Non-controlling interest 0.5 2.7 (79.7)% 6.2 3.1 +99.6%Net Income (to equity holders of the parent) 137.4 112.9 +21.7% 432.3 378.4 +14.2%
Diluted net income per share (EPS) 0.53 0.43 +23.3% 1.66 1.45 +14.5%Average diluted shares (Million) 261.1 260.8 260.9 260.1

58
IFRS P&L (%)Three months ended September 30, Nine months ended September 30,
2019 2018 2019 2018% of revenue % of revenue
Software revenue 87.3% 88.4% 88.2% 89.2%Licenses and Other software revenue 21.5% 23.4% 23.2% 23.9%Subscription and Support revenue 65.8% 65.0% 65.0% 65.4%
Services revenue 12.7% 11.6% 11.8% 10.8%Total revenue 100.0% 100.0% 100.0% 100.0%
Cost of Software revenue 4.6% 4.8% 4.7% 4.8%Cost of Services revenue 11.1% 10.8% 10.9% 10.1%Research and development 18.6% 19.1% 18.6% 19.1%Marketing and sales 31.0% 31.9% 30.9% 31.5%General and administrative 7.6% 8.7% 7.8% 8.6%Amortization of acquired intangibles 5.6% 5.4% 5.4% 5.2%Other operating income and expense, net 0.5% 0.3% 1.0% 0.4%
Total operating expenses 79.0% 81.1% 79.2% 79.6%
Operating income 21.0% 18.9% 20.8% 20.4%Financial revenue and other, net 0.2% 0.4% 0.2% 0.5%Income tax rate (% of EBIT) 29.3% 29.1% 28.6% 26.7%Non-controlling interest 0.1% 0.3% 0.2% 0.1%Net Income (to equity holders of the parent) 15.0% 14.0% 15.2% 15.4%

59
Non-IFRS P<hree months ended September 30, Nine months ended September 30,
(In millions of €, except per share data) 2019 2018 YoY 2019 2018 YoY
Software revenue 797.5 715.5 +11.5% 2,508.0 2,195.6 +14.2%Licenses and Other software revenue 196.4 188.1 +4.4% 658.1 584.7 +12.6%Subscription and Support revenue 601.1 527.5 +14.0% 1,849.9 1,610.9 +14.8%
Services revenue 116.5 93.7 +24.3% 335.3 264.9 +26.6%Total revenue 914.0 809.2 +12.9% 2,843.4 2,460.5 +15.6%
Cost of Software revenue (41.3) (38.4) +7.4% (129.5) (116.5) +11.1%Cost of Services revenue (100.7) (86.4) +16.5% (305.0) (246.5) +23.8%Research and development (157.3) (141.8) +10.9% (479.6) (432.7) +10.8%Marketing and sales (273.9) (248.1) +10.4% (842.5) (750.0) +12.3%General and administrative (63.9) (60.3) +5.8% (197.2) (178.8) +10.3%
Total operating expenses (637.0) (575.1) +10.8% (1,953.8) (1,724.5) +13.3%
Operating income 276.9 234.2 +18.3% 889.6 736.0 +20.9%Financial revenue and other, net 2.3 2.2 +6.5% 6.5 12.4 (48.1)%Income tax expense (76.2) (68.9) +10.7% (254.7) (213.8) +19.2%Non-controlling interest (0.5) 1.3 N/S 1.7 1.7 +0.6%Net Income (to equity holders of the parent) 202.5 168.7 +20.0% 643.0 536.3 +19.9%
Diluted net income per share (EPS) 0.78 0.65 +20.0% 2.46 2.06 +19.4%Average diluted shares (Million) 261.1 260.8 260.9 260.1

60
Non-IFRS P&L (%)Three months ended September 30, Nine months ended September 30,
2019 2018 2019 2018
Software revenue 87.3% 88.4% 88.2% 89.2%Licenses and Other software revenue 21.5% 23.2% 23.1% 23.8%Subscription and Support revenue 65.8% 65.2% 65.1% 65.5%
Services revenue 12.7% 11.6% 11.8% 10.8%Total revenue 100.0% 100.0% 100.0% 100.0%
Cost of Software revenue 4.5% 4.7% 4.6% 4.7%Cost of Services revenue 11.0% 10.7% 10.7% 10.0%Research and development 17.2% 17.5% 16.9% 17.6%Marketing and sales 30.0% 30.7% 29.6% 30.5%General and administrative 7.0% 7.5% 6.9% 7.3%
Total operating expenses 69.7% 71.1% 68.7% 70.1%
Operating income 30.3% 28.9% 31.3% 29.9%Financial revenue and other, net 0.3% 0.3% 0.2% 0.5%Income tax rate (% of EBIT) 27.3% 29.1% 28.4% 28.6%Non-controlling interest (0.1)% 0.2% 0.1% 0.1%Net Income (to equity holders of the parent) 22.2% 20.9% 22.6% 21.8%

61
Revenue and Gross MarginIFRS – Non-IFRS Reconciliation QTD
* No amortization of acquired intangibles is included in Software Gross margin calculation
(€ million, except % and per share data) 2019 IFRS Adjustment 2019
Non-IFRS2018 IFRS Adjustment 2018
Non-IFRS IFRS Non-IFRS
Total Revenue 914.8 ( 0.8) 914.0 804.5 4.8 809.2 +13.7% +12.9%Total Revenue breakdown by activitySoftware revenue 798.5 ( 1.0) 797.5 711.2 4.3 715.5 +12.3% +11.5%
Licenses and Other software revenue 196.4 196.4 188.1 188.1 +4.4% +4.4%Subscription and Support revenue 602.1 ( 1.0) 601.1 523.2 4.3 527.5 +15.1% +14.0%
Recurring portion of Software revenue 75% 75% 74% 74%Services revenue 116.3 0.2 116.5 93.2 0.5 93.7 +24.7% +24.3%Total Revenue breakdown by product lineCATIA SW revenue 257.0 257.0 240.2 1.2 241.4 +7.0% +6.5%ENOVIA SW revenue 84.8 84.8 80.8 80.8 +5.1% +5.1%SOLIDWORKS SW revenue 196.1 196.1 177.5 177.5 +10.5% +10.5%Other SW revenue 260.6 ( 1.0) 259.6 212.8 3.0 215.9 +22.4% +20.2%Services revenue 116.3 0.2 116.5 93.2 0.5 93.7 +24.7% +24.3%Total Revenue breakdown by geographyAmericas revenue 306.7 ( 0.6) 306.1 241.0 2.9 243.9 +27.3% +25.5%Europe revenue 360.8 ( 0.2) 360.6 333.3 1.6 334.9 +8.2% +7.7%Asia revenue 247.3 247.3 230.2 0.3 230.5 +7.4% +7.3%Gross MarginCost of Software revenue ( 42.2) 0.9 ( 41.3) ( 39.0) 0.6 ( 38.4) +8.1% +7.4%Software Gross margin* 94.7% 94.8% 94.5% 94.6%Cost of Services revenue ( 101.3) 0.6 ( 100.7) ( 87.2) 0.7 ( 86.4) +16.2% +16.5%Services Gross margin 12.9% 13.5% 6.5% 7.8%
Three months ended September 30, Increase (Decrease)

62
Expenses & Earnings IFRS – Non-IFRS Reconciliation QTD
(€ million, except % and per share data)2019 IFRS Adjustment 2019
Non-IFRS2018 IFRS Adjustment 2018
Non-IFRS IFRS Non-IFRS
Total Operating Expenses ( 722.5) 85.5 ( 637.0) ( 652.6) 77.5 ( 575.1) 10.7% 10.8%Share-based compensation expense ( 30.0) 30.0 - ( 31.5) 31.5 -Amortization of acquired intangibles ( 51.1) 51.1 - ( 43.8) 43.8 -Other operating income and expense, net ( 4.4) 4.4 - ( 2.2) 2.2 -Operating Income 192.3 84.6 276.9 151.9 82.3 234.2 26.6% 18.3%Operating Margin 21.0% 30.3% 18.9% 28.9%Financial revenue & other, net 1.4 0.9 2.3 3.5 ( 1.3) 2.2 (59.1)% 6.5%Income tax expense ( 56.8) ( 19.4) ( 76.2) ( 45.1) ( 23.7) ( 68.9) +26.0% 10.7%Non-controlling interest 0.5 ( 1.1) ( 0.5) 2.7 ( 1.4) 1.3 (79.7)% (143.0)%Net Income attributable to shareholders 137.4 65.1 202.5 112.9 55.8 168.7 21.7% 20.0%Diluted net income per share, in EUR 0.53 0.25 0.78 0.43 0.22 0.65 23.3% 20.0%
(€ million) 2019 IFRS Adjust. 2019
Non-IFRS2018 IFRS Adjust. 2018
Non-IFRS
Cost of revenue ( 143.5) 1.5 ( 142.0) ( 126.2) 1.3 ( 124.9)Research and development ( 170.5) 13.2 ( 157.3) ( 153.8) 12.0 ( 141.8)Marketing and sales ( 283.8) 9.9 ( 273.9) ( 256.5) 8.4 ( 248.1)General and administrative ( 69.2) 5.3 ( 63.9) ( 70.1) 9.7 ( 60.3)Total Share-based compensation expense 30.0 31.5
Three months ended September 30,
Three months ended September 30, Increase (Decrease)
63
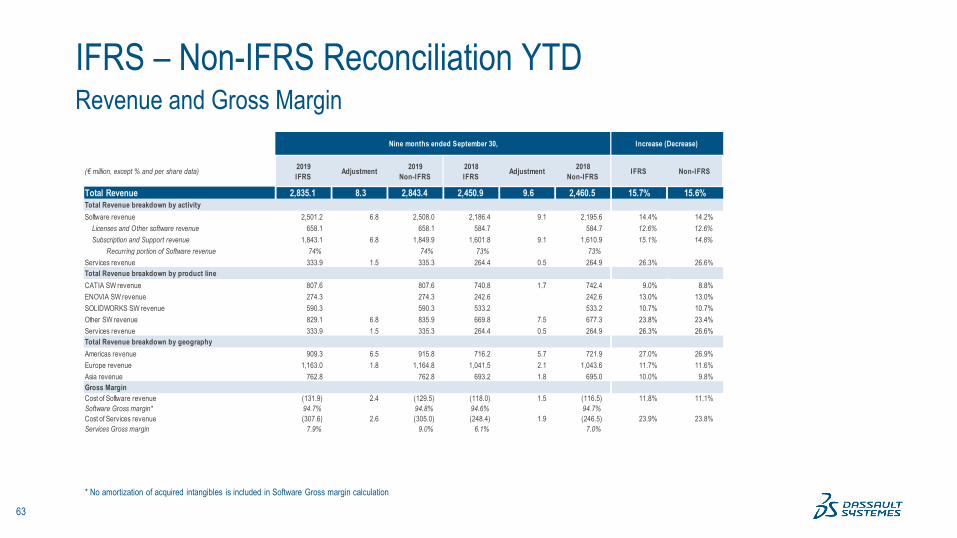
Revenue and Gross MarginIFRS – Non-IFRS Reconciliation YTD
* No amortization of acquired intangibles is included in Software Gross margin calculation
(€ million, except % and per share data) 2019 IFRS Adjustment 2019
Non-IFRS2018 IFRS Adjustment 2018
Non-IFRS IFRS Non-IFRS
Total Revenue 2,835.1 8.3 2,843.4 2,450.9 9.6 2,460.5 15.7% 15.6%Total Revenue breakdown by activitySoftware revenue 2,501.2 6.8 2,508.0 2,186.4 9.1 2,195.6 14.4% 14.2%
Licenses and Other software revenue 658.1 658.1 584.7 584.7 12.6% 12.6%Subscription and Support revenue 1,843.1 6.8 1,849.9 1,601.8 9.1 1,610.9 15.1% 14.8%
Recurring portion of Software revenue 74% 74% 73% 73%Services revenue 333.9 1.5 335.3 264.4 0.5 264.9 26.3% 26.6%Total Revenue breakdown by product lineCATIA SW revenue 807.6 807.6 740.8 1.7 742.4 9.0% 8.8%ENOVIA SW revenue 274.3 274.3 242.6 242.6 13.0% 13.0%SOLIDWORKS SW revenue 590.3 590.3 533.2 533.2 10.7% 10.7%Other SW revenue 829.1 6.8 835.9 669.8 7.5 677.3 23.8% 23.4%Services revenue 333.9 1.5 335.3 264.4 0.5 264.9 26.3% 26.6%Total Revenue breakdown by geographyAmericas revenue 909.3 6.5 915.8 716.2 5.7 721.9 27.0% 26.9%Europe revenue 1,163.0 1.8 1,164.8 1,041.5 2.1 1,043.6 11.7% 11.6%Asia revenue 762.8 762.8 693.2 1.8 695.0 10.0% 9.8%Gross MarginCost of Software revenue (131.9) 2.4 (129.5) (118.0) 1.5 (116.5) 11.8% 11.1%Software Gross margin* 94.7% 94.8% 94.6% 94.7%Cost of Services revenue (307.6) 2.6 (305.0) (248.4) 1.9 (246.5) 23.9% 23.8%Services Gross margin 7.9% 9.0% 6.1% 7.0%
Nine months ended September 30, Increase (Decrease)

64
Expenses & Earnings IFRS – Non-IFRS Reconciliation YTD
(€ million, except % and per share data)2019 IFRS Adjustment 2019
Non-IFRS2018 IFRS Adjustment 2018
Non-IFRS IFRS Non-IFRS
Total Operating Expenses (2,244.8) 291.1 (1,953.8) (1,951.6) 227.0 (1,724.5) 15.0% 13.3%Share-based compensation expense ( 110.5) 110.5 - ( 91.6) 91.6 -Amortization of acquired intangibles ( 152.2) 152.2 - ( 126.3) 126.3 -Other operating income and expense, net ( 28.4) 28.4 - ( 9.1) 9.1 -Operating Income 590.3 299.3 889.6 499.3 236.7 736.0 18.2% 20.9%Operating Margin 20.8% 31.3% 20.4% 29.9%Financial revenue & other, net 6.7 ( 0.3) 6.5 12.6 ( 0.2) 12.4 (46.5)% (48.1)%Income tax expense ( 170.8) ( 83.9) ( 254.7) ( 136.6) ( 77.2) ( 213.8) +25.1% +19.2%Non-controlling interest 6.2 ( 4.5) 1.7 3.1 ( 1.4) 1.7 +99.6% +0.6%Net Income attributable to shareholders 432.3 210.7 643.0 378.4 157.9 536.3 14.2% 19.9%Diluted net income per share, in EUR 1.66 0.80 2.46 1.45 0.61 2.06 14.5% 19.4%
(€ million) 2019 IFRS Adjust. 2019
Non-IFRS2018 IFRS Adjust. 2018
Non-IFRS
Cost of revenue ( 439.6) 5.0 ( 434.5) ( 366.4) 3.4 ( 363.0)Research and development ( 527.7) 48.1 ( 479.6) ( 467.8) 35.1 ( 432.7)Marketing and sales ( 875.5) 33.0 ( 842.5) ( 772.3) 22.3 ( 750.0)General and administrative ( 221.5) 24.4 ( 197.2) ( 209.6) 30.9 ( 178.8)Total Share-based compensation expense 110.5 91.6
Nine months ended September 30,
Nine months ended September 30, Increase (Decrease)

65
Non - IFRS Financial Revenue and Other
MEUR 3Q19 3Q18 var YTD 19 YTD 18 var
Interest Income 10.2 9.9 0.3 27.9 26.9 0.9Interest Expense (6.5) (3.5) (3.0) (19.7) (11.2) (8.4)Financial net Income 3.7 6.4 (2.7) 8.2 15.7 (7.5)
Exchange Gain / (Loss) (1.6) (4.4) 2.8 (1.8) (4.3) 2.4Other Income / (Loss) 0.2 0.1 0.1 0.1 1.0 (0.9)
Total 2.3 2.2 0.1 6.5 12.4 (6.0)

66
From assumptions to actual dataExchange Rate evolution
Revenue 2018 2019 % change
EUR/USD 1.16 1.11 -4%EUR/JPY 129.60 119.32 -8%EUR/USD 1.19 1.12 -6%EUR/JPY 130.90 122.57 -6%
3Q183Q18 3Q19 3Q19
1.16 1.11 129.60 119.32
in average in average in average in average
Breakdown of P&L by currency for YTD 19
QTD
Average Exchange rates
YTD
39.5%
12.1%
Operating Expenses
36.8%
4.4%
USD
JPY
Average EUR/¥ rate 1.16 -> 1.11 129.60 -> 119.32
EUR/¥ – 3Q19/3Q18 Variance
Average EUR/$ rate
EUR/$ – 3Q19/3Q18 Variance

67
Non - IFRS Comparing 3Q19 with mid-range Objectives
Revenue Operating Expenses
Operating Profit
Operating Margin
3Q19 Guidances mid-range 897.5 (632.7) 264.8 29.5%Growth YoY +10.9% +10.0% +13.1% +0.6pt
USD impact 11.1 (7.4) 3.7 +0.1pt
JPY impact including hedging 6.7 (2.8) 3.9 +0.2pt
Other currencies and other hedging impact 5.0 (5.4) (0.4) -0.2pt
Total FX 22.8 (15.6) 7.2 +0.1pt
Activity / Cost Control / Other (6.3) 11.3 4.9 +0.7pt
Delta: Reported vs guidances 16.5 (4.3) 12.1 +0.8pt
3Q19 Reported 914.0 (637.0) 276.9 30.3%Growth YoY +12.9% +10.8% +18.3% +1.4pt
3Q18 Reported 809.2 (575.1) 234.2 28.9%
68
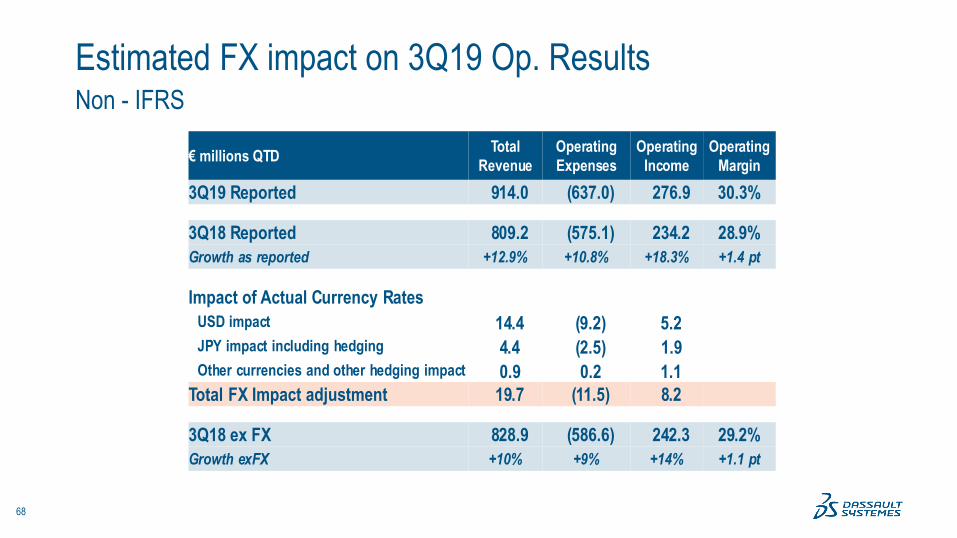
Non - IFRS Estimated FX impact on 3Q19 Op. Results
€ millions QTD Total Revenue
Operating Expenses
Operating Income
Operating Margin
3Q19 Reported 914.0 (637.0) 276.9 30.3%
3Q18 Reported 809.2 (575.1) 234.2 28.9%Growth as reported +12.9% +10.8% +18.3% +1.4 pt
Impact of Actual Currency RatesUSD impact 14.4 (9.2) 5.2 JPY impact including hedging 4.4 (2.5) 1.9 Other currencies and other hedging impact 0.9 0.2 1.1
Total FX Impact adjustment 19.7 (11.5) 8.2
3Q18 ex FX 828.9 (586.6) 242.3 29.2%Growth exFX +10% +9% +14% +1.1 pt

69
Non - IFRS Estimated FX impact on YTD 3Q19 Op. Results
€ millions YTD Total Revenue
Operating Expenses
Operating Income
Operating Margin
YTD2019 Reported 2,843.4 (1,953.8) 889.6 31.3%
YTD2018 Reported 2,460.5 (1,724.5) 736.0 29.9%Growth as reported +15.6% +13.3% +20.9% +1.4 pt
Impact of Actual Currency RatesUSD impact 61.7 (35.6) 26.1 JPY impact including hedging 10.7 (5.9) 4.8 Other currencies and other hedging impact 0.4 0.3 0.7
Total FX Impact adjustment 72.8 (41.2) 31.6
YTD2018 ex FX 2,533.2 (1,765.7) 767.5 30.3%Growth exFX +12% +11% +16% +1.0 pt

70
Consolidated Statement of Cash FlowsIFRS(in millions of €) 3Q19 3Q18 Variation 3Q19 YTD 3Q18 YTD Variation
Net income attributable to equity holders of the parent 137.4 112.9 24.5 432.3 378.4 53.9Non-controlling interest (0.5) (2.7) 2.1 (6.2) (3.1) (3.1) Net income 136.9 110.2 26.6 426.2 375.3 50.8Depreciation of property & equipment 33.6 14.3 19.3 98.9 42.5 56.3Amortization of intangible assets 53.4 45.9 7.5 158.9 132.9 26.0Other non-cash P&L items 27.6 12.7 15.0 74.9 45.8 29.1Changes in working capital (141.5) (82.0) (59.5) 244.8 150.1 94.7Net Cash Provided by (Used in) Operating Activities (I) 110.1 101.1 9.0 1 003.7 746.6 257.1
Additions to property, equipment and intangibles (28.5) (16.9) (11.6) (76.7) (48.2) (28.5)Payment for acquisition of businesses, net of cash acquired 4.1 (195.7) 199.8 (398.7) (247.3) (151.4)Sale (Purchase) of short-term investments, net (0.2) - (0.2) (0.2) 0.7 (0.9)Investments, loans and others 2.8 0.2 2.6 (14.3) (1.3) (13.0)Net Cash Provided by (Used in) Investing Activities (II) (21.7) (212.4) 190.7 (489.8) (296.1) (193.7)
Acquisition of non-controlling interests - (75.3) 75.3 - (101.5) 101.5Proceeds of short term and long term debt 3 652.0 - 3 652.0 3 652.0 - 3 652.0 Repayment of short term and long term debt (1 000.0) (14.9) (985.1) (1 000.9) (14.9) (986.0)Payments on lease obligations (19.3) - (19.3) (56.6) - (56.6)(Purchase) Sale of treasury stock (44.5) (111.6) 67.1 (35.3) (113.9) 78.6Proceeds from exercise of stock-options 26.9 15.5 11.4 72.9 59.2 13.7Cash dividend paid - - - (168.8) (38.0) (130.8)Net Cash Provided by (Used in) Financing Activities (III) 2 615.1 (186.3) 2 801.4 2 463.3 (209.1) 2 672.4
Effect of exchange rate changes on cash and cash equivalents (IV) 59.4 0.2 59.2 69.1 45.0 24.1Increase (Decrease) in Cash (V) = (I)+(II)+(III)+(IV) 2 762.8 (297.4) 3 060.2 3 046.3 286.4 2 759.9Cash and cash equivalents at Beginning of Period 3 092.8 3 043.2 2 809.3 2 459.4Cash and cash equivalents at End of Period 5 855.6 2 745.8 5 855.6 2 745.8Cash and cash equivalents variation 2 762.8 (297.4) 3 046.3 286.4

71
Balance SheetEnd of End of Variation End of Variation
(in millions of €) Sep-19 Jun-19 Sep-19 / Jun-19 Dec-18 Sep-19 / Dec-18
Cash and cash equivalents 5,855.6 3,092.8 +2,762.8 2,809.3 +3,046.3Short-term investments 0.8 0.6 +0.2 0.6 +0.2Accounts receivable, net 744.0 810.3 -66.2 1,044.1 -300.1Contract assets 39.9 40.3 -0.4 26.5 +13.4Other current assets 424.6 227.9 +196.7 321.3 +103.3Total current assets 7,064.9 4,171.9 +2,893.0 4,201.8 +2,863.1Property and equipment, net 568.8 563.1 +5.7 178.2 +390.6Goodwill and Intangible assets, net 3,675.3 3,613.8 +61.5 3,262.4 +412.9Other non-current assets 343.1 374.7 -31.6 331.6 +11.5Total non-current assets 4,587.3 4,551.6 +35.6 3,772.2 +815.0
Total Assets 11,652.2 8,723.5 +2,928.7 7,974.0 +3,678.2
Accounts payable 160.1 163.8 -3.7 161.7 -1.5Contract liabilities 922.1 1,019.9 -97.8 907.5 +14.7Borrowings, current 11.5 350.0 -338.5 350.0 -338.5Other current liabilities 588.7 623.5 -34.8 603.6 -14.9Total current liabilities 1,682.4 2,157.2 -474.8 2,022.8 -340.4Borrowings, non-current 3,628.5 650.0 +2,978.4 650.0 +2,978.4Other non-current liabilities 1,095.7 1,060.9 +34.7 675.4 +420.3Total non-current liabilities 4,724.1 1,710.9 +3,013.1 1,325.4 +3,398.7Non-controlling interest 58.2 57.6 +0.6 63.9 -5.7Parent Shareholders' equity 5,187.4 4,797.9 +389.6 4,561.9 +625.5
Total Liabilities and Shareholders' Equity 11,652.2 8,723.5 +2,928.7 7,974.0 +3,678.2

72
Trade Accounts Receivable | DSO
73
9486 80 77
3Q18 4Q18 1Q19 2Q19 3Q19
DSO – IFRS 15in days

73
At Closing - TOTAL3Q19 3Q18 % growth 4Q18 % growth
M&S + COR Ser 9,075 8,381 +8.3% 8,511 +6.6%R&D + COR SW 7,265 6,738 +7.8% 6,885 +5.5%G&A 1,679 1,603 +4.7% 1,634 +2.7%Total 18,019 16,721 +7.8% 17,030 +5.8%
At Closing - PAYROLL3Q19 3Q18 % growth 4Q18 % growth
M&S + COR Ser 8,467 7,812 +8.4% 7,905 +7.1%R&D + COR SW 7,013 6,516 +7.6% 6,632 +5.7%G&A 1,564 1,494 +4.7% 1,519 +3.0%Total 17,043 15,823 +7.7% 16,055 +6.2%
At Closing - SUBCONTRACTORS3Q19 3Q18 % growth 4Q18 % growth
M&S + COR Ser 608 569 +6.9% 606 +0.3%R&D + COR SW 252 221 +14.0% 253 -0.4%G&A 115 109 +5.9% 115 -0.3%Total 975 898 +8.5% 974 +0.1%
OverviewHeadcount by destinations – 3Q19
50.4%
40.3%
9.3%
Closing H/C - September 2019
M&S + COR Ser R&D + COR SW G&A
74
Accounting elements not included in the non-IFRS 2019 Objectives
IFRS 2019 Objectives
► FY 2019 estimated contract liabilities write-down of ~€10m
► FY 2019 estimated share-based compensation expenses, including related social charges: ~€144m
► FY 2019 estimated amortization of acquired intangibles: ~€201m
► The non-IFRS objectives also do not include any impact from other operating income and expense, net principally comprised of acquisition, integration and restructuring expenses, and impairment of goodwill and acquired intangible assets; from one-time items included in financial revenue; from one-time tax effects; and from the income tax effects of these non-IFRS adjustments.
► Finally, these estimates do not include any new stock option or share grants, or any new acquisitions or restructurings completed after September 30, 2019.

75
Related Documents