Q3 & 9M 2015 Financial Results Presentation 22 October 2015

Welcome message from author
This document is posted to help you gain knowledge. Please leave a comment to let me know what you think about it! Share it to your friends and learn new things together.
Transcript

Q3 & 9M 2015 Financial Results Presentation 22 October 2015
Table of Contents
3 Q3 & 9M 2015 Results Overview
7 Divisional Performance and Market Outlook
11 Financial Position
16 Appendices

Q3 & 9M 2015 Results Overview

Page 4
Summary
Group EBITDA margin remains amongst the highest in the industry at 31.5% in Q3 15 (Q2 15: 32.6%). Group EBITDA* decreased 10.9%
q/q to $524m (Q2 15: $588m)
In spite of further RUB devaluation driving down USD-denominated average selling prices for both steel and steel-related raw materials,
q/q Group revenue decreased only 7.9% q/q to $1,663m (Q2 15: $1,806m) strongly supported by a seasonal rebound in sales volumes
in domestic markets in both the steel and mining divisions
Free cash flow for Q3 15 increased 42.0% q/q to $609m (Q2 15: $429m) reflecting further progress against the strategic objective and
was mainly a function of a seasonal uptick in demand in the local market, although not as pronounced as previous years, and a higher
share of domestic sales. These led to a substantial working capital release compared with the previous quarter
Q3 15 net loss** of $130m (Q2 15: net profit of $469m) reflects a FX loss of $515m. Adjusting for this non-cash item, Severstal would
have posted an underlying net profit of $385m (Q2 15: $339m excluding FX profit)
As strong free cash flow generation more than offset cash outflows on gross debt reduction and the quarterly dividend payment, Net
Debt/EBITDA ratio reduced sharply q/q to 0.4x at the end of Q3 15, remaining one of the lowest amongst steel companies globally
Q3 15 capex *** of $103m, 7.2% lower q/q (Q2 15: $111m), which is a reflection of our prudent approach to investments. We reiterate
our FY15 capex target of RUB 30bn
Recommended dividend payment of 13.17 roubles per share for the three months ended 30 September 2015
Q3 2015 Highlights:
* EBITDA represents profit from operations plus depreciation and amortization of productive assets (including the Group’s share in depreciation and amortizat ion of associates and joint ventures) adjusted for gain/(loss) on disposals of PPE and intangible assets and for share in associates’ and joint ventures’ non-operating income/(expenses) ** Net (loss)/profit from continuing operations after FX fluctuations *** Represents cash outflow on capex in the period
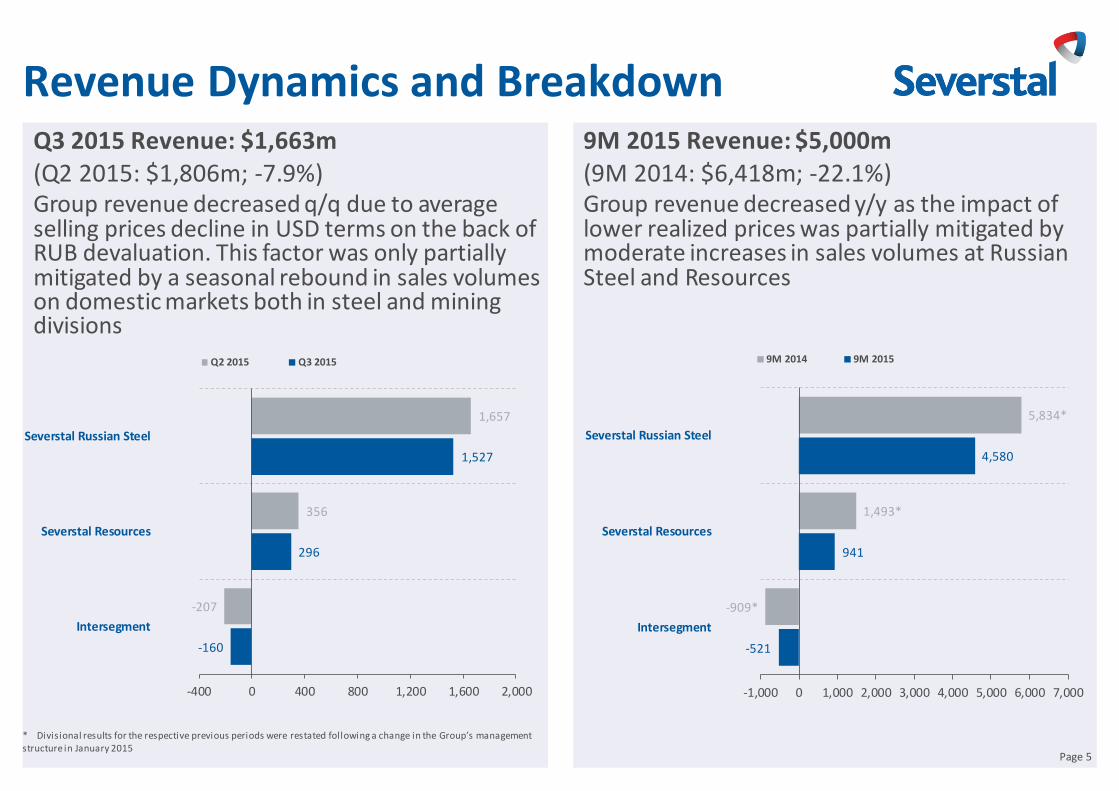
Revenue Dynamics and Breakdown Q3 2015 Revenue: $1,663m (Q2 2015: $1,806m; -7.9%) Group revenue decreased q/q due to average selling prices decline in USD terms on the back of RUB devaluation. This factor was only partially mitigated by a seasonal rebound in sales volumes on domestic markets both in steel and mining divisions
Page 5
9M 2015 Revenue: $5,000m (9M 2014: $6,418m; -22.1%) Group revenue decreased y/y as the impact of lower realized prices was partially mitigated by moderate increases in sales volumes at Russian Steel and Resources
* Divisional results for the respective previous periods were restated following a change in the Group’s management structure in January 2015
-160
296
1,527
-207
356
1,657
-400 0 400 800 1,200 1,600 2,000
Intersegment
Severstal Resources
Severstal Russian Steel
Q2 2015 Q3 2015
-521
941
4,580
-909*
1,493*
5,834*
-1,000 0 1,000 2,000 3,000 4,000 5,000 6,000 7,000
Intersegment
Severstal Resources
Severstal Russian Steel
9M 2014 9M 2015
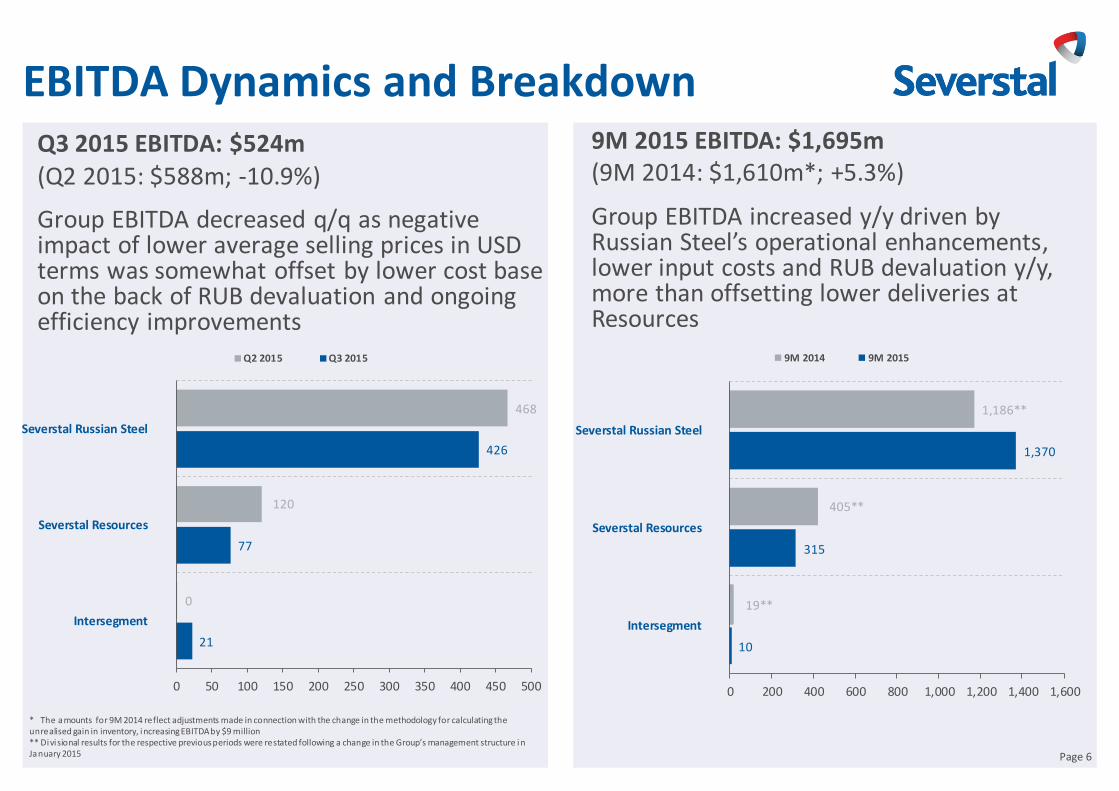
EBITDA Dynamics and Breakdown Q3 2015 EBITDA: $524m (Q2 2015: $588m; -10.9%)
Group EBITDA decreased q/q as negative impact of lower average selling prices in USD terms was somewhat offset by lower cost base on the back of RUB devaluation and ongoing efficiency improvements
Page 6
9M 2015 EBITDA: $1,695m (9M 2014: $1,610m*; +5.3%)
Group EBITDA increased y/y driven by Russian Steel’s operational enhancements, lower input costs and RUB devaluation y/y, more than offsetting lower deliveries at Resources
* The amounts for 9M 2014 reflect adjustments made in connection with the change in the methodology for calculating the unrealised gain in inventory, increasing EBITDA by $9 million ** Divisional results for the respective previous periods were restated following a change in the Group’s management structure i n January 2015
21
77
426
0
120
468
0 50 100 150 200 250 300 350 400 450 500
Intersegment
Severstal Resources
Severstal Russian Steel
Q2 2015 Q3 2015
10
315
1,370
19**
405**
1,186**
0 200 400 600 800 1,000 1,200 1,400 1,600
Intersegment
Severstal Resources
Severstal Russian Steel
9M 2014 9M 2015
Divisional Performance and Market Outlook

Severstal Russian Steel (RSD) Steel product sales increased 13% q/q to 3.01mnt driven by improved domestic steel consumption and
despite less pronounced seasonality in 2015 than in previous years
The share of domestic sales within the sales mix increased to 67% (Q2 15: 59%) reflecting Severstal’s ability to efficiently reallocate sales volumes between the export and domestic markets and capture improved
consumption trends in the domestic market
Improved domestic flat steel consumption led to notable increases in high-value added (HVA) sales volumes. This enabled RSD to maintain the share of HVA products within sales mix at 47%
A seasonal uptick in domestic demand enabled RSD to proceed with RUB-denominated price increases.
This helped to partially mitigate the RUB devaluation impact in Q3 15
RSD revenue decreased 7.8% q/q to $1,527m (Q2 15: $1,657m). EBITDA margin compressed only 0.3 ppts
to 27.9% (Q2 15: 28.2%) as the negative impact of lower selling prices was partially mitigated by lower raw
material input prices and lower production costs on the back of RUB devaluation. As a result, EBITDA
decreased 9.0% q/q to $426m (Q2 15: $468m)
In Q3 Cherepovets total non-integrated cash cost of slab decreased $53/t q/q to $206/t due to lower raw materials prices and rolling costs on RUB depreciation as well as higher crude steel production and ongoing
efficiency improvements. Q3 integrated cash cost of slab decreased $36/t q/q to $176/t
Share of high-value-added products** in total steel shipments, %
EBITDA per tonne and average selling price
*All steel products, incl. pipes, etc.; Ex Works price terms.
Steel sales volumes by destination, %
** High-value-added comprises: plate; cold-rolled, galvanised and metallic coated, color coated sheet; metalware; large-diameter and other pipes. *** Excluding foreign exchange effect
EBITDA drivers in Q3 2015, $m
Page 8
2.6 2.7 2.5
2.7 2.7 2.7 2.6 2.7 3.0
50% 49% 47% 47% 52% 52%
46% 47% 47%
0%
20%
40%
60%
80%
100%
0.0
0.5
1.0
1.5
2.0
2.5
3.0
3.5
Q313
Q413
Q114
Q214
Q314
Q414
Q115
Q215
Q315
Total finished steel, mt (lhs) share of HVA, %
69% 62% 60% 64% 71% 71% 62% 59% 67%
31% 38% 40% 36% 29% 29% 38% 41% 33%
Q313
Q413
Q114
Q214
Q314
Q414
Q115
Q215
Q315
Russia Export
175
141 149 166
561
454
649
500
Q2 2015 Q3 2015 9M 2014 9M 2015
EBITDA per tonne (US$/t) Average Selling Price (US$/t)*
468 426
108
(87)
(100)
28 9
EBITDAQ2 2015
SalesVolume
COGSVolume
SalesPrice***
COGSPrice
Other EBITDAQ3 2015

Cost Control at Severstal Russian Steel
Page 9
Cherepovets Steel Mill production cash cost of slab, $/t
Q3 15 non-integrated cash cost of slab down $53/t q/q
Cherepovets cash cost of
slab at market price of raw materials
Q3 15 integrated cash cost of slab down $36/t q/q
358 389 378
329 337 344 336 348 342 324 299 279 272 318
280
203 169
212 176
484
559 537
472 457 457
432 401
418 409
370 377
350 361
327
255
214
259
206
$0
$100
$200
$300
$400
$500
$600
Q111
Q211
Q311
Q411
Q112
Q212
Q312
Q412
Q113
Q213
Q313
Q413
Q114
Q214
Q314
Q414
Q115
Q215
Q315
Contribution of Severstal Resources division to the integrated costs
Cash cost of slab on an integrated basis
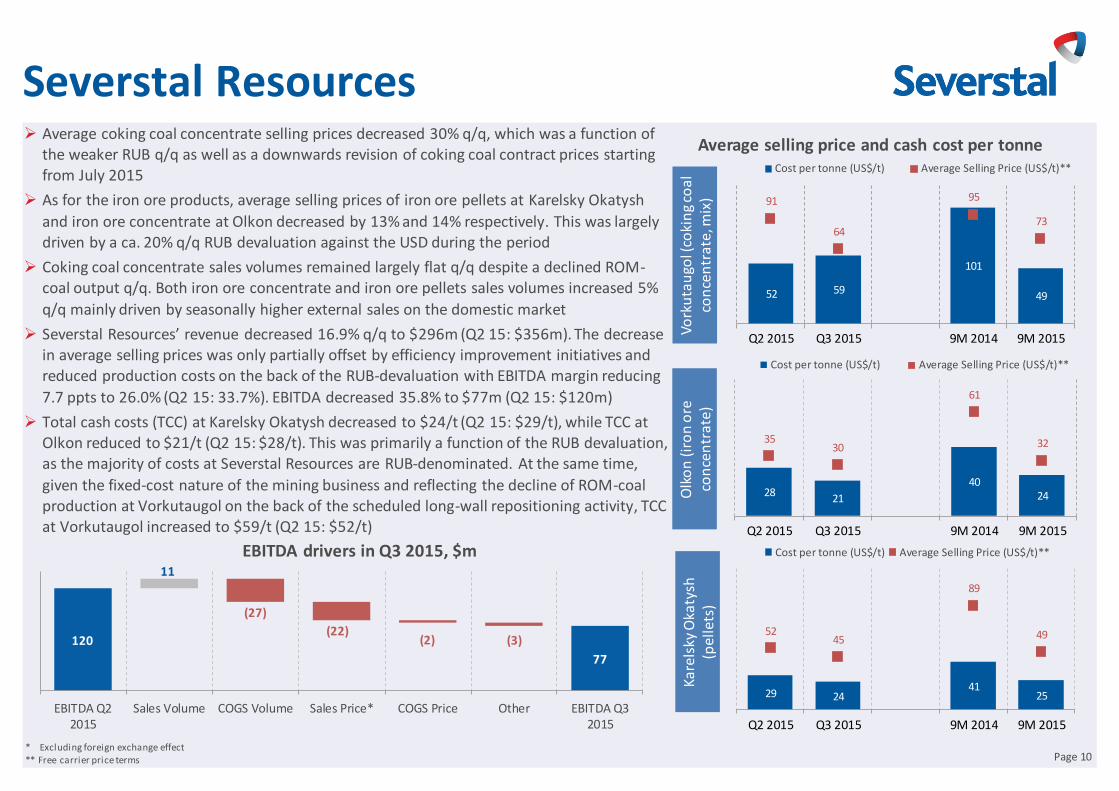
Severstal Resources Average coking coal concentrate selling prices decreased 30% q/q, which was a function of
the weaker RUB q/q as well as a downwards revision of coking coal contract prices starting from July 2015
As for the iron ore products, average selling prices of iron ore pellets at Karelsky Okatysh
and iron ore concentrate at Olkon decreased by 13% and 14% respectively. This was largely driven by a ca. 20% q/q RUB devaluation against the USD during the period
Coking coal concentrate sales volumes remained largely flat q/q despite a declined ROM-coal output q/q. Both iron ore concentrate and iron ore pellets sales volumes increased 5%
q/q mainly driven by seasonally higher external sales on the domestic market
Severstal Resources’ revenue decreased 16.9% q/q to $296m (Q2 15: $356m). The decrease in average selling prices was only partially offset by efficiency improvement initiatives and reduced production costs on the back of the RUB-devaluation with EBITDA margin reducing
7.7 ppts to 26.0% (Q2 15: 33.7%). EBITDA decreased 35.8% to $77m (Q2 15: $120m)
Total cash costs (TCC) at Karelsky Okatysh decreased to $24/t (Q2 15: $29/t), while TCC at Olkon reduced to $21/t (Q2 15: $28/t). This was primarily a function of the RUB devaluation, as the majority of costs at Severstal Resources are RUB-denominated. At the same time,
given the fixed-cost nature of the mining business and reflecting the decline of ROM-coal production at Vorkutaugol on the back of the scheduled long-wall repositioning activity, TCC at Vorkutaugol increased to $59/t (Q2 15: $52/t)
Page 10
Average selling price and cash cost per tonne
Vork
uta
ugo
l (co
kin
g co
al
con
cen
trat
e, m
ix)
Ka
rels
ky O
katy
sh
(pel
lets
)
* Excluding foreign exchange effect ** Free carrier price terms
EBITDA drivers in Q3 2015, $m
Olk
on
(ir
on
ore
co
nce
ntr
ate)
52 59
101
49
91
64
95
73
Q2 2015 Q3 2015 9M 2014 9M 2015
Cost per tonne (US$/t) Average Selling Price (US$/t)**
28 21
40 24
35 30
61
32
Q2 2015 Q3 2015 9M 2014 9M 2015
Cost per tonne (US$/t) Average Selling Price (US$/t)**
29 24 41
25
52 45
89
49
Q2 2015 Q3 2015 9M 2014 9M 2015
Cost per tonne (US$/t) Average Selling Price (US$/t)**
120
77
11
(27)
(22) (2) (3)
EBITDA Q22015
Sales Volume COGS Volume Sales Price* COGS Price Other EBITDA Q32015

Financial Position

Cash Flow and Net Working Capital
Solid liquidity position of $1,675m in cash and cash equivalents
Strong operating cash flow of $686m* in Q3 15
Q3 15 capex of $103m, 7.2% lower q/q (Q2 15: $111m) reflecting prudent
approach to investments
Q3 15 free cash flow of $609m (Q2 15: $429m)
Net working capital down 9.0%** YTD on a back of seasonal inventory release;
NWC/LTM revenue increased to 9.8% YTD
Net working capital, $m
September 30, 2015 December 31, 2014** Change, %
671 737 (9.0%)
Page 12
Net working capital as % of revenues (LTM)
September 30, 2015 December 31, 2014** Change, ppts
9.8% 8.9% 0.9 ppts
Net Working Capital developments
Q3 and 9M 2015 Highlights:
9M 2015 CAPEX breakdown, $m FY 2015 target CAPEX breakdown, RUBbn
$317m RUB30bn
Cash Flow dynamics, 31 Dec 2014 to 30 Sep 2015
Severstal Russian
Steel $148m
Severstal Resources
$169m
Severstal Russian
Steel RUB16bn
Severstal Resources RUB14bn
* Net cash from operating activities ** These amounts reflect adjustments arising from a change in the methodology for calculating the unrealised gain in inventory
1,897 1,675
1,446
(214)
(1,454)
Dec 2014 Cash& CE
Operating CF Investing CF Financing CF,incl. FX effecton cash & CE
Sep 2015 Cash& CE

1,675
683
0 4 1
486
Liquidity 4Q 2015 1Q 2016 2Q 2016 3Q 2016
Cash & Equivalents Unused committed credit lines* Short-term debt to be repaid
Robust Liquidity and Sustainable Leverage Strong liquidity position: The Company exercised a put option on Convertible Bonds in September
2015. $390m of outstanding bonds were submitted by bondholders. The
outstanding principle now is $61.8m
Severstal gross debt decreased 13.9% since the end of Q2 15 to $2,504m
(Q2 15: $2,907m)
As at the end of Q3 15, cash and cash equivalents were at $1,675m (Q2
15: $1,552m)
Net debt declined a significant 38.8% to just $829m as at the end of Q3
15 (Q2 2015: $1,355m). Net Debt/EBITDA ratio reduced sharply q/q to
0.4x at the end of Q3 15 (Q2 15: 0.6x), remaining one of the lowest
amongst steel companies globally
Strong liquidity with $1,675 million in cash and cash equivalents and
unused committed credit lines of $683 million, more than covers short-
term debt principal requirements of $491 million
* Represents principal amount of debt
Page 13
Total Short-term Debt to be Repaid of $491m*
Q3 2015 debt currency mix Q3 2015 cash currency mix
USD 89.5%
EUR 0.8%
RUB 9.7%
RUR 26.5%
USD 70.5%
EUR 3%
3,429 2,899 2,907
2,504
1,532 1,376 1,355 829
0.7x 0.6x
0.6x
0.4x
Q4 2014 Q1 2015 Q2 2015 Q3 2015
Total debt, $m Net debt, $m Net debt/EBITDA, x
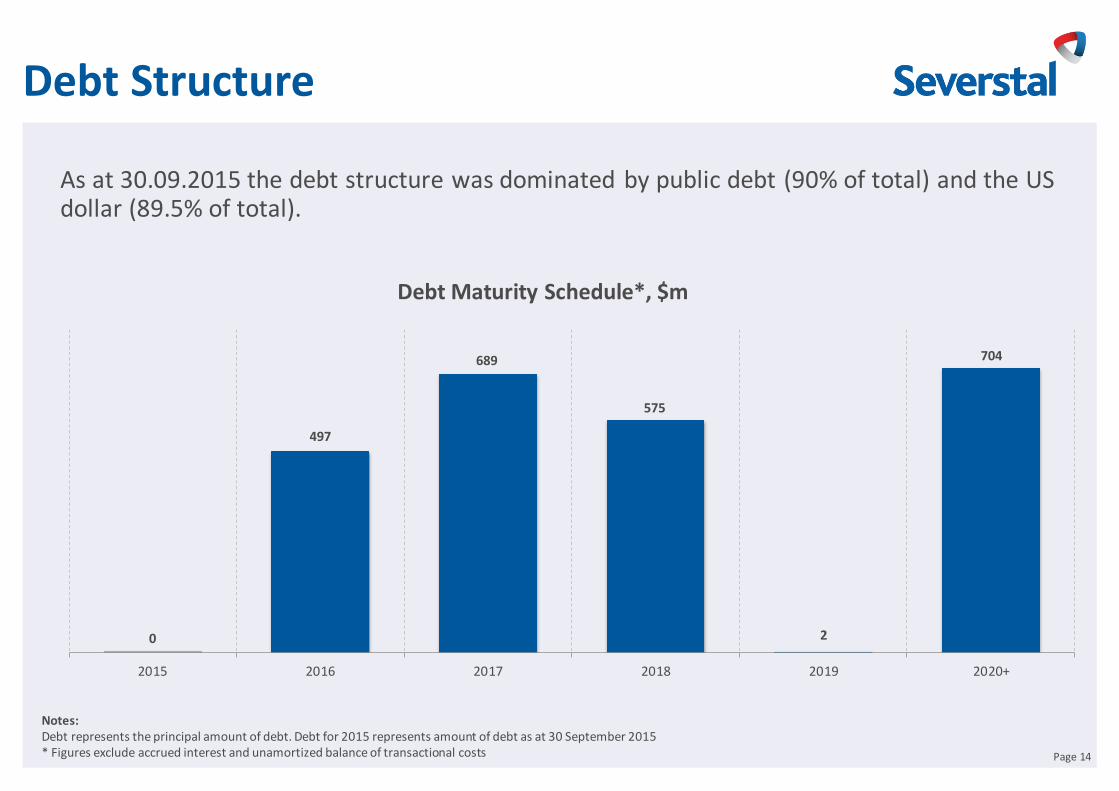
Debt Structure
As at 30.09.2015 the debt structure was dominated by public debt (90% of total) and the US dollar (89.5% of total).
Page 14
Debt Maturity Schedule*, $m
Notes: Debt represents the principal amount of debt. Debt for 2015 represents amount of debt as at 30 September 2015 * Figures exclude accrued interest and unamortized balance of transactional costs
0
497
689
575
2
704
2015 2016 2017 2018 2019 2020+
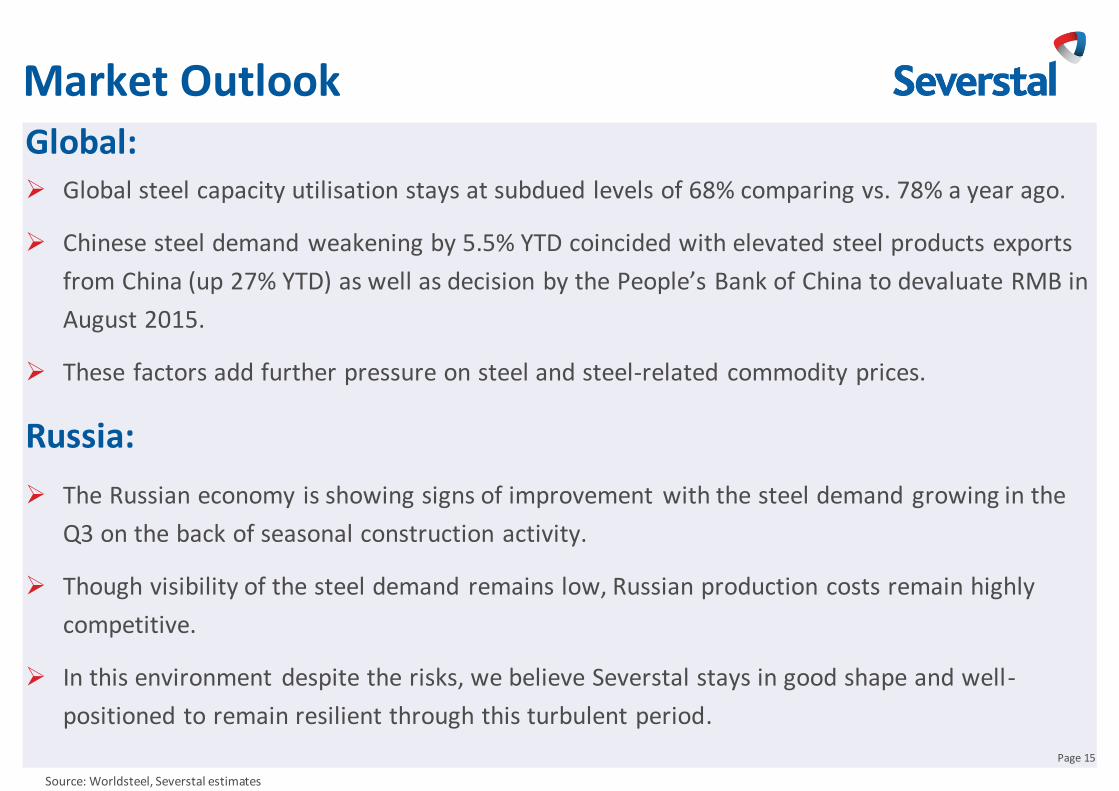
Market Outlook Global: Global steel capacity utilisation stays at subdued levels of 68% comparing vs. 78% a year ago.
Chinese steel demand weakening by 5.5% YTD coincided with elevated steel products exports
from China (up 27% YTD) as well as decision by the People’s Bank of China to devaluate RMB in
August 2015.
These factors add further pressure on steel and steel-related commodity prices.
Russia:
The Russian economy is showing signs of improvement with the steel demand growing in the
Q3 on the back of seasonal construction activity.
Though visibility of the steel demand remains low, Russian production costs remain highly
competitive.
In this environment despite the risks, we believe Severstal stays in good shape and well-
positioned to remain resilient through this turbulent period.
Source: Worldsteel, Severstal estimates
Page 15
Appendices
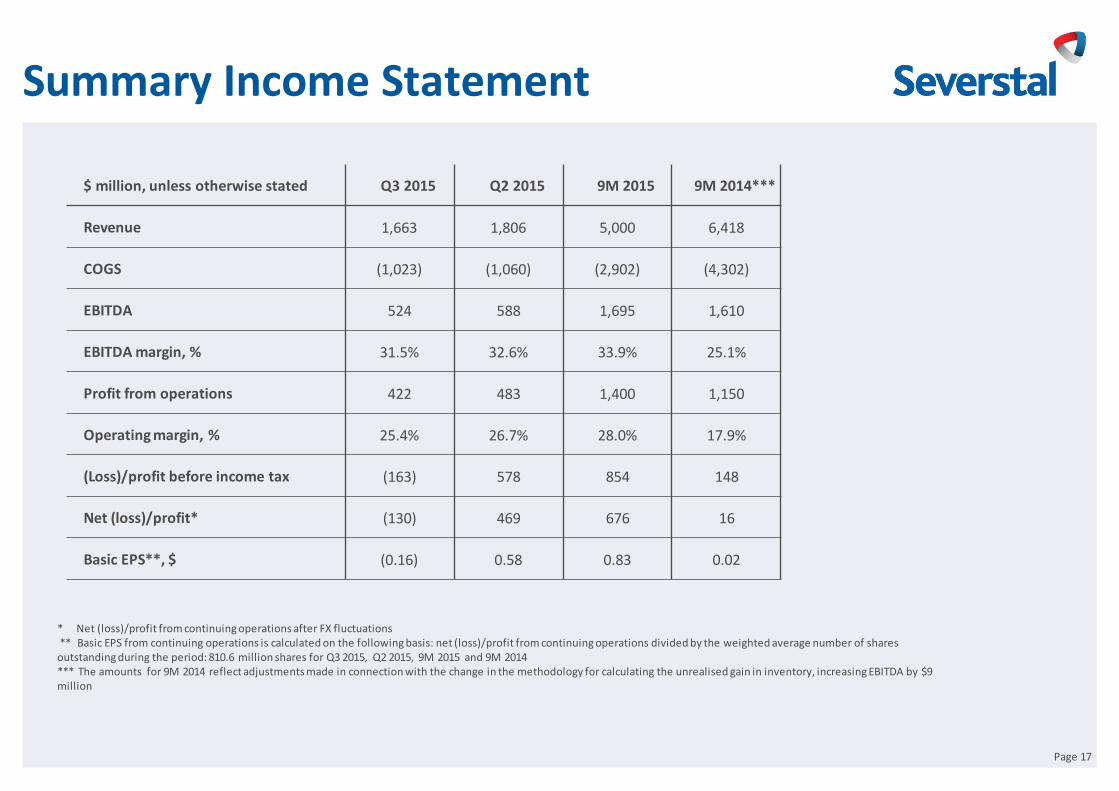
Summary Income Statement
$ million, unless otherwise stated Q3 2015 Q2 2015 9M 2015 9M 2014***
Revenue 1,663 1,806 5,000 6,418
COGS (1,023) (1,060) (2,902) (4,302)
EBITDA 524 588 1,695 1,610
EBITDA margin, % 31.5% 32.6% 33.9% 25.1%
Profit from operations 422 483 1,400 1,150
Operating margin, % 25.4% 26.7% 28.0% 17.9%
(Loss)/profit before income tax (163) 578 854 148
Net (loss)/profit* (130) 469 676 16
Basic EPS**, $ (0.16) 0.58 0.83 0.02
Page 17
* Net (loss)/profit from continuing operations after FX fluctuations ** Basic EPS from continuing operations is calculated on the following basis: net (loss)/profit from continuing operations divided by the weighted average number of shares outstanding during the period: 810.6 million shares for Q3 2015, Q2 2015, 9M 2015 and 9M 2014 *** The amounts for 9M 2014 reflect adjustments made in connection with the change in the methodology for calculating the unrealised gain in inventory, increasing EBITDA by $9 million

Q3 2015 Revenue Breakdown by Region
Page 18
Severstal Resources Q3 2015 revenue breakdown by region
Severstal Russian Steel Q3 2015 revenue breakdown by region
Severstal Group Q3 2015 revenue breakdown by region
Russia 69%
Europe 17%
Middle East 5%
Americas 2%
Asia 2%
Other 5%
Russia 70%
Europe 16%
Middle East 4%
Americas 2%
Asia 2%
Other 6%
Russia 80%
Europe 12%
Middle East; 8%
Q3 & 9M 2015 Division Results
Q3 2015 Q2 2015 Change, % 9M 2015 9M 2014* Change, %
Revenue ($m) 1,527 1,657 (7.8%) 4,580 5,834 (21.5%)
Cost of sales ($m) (993) (1,048) (5.2%) (2,838) (4,196) (32.4%)
G&A expenses ($m) (56) (78) (28.2%) (204) (293) (30.4%)
Distribution expenses ($m) (103) (120) (14.2%) (324) (417) (22.3%)
EBITDA ($m) 426 468 (9.0%) 1,370 1,186 15.5%
Operating Profit ($m) 359 401 (10.5%) 1,183 899 31.6%
EBITDA Margin, % 27.9% 28.2% (0.3 ppts) 29.9% 20.3% 9.6 ppts
EBITDA per tonne ($/t) 141 175 (19.4%) 166 149 11.4%
Average Selling Price (US$/t**) 454 561 (19.1%) 500 649 (23.0%)
Severstal Russian Steel
Severstal Resources
* Divisional results for the respective previous periods were restated following a change in the Group’s management structure in January 2 015 ** All steel products, incl. pipes, etc.; Ex Works price terms Page 19
Q3 2015 Q2 2015 Change, % 9M 2015 9M 2014* Change, %
Revenue ($m) 296 356 (16.9%) 941 1,493 (37.0%)
Cost of sales ($m) (205) (213) (3.8%) (573) (991) (42.2%)
G&A expenses ($m) (12) (19) (36.8%) (46) (97) (52.6%)
Distribution expenses ($m) (31) (36) (13.9%) (97) (141) (31.2%)
EBITDA ($m) 77 120 (35.8%) 315 405 (22.2%)
Operating Profit ($m) 42 80 (47.5%) 206 230 (10.4%)
EBITDA Margin, % 26.0% 33.7% (7.7 ppts) 33.5% 27.1% 6.4 ppts

Summary Balance Sheet
$ million As at 30 September 2015 As at 31 December 2014*
Cash and Cash Equivalents 1,675 1,897
Total Assets: 6,433 7,553
Current Assets 3,105 3,612
Non-current Assets 3,328 3,941
Total Liabilities: 3,789 4,725
Current Liabilities 1,422 1,734
Non-current Liabilities 2,367 2,991
Total Equity 2,644 2,828
Total Equity and Liabilities 6,433 7,553
Page 20
* These amounts reflect adjustments arising from a change in the methodology for calculating the unrealised gain in inventory

Summary Cash Flow Statement $ million Q3 2015 Q2 2015 9M 2015 9M 2014*
Profit before Financing and Taxation 408 472 1,361 920
Cash Generated from Operations 729 569 1,621 1,619
Interest Paid (33) (51) (126) (190)
Income Tax Paid (11) (17) (32) (45)
Net cash from Operating Activities - continuing operations 685 501 1,463 1,384
Net cash from/(used in) Operating Activities - discontinued operation 1 (4) (17) 123
Net cash from Operating Activities 686 497 1,446 1,507
Net cash (used in)/from Investing Activities - continuing operations (74) (72) (214) 1,397
Net cash used in Investing Activities - discontinued operation - - - (94)
Total cash (used in)/from Investing Activities, incl. (74) (72) (214) 1,303
Additions to PP&E and IA (103) (111) (317) (622)
Free Cash Flow** 609 429 1,247 807
Cash used in Financing Activities - continuing operations (406) (413) (1,373) (649)
Cash used in Financing Activities - discontinued operation - - - (368)
Cash used in Financing Activities (406) (413) (1,373) (1,017)
Effect of Exchange Rate on Cash and Cash Equivalents (83) 18 (81) (76)
Net increase/(decrease) in Cash and Cash Equivalents 123 30 (222) 1,717
Cash and Cash Equivalents at beginning of the Period 1,552 1,522 1,897 1,036
Cash and Cash Equivalents at end of the Period 1,675 1,552 1,675 2,753
Page 21
* These amounts reflect adjustments made in connection with the change in the methodology for calculating the unrealised gain in inventory ** Free cash flow excludes discontinued operation
Disclaimer
These materials are confidential and have been prepared by PAO Severstal (Severstal) solely for your
information and may not be reproduced, retransmitted or further distributed to any other person or
published, in whole or in part, for any other purpose.
These materials may contain projections and other forward-looking statements regarding future
events or the future financial performance of Severstal. You can identify forward-looking statements
by terms such as “expect,” “believe,” “estimate,” “intend,” “will,” “could,” “may” or “might”, or other
similar expressions. Severstal cautions you that these statements are only predictions and that actual
events or results may differ materially. Severstal will not update these statements to reflect events
and circumstances occurring after the date hereof. Factors that could cause the actual results to differ
materially from those contained in projections or forward-looking statements of Severstal may
include, among others, general economic and competitive environment conditions in the markets in
which Severstal operates, market change in the steel and mining industries, as well as many other risks
affecting Severstal and its operations.
These materials do not constitute or form part of any advertisement of securities, any offer or
invitation to sell or issue or any solicitation of any offer to purchase or subscribe for, any securities of
Severstal in any jurisdiction, nor shall they or any part of them nor the fact of their presentation,
communication or distribution form the basis of, or be relied on in connection with, any contract or
investment decision.
No representation or warranty, express or implied, is given by Severstal, its affiliates or any of their
respective advisers, officers, employees or agents, as to the accuracy of the information or opinions or
for any loss howsoever arising, directly or indirectly, from any use of these materials or their contents.
Page 22
Related Documents