Q3 2019 Interim Management Statement The Royal Bank of Scotland Group rbs.com

Welcome message from author
This document is posted to help you gain knowledge. Please leave a comment to let me know what you think about it! Share it to your friends and learn new things together.
Transcript
Q3 2019 Interim Management Statement
The Royal Bank of Scotland Group rbs.com
1 RBS – Q3 2019 Results
The Royal Bank of Scotland Group plc Q3 2019 Interim Management Statement
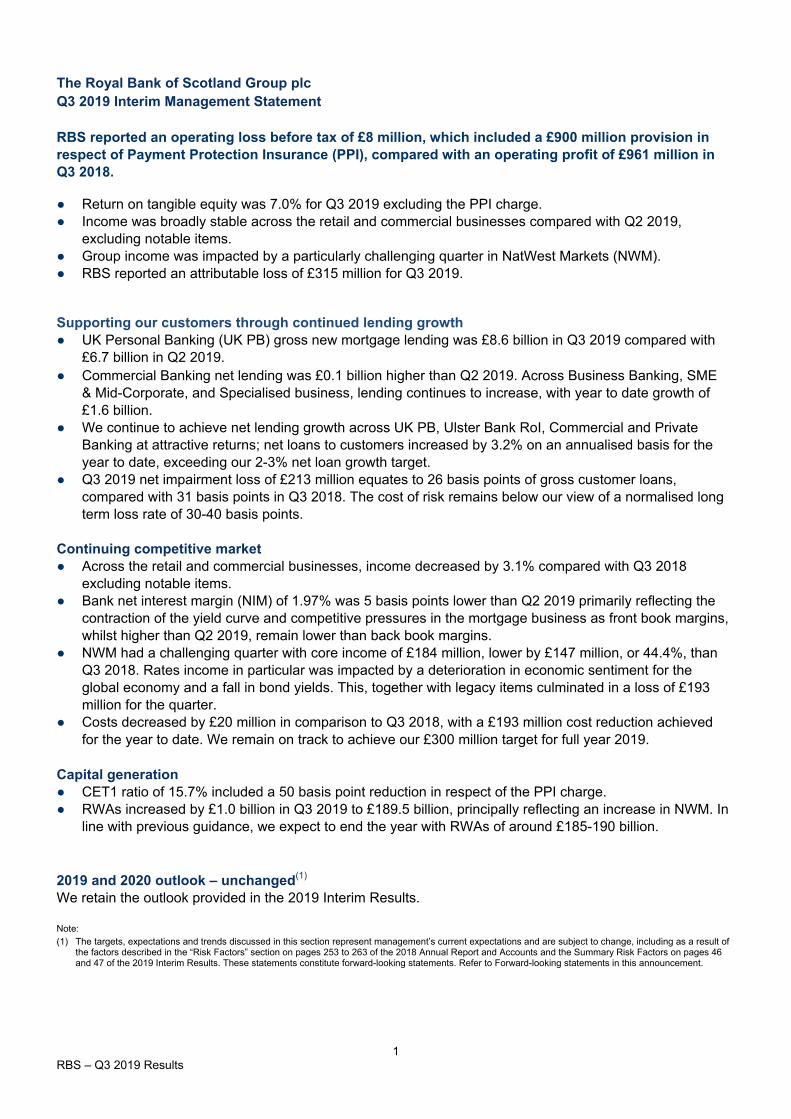
RBS reported an operating loss before tax of £8 million, which included a £900 million provision in respect of Payment Protection Insurance (PPI), compared with an operating profit of £961 million in Q3 2018.
● Return on tangible equity was 7.0% for Q3 2019 excluding the PPI charge. ● Income was broadly stable across the retail and commercial businesses compared with Q2 2019,
excluding notable items. ● Group income was impacted by a particularly challenging quarter in NatWest Markets (NWM). ● RBS reported an attributable loss of £315 million for Q3 2019.
Supporting our customers through continued lending growth ● UK Personal Banking (UK PB) gross new mortgage lending was £8.6 billion in Q3 2019 compared with
£6.7 billion in Q2 2019. ● Commercial Banking net lending was £0.1 billion higher than Q2 2019. Across Business Banking, SME
& Mid-Corporate, and Specialised business, lending continues to increase, with year to date growth of £1.6 billion.
● We continue to achieve net lending growth across UK PB, Ulster Bank RoI, Commercial and Private Banking at attractive returns; net loans to customers increased by 3.2% on an annualised basis for the year to date, exceeding our 2-3% net loan growth target.
● Q3 2019 net impairment loss of £213 million equates to 26 basis points of gross customer loans, compared with 31 basis points in Q3 2018. The cost of risk remains below our view of a normalised long term loss rate of 30-40 basis points.
Continuing competitive market ● Across the retail and commercial businesses, income decreased by 3.1% compared with Q3 2018
excluding notable items. ● Bank net interest margin (NIM) of 1.97% was 5 basis points lower than Q2 2019 primarily reflecting the
contraction of the yield curve and competitive pressures in the mortgage business as front book margins, whilst higher than Q2 2019, remain lower than back book margins.
● NWM had a challenging quarter with core income of £184 million, lower by £147 million, or 44.4%, than Q3 2018. Rates income in particular was impacted by a deterioration in economic sentiment for the global economy and a fall in bond yields. This, together with legacy items culminated in a loss of £193 million for the quarter.
● Costs decreased by £20 million in comparison to Q3 2018, with a £193 million cost reduction achieved for the year to date. We remain on track to achieve our £300 million target for full year 2019.
Capital generation ● CET1 ratio of 15.7% included a 50 basis point reduction in respect of the PPI charge. ● RWAs increased by £1.0 billion in Q3 2019 to £189.5 billion, principally reflecting an increase in NWM. In
line with previous guidance, we expect to end the year with RWAs of around £185-190 billion. 2019 and 2020 outlook – unchanged(1) We retain the outlook provided in the 2019 Interim Results. Note: (1) The targets, expectations and trends discussed in this section represent management’s current expectations and are subject to change, including as a result of
the factors described in the “Risk Factors” section on pages 253 to 263 of the 2018 Annual Report and Accounts and the Summary Risk Factors on pages 46 and 47 of the 2019 Interim Results. These statements constitute forward-looking statements. Refer to Forward-looking statements in this announcement.
2 RBS – Q3 2019 Results
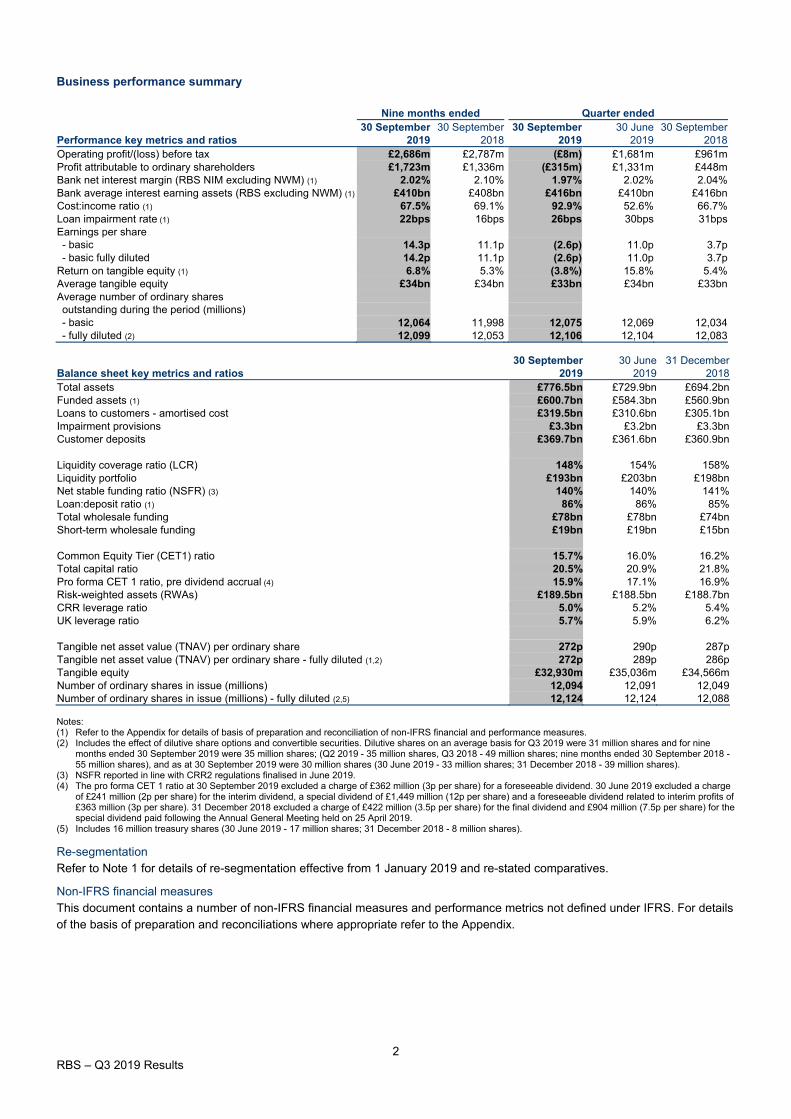
Business performance summary
Nine months ended Quarter ended 30 September 30 September 30 September 30 June 30 September
Performance key metrics and ratios 2019 2018 2019 2019 2018 Operating profit/(loss) before tax £2,686m £2,787m (£8m) £1,681m £961m Profit attributable to ordinary shareholders £1,723m £1,336m (£315m) £1,331m £448m Bank net interest margin (RBS NIM excluding NWM) (1) 2.02% 2.10% 1.97% 2.02% 2.04% Bank average interest earning assets (RBS excluding NWM) (1) £410bn £408bn £416bn £410bn £416bn Cost:income ratio (1) 67.5% 69.1% 92.9% 52.6% 66.7% Loan impairment rate (1) 22bps 16bps 26bps 30bps 31bps Earnings per share - basic 14.3p 11.1p (2.6p) 11.0p 3.7p - basic fully diluted 14.2p 11.1p (2.6p) 11.0p 3.7p Return on tangible equity (1) 6.8% 5.3% (3.8%) 15.8% 5.4% Average tangible equity £34bn £34bn £33bn £34bn £33bn Average number of ordinary shares outstanding during the period (millions) - basic 12,064 11,998 12,075 12,069 12,034 - fully diluted (2) 12,099 12,053 12,106 12,104 12,083
30 September 30 June 31 December Balance sheet key metrics and ratios 2019 2019 2018 Total assets £776.5bn £729.9bn £694.2bn Funded assets (1) £600.7bn £584.3bn £560.9bn Loans to customers - amortised cost £319.5bn £310.6bn £305.1bn Impairment provisions £3.3bn £3.2bn £3.3bn Customer deposits £369.7bn £361.6bn £360.9bn
Liquidity coverage ratio (LCR) 148% 154% 158% Liquidity portfolio £193bn £203bn £198bn Net stable funding ratio (NSFR) (3) 140% 140% 141% Loan:deposit ratio (1) 86% 86% 85% Total wholesale funding £78bn £78bn £74bn Short-term wholesale funding £19bn £19bn £15bn
Common Equity Tier (CET1) ratio 15.7% 16.0% 16.2% Total capital ratio 20.5% 20.9% 21.8% Pro forma CET 1 ratio, pre dividend accrual (4) 15.9% 17.1% 16.9% Risk-weighted assets (RWAs) £189.5bn £188.5bn £188.7bn CRR leverage ratio 5.0% 5.2% 5.4% UK leverage ratio 5.7% 5.9% 6.2%
Tangible net asset value (TNAV) per ordinary share 272p 290p 287p Tangible net asset value (TNAV) per ordinary share - fully diluted (1,2) 272p 289p 286p Tangible equity £32,930m £35,036m £34,566m Number of ordinary shares in issue (millions) 12,094 12,091 12,049 Number of ordinary shares in issue (millions) - fully diluted (2,5) 12,124 12,124 12,088 Notes: (1) Refer to the Appendix for details of basis of preparation and reconciliation of non-IFRS financial and performance measures. (2) Includes the effect of dilutive share options and convertible securities. Dilutive shares on an average basis for Q3 2019 were 31 million shares and for nine
months ended 30 September 2019 were 35 million shares; (Q2 2019 - 35 million shares, Q3 2018 - 49 million shares; nine months ended 30 September 2018 - 55 million shares), and as at 30 September 2019 were 30 million shares (30 June 2019 - 33 million shares; 31 December 2018 - 39 million shares).
(3) NSFR reported in line with CRR2 regulations finalised in June 2019. (4) The pro forma CET 1 ratio at 30 September 2019 excluded a charge of £362 million (3p per share) for a foreseeable dividend. 30 June 2019 excluded a charge
of £241 million (2p per share) for the interim dividend, a special dividend of £1,449 million (12p per share) and a foreseeable dividend related to interim profits of £363 million (3p per share). 31 December 2018 excluded a charge of £422 million (3.5p per share) for the final dividend and £904 million (7.5p per share) for the special dividend paid following the Annual General Meeting held on 25 April 2019.
(5) Includes 16 million treasury shares (30 June 2019 - 17 million shares; 31 December 2018 - 8 million shares).
Re-segmentation Refer to Note 1 for details of re-segmentation effective from 1 January 2019 and re-stated comparatives. Non-IFRS financial measures This document contains a number of non-IFRS financial measures and performance metrics not defined under IFRS. For details of the basis of preparation and reconciliations where appropriate refer to the Appendix.
3 RBS – Q3 2019 Results
Summary consolidated income statement for the period ended 30 September 2019
Nine months ended Quarter ended
30 September 30 September 30 September 30 June 30 September 2019 2018* 2019 2019 2018*
£m £m £m £m £m
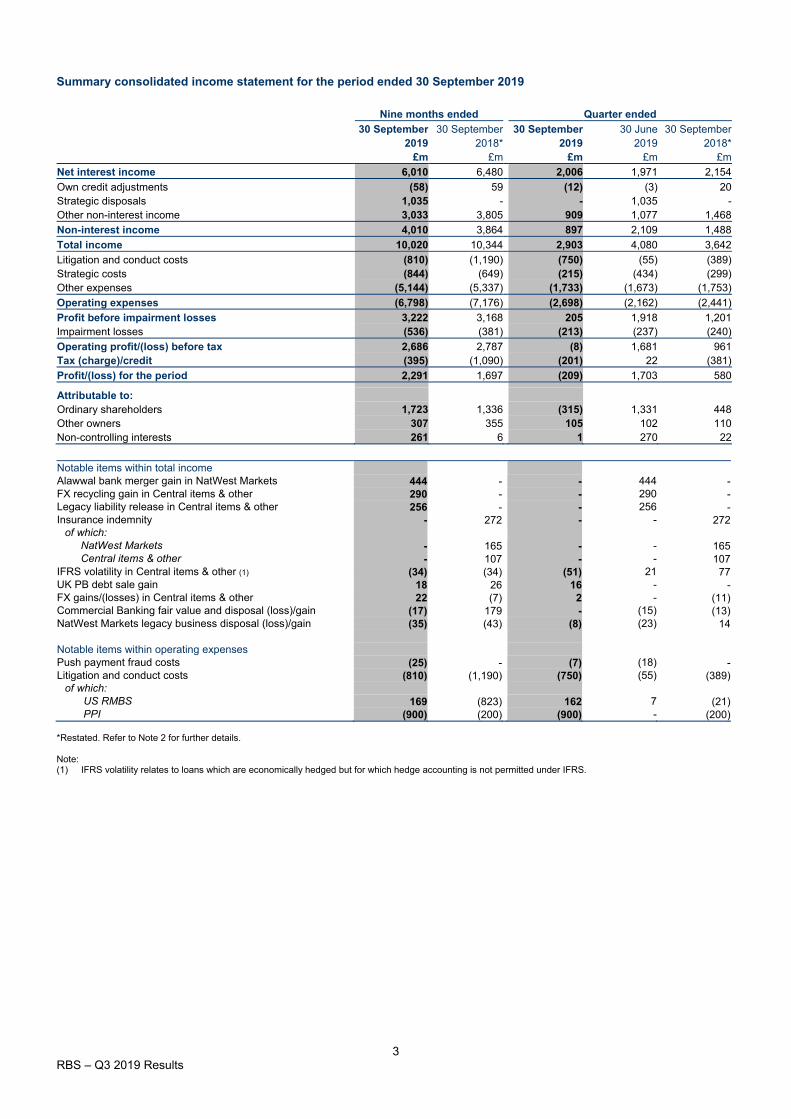
Net interest income 6,010 6,480 2,006 1,971 2,154
Own credit adjustments (58) 59 (12) (3) 20 Strategic disposals 1,035 - - 1,035 - Other non-interest income 3,033 3,805 909 1,077 1,468
Non-interest income 4,010 3,864 897 2,109 1,488
Total income 10,020 10,344 2,903 4,080 3,642
Litigation and conduct costs (810) (1,190) (750) (55) (389) Strategic costs (844) (649) (215) (434) (299) Other expenses (5,144) (5,337) (1,733) (1,673) (1,753)
Operating expenses (6,798) (7,176) (2,698) (2,162) (2,441)
Profit before impairment losses 3,222 3,168 205 1,918 1,201 Impairment losses (536) (381) (213) (237) (240)
Operating profit/(loss) before tax 2,686 2,787 (8) 1,681 961 Tax (charge)/credit (395) (1,090) (201) 22 (381)
Profit/(loss) for the period 2,291 1,697 (209) 1,703 580
Attributable to: Ordinary shareholders 1,723 1,336 (315) 1,331 448 Other owners 307 355 105 102 110 Non-controlling interests 261 6 1 270 22 Notable items within total income Alawwal bank merger gain in NatWest Markets 444 - - 444 - FX recycling gain in Central items & other 290 - - 290 - Legacy liability release in Central items & other 256 - - 256 - Insurance indemnity - 272 - - 272 of which: NatWest Markets - 165 - - 165 Central items & other - 107 - - 107 IFRS volatility in Central items & other (1) (34) (34) (51) 21 77 UK PB debt sale gain 18 26 16 - - FX gains/(losses) in Central items & other 22 (7) 2 - (11) Commercial Banking fair value and disposal (loss)/gain (17) 179 - (15) (13) NatWest Markets legacy business disposal (loss)/gain (35) (43) (8) (23) 14
Notable items within operating expenses Push payment fraud costs (25) - (7) (18) - Litigation and conduct costs (810) (1,190) (750) (55) (389) of which: US RMBS 169 (823) 162 7 (21) PPI (900) (200) (900) - (200) *Restated. Refer to Note 2 for further details. Note: (1) IFRS volatility relates to loans which are economically hedged but for which hedge accounting is not permitted under IFRS.
4 RBS – Q3 2019 Results
Business performance summary Personal & Ulster UK Personal Banking
Quarter ended As at 30 September 30 June 30 September 30 September 30 June 31 December
2019 2019 2018 2019 2019 2018 £m £m £m £bn £bn £bn
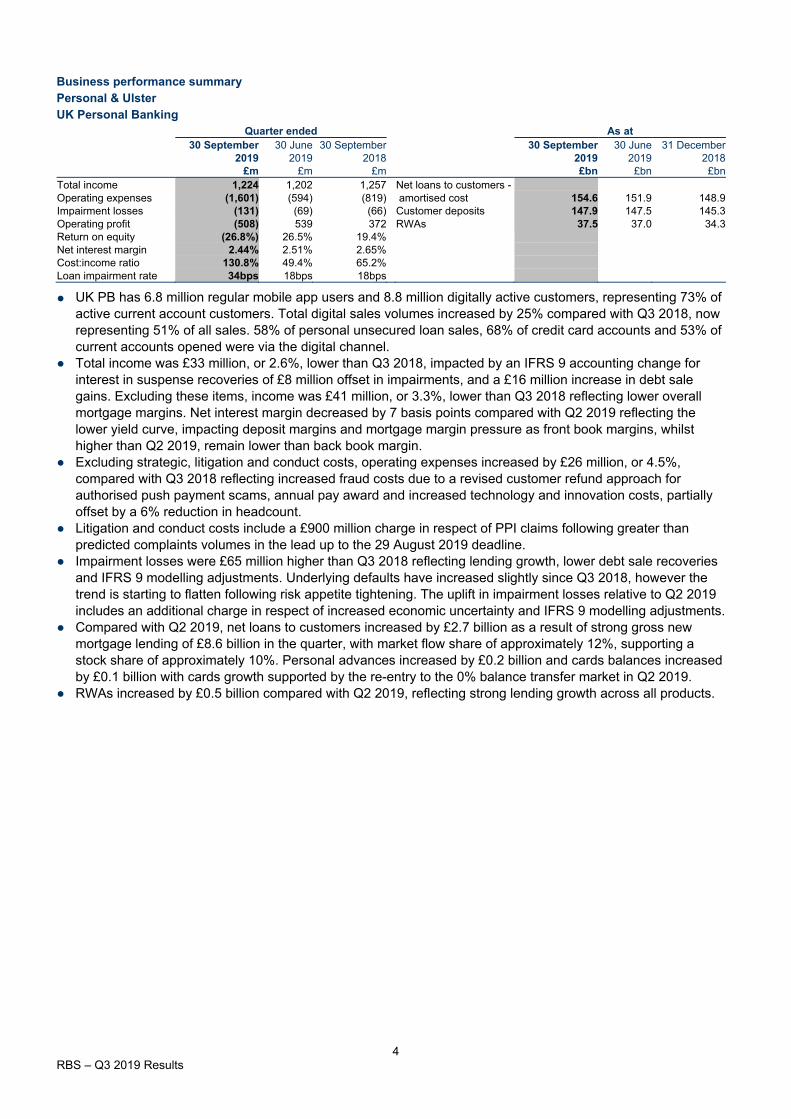
Total income 1,224 1,202 1,257 Net loans to customers - Operating expenses (1,601) (594) (819) amortised cost 154.6 151.9 148.9 Impairment losses (131) (69) (66) Customer deposits 147.9 147.5 145.3 Operating profit (508) 539 372 RWAs 37.5 37.0 34.3 Return on equity (26.8%) 26.5% 19.4% Net interest margin 2.44% 2.51% 2.65% Cost:income ratio 130.8% 49.4% 65.2% Loan impairment rate 34bps 18bps 18bps
●
UK PB has 6.8 million regular mobile app users and 8.8 million digitally active customers, representing 73% of active current account customers. Total digital sales volumes increased by 25% compared with Q3 2018, now representing 51% of all sales. 58% of personal unsecured loan sales, 68% of credit card accounts and 53% of current accounts opened were via the digital channel.
● Total income was £33 million, or 2.6%, lower than Q3 2018, impacted by an IFRS 9 accounting change for interest in suspense recoveries of £8 million offset in impairments, and a £16 million increase in debt sale gains. Excluding these items, income was £41 million, or 3.3%, lower than Q3 2018 reflecting lower overall mortgage margins. Net interest margin decreased by 7 basis points compared with Q2 2019 reflecting the lower yield curve, impacting deposit margins and mortgage margin pressure as front book margins, whilst higher than Q2 2019, remain lower than back book margin.
● Excluding strategic, litigation and conduct costs, operating expenses increased by £26 million, or 4.5%, compared with Q3 2018 reflecting increased fraud costs due to a revised customer refund approach for authorised push payment scams, annual pay award and increased technology and innovation costs, partially offset by a 6% reduction in headcount.
● Litigation and conduct costs include a £900 million charge in respect of PPI claims following greater than predicted complaints volumes in the lead up to the 29 August 2019 deadline.
● Impairment losses were £65 million higher than Q3 2018 reflecting lending growth, lower debt sale recoveries and IFRS 9 modelling adjustments. Underlying defaults have increased slightly since Q3 2018, however the trend is starting to flatten following risk appetite tightening. The uplift in impairment losses relative to Q2 2019 includes an additional charge in respect of increased economic uncertainty and IFRS 9 modelling adjustments.
● Compared with Q2 2019, net loans to customers increased by £2.7 billion as a result of strong gross new mortgage lending of £8.6 billion in the quarter, with market flow share of approximately 12%, supporting a stock share of approximately 10%. Personal advances increased by £0.2 billion and cards balances increased by £0.1 billion with cards growth supported by the re-entry to the 0% balance transfer market in Q2 2019.
● RWAs increased by £0.5 billion compared with Q2 2019, reflecting strong lending growth across all products.
5 RBS – Q3 2019 Results
Business performance summary Personal & Ulster Ulster Bank RoI
Quarter ended As at 30 September 30 June 30 September 30 September 30 June 31 December
2019 2019 2018 2019 2019 2018 €m €m €m €bn €bn €bn
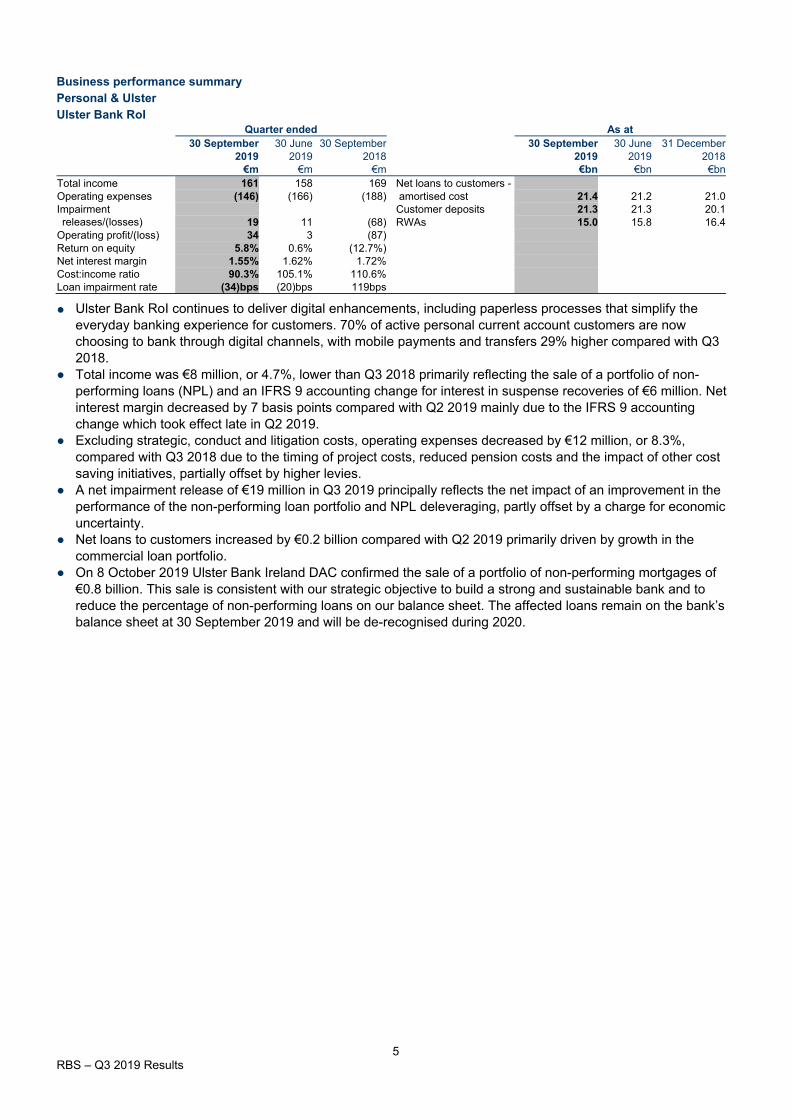
Total income 161 158 169 Net loans to customers - Operating expenses (146) (166) (188) amortised cost 21.4 21.2 21.0 Impairment Customer deposits 21.3 21.3 20.1 releases/(losses) 19 11 (68) RWAs 15.0 15.8 16.4 Operating profit/(loss) 34 3 (87) Return on equity 5.8% 0.6% (12.7%) Net interest margin 1.55% 1.62% 1.72% Cost:income ratio 90.3% 105.1% 110.6% Loan impairment rate (34)bps (20)bps 119bps
●
Ulster Bank RoI continues to deliver digital enhancements, including paperless processes that simplify the everyday banking experience for customers. 70% of active personal current account customers are now choosing to bank through digital channels, with mobile payments and transfers 29% higher compared with Q3 2018.
● Total income was €8 million, or 4.7%, lower than Q3 2018 primarily reflecting the sale of a portfolio of non-performing loans (NPL) and an IFRS 9 accounting change for interest in suspense recoveries of €6 million. Net interest margin decreased by 7 basis points compared with Q2 2019 mainly due to the IFRS 9 accounting change which took effect late in Q2 2019.
● Excluding strategic, conduct and litigation costs, operating expenses decreased by €12 million, or 8.3%, compared with Q3 2018 due to the timing of project costs, reduced pension costs and the impact of other cost saving initiatives, partially offset by higher levies.
● A net impairment release of €19 million in Q3 2019 principally reflects the net impact of an improvement in the performance of the non-performing loan portfolio and NPL deleveraging, partly offset by a charge for economic uncertainty.
● Net loans to customers increased by €0.2 billion compared with Q2 2019 primarily driven by growth in the commercial loan portfolio.
● On 8 October 2019 Ulster Bank Ireland DAC confirmed the sale of a portfolio of non-performing mortgages of €0.8 billion. This sale is consistent with our strategic objective to build a strong and sustainable bank and to reduce the percentage of non-performing loans on our balance sheet. The affected loans remain on the bank’s balance sheet at 30 September 2019 and will be de-recognised during 2020.
6 RBS – Q3 2019 Results
Business performance summary Commercial & Private Banking Commercial Banking
Quarter ended As at 30 September 30 June 30 September 30 September 30 June 31 December
2019 2019 2018 2019 2019 2018 £m £m £m £bn £bn £bn
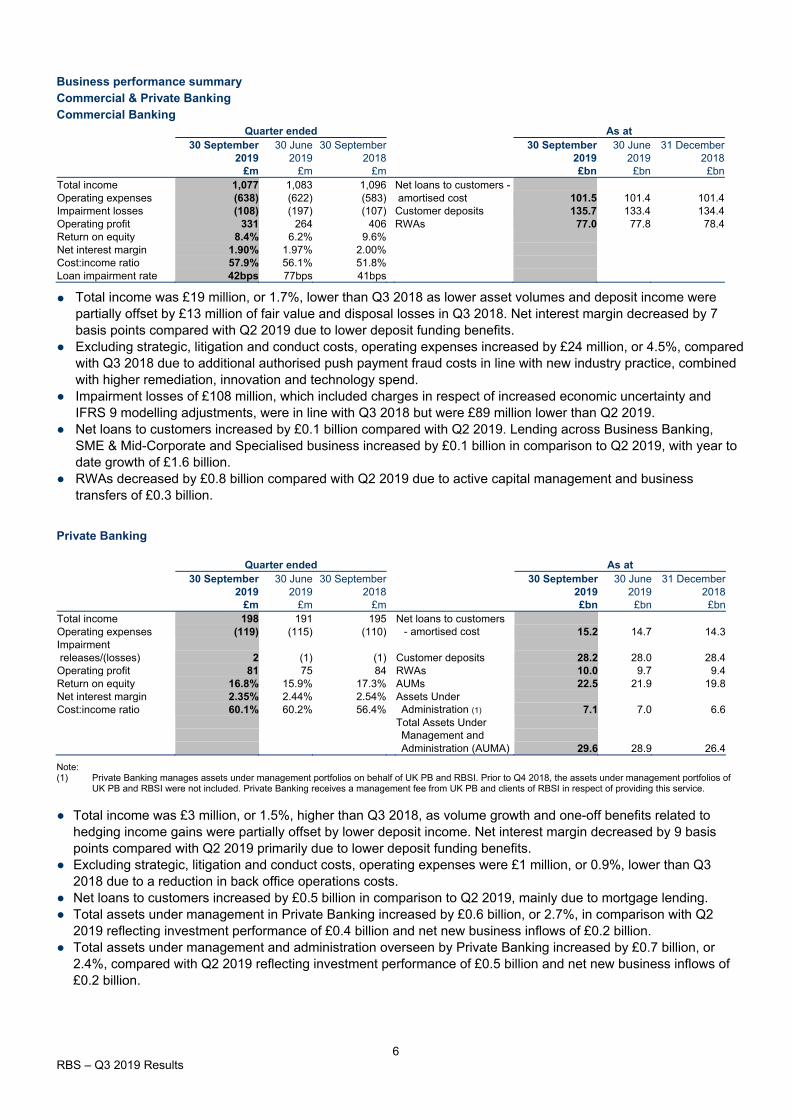
Total income 1,077 1,083 1,096 Net loans to customers - Operating expenses (638) (622) (583) amortised cost 101.5 101.4 101.4 Impairment losses (108) (197) (107) Customer deposits 135.7 133.4 134.4 Operating profit 331 264 406 RWAs 77.0 77.8 78.4 Return on equity 8.4% 6.2% 9.6% Net interest margin 1.90% 1.97% 2.00% Cost:income ratio 57.9% 56.1% 51.8% Loan impairment rate 42bps 77bps 41bps
●
Total income was £19 million, or 1.7%, lower than Q3 2018 as lower asset volumes and deposit income were partially offset by £13 million of fair value and disposal losses in Q3 2018. Net interest margin decreased by 7 basis points compared with Q2 2019 due to lower deposit funding benefits.
● Excluding strategic, litigation and conduct costs, operating expenses increased by £24 million, or 4.5%, compared with Q3 2018 due to additional authorised push payment fraud costs in line with new industry practice, combined with higher remediation, innovation and technology spend.
● Impairment losses of £108 million, which included charges in respect of increased economic uncertainty and IFRS 9 modelling adjustments, were in line with Q3 2018 but were £89 million lower than Q2 2019.
● Net loans to customers increased by £0.1 billion compared with Q2 2019. Lending across Business Banking, SME & Mid-Corporate and Specialised business increased by £0.1 billion in comparison to Q2 2019, with year to date growth of £1.6 billion.
● RWAs decreased by £0.8 billion compared with Q2 2019 due to active capital management and business transfers of £0.3 billion.
Private Banking
Quarter ended As at 30 September 30 June 30 September 30 September 30 June 31 December
2019 2019 2018 2019 2019 2018 £m £m £m £bn £bn £bn
Total income 198 191 195 Net loans to customers Operating expenses (119) (115) (110) - amortised cost 15.2 14.7 14.3 Impairment releases/(losses) 2 (1) (1) Customer deposits 28.2 28.0 28.4 Operating profit 81 75 84 RWAs 10.0 9.7 9.4 Return on equity 16.8% 15.9% 17.3% AUMs 22.5 21.9 19.8 Net interest margin 2.35% 2.44% 2.54% Assets Under Cost:income ratio 60.1% 60.2% 56.4% Administration (1) 7.1 7.0 6.6
Total Assets Under Management and Administration (AUMA) 29.6 28.9 26.4
Note: (1) Private Banking manages assets under management portfolios on behalf of UK PB and RBSI. Prior to Q4 2018, the assets under management portfolios of
UK PB and RBSI were not included. Private Banking receives a management fee from UK PB and clients of RBSI in respect of providing this service.
● Total income was £3 million, or 1.5%, higher than Q3 2018, as volume growth and one-off benefits related to
hedging income gains were partially offset by lower deposit income. Net interest margin decreased by 9 basis points compared with Q2 2019 primarily due to lower deposit funding benefits.
● Excluding strategic, litigation and conduct costs, operating expenses were £1 million, or 0.9%, lower than Q3 2018 due to a reduction in back office operations costs.
● Net loans to customers increased by £0.5 billion in comparison to Q2 2019, mainly due to mortgage lending. ● Total assets under management in Private Banking increased by £0.6 billion, or 2.7%, in comparison with Q2
2019 reflecting investment performance of £0.4 billion and net new business inflows of £0.2 billion. ● Total assets under management and administration overseen by Private Banking increased by £0.7 billion, or
2.4%, compared with Q2 2019 reflecting investment performance of £0.5 billion and net new business inflows of £0.2 billion.
7 RBS – Q3 2019 Results
Business performance summary RBS International
Quarter ended As at 30 September 30 June 30 September 30 September 30 June 31 December
2019 2019 2018 2019 2019 2018 £m £m £m £bn £bn £bn
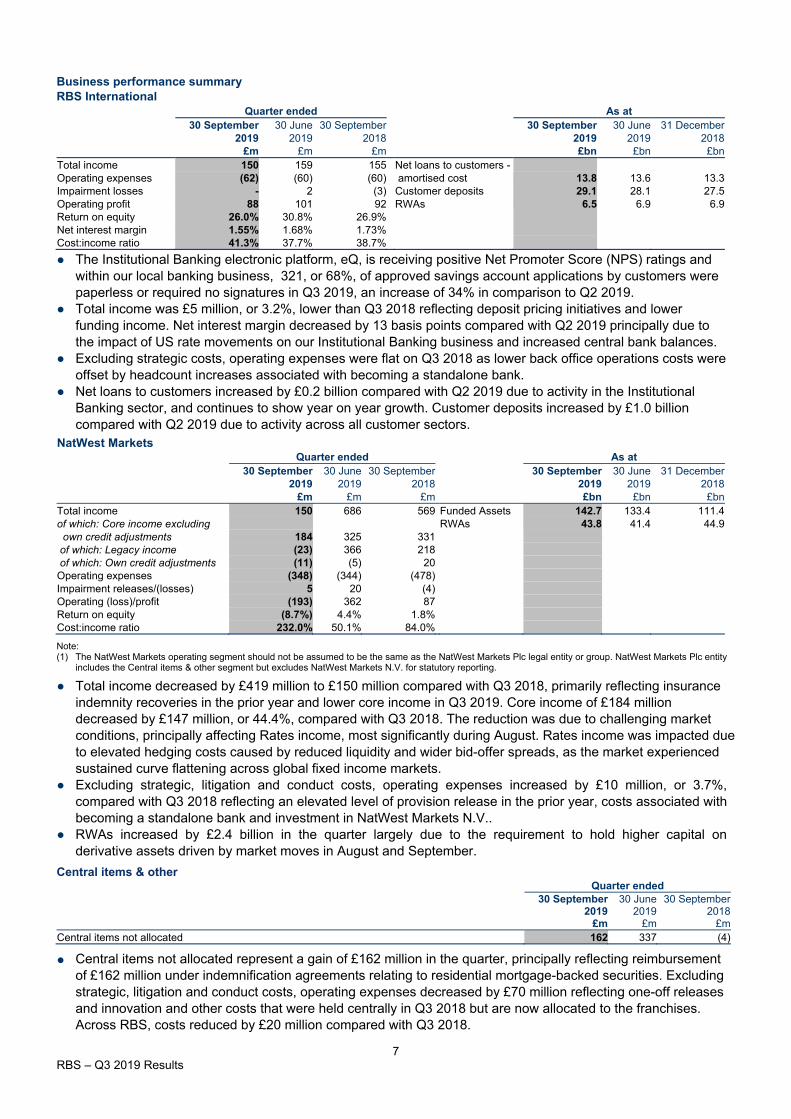
Total income 150 159 155 Net loans to customers - Operating expenses (62) (60) (60) amortised cost 13.8 13.6 13.3 Impairment losses - 2 (3) Customer deposits 29.1 28.1 27.5 Operating profit 88 101 92 RWAs 6.5 6.9 6.9 Return on equity 26.0% 30.8% 26.9% Net interest margin 1.55% 1.68% 1.73% Cost:income ratio 41.3% 37.7% 38.7%
●
The Institutional Banking electronic platform, eQ, is receiving positive Net Promoter Score (NPS) ratings and within our local banking business, 321, or 68%, of approved savings account applications by customers were paperless or required no signatures in Q3 2019, an increase of 34% in comparison to Q2 2019.
● Total income was £5 million, or 3.2%, lower than Q3 2018 reflecting deposit pricing initiatives and lower funding income. Net interest margin decreased by 13 basis points compared with Q2 2019 principally due to the impact of US rate movements on our Institutional Banking business and increased central bank balances.
● Excluding strategic costs, operating expenses were flat on Q3 2018 as lower back office operations costs were offset by headcount increases associated with becoming a standalone bank.
● Net loans to customers increased by £0.2 billion compared with Q2 2019 due to activity in the Institutional Banking sector, and continues to show year on year growth. Customer deposits increased by £1.0 billion compared with Q2 2019 due to activity across all customer sectors.
NatWest Markets Quarter ended As at
30 September 30 June 30 September 30 September 30 June 31 December 2019 2019 2018 2019 2019 2018
£m £m £m £bn £bn £bn Total income 150 686 569 Funded Assets 142.7 133.4 111.4 of which: Core income excluding RWAs 43.8 41.4 44.9 own credit adjustments 184 325 331 of which: Legacy income (23) 366 218 of which: Own credit adjustments (11) (5) 20 Operating expenses (348) (344) (478) Impairment releases/(losses) 5 20 (4) Operating (loss)/profit (193) 362 87 Return on equity (8.7%) 4.4% 1.8% Cost:income ratio 232.0% 50.1% 84.0%
Note: (1) The NatWest Markets operating segment should not be assumed to be the same as the NatWest Markets Plc legal entity or group. NatWest Markets Plc entity
includes the Central items & other segment but excludes NatWest Markets N.V. for statutory reporting.
● Total income decreased by £419 million to £150 million compared with Q3 2018, primarily reflecting insurance indemnity recoveries in the prior year and lower core income in Q3 2019. Core income of £184 million decreased by £147 million, or 44.4%, compared with Q3 2018. The reduction was due to challenging market conditions, principally affecting Rates income, most significantly during August. Rates income was impacted due to elevated hedging costs caused by reduced liquidity and wider bid-offer spreads, as the market experienced sustained curve flattening across global fixed income markets.
● Excluding strategic, litigation and conduct costs, operating expenses increased by £10 million, or 3.7%, compared with Q3 2018 reflecting an elevated level of provision release in the prior year, costs associated with becoming a standalone bank and investment in NatWest Markets N.V..
● RWAs increased by £2.4 billion in the quarter largely due to the requirement to hold higher capital on derivative assets driven by market moves in August and September.
Central items & other Quarter ended
30 September 30 June 30 September 2019 2019 2018
£m £m £m Central items not allocated 162 337 (4)
●
Central items not allocated represent a gain of £162 million in the quarter, principally reflecting reimbursement of £162 million under indemnification agreements relating to residential mortgage-backed securities. Excluding strategic, litigation and conduct costs, operating expenses decreased by £70 million reflecting one-off releases and innovation and other costs that were held centrally in Q3 2018 but are now allocated to the franchises. Across RBS, costs reduced by £20 million compared with Q3 2018.
8 RBS – Q3 2019 Results
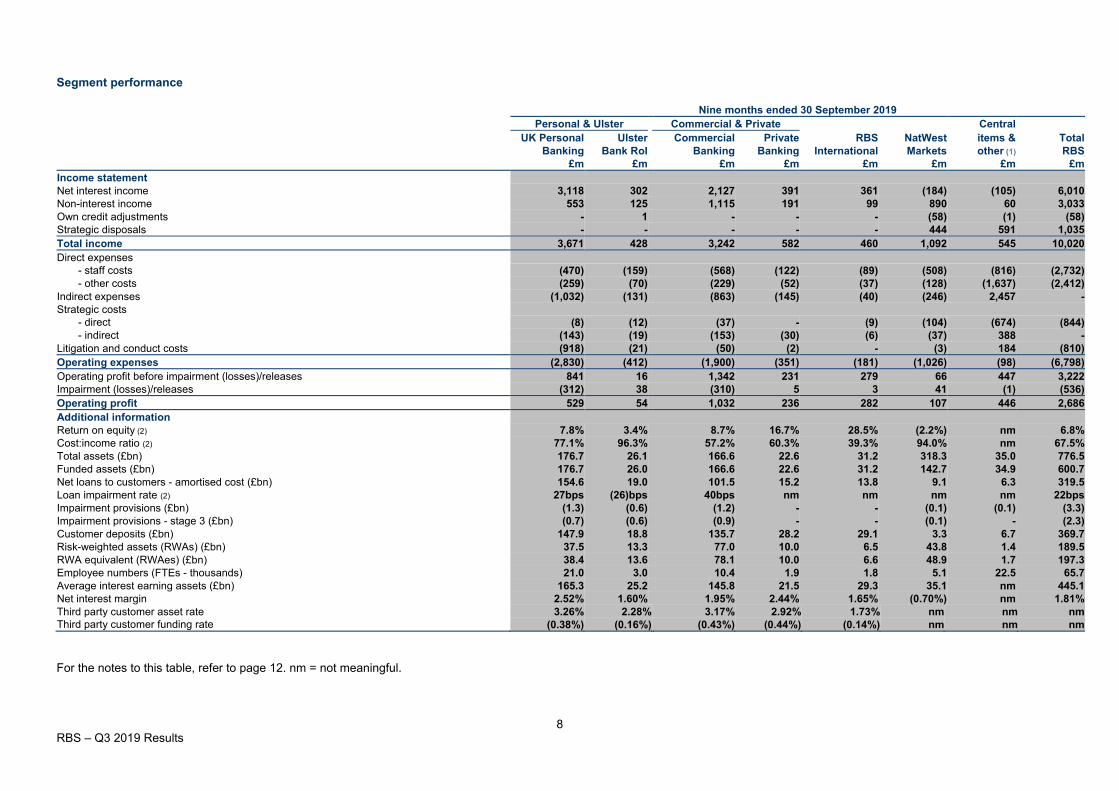
Segment performance
Nine months ended 30 September 2019 Personal & Ulster Commercial & Private Central
UK Personal Ulster Commercial Private RBS NatWest items & Total Banking Bank RoI Banking Banking International Markets other (1) RBS
£m £m £m £m £m £m £m £m Income statement Net interest income 3,118 302 2,127 391 361 (184) (105) 6,010 Non-interest income 553 125 1,115 191 99 890 60 3,033 Own credit adjustments - 1 - - - (58) (1) (58) Strategic disposals - - - - - 444 591 1,035 Total income 3,671 428 3,242 582 460 1,092 545 10,020 Direct expenses
- staff costs (470) (159) (568) (122) (89) (508) (816) (2,732) - other costs (259) (70) (229) (52) (37) (128) (1,637) (2,412)
Indirect expenses (1,032) (131) (863) (145) (40) (246) 2,457 - Strategic costs
- direct (8) (12) (37) - (9) (104) (674) (844) - indirect (143) (19) (153) (30) (6) (37) 388 -
Litigation and conduct costs (918) (21) (50) (2) - (3) 184 (810) Operating expenses (2,830) (412) (1,900) (351) (181) (1,026) (98) (6,798) Operating profit before impairment (losses)/releases 841 16 1,342 231 279 66 447 3,222 Impairment (losses)/releases (312) 38 (310) 5 3 41 (1) (536) Operating profit 529 54 1,032 236 282 107 446 2,686 Additional information Return on equity (2) 7.8% 3.4% 8.7% 16.7% 28.5% (2.2%) nm 6.8% Cost:income ratio (2) 77.1% 96.3% 57.2% 60.3% 39.3% 94.0% nm 67.5% Total assets (£bn) 176.7 26.1 166.6 22.6 31.2 318.3 35.0 776.5 Funded assets (£bn) 176.7 26.0 166.6 22.6 31.2 142.7 34.9 600.7 Net loans to customers - amortised cost (£bn) 154.6 19.0 101.5 15.2 13.8 9.1 6.3 319.5 Loan impairment rate (2) 27bps (26)bps 40bps nm nm nm nm 22bps Impairment provisions (£bn) (1.3) (0.6) (1.2) - - (0.1) (0.1) (3.3) Impairment provisions - stage 3 (£bn) (0.7) (0.6) (0.9) - - (0.1) - (2.3) Customer deposits (£bn) 147.9 18.8 135.7 28.2 29.1 3.3 6.7 369.7 Risk-weighted assets (RWAs) (£bn) 37.5 13.3 77.0 10.0 6.5 43.8 1.4 189.5 RWA equivalent (RWAes) (£bn) 38.4 13.6 78.1 10.0 6.6 48.9 1.7 197.3 Employee numbers (FTEs - thousands) 21.0 3.0 10.4 1.9 1.8 5.1 22.5 65.7 Average interest earning assets (£bn) 165.3 25.2 145.8 21.5 29.3 35.1 nm 445.1 Net interest margin 2.52% 1.60% 1.95% 2.44% 1.65% (0.70%) nm 1.81% Third party customer asset rate 3.26% 2.28% 3.17% 2.92% 1.73% nm nm nm Third party customer funding rate (0.38%) (0.16%) (0.43%) (0.44%) (0.14%) nm nm nm
For the notes to this table, refer to page 12. nm = not meaningful.
9 RBS – Q3 2019 Results
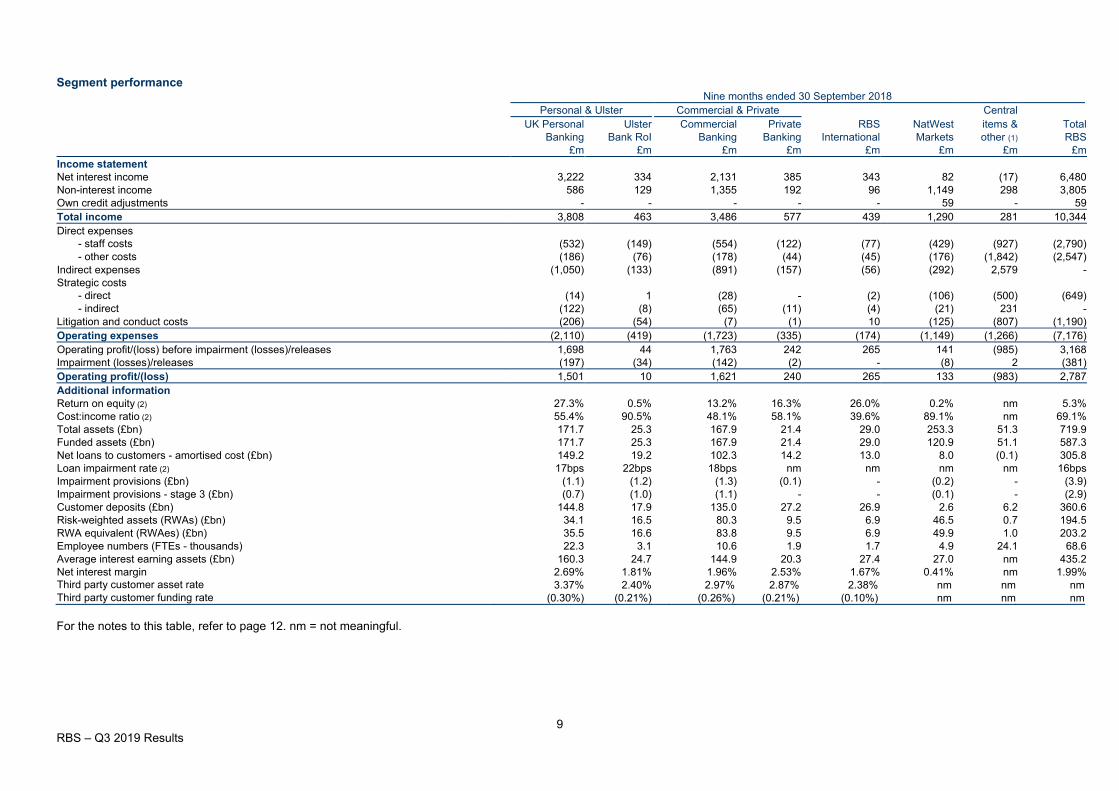
Segment performance Nine months ended 30 September 2018
Personal & Ulster Commercial & Private Central UK Personal Ulster Commercial Private RBS NatWest items & Total
Banking Bank RoI Banking Banking International Markets other (1) RBS £m £m £m £m £m £m £m £m
Income statement Net interest income 3,222 334 2,131 385 343 82 (17) 6,480 Non-interest income 586 129 1,355 192 96 1,149 298 3,805 Own credit adjustments - - - - - 59 - 59 Total income 3,808 463 3,486 577 439 1,290 281 10,344 Direct expenses
- staff costs (532) (149) (554) (122) (77) (429) (927) (2,790) - other costs (186) (76) (178) (44) (45) (176) (1,842) (2,547)
Indirect expenses (1,050) (133) (891) (157) (56) (292) 2,579 - Strategic costs
- direct (14) 1 (28) - (2) (106) (500) (649) - indirect (122) (8) (65) (11) (4) (21) 231 -
Litigation and conduct costs (206) (54) (7) (1) 10 (125) (807) (1,190) Operating expenses (2,110) (419) (1,723) (335) (174) (1,149) (1,266) (7,176) Operating profit/(loss) before impairment (losses)/releases 1,698 44 1,763 242 265 141 (985) 3,168 Impairment (losses)/releases (197) (34) (142) (2) - (8) 2 (381) Operating profit/(loss) 1,501 10 1,621 240 265 133 (983) 2,787 Additional information Return on equity (2) 27.3% 0.5% 13.2% 16.3% 26.0% 0.2% nm 5.3% Cost:income ratio (2) 55.4% 90.5% 48.1% 58.1% 39.6% 89.1% nm 69.1% Total assets (£bn) 171.7 25.3 167.9 21.4 29.0 253.3 51.3 719.9 Funded assets (£bn) 171.7 25.3 167.9 21.4 29.0 120.9 51.1 587.3 Net loans to customers - amortised cost (£bn) 149.2 19.2 102.3 14.2 13.0 8.0 (0.1) 305.8 Loan impairment rate (2) 17bps 22bps 18bps nm nm nm nm 16bps Impairment provisions (£bn) (1.1) (1.2) (1.3) (0.1) - (0.2) - (3.9) Impairment provisions - stage 3 (£bn) (0.7) (1.0) (1.1) - - (0.1) - (2.9) Customer deposits (£bn) 144.8 17.9 135.0 27.2 26.9 2.6 6.2 360.6 Risk-weighted assets (RWAs) (£bn) 34.1 16.5 80.3 9.5 6.9 46.5 0.7 194.5 RWA equivalent (RWAes) (£bn) 35.5 16.6 83.8 9.5 6.9 49.9 1.0 203.2 Employee numbers (FTEs - thousands) 22.3 3.1 10.6 1.9 1.7 4.9 24.1 68.6 Average interest earning assets (£bn) 160.3 24.7 144.9 20.3 27.4 27.0 nm 435.2 Net interest margin 2.69% 1.81% 1.96% 2.53% 1.67% 0.41% nm 1.99% Third party customer asset rate 3.37% 2.40% 2.97% 2.87% 2.38% nm nm nm Third party customer funding rate (0.30%) (0.21%) (0.26%) (0.21%) (0.10%) nm nm nm
For the notes to this table, refer to page 12. nm = not meaningful.
10 RBS – Q3 2019 Results
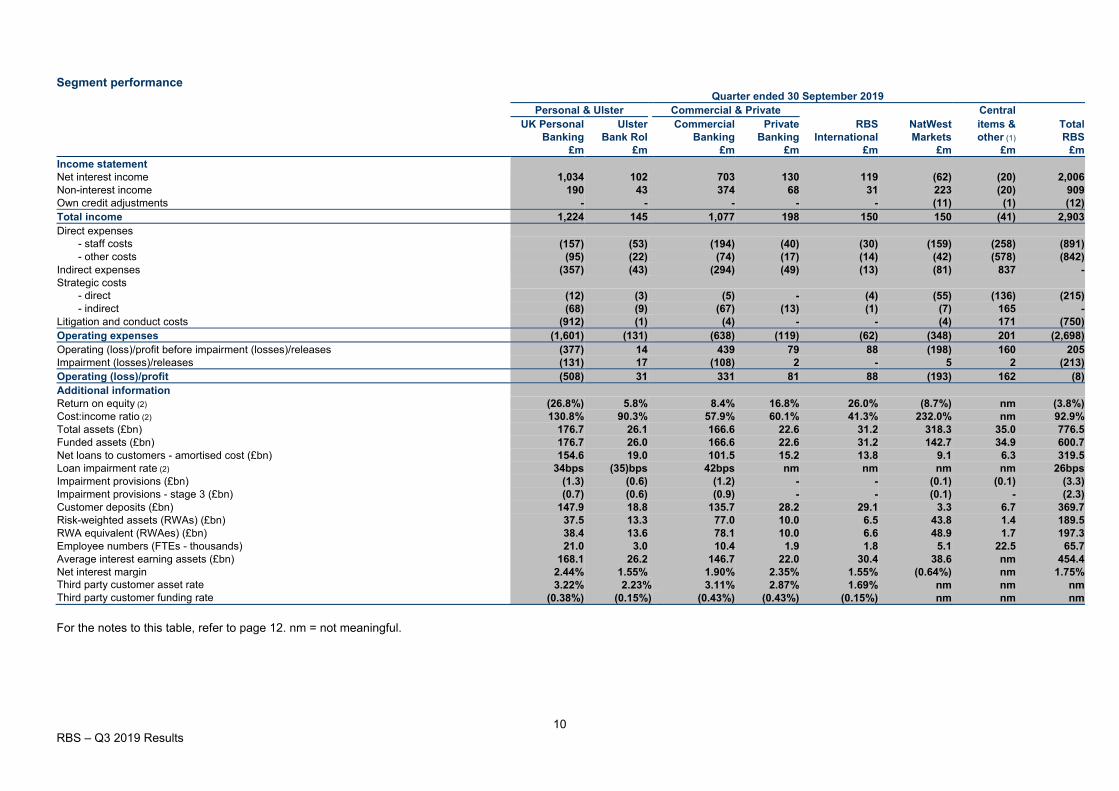
Segment performance Quarter ended 30 September 2019
Personal & Ulster Commercial & Private Central UK Personal Ulster Commercial Private RBS NatWest items & Total
Banking Bank RoI Banking Banking International Markets other (1) RBS £m £m £m £m £m £m £m £m
Income statement Net interest income 1,034 102 703 130 119 (62) (20) 2,006 Non-interest income 190 43 374 68 31 223 (20) 909 Own credit adjustments - - - - - (11) (1) (12) Total income 1,224 145 1,077 198 150 150 (41) 2,903 Direct expenses
- staff costs (157) (53) (194) (40) (30) (159) (258) (891) - other costs (95) (22) (74) (17) (14) (42) (578) (842)
Indirect expenses (357) (43) (294) (49) (13) (81) 837 - Strategic costs
- direct (12) (3) (5) - (4) (55) (136) (215) - indirect (68) (9) (67) (13) (1) (7) 165 -
Litigation and conduct costs (912) (1) (4) - - (4) 171 (750) Operating expenses (1,601) (131) (638) (119) (62) (348) 201 (2,698) Operating (loss)/profit before impairment (losses)/releases (377) 14 439 79 88 (198) 160 205 Impairment (losses)/releases (131) 17 (108) 2 - 5 2 (213) Operating (loss)/profit (508) 31 331 81 88 (193) 162 (8) Additional information Return on equity (2) (26.8%) 5.8% 8.4% 16.8% 26.0% (8.7%) nm (3.8%) Cost:income ratio (2) 130.8% 90.3% 57.9% 60.1% 41.3% 232.0% nm 92.9% Total assets (£bn) 176.7 26.1 166.6 22.6 31.2 318.3 35.0 776.5 Funded assets (£bn) 176.7 26.0 166.6 22.6 31.2 142.7 34.9 600.7 Net loans to customers - amortised cost (£bn) 154.6 19.0 101.5 15.2 13.8 9.1 6.3 319.5 Loan impairment rate (2) 34bps (35)bps 42bps nm nm nm nm 26bps Impairment provisions (£bn) (1.3) (0.6) (1.2) - - (0.1) (0.1) (3.3) Impairment provisions - stage 3 (£bn) (0.7) (0.6) (0.9) - - (0.1) - (2.3) Customer deposits (£bn) 147.9 18.8 135.7 28.2 29.1 3.3 6.7 369.7 Risk-weighted assets (RWAs) (£bn) 37.5 13.3 77.0 10.0 6.5 43.8 1.4 189.5 RWA equivalent (RWAes) (£bn) 38.4 13.6 78.1 10.0 6.6 48.9 1.7 197.3 Employee numbers (FTEs - thousands) 21.0 3.0 10.4 1.9 1.8 5.1 22.5 65.7 Average interest earning assets (£bn) 168.1 26.2 146.7 22.0 30.4 38.6 nm 454.4 Net interest margin 2.44% 1.55% 1.90% 2.35% 1.55% (0.64%) nm 1.75% Third party customer asset rate 3.22% 2.23% 3.11% 2.87% 1.69% nm nm nm Third party customer funding rate (0.38%) (0.15%) (0.43%) (0.43%) (0.15%) nm nm nm For the notes to this table, refer to page 12. nm = not meaningful.
11 RBS – Q3 2019 Results
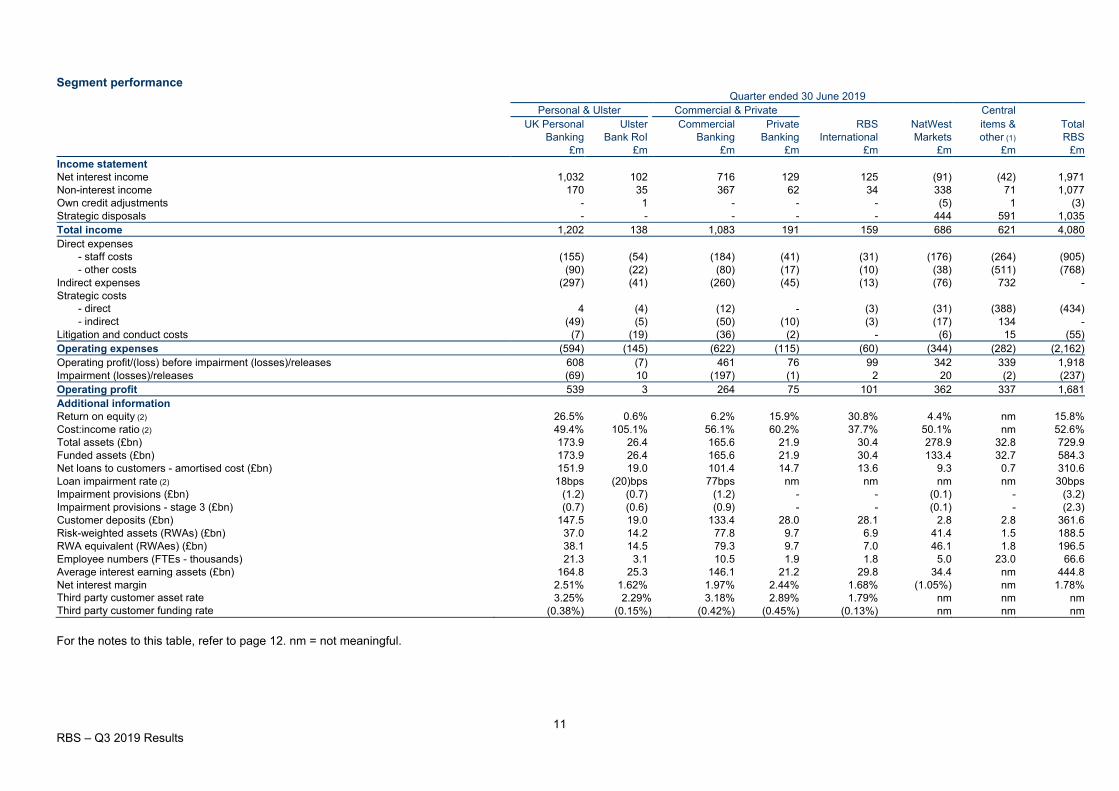
Segment performance Quarter ended 30 June 2019
Personal & Ulster Commercial & Private Central UK Personal Ulster Commercial Private RBS NatWest items & Total
Banking Bank RoI Banking Banking International Markets other (1) RBS £m £m £m £m £m £m £m £m
Income statement Net interest income 1,032 102 716 129 125 (91) (42) 1,971 Non-interest income 170 35 367 62 34 338 71 1,077 Own credit adjustments - 1 - - - (5) 1 (3) Strategic disposals - - - - - 444 591 1,035 Total income 1,202 138 1,083 191 159 686 621 4,080 Direct expenses
- staff costs (155) (54) (184) (41) (31) (176) (264) (905) - other costs (90) (22) (80) (17) (10) (38) (511) (768)
Indirect expenses (297) (41) (260) (45) (13) (76) 732 - Strategic costs
- direct 4 (4) (12) - (3) (31) (388) (434) - indirect (49) (5) (50) (10) (3) (17) 134 -
Litigation and conduct costs (7) (19) (36) (2) - (6) 15 (55) Operating expenses (594) (145) (622) (115) (60) (344) (282) (2,162) Operating profit/(loss) before impairment (losses)/releases 608 (7) 461 76 99 342 339 1,918 Impairment (losses)/releases (69) 10 (197) (1) 2 20 (2) (237) Operating profit 539 3 264 75 101 362 337 1,681 Additional information Return on equity (2) 26.5% 0.6% 6.2% 15.9% 30.8% 4.4% nm 15.8% Cost:income ratio (2) 49.4% 105.1% 56.1% 60.2% 37.7% 50.1% nm 52.6% Total assets (£bn) 173.9 26.4 165.6 21.9 30.4 278.9 32.8 729.9 Funded assets (£bn) 173.9 26.4 165.6 21.9 30.4 133.4 32.7 584.3 Net loans to customers - amortised cost (£bn) 151.9 19.0 101.4 14.7 13.6 9.3 0.7 310.6 Loan impairment rate (2) 18bps (20)bps 77bps nm nm nm nm 30bps Impairment provisions (£bn) (1.2) (0.7) (1.2) - - (0.1) - (3.2) Impairment provisions - stage 3 (£bn) (0.7) (0.6) (0.9) - - (0.1) - (2.3) Customer deposits (£bn) 147.5 19.0 133.4 28.0 28.1 2.8 2.8 361.6 Risk-weighted assets (RWAs) (£bn) 37.0 14.2 77.8 9.7 6.9 41.4 1.5 188.5 RWA equivalent (RWAes) (£bn) 38.1 14.5 79.3 9.7 7.0 46.1 1.8 196.5 Employee numbers (FTEs - thousands) 21.3 3.1 10.5 1.9 1.8 5.0 23.0 66.6 Average interest earning assets (£bn) 164.8 25.3 146.1 21.2 29.8 34.4 nm 444.8 Net interest margin 2.51% 1.62% 1.97% 2.44% 1.68% (1.05%) nm 1.78% Third party customer asset rate 3.25% 2.29% 3.18% 2.89% 1.79% nm nm nm Third party customer funding rate (0.38%) (0.15%) (0.42%) (0.45%) (0.13%) nm nm nm For the notes to this table, refer to page 12. nm = not meaningful.
12 RBS – Q3 2019 Results
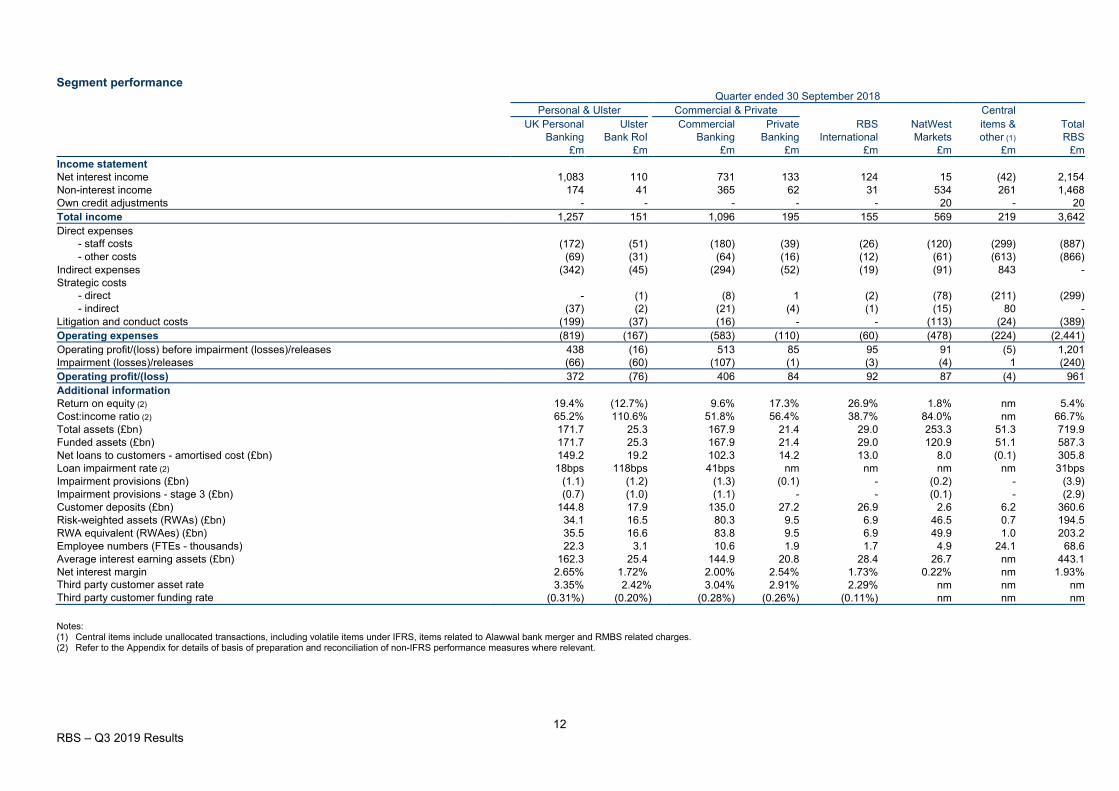
Segment performance Quarter ended 30 September 2018
Personal & Ulster Commercial & Private Central UK Personal Ulster Commercial Private RBS NatWest items & Total
Banking Bank RoI Banking Banking International Markets other (1) RBS £m £m £m £m £m £m £m £m
Income statement Net interest income 1,083 110 731 133 124 15 (42) 2,154 Non-interest income 174 41 365 62 31 534 261 1,468 Own credit adjustments - - - - - 20 - 20 Total income 1,257 151 1,096 195 155 569 219 3,642 Direct expenses
- staff costs (172) (51) (180) (39) (26) (120) (299) (887) - other costs (69) (31) (64) (16) (12) (61) (613) (866)
Indirect expenses (342) (45) (294) (52) (19) (91) 843 - Strategic costs
- direct - (1) (8) 1 (2) (78) (211) (299) - indirect (37) (2) (21) (4) (1) (15) 80 -
Litigation and conduct costs (199) (37) (16) - - (113) (24) (389) Operating expenses (819) (167) (583) (110) (60) (478) (224) (2,441) Operating profit/(loss) before impairment (losses)/releases 438 (16) 513 85 95 91 (5) 1,201 Impairment (losses)/releases (66) (60) (107) (1) (3) (4) 1 (240) Operating profit/(loss) 372 (76) 406 84 92 87 (4) 961 Additional information Return on equity (2) 19.4% (12.7%) 9.6% 17.3% 26.9% 1.8% nm 5.4% Cost:income ratio (2) 65.2% 110.6% 51.8% 56.4% 38.7% 84.0% nm 66.7% Total assets (£bn) 171.7 25.3 167.9 21.4 29.0 253.3 51.3 719.9 Funded assets (£bn) 171.7 25.3 167.9 21.4 29.0 120.9 51.1 587.3 Net loans to customers - amortised cost (£bn) 149.2 19.2 102.3 14.2 13.0 8.0 (0.1) 305.8 Loan impairment rate (2) 18bps 118bps 41bps nm nm nm nm 31bps Impairment provisions (£bn) (1.1) (1.2) (1.3) (0.1) - (0.2) - (3.9) Impairment provisions - stage 3 (£bn) (0.7) (1.0) (1.1) - - (0.1) - (2.9) Customer deposits (£bn) 144.8 17.9 135.0 27.2 26.9 2.6 6.2 360.6 Risk-weighted assets (RWAs) (£bn) 34.1 16.5 80.3 9.5 6.9 46.5 0.7 194.5 RWA equivalent (RWAes) (£bn) 35.5 16.6 83.8 9.5 6.9 49.9 1.0 203.2 Employee numbers (FTEs - thousands) 22.3 3.1 10.6 1.9 1.7 4.9 24.1 68.6 Average interest earning assets (£bn) 162.3 25.4 144.9 20.8 28.4 26.7 nm 443.1 Net interest margin 2.65% 1.72% 2.00% 2.54% 1.73% 0.22% nm 1.93% Third party customer asset rate 3.35% 2.42% 3.04% 2.91% 2.29% nm nm nm Third party customer funding rate (0.31%) (0.20%) (0.28%) (0.26%) (0.11%) nm nm nm Notes: (1) Central items include unallocated transactions, including volatile items under IFRS, items related to Alawwal bank merger and RMBS related charges.
(2) Refer to the Appendix for details of basis of preparation and reconciliation of non-IFRS performance measures where relevant.
13 RBS – Q3 2019 Results
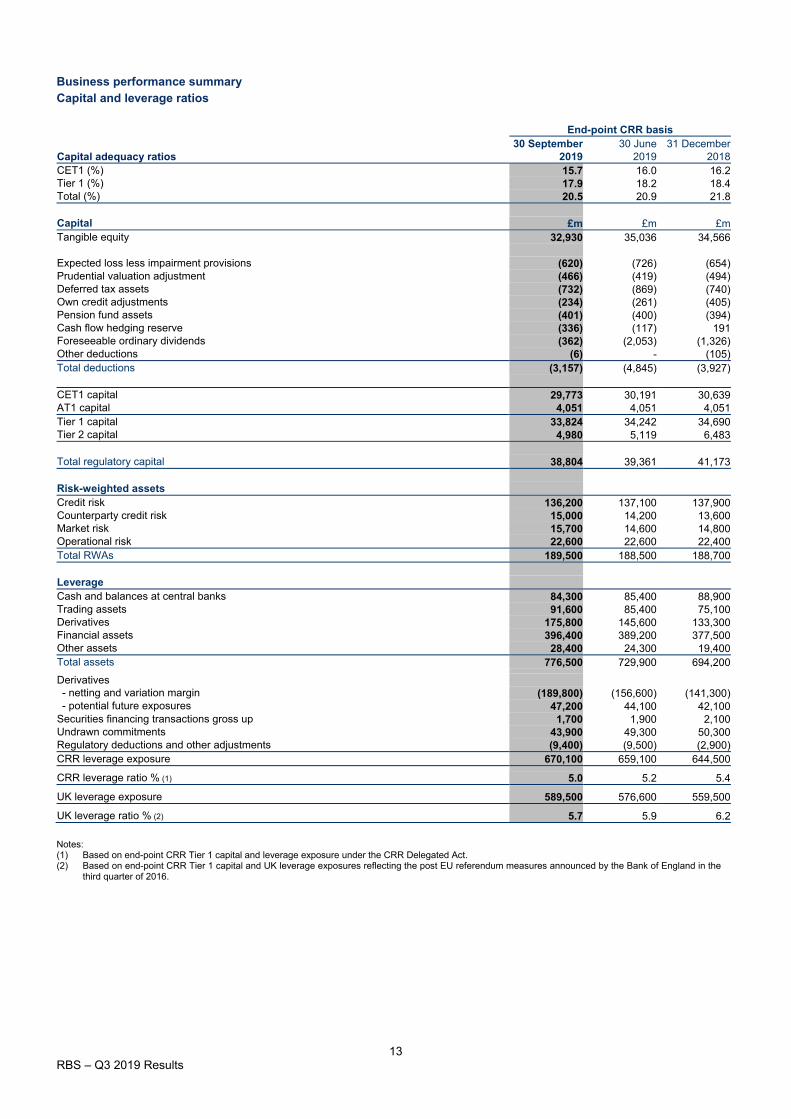
Business performance summary Capital and leverage ratios
End-point CRR basis 30 September 30 June 31 December
Capital adequacy ratios 2019 2019 2018 CET1 (%) 15.7 16.0 16.2 Tier 1 (%) 17.9 18.2 18.4 Total (%) 20.5 20.9 21.8
Capital £m £m £m Tangible equity 32,930 35,036 34,566
Expected loss less impairment provisions (620) (726) (654) Prudential valuation adjustment (466) (419) (494) Deferred tax assets (732) (869) (740) Own credit adjustments (234) (261) (405) Pension fund assets (401) (400) (394) Cash flow hedging reserve (336) (117) 191 Foreseeable ordinary dividends (362) (2,053) (1,326) Other deductions (6) - (105) Total deductions (3,157) (4,845) (3,927)
CET1 capital 29,773 30,191 30,639 AT1 capital 4,051 4,051 4,051 Tier 1 capital 33,824 34,242 34,690 Tier 2 capital 4,980 5,119 6,483
Total regulatory capital 38,804 39,361 41,173
Risk-weighted assets Credit risk 136,200 137,100 137,900 Counterparty credit risk 15,000 14,200 13,600 Market risk 15,700 14,600 14,800 Operational risk 22,600 22,600 22,400 Total RWAs 189,500 188,500 188,700
Leverage Cash and balances at central banks 84,300 85,400 88,900 Trading assets 91,600 85,400 75,100 Derivatives 175,800 145,600 133,300 Financial assets 396,400 389,200 377,500 Other assets 28,400 24,300 19,400 Total assets 776,500 729,900 694,200
Derivatives - netting and variation margin (189,800) (156,600) (141,300) - potential future exposures 47,200 44,100 42,100 Securities financing transactions gross up 1,700 1,900 2,100 Undrawn commitments 43,900 49,300 50,300 Regulatory deductions and other adjustments (9,400) (9,500) (2,900) CRR leverage exposure 670,100 659,100 644,500
CRR leverage ratio % (1) 5.0 5.2 5.4
UK leverage exposure 589,500 576,600 559,500
UK leverage ratio % (2) 5.7 5.9 6.2 Notes: (1) Based on end-point CRR Tier 1 capital and leverage exposure under the CRR Delegated Act. (2) Based on end-point CRR Tier 1 capital and UK leverage exposures reflecting the post EU referendum measures announced by the Bank of England in the
third quarter of 2016.
14 RBS – Q3 2019 Results
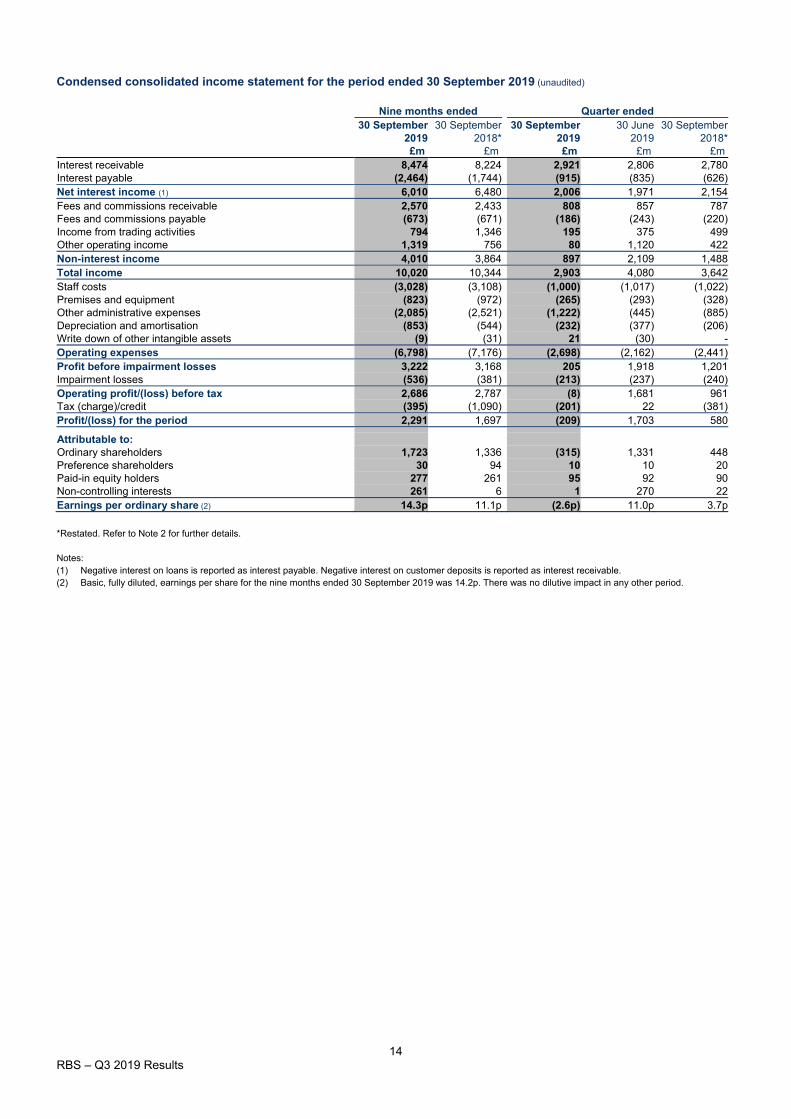
Condensed consolidated income statement for the period ended 30 September 2019 (unaudited) Nine months ended Quarter ended 30 September 30 September 30 September 30 June 30 September 2019 2018* 2019 2019 2018* £m £m £m £m £m Interest receivable 8,474 8,224 2,921 2,806 2,780 Interest payable (2,464) (1,744) (915) (835) (626) Net interest income (1) 6,010 6,480 2,006 1,971 2,154 Fees and commissions receivable 2,570 2,433 808 857 787 Fees and commissions payable (673) (671) (186) (243) (220) Income from trading activities 794 1,346 195 375 499 Other operating income 1,319 756 80 1,120 422 Non-interest income 4,010 3,864 897 2,109 1,488 Total income 10,020 10,344 2,903 4,080 3,642 Staff costs (3,028) (3,108) (1,000) (1,017) (1,022) Premises and equipment (823) (972) (265) (293) (328) Other administrative expenses (2,085) (2,521) (1,222) (445) (885) Depreciation and amortisation (853) (544) (232) (377) (206) Write down of other intangible assets (9) (31) 21 (30) - Operating expenses (6,798) (7,176) (2,698) (2,162) (2,441) Profit before impairment losses 3,222 3,168 205 1,918 1,201 Impairment losses (536) (381) (213) (237) (240) Operating profit/(loss) before tax 2,686 2,787 (8) 1,681 961 Tax (charge)/credit (395) (1,090) (201) 22 (381) Profit/(loss) for the period 2,291 1,697 (209) 1,703 580
Attributable to: Ordinary shareholders 1,723 1,336 (315) 1,331 448 Preference shareholders 30 94 10 10 20 Paid-in equity holders 277 261 95 92 90 Non-controlling interests 261 6 1 270 22 Earnings per ordinary share (2) 14.3p 11.1p (2.6p) 11.0p 3.7p *Restated. Refer to Note 2 for further details. Notes: (1) Negative interest on loans is reported as interest payable. Negative interest on customer deposits is reported as interest receivable. (2) Basic, fully diluted, earnings per share for the nine months ended 30 September 2019 was 14.2p. There was no dilutive impact in any other period.
15 RBS – Q3 2019 Results
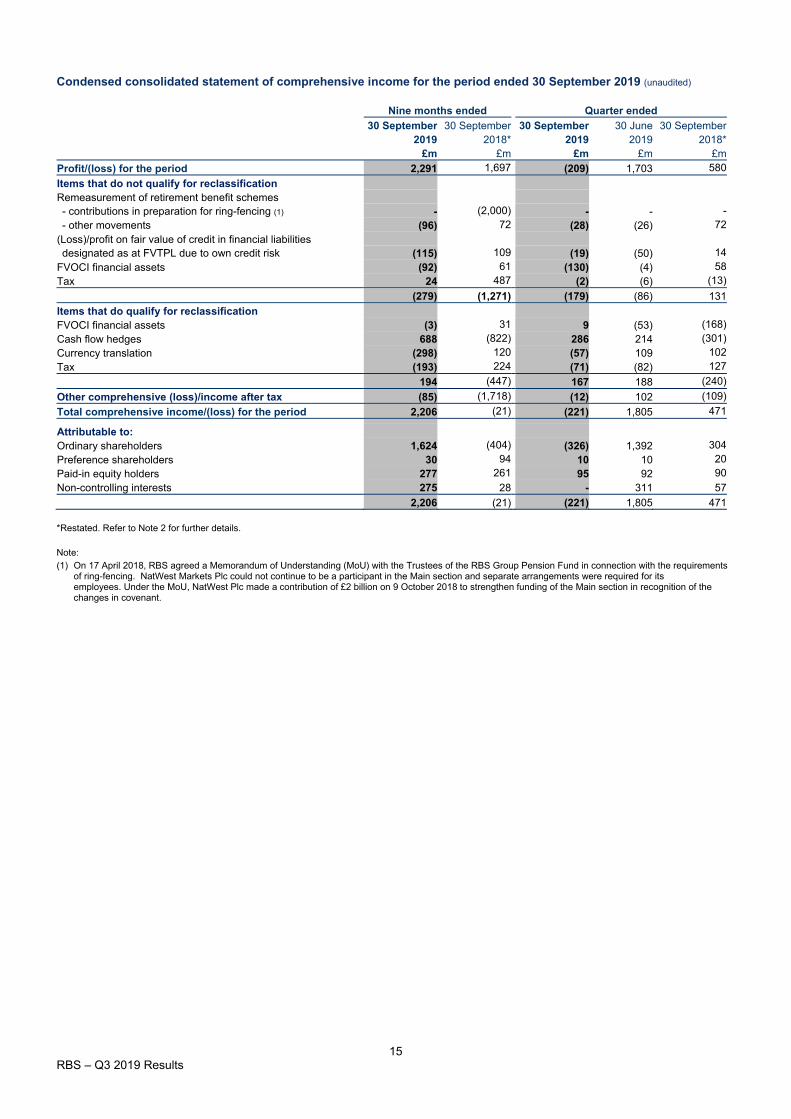
Condensed consolidated statement of comprehensive income for the period ended 30 September 2019 (unaudited)
Nine months ended Quarter ended
30 September 30 September 30 September 30 June 30 September 2019 2018* 2019 2019 2018*
£m £m £m £m £m
Profit/(loss) for the period 2,291 1,697 (209) 1,703 580
Items that do not qualify for reclassification Remeasurement of retirement benefit schemes - contributions in preparation for ring-fencing (1) - (2,000) - - - - other movements (96) 72 (28) (26) 72
(Loss)/profit on fair value of credit in financial liabilities designated as at FVTPL due to own credit risk (115) 109 (19) (50) 14
FVOCI financial assets (92) 61 (130) (4) 58
Tax 24 487 (2) (6) (13)
(279) (1,271) (179) (86) 131
Items that do qualify for reclassification FVOCI financial assets (3) 31 9 (53) (168)
Cash flow hedges 688 (822) 286 214 (301)
Currency translation (298) 120 (57) 109 102
Tax (193) 224 (71) (82) 127
194 (447) 167 188 (240)
Other comprehensive (loss)/income after tax (85) (1,718) (12) 102 (109)
Total comprehensive income/(loss) for the period 2,206 (21) (221) 1,805 471
Attributable to: Ordinary shareholders 1,624 (404) (326) 1,392 304
Preference shareholders 30 94 10 10 20
Paid-in equity holders 277 261 95 92 90
Non-controlling interests 275 28 - 311 57
2,206 (21) (221) 1,805 471 *Restated. Refer to Note 2 for further details. Note: (1) On 17 April 2018, RBS agreed a Memorandum of Understanding (MoU) with the Trustees of the RBS Group Pension Fund in connection with the requirements
of ring-fencing. NatWest Markets Plc could not continue to be a participant in the Main section and separate arrangements were required for its employees. Under the MoU, NatWest Plc made a contribution of £2 billion on 9 October 2018 to strengthen funding of the Main section in recognition of the changes in covenant.
16 RBS – Q3 2019 Results
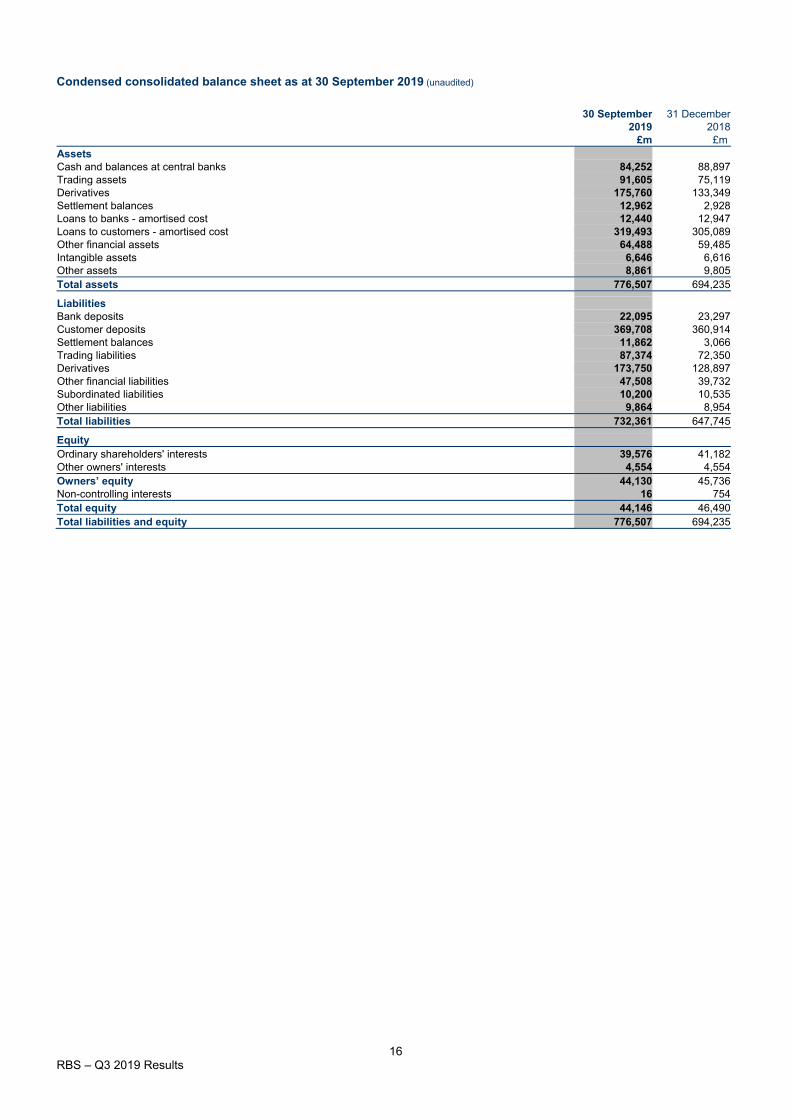
Condensed consolidated balance sheet as at 30 September 2019 (unaudited)
30 September 31 December 2019 2018
£m £m Assets Cash and balances at central banks 84,252 88,897 Trading assets 91,605 75,119 Derivatives 175,760 133,349 Settlement balances 12,962 2,928 Loans to banks - amortised cost 12,440 12,947 Loans to customers - amortised cost 319,493 305,089 Other financial assets 64,488 59,485 Intangible assets 6,646 6,616 Other assets 8,861 9,805 Total assets 776,507 694,235
Liabilities Bank deposits 22,095 23,297 Customer deposits 369,708 360,914 Settlement balances 11,862 3,066 Trading liabilities 87,374 72,350 Derivatives 173,750 128,897 Other financial liabilities 47,508 39,732 Subordinated liabilities 10,200 10,535 Other liabilities 9,864 8,954 Total liabilities 732,361 647,745
Equity Ordinary shareholders' interests 39,576 41,182 Other owners' interests 4,554 4,554 Owners’ equity 44,130 45,736 Non-controlling interests 16 754 Total equity 44,146 46,490 Total liabilities and equity 776,507 694,235
17 RBS – Q3 2019 Results
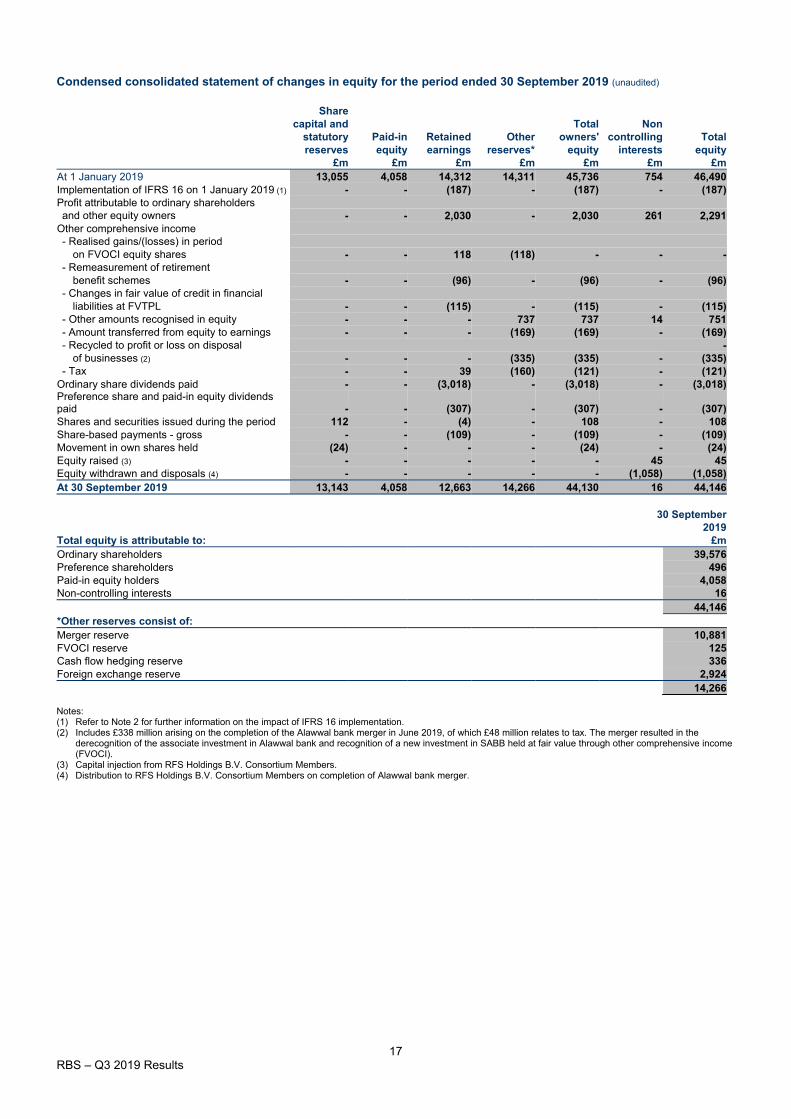
Condensed consolidated statement of changes in equity for the period ended 30 September 2019 (unaudited)
Share capital and Total Non
statutory Paid-in Retained Other owners' controlling Total reserves equity earnings reserves* equity interests equity
£m £m £m £m £m £m £m At 1 January 2019 13,055 4,058 14,312 14,311 45,736 754 46,490 Implementation of IFRS 16 on 1 January 2019 (1) - - (187) - (187) - (187) Profit attributable to ordinary shareholders and other equity owners - - 2,030 - 2,030 261 2,291 Other comprehensive income - Realised gains/(losses) in period on FVOCI equity shares - - 118 (118) - - - - Remeasurement of retirement benefit schemes - - (96) - (96) - (96) - Changes in fair value of credit in financial liabilities at FVTPL - - (115) - (115) - (115) - Other amounts recognised in equity - - - 737 737 14 751 - Amount transferred from equity to earnings - - - (169) (169) - (169) - Recycled to profit or loss on disposal - of businesses (2) - - - (335) (335) - (335) - Tax - - 39 (160) (121) - (121) Ordinary share dividends paid - - (3,018) - (3,018) - (3,018) Preference share and paid-in equity dividends paid - - (307) - (307) - (307) Shares and securities issued during the period 112 - (4) - 108 - 108 Share-based payments - gross - - (109) - (109) - (109) Movement in own shares held (24) - - - (24) - (24) Equity raised (3) - - - - - 45 45 Equity withdrawn and disposals (4) - - - - - (1,058) (1,058) At 30 September 2019 13,143 4,058 12,663 14,266 44,130 16 44,146
30 September 2019
Total equity is attributable to: £m Ordinary shareholders 39,576 Preference shareholders 496 Paid-in equity holders 4,058 Non-controlling interests 16
44,146 *Other reserves consist of: Merger reserve 10,881 FVOCI reserve 125 Cash flow hedging reserve 336 Foreign exchange reserve 2,924
14,266 Notes: (1) Refer to Note 2 for further information on the impact of IFRS 16 implementation. (2) Includes £338 million arising on the completion of the Alawwal bank merger in June 2019, of which £48 million relates to tax. The merger resulted in the
derecognition of the associate investment in Alawwal bank and recognition of a new investment in SABB held at fair value through other comprehensive income (FVOCI).
(3) Capital injection from RFS Holdings B.V. Consortium Members. (4) Distribution to RFS Holdings B.V. Consortium Members on completion of Alawwal bank merger.
18 RBS – Q3 2019 Results
Notes 1. Basis of preparation The condensed consolidated financial statements should be read in conjunction with RBS’s 2018 Annual Report and Accounts which were prepared in accordance with International Financial Reporting Standards issued by the International Accounting Standards Board (IASB) and interpretations issued by the IFRS Interpretations Committee of the IASB as adopted by the European Union (EU) (together IFRS). Going concern Having reviewed RBS’s forecasts, projections and other relevant evidence, the directors have a reasonable expectation that RBS will continue in operational existence for the foreseeable future. Accordingly, the results for the periods ended 30 September 2019 have been prepared on a going concern basis. Re-segmentation Effective from 1 January 2019, Business Banking has been transferred from UK Personal and Business Banking (UK PBB) to Commercial Banking as the nature of the business, including distribution channels, products and customers, are more closely aligned to the Commercial Banking business. Concurrent with the transfer, UK PBB has been renamed UK Personal Banking (UK PB) and the previous franchise combining UK PBB (now UK PB) and Ulster Bank RoI has been renamed Personal & Ulster. Comparatives have been re-stated. 2. Accounting policies RBS’s principal accounting policies are as set out on pages 182 to 186 of the 2018 Annual Report and Accounts and are unchanged other than as presented below.
Changes in reporting standards IAS 12 ‘Income taxes’ was revised with effect from 1 January 2019. The income statement is now required to include any tax relief on the servicing cost of instruments classified as equity. Relief of £67 million was recognised in the statement of changes in equity for the year ended 31 December 2018; this and prior periods have been restated.
Presentation of interest in suspense recoveries Until 1 January 2019, interest in suspense recoveries were presented as a component of interest receivable within Net interest income. It amounted to £46 million for the period ended 30 September 2019. From 1 January 2019 interest in suspense recoveries is presented within impairment charges; prior periods were presented as income. Comparatives have not been restated.
Revised Accounting policy 10 - Leases RBS has adopted IFRS 16 ‘Leases’ with effect from 1 January 2019, replacing IAS 17 ‘Leases’. RBS has applied IFRS 16 on a modified retrospective basis without restating prior years. Accounting policy 10 presented in the 2018 Annual Report and Accounts has been updated as follows: As lessor Finance lease contracts are those which transfer substantially all the risks and rewards of ownership of an asset to a customer. All other contracts with customers to lease assets are classified as operating leases.
Loans to customers include finance lease receivables measured at the net investment in the lease, comprising the minimum lease payments and any unguaranteed residual value discounted at the interest rate implicit in the lease. Interest receivable includes finance lease income recognised at a constant periodic rate of return before tax on the net investment. Unguaranteed residual values are subject to regular review; if there is a reduction in their value, income allocation is revised and any reduction in respect of amounts accrued is recognised immediately.
Rental income from operating leases is recognised in other operating income on a straight-line basis over the lease term unless another systematic basis better represents the time pattern of the asset’s use. Operating lease assets are included within Property, plant and equipment and depreciated over their useful lives.
As lessee On entering a new lease contract, RBS recognises a right of use asset and a liability to pay future rentals. The liability is measured at the present value of future lease payments discounted at the applicable incremental borrowing rate. The right of use asset is depreciated over the shorter of the term of the lease and the useful economic life, subject to review for impairment. Short term and low value leased assets are expensed on a systematic basis.
19 RBS – Q3 2019 Results
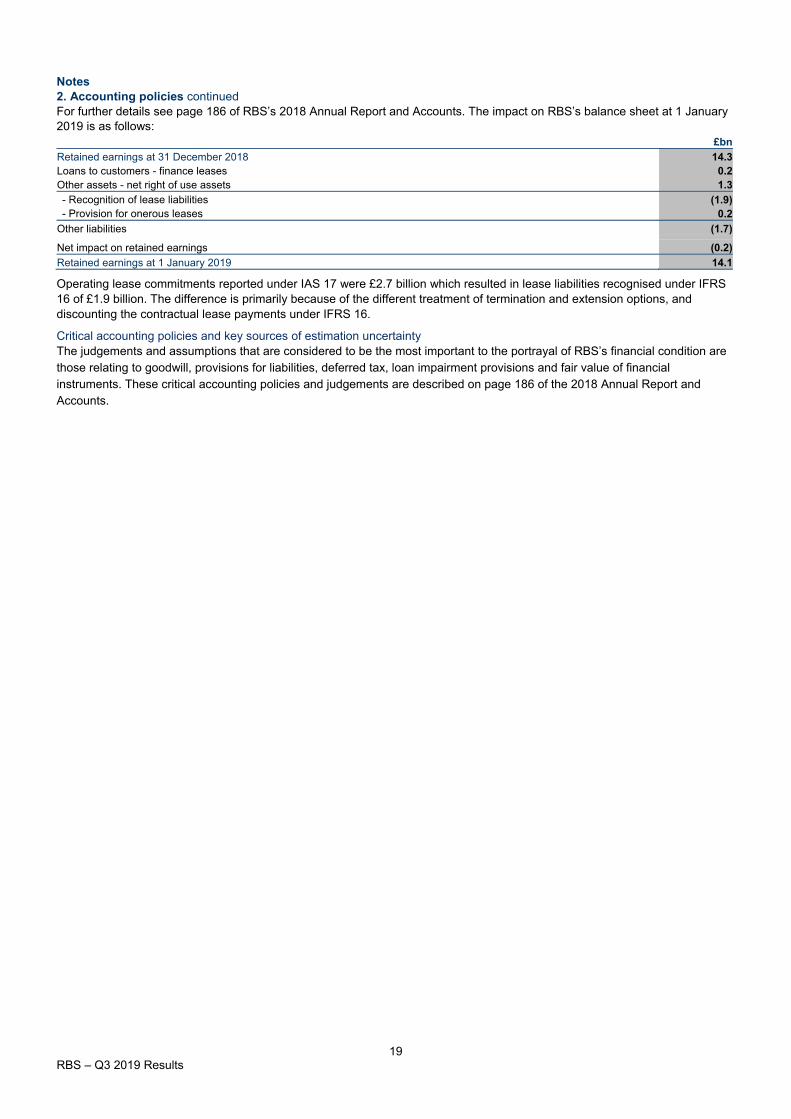
Notes 2. Accounting policies continued For further details see page 186 of RBS’s 2018 Annual Report and Accounts. The impact on RBS’s balance sheet at 1 January 2019 is as follows:
£bn
Retained earnings at 31 December 2018 14.3 Loans to customers - finance leases 0.2 Other assets - net right of use assets 1.3 - Recognition of lease liabilities (1.9) - Provision for onerous leases 0.2
Other liabilities (1.7)
Net impact on retained earnings (0.2)
Retained earnings at 1 January 2019 14.1
Operating lease commitments reported under IAS 17 were £2.7 billion which resulted in lease liabilities recognised under IFRS 16 of £1.9 billion. The difference is primarily because of the different treatment of termination and extension options, and discounting the contractual lease payments under IFRS 16.
Critical accounting policies and key sources of estimation uncertainty The judgements and assumptions that are considered to be the most important to the portrayal of RBS’s financial condition are those relating to goodwill, provisions for liabilities, deferred tax, loan impairment provisions and fair value of financial instruments. These critical accounting policies and judgements are described on page 186 of the 2018 Annual Report and Accounts.
20 RBS – Q3 2019 Results
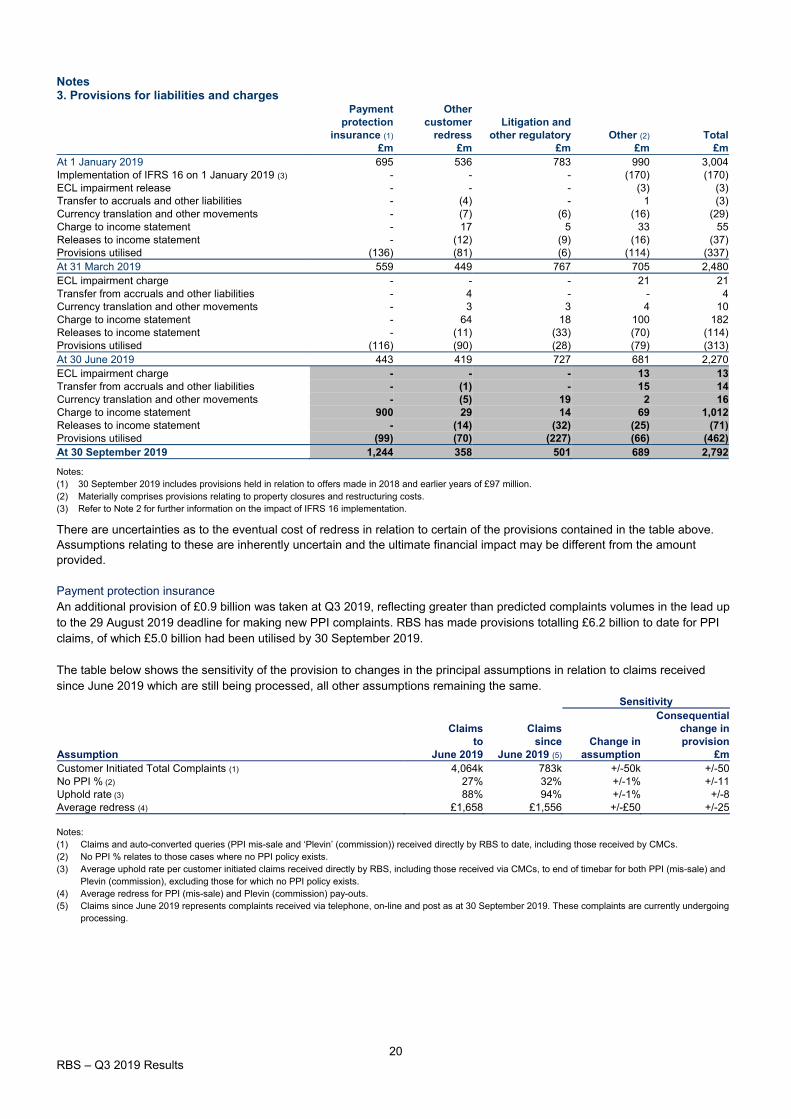
Notes 3. Provisions for liabilities and charges
Payment Other protection customer Litigation and
insurance (1) redress other regulatory Other (2) Total £m £m £m £m £m
At 1 January 2019 695 536 783 990 3,004 Implementation of IFRS 16 on 1 January 2019 (3) - - - (170) (170) ECL impairment release - - - (3) (3) Transfer to accruals and other liabilities - (4) - 1 (3) Currency translation and other movements - (7) (6) (16) (29) Charge to income statement - 17 5 33 55 Releases to income statement - (12) (9) (16) (37) Provisions utilised (136) (81) (6) (114) (337) At 31 March 2019 559 449 767 705 2,480 ECL impairment charge - - - 21 21 Transfer from accruals and other liabilities - 4 - - 4 Currency translation and other movements - 3 3 4 10 Charge to income statement - 64 18 100 182 Releases to income statement - (11) (33) (70) (114) Provisions utilised (116) (90) (28) (79) (313) At 30 June 2019 443 419 727 681 2,270 ECL impairment charge - - - 13 13 Transfer from accruals and other liabilities - (1) - 15 14 Currency translation and other movements - (5) 19 2 16 Charge to income statement 900 29 14 69 1,012 Releases to income statement - (14) (32) (25) (71) Provisions utilised (99) (70) (227) (66) (462) At 30 September 2019 1,244 358 501 689 2,792
Notes: (1) 30 September 2019 includes provisions held in relation to offers made in 2018 and earlier years of £97 million. (2) Materially comprises provisions relating to property closures and restructuring costs. (3) Refer to Note 2 for further information on the impact of IFRS 16 implementation.
There are uncertainties as to the eventual cost of redress in relation to certain of the provisions contained in the table above. Assumptions relating to these are inherently uncertain and the ultimate financial impact may be different from the amount provided. Payment protection insurance An additional provision of £0.9 billion was taken at Q3 2019, reflecting greater than predicted complaints volumes in the lead up to the 29 August 2019 deadline for making new PPI complaints. RBS has made provisions totalling £6.2 billion to date for PPI claims, of which £5.0 billion had been utilised by 30 September 2019. The table below shows the sensitivity of the provision to changes in the principal assumptions in relation to claims received since June 2019 which are still being processed, all other assumptions remaining the same.
Sensitivity Consequential
Claims Claims change in to since Change in provision
Assumption June 2019 June 2019 (5) assumption £m Customer Initiated Total Complaints (1) 4,064k 783k +/-50k +/-50 No PPI % (2) 27% 32% +/-1% +/-11 Uphold rate (3) 88% 94% +/-1% +/-8 Average redress (4) £1,658 £1,556 +/-£50 +/-25 Notes: (1) Claims and auto-converted queries (PPI mis-sale and ‘Plevin’ (commission)) received directly by RBS to date, including those received by CMCs. (2) No PPI % relates to those cases where no PPI policy exists. (3) Average uphold rate per customer initiated claims received directly by RBS, including those received via CMCs, to end of timebar for both PPI (mis-sale) and
Plevin (commission), excluding those for which no PPI policy exists. (4) Average redress for PPI (mis-sale) and Plevin (commission) pay-outs. (5) Claims since June 2019 represents complaints received via telephone, on-line and post as at 30 September 2019. These complaints are currently undergoing
processing.
21 RBS – Q3 2019 Results
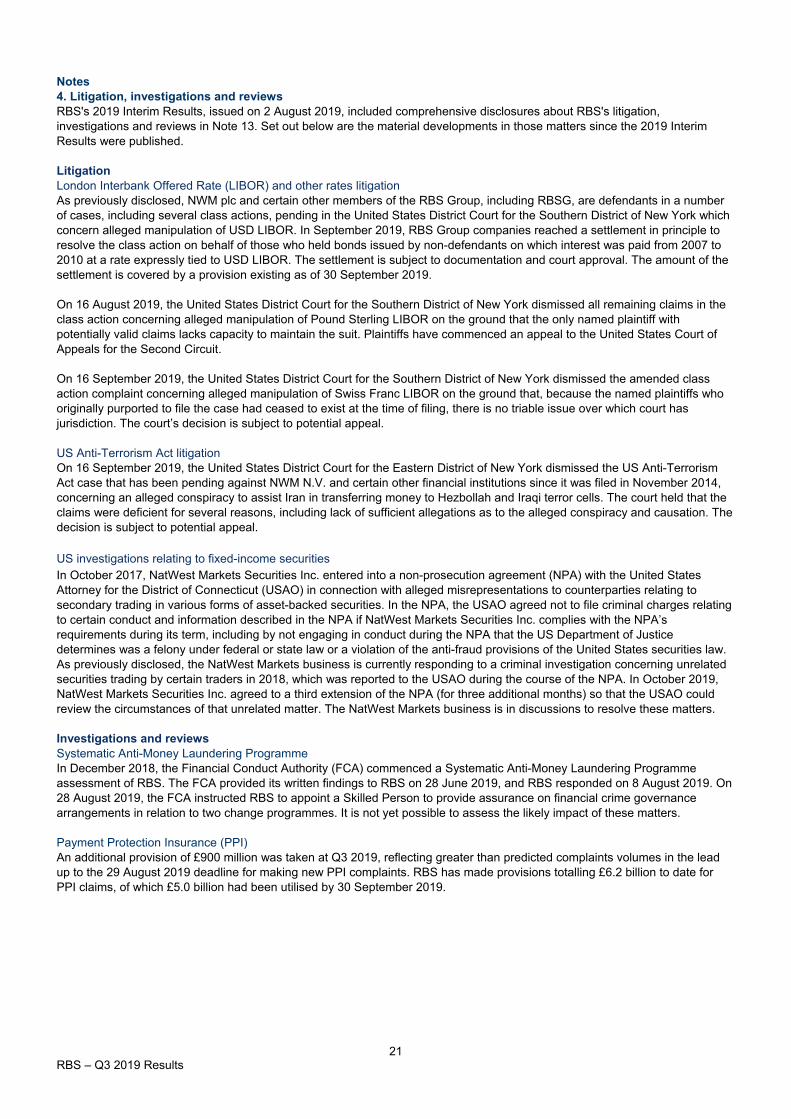
Notes 4. Litigation, investigations and reviews RBS's 2019 Interim Results, issued on 2 August 2019, included comprehensive disclosures about RBS's litigation, investigations and reviews in Note 13. Set out below are the material developments in those matters since the 2019 Interim Results were published. Litigation London Interbank Offered Rate (LIBOR) and other rates litigation As previously disclosed, NWM plc and certain other members of the RBS Group, including RBSG, are defendants in a number of cases, including several class actions, pending in the United States District Court for the Southern District of New York which concern alleged manipulation of USD LIBOR. In September 2019, RBS Group companies reached a settlement in principle to resolve the class action on behalf of those who held bonds issued by non-defendants on which interest was paid from 2007 to 2010 at a rate expressly tied to USD LIBOR. The settlement is subject to documentation and court approval. The amount of the settlement is covered by a provision existing as of 30 September 2019. On 16 August 2019, the United States District Court for the Southern District of New York dismissed all remaining claims in the class action concerning alleged manipulation of Pound Sterling LIBOR on the ground that the only named plaintiff with potentially valid claims lacks capacity to maintain the suit. Plaintiffs have commenced an appeal to the United States Court of Appeals for the Second Circuit. On 16 September 2019, the United States District Court for the Southern District of New York dismissed the amended class action complaint concerning alleged manipulation of Swiss Franc LIBOR on the ground that, because the named plaintiffs who originally purported to file the case had ceased to exist at the time of filing, there is no triable issue over which court has jurisdiction. The court’s decision is subject to potential appeal. US Anti-Terrorism Act litigation On 16 September 2019, the United States District Court for the Eastern District of New York dismissed the US Anti-Terrorism Act case that has been pending against NWM N.V. and certain other financial institutions since it was filed in November 2014, concerning an alleged conspiracy to assist Iran in transferring money to Hezbollah and Iraqi terror cells. The court held that the claims were deficient for several reasons, including lack of sufficient allegations as to the alleged conspiracy and causation. The decision is subject to potential appeal. US investigations relating to fixed-income securities In October 2017, NatWest Markets Securities Inc. entered into a non-prosecution agreement (NPA) with the United States Attorney for the District of Connecticut (USAO) in connection with alleged misrepresentations to counterparties relating to secondary trading in various forms of asset-backed securities. In the NPA, the USAO agreed not to file criminal charges relating to certain conduct and information described in the NPA if NatWest Markets Securities Inc. complies with the NPA’s requirements during its term, including by not engaging in conduct during the NPA that the US Department of Justice determines was a felony under federal or state law or a violation of the anti-fraud provisions of the United States securities law. As previously disclosed, the NatWest Markets business is currently responding to a criminal investigation concerning unrelated securities trading by certain traders in 2018, which was reported to the USAO during the course of the NPA. In October 2019, NatWest Markets Securities Inc. agreed to a third extension of the NPA (for three additional months) so that the USAO could review the circumstances of that unrelated matter. The NatWest Markets business is in discussions to resolve these matters. Investigations and reviews Systematic Anti-Money Laundering Programme In December 2018, the Financial Conduct Authority (FCA) commenced a Systematic Anti-Money Laundering Programme assessment of RBS. The FCA provided its written findings to RBS on 28 June 2019, and RBS responded on 8 August 2019. On 28 August 2019, the FCA instructed RBS to appoint a Skilled Person to provide assurance on financial crime governance arrangements in relation to two change programmes. It is not yet possible to assess the likely impact of these matters. Payment Protection Insurance (PPI) An additional provision of £900 million was taken at Q3 2019, reflecting greater than predicted complaints volumes in the lead up to the 29 August 2019 deadline for making new PPI complaints. RBS has made provisions totalling £6.2 billion to date for PPI claims, of which £5.0 billion had been utilised by 30 September 2019.
22 RBS – Q3 2019 Results
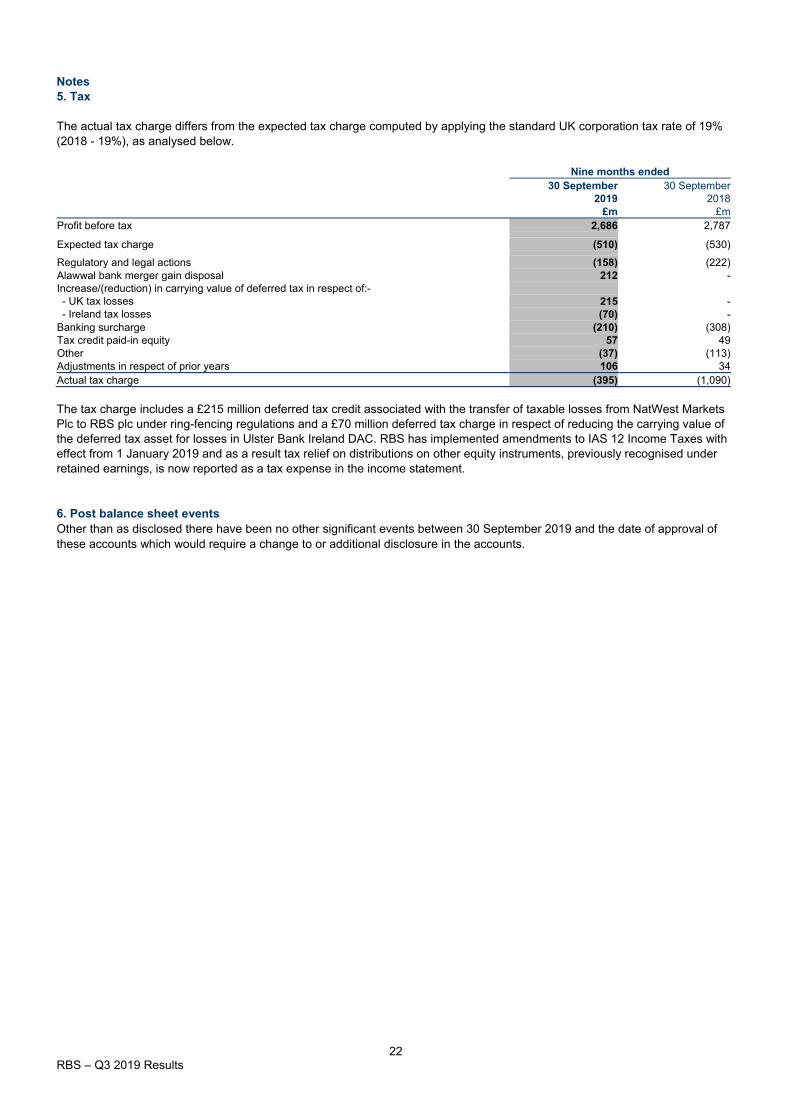
Notes 5. Tax The actual tax charge differs from the expected tax charge computed by applying the standard UK corporation tax rate of 19% (2018 - 19%), as analysed below.
Nine months ended 30 September 30 September
2019 2018 £m £m
Profit before tax 2,686 2,787
Expected tax charge (510) (530)
Regulatory and legal actions (158) (222) Alawwal bank merger gain disposal 212 - Increase/(reduction) in carrying value of deferred tax in respect of:- - UK tax losses 215 - - Ireland tax losses (70) - Banking surcharge (210) (308) Tax credit paid-in equity 57 49 Other (37) (113) Adjustments in respect of prior years 106 34 Actual tax charge (395) (1,090) The tax charge includes a £215 million deferred tax credit associated with the transfer of taxable losses from NatWest Markets Plc to RBS plc under ring-fencing regulations and a £70 million deferred tax charge in respect of reducing the carrying value of the deferred tax asset for losses in Ulster Bank Ireland DAC. RBS has implemented amendments to IAS 12 Income Taxes with effect from 1 January 2019 and as a result tax relief on distributions on other equity instruments, previously recognised under retained earnings, is now reported as a tax expense in the income statement. 6. Post balance sheet events Other than as disclosed there have been no other significant events between 30 September 2019 and the date of approval of these accounts which would require a change to or additional disclosure in the accounts.
23 RBS – Q3 2019 Results
Additional information
Presentation of information In this document, ‘RBSG plc’ or the ‘parent company’ refers to The Royal Bank of Scotland Group plc, and ‘RBS’ or the ‘RBS Group’ refers to RBSG plc and its subsidiaries. Financial information contained in this document does not constitute statutory accounts within the meaning of section 434 of the Companies Act 2006 (‘the Act’). The statutory accounts for the year ended 31 December 2018 have been filed with the Registrar of Companies. The report of the auditor on those statutory accounts was unqualified, did not draw attention to any matters by way of emphasis and did not contain a statement under section 498(2) or (3) of the Act. Contacts Analyst enquiries: Alexander Holcroft, Investor Relations +44 (0) 20 7672 1982 Media enquiries: RBS Press Office +44 (0) 131 523 4205 Analyst and investor call Webcast and dial in details
Date: 24 October 2019 www.rbs.com/results Time: 9am UK time International: +44 (0) 203 057 6566 Conference ID: 5889802 UK Free Call: 0800 279 5995
US Local Dial-In, New York: +1 646 741 2115 Available on www.rbs.com/results
Q3 2019 Interim Management Statement and background slides.
A financial supplement containing income statement, balance sheet and segment performance for the nine quarters ended 30 September 2019.
Pillar 3 supplement at 30 September 2019.
Forward looking statements
This document contains forward-looking statements within the meaning of the United States Private Securities Litigation Reform Act of 1995, such as statements that include, without limitation, the words ‘expect’, ‘estimate’, ‘project’, ‘anticipate’, ‘commit’, ‘believe’, ‘should’, ‘intend’, ‘plan’, ‘could’, ‘probability’, ‘risk’, ‘Value-at-Risk (VaR)’, ‘target’, ‘goal’, ‘objective’, ‘may’, ‘endeavour’, ‘outlook’, ‘optimistic’, ‘prospects’ and similar expressions or variations on these expressions. These statements concern or may affect future matters, such as RBSG's future economic results, business plans and current strategies. In particular, this document may include forward-looking statements relating to RBSG in respect of, but not limited to: its regulatory capital position and related requirements, its financial position, profitability and financial performance (including financial, capital and operational targets), its access to adequate sources of liquidity and funding, increasing competition from new incumbents and disruptive technologies, its exposure to third party risks, its ongoing compliance with the UK ring-fencing regime and ensuring operational continuity in resolution, its impairment losses and credit exposures under certain specified scenarios, substantial regulation and oversight, ongoing legal, regulatory and governmental actions and investigations, LIBOR, EURIBOR and other benchmark reform and RBSG’s exposure to economic and political risks (including with respect to Brexit and climate change), operational risk, conduct risk, cyber and IT risk, key person risk and credit rating risk. Forward-looking statements are subject to a number of risks and uncertainties that might cause actual results and performance to differ materially from any expected future results or performance expressed or implied by the forward-looking statements. Factors that could cause or contribute to differences in current expectations include, but are not limited to, the final number of PPI claims and their amounts, legislative, political, fiscal and regulatory developments, accounting standards, competitive conditions, technological developments, interest and exchange rate fluctuations and general economic conditions. These and other factors, risks and uncertainties that may impact any forward-looking statement or RBSG's actual results are discussed in RBSG's UK 2018 Annual Report and Accounts (ARA), RBSG’s Interim Results for H1 2019 and materials filed with, or furnished to, the US Securities and Exchange Commission, including, but not limited to, RBSG's most recent Annual Report on Form 20-F and Reports on Form 6-K. The forward-looking statements contained in this document speak only as of the date of this document and RBSG does not assume or undertake any obligation or responsibility to update any of the forward-looking statements contained in this document, whether as a result of new information, future events or otherwise, except to the extent legally required.
Appendix
Non-IFRS financial measures
1 RBS – Q3 2019 Results
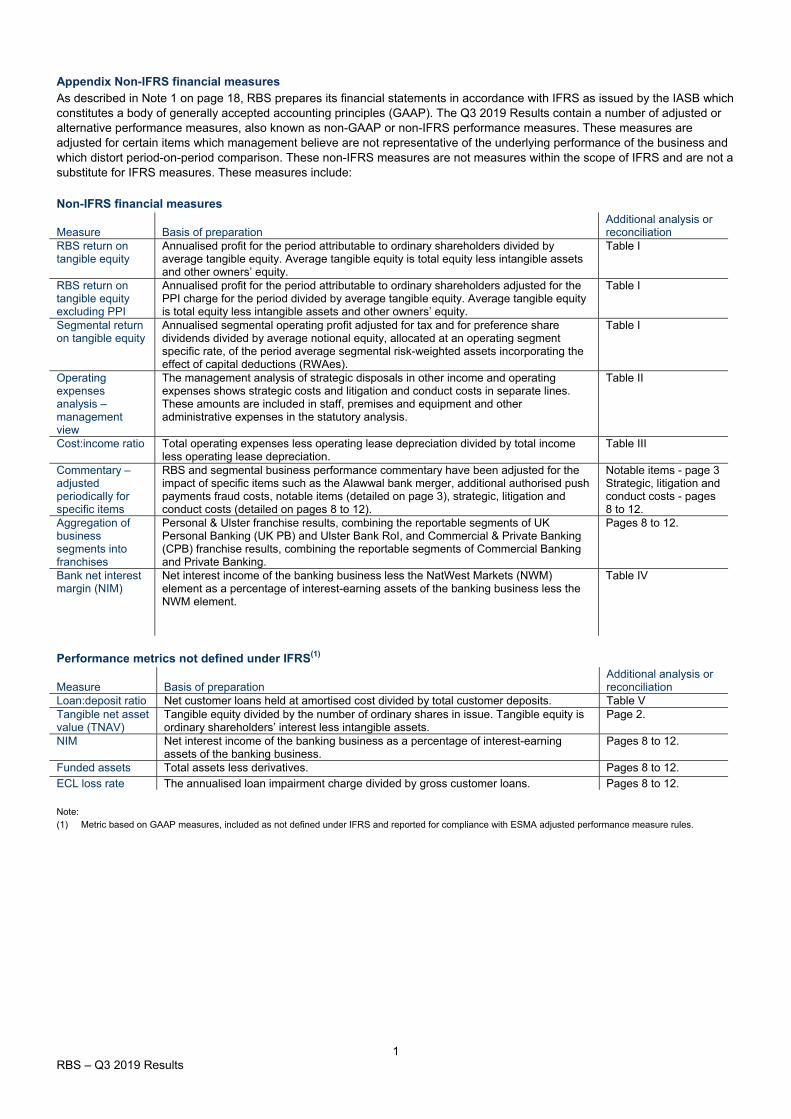
Appendix Non-IFRS financial measures As described in Note 1 on page 18, RBS prepares its financial statements in accordance with IFRS as issued by the IASB which constitutes a body of generally accepted accounting principles (GAAP). The Q3 2019 Results contain a number of adjusted or alternative performance measures, also known as non-GAAP or non-IFRS performance measures. These measures are adjusted for certain items which management believe are not representative of the underlying performance of the business and which distort period-on-period comparison. These non-IFRS measures are not measures within the scope of IFRS and are not a substitute for IFRS measures. These measures include: Non-IFRS financial measures
Measure Basis of preparation Additional analysis or reconciliation
RBS return on tangible equity
Annualised profit for the period attributable to ordinary shareholders divided by average tangible equity. Average tangible equity is total equity less intangible assets and other owners’ equity.
Table I
RBS return on tangible equity excluding PPI
Annualised profit for the period attributable to ordinary shareholders adjusted for the PPI charge for the period divided by average tangible equity. Average tangible equity is total equity less intangible assets and other owners’ equity.
Table I
Segmental return on tangible equity
Annualised segmental operating profit adjusted for tax and for preference share dividends divided by average notional equity, allocated at an operating segment specific rate, of the period average segmental risk-weighted assets incorporating the effect of capital deductions (RWAes).
Table I
Operating expenses analysis – management view
The management analysis of strategic disposals in other income and operating expenses shows strategic costs and litigation and conduct costs in separate lines. These amounts are included in staff, premises and equipment and other administrative expenses in the statutory analysis.
Table II
Cost:income ratio Total operating expenses less operating lease depreciation divided by total income less operating lease depreciation.
Table III
Commentary – adjusted periodically for specific items
RBS and segmental business performance commentary have been adjusted for the impact of specific items such as the Alawwal bank merger, additional authorised push payments fraud costs, notable items (detailed on page 3), strategic, litigation and conduct costs (detailed on pages 8 to 12).
Notable items - page 3 Strategic, litigation and conduct costs - pages 8 to 12.
Aggregation of business segments into franchises
Personal & Ulster franchise results, combining the reportable segments of UK Personal Banking (UK PB) and Ulster Bank RoI, and Commercial & Private Banking (CPB) franchise results, combining the reportable segments of Commercial Banking and Private Banking.
Pages 8 to 12.
Bank net interest margin (NIM)
Net interest income of the banking business less the NatWest Markets (NWM) element as a percentage of interest-earning assets of the banking business less the NWM element.
Table IV
Performance metrics not defined under IFRS(1)
Measure Basis of preparation Additional analysis or reconciliation
Loan:deposit ratio Net customer loans held at amortised cost divided by total customer deposits. Table V Tangible net asset value (TNAV)
Tangible equity divided by the number of ordinary shares in issue. Tangible equity is ordinary shareholders’ interest less intangible assets.
Page 2.
NIM Net interest income of the banking business as a percentage of interest-earning assets of the banking business.
Pages 8 to 12.
Funded assets Total assets less derivatives. Pages 8 to 12.
ECL loss rate The annualised loan impairment charge divided by gross customer loans. Pages 8 to 12. Note: (1) Metric based on GAAP measures, included as not defined under IFRS and reported for compliance with ESMA adjusted performance measure rules.
2 RBS – Q3 2019 Results
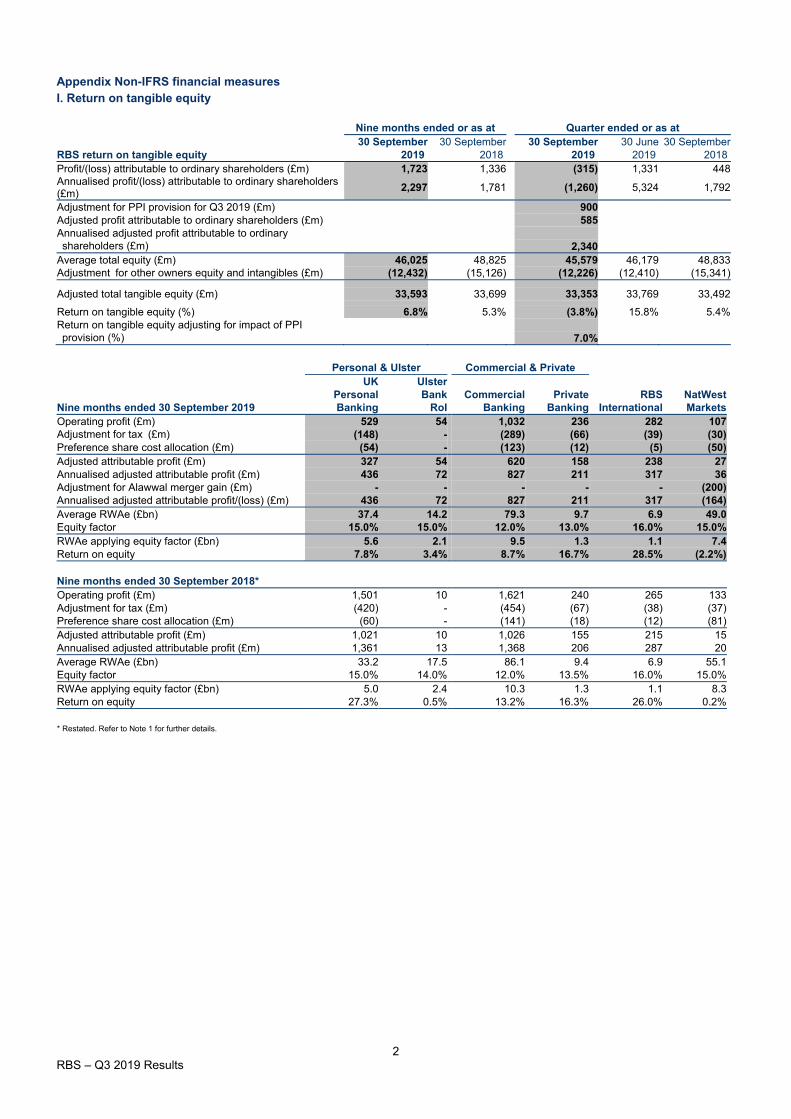
Appendix Non-IFRS financial measures I. Return on tangible equity
Nine months ended or as at Quarter ended or as at 30 September 30 September 30 September 30 June 30 September
RBS return on tangible equity 2019 2018 2019 2019 2018 Profit/(loss) attributable to ordinary shareholders (£m) 1,723 1,336 (315) 1,331 448 Annualised profit/(loss) attributable to ordinary shareholders (£m)
2,297 1,781
(1,260) 5,324 1,792
Adjustment for PPI provision for Q3 2019 (£m) 900 Adjusted profit attributable to ordinary shareholders (£m) 585 Annualised adjusted profit attributable to ordinary shareholders (£m) 2,340 Average total equity (£m) 46,025 48,825 45,579 46,179 48,833 Adjustment for other owners equity and intangibles (£m) (12,432) (15,126) (12,226) (12,410) (15,341)
Adjusted total tangible equity (£m) 33,593 33,699 33,353 33,769 33,492
Return on tangible equity (%) 6.8% 5.3% (3.8%) 15.8% 5.4% Return on tangible equity adjusting for impact of PPI provision (%) 7.0%
Personal & Ulster Commercial & Private UK Ulster
Personal Bank Commercial Private RBS NatWest Nine months ended 30 September 2019 Banking RoI Banking Banking International Markets Operating profit (£m) 529 54 1,032 236 282 107 Adjustment for tax (£m) (148) - (289) (66) (39) (30) Preference share cost allocation (£m) (54) - (123) (12) (5) (50) Adjusted attributable profit (£m) 327 54 620 158 238 27 Annualised adjusted attributable profit (£m) 436 72 827 211 317 36 Adjustment for Alawwal merger gain (£m) - - - - - (200) Annualised adjusted attributable profit/(loss) (£m) 436 72 827 211 317 (164) Average RWAe (£bn) 37.4 14.2 79.3 9.7 6.9 49.0 Equity factor 15.0% 15.0% 12.0% 13.0% 16.0% 15.0% RWAe applying equity factor (£bn) 5.6 2.1 9.5 1.3 1.1 7.4 Return on equity 7.8% 3.4% 8.7% 16.7% 28.5% (2.2%)
Nine months ended 30 September 2018* Operating profit (£m) 1,501 10 1,621 240 265 133 Adjustment for tax (£m) (420) - (454) (67) (38) (37) Preference share cost allocation (£m) (60) - (141) (18) (12) (81) Adjusted attributable profit (£m) 1,021 10 1,026 155 215 15 Annualised adjusted attributable profit (£m) 1,361 13 1,368 206 287 20 Average RWAe (£bn) 33.2 17.5 86.1 9.4 6.9 55.1 Equity factor 15.0% 14.0% 12.0% 13.5% 16.0% 15.0% RWAe applying equity factor (£bn) 5.0 2.4 10.3 1.3 1.1 8.3 Return on equity 27.3% 0.5% 13.2% 16.3% 26.0% 0.2%
* Restated. Refer to Note 1 for further details.
3 RBS – Q3 2019 Results
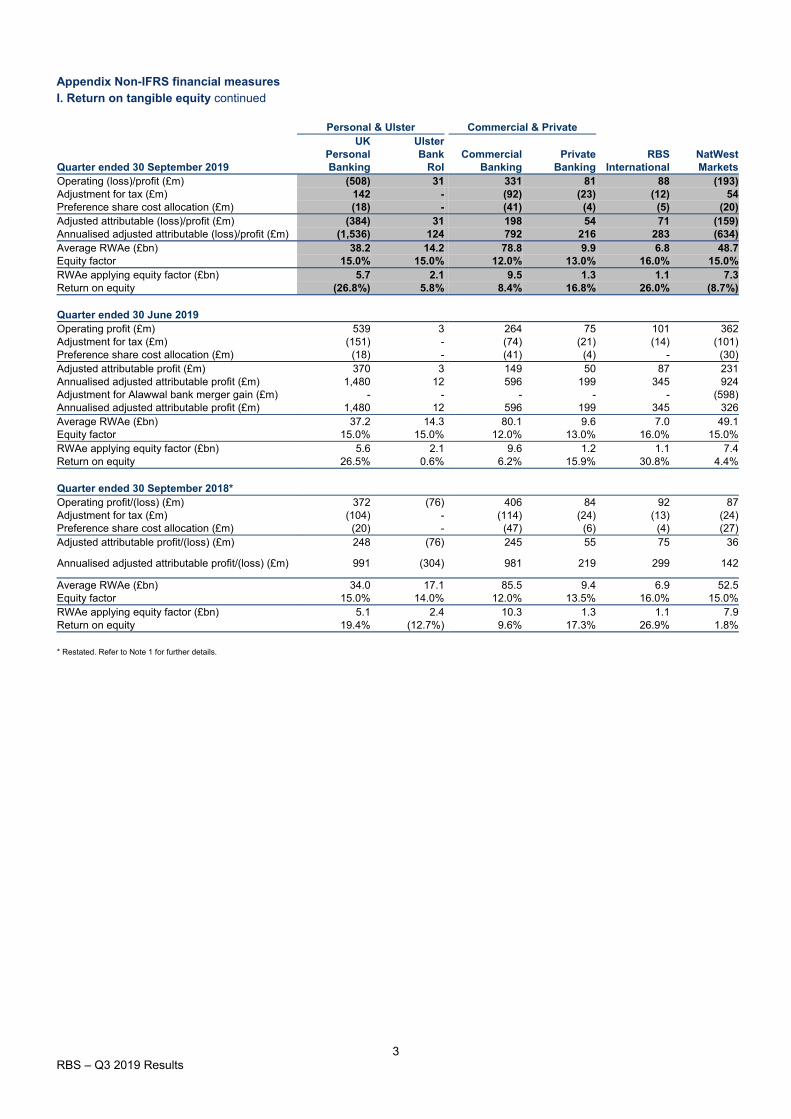
Appendix Non-IFRS financial measures I. Return on tangible equity continued
Personal & Ulster Commercial & Private UK Ulster
Personal Bank Commercial Private RBS NatWest Quarter ended 30 September 2019 Banking RoI Banking Banking International Markets Operating (loss)/profit (£m) (508) 31 331 81 88 (193) Adjustment for tax (£m) 142 - (92) (23) (12) 54 Preference share cost allocation (£m) (18) - (41) (4) (5) (20) Adjusted attributable (loss)/profit (£m) (384) 31 198 54 71 (159) Annualised adjusted attributable (loss)/profit (£m) (1,536) 124 792 216 283 (634) Average RWAe (£bn) 38.2 14.2 78.8 9.9 6.8 48.7 Equity factor 15.0% 15.0% 12.0% 13.0% 16.0% 15.0% RWAe applying equity factor (£bn) 5.7 2.1 9.5 1.3 1.1 7.3 Return on equity (26.8%) 5.8% 8.4% 16.8% 26.0% (8.7%)
Quarter ended 30 June 2019 Operating profit (£m) 539 3 264 75 101 362 Adjustment for tax (£m) (151) - (74) (21) (14) (101) Preference share cost allocation (£m) (18) - (41) (4) - (30) Adjusted attributable profit (£m) 370 3 149 50 87 231 Annualised adjusted attributable profit (£m) 1,480 12 596 199 345 924 Adjustment for Alawwal bank merger gain (£m) - - - - - (598) Annualised adjusted attributable profit (£m) 1,480 12 596 199 345 326 Average RWAe (£bn) 37.2 14.3 80.1 9.6 7.0 49.1 Equity factor 15.0% 15.0% 12.0% 13.0% 16.0% 15.0% RWAe applying equity factor (£bn) 5.6 2.1 9.6 1.2 1.1 7.4 Return on equity 26.5% 0.6% 6.2% 15.9% 30.8% 4.4%
Quarter ended 30 September 2018* Operating profit/(loss) (£m) 372 (76) 406 84 92 87 Adjustment for tax (£m) (104) - (114) (24) (13) (24) Preference share cost allocation (£m) (20) - (47) (6) (4) (27) Adjusted attributable profit/(loss) (£m) 248 (76) 245 55 75 36
Annualised adjusted attributable profit/(loss) (£m) 991 (304)
981 219 299 142
Average RWAe (£bn) 34.0 17.1 85.5 9.4 6.9 52.5 Equity factor 15.0% 14.0% 12.0% 13.5% 16.0% 15.0% RWAe applying equity factor (£bn) 5.1 2.4 10.3 1.3 1.1 7.9 Return on equity 19.4% (12.7%) 9.6% 17.3% 26.9% 1.8%
* Restated. Refer to Note 1 for further details.
4 RBS – Q3 2019 Results
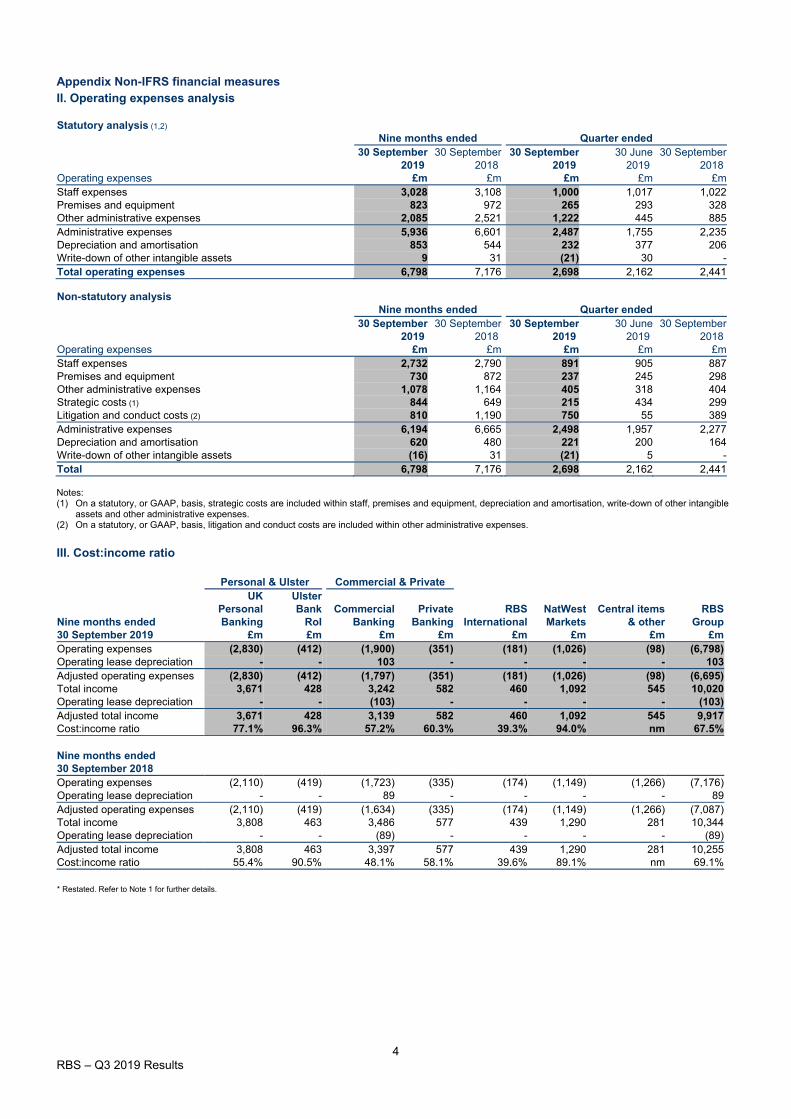
Appendix Non-IFRS financial measures II. Operating expenses analysis Statutory analysis (1,2)
Nine months ended Quarter ended 30 September 30 September 30 September 30 June 30 September
2019 2018 2019 2019 2018 Operating expenses £m £m £m £m £m Staff expenses 3,028 3,108 1,000 1,017 1,022 Premises and equipment 823 972 265 293 328 Other administrative expenses 2,085 2,521 1,222 445 885 Administrative expenses 5,936 6,601 2,487 1,755 2,235 Depreciation and amortisation 853 544 232 377 206 Write-down of other intangible assets 9 31 (21) 30 - Total operating expenses 6,798 7,176 2,698 2,162 2,441 Non-statutory analysis
Nine months ended Quarter ended 30 September 30 September 30 September 30 June 30 September
2019 2018 2019 2019 2018 Operating expenses £m £m £m £m £m Staff expenses 2,732 2,790 891 905 887 Premises and equipment 730 872 237 245 298 Other administrative expenses 1,078 1,164 405 318 404 Strategic costs (1) 844 649 215 434 299 Litigation and conduct costs (2) 810 1,190 750 55 389 Administrative expenses 6,194 6,665 2,498 1,957 2,277 Depreciation and amortisation 620 480 221 200 164 Write-down of other intangible assets (16) 31 (21) 5 - Total 6,798 7,176 2,698 2,162 2,441 Notes: (1) On a statutory, or GAAP, basis, strategic costs are included within staff, premises and equipment, depreciation and amortisation, write-down of other intangible
assets and other administrative expenses. (2) On a statutory, or GAAP, basis, litigation and conduct costs are included within other administrative expenses.
III. Cost:income ratio
Personal & Ulster Commercial & Private UK Ulster
Personal Bank Commercial Private RBS NatWest Central items RBS Nine months ended Banking RoI Banking Banking International Markets & other Group 30 September 2019 £m £m £m £m £m £m £m £m Operating expenses (2,830) (412) (1,900) (351) (181) (1,026) (98) (6,798) Operating lease depreciation - - 103 - - - - 103 Adjusted operating expenses (2,830) (412) (1,797) (351) (181) (1,026) (98) (6,695) Total income 3,671 428 3,242 582 460 1,092 545 10,020 Operating lease depreciation - - (103) - - - - (103) Adjusted total income 3,671 428 3,139 582 460 1,092 545 9,917 Cost:income ratio 77.1% 96.3% 57.2% 60.3% 39.3% 94.0% nm 67.5%
Nine months ended 30 September 2018 Operating expenses (2,110) (419) (1,723) (335) (174) (1,149) (1,266) (7,176) Operating lease depreciation - - 89 - - - - 89 Adjusted operating expenses (2,110) (419) (1,634) (335) (174) (1,149) (1,266) (7,087) Total income 3,808 463 3,486 577 439 1,290 281 10,344 Operating lease depreciation - - (89) - - - - (89) Adjusted total income 3,808 463 3,397 577 439 1,290 281 10,255 Cost:income ratio 55.4% 90.5% 48.1% 58.1% 39.6% 89.1% nm 69.1%
* Restated. Refer to Note 1 for further details.
5 RBS – Q3 2019 Results
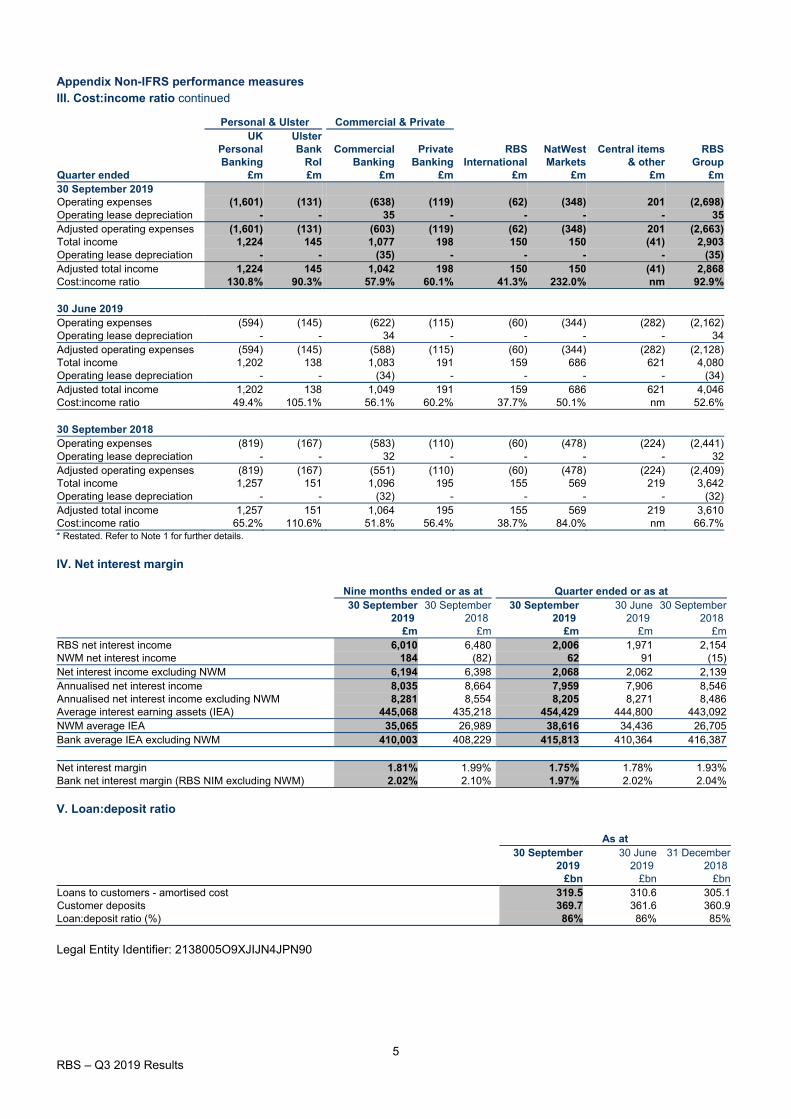
Appendix Non-IFRS performance measures III. Cost:income ratio continued
Personal & Ulster Commercial & Private UK Ulster
Personal Bank Commercial Private RBS NatWest Central items RBS Banking RoI Banking Banking International Markets & other Group
Quarter ended £m £m £m £m £m £m £m £m 30 September 2019 Operating expenses (1,601) (131) (638) (119) (62) (348) 201 (2,698) Operating lease depreciation - - 35 - - - - 35 Adjusted operating expenses (1,601) (131) (603) (119) (62) (348) 201 (2,663) Total income 1,224 145 1,077 198 150 150 (41) 2,903 Operating lease depreciation - - (35) - - - - (35) Adjusted total income 1,224 145 1,042 198 150 150 (41) 2,868 Cost:income ratio 130.8% 90.3% 57.9% 60.1% 41.3% 232.0% nm 92.9%
30 June 2019 Operating expenses (594) (145) (622) (115) (60) (344) (282) (2,162) Operating lease depreciation - - 34 - - - - 34 Adjusted operating expenses (594) (145) (588) (115) (60) (344) (282) (2,128) Total income 1,202 138 1,083 191 159 686 621 4,080 Operating lease depreciation - - (34) - - - - (34) Adjusted total income 1,202 138 1,049 191 159 686 621 4,046 Cost:income ratio 49.4% 105.1% 56.1% 60.2% 37.7% 50.1% nm 52.6%
30 September 2018 Operating expenses (819) (167) (583) (110) (60) (478) (224) (2,441) Operating lease depreciation - - 32 - - - - 32 Adjusted operating expenses (819) (167) (551) (110) (60) (478) (224) (2,409) Total income 1,257 151 1,096 195 155 569 219 3,642 Operating lease depreciation - - (32) - - - - (32) Adjusted total income 1,257 151 1,064 195 155 569 219 3,610 Cost:income ratio 65.2% 110.6% 51.8% 56.4% 38.7% 84.0% nm 66.7% * Restated. Refer to Note 1 for further details.
IV. Net interest margin
Nine months ended or as at Quarter ended or as at 30 September 30 September 30 September 30 June 30 September
2019 2018 2019 2019 2018 £m £m £m £m £m
RBS net interest income 6,010 6,480 2,006 1,971 2,154 NWM net interest income 184 (82) 62 91 (15) Net interest income excluding NWM 6,194 6,398 2,068 2,062 2,139 Annualised net interest income 8,035 8,664 7,959 7,906 8,546 Annualised net interest income excluding NWM 8,281 8,554 8,205 8,271 8,486 Average interest earning assets (IEA) 445,068 435,218 454,429 444,800 443,092 NWM average IEA 35,065 26,989 38,616 34,436 26,705 Bank average IEA excluding NWM 410,003 408,229 415,813 410,364 416,387
Net interest margin 1.81% 1.99% 1.75% 1.78% 1.93% Bank net interest margin (RBS NIM excluding NWM) 2.02% 2.10% 1.97% 2.02% 2.04% V. Loan:deposit ratio
As at 30 September 30 June 31 December
2019 2019 2018 £bn £bn £bn
Loans to customers - amortised cost 319.5 310.6 305.1 Customer deposits 369.7 361.6 360.9 Loan:deposit ratio (%) 86% 86% 85%
Legal Entity Identifier: 2138005O9XJIJN4JPN90
Related Documents