Gibson International Q2 Market Report www.gibsonintl.com

Welcome message from author
This document is posted to help you gain knowledge. Please leave a comment to let me know what you think about it! Share it to your friends and learn new things together.
Transcript
Gibson International Q2 Market Report
w w w . g i b s o n i n t l . c o m
2
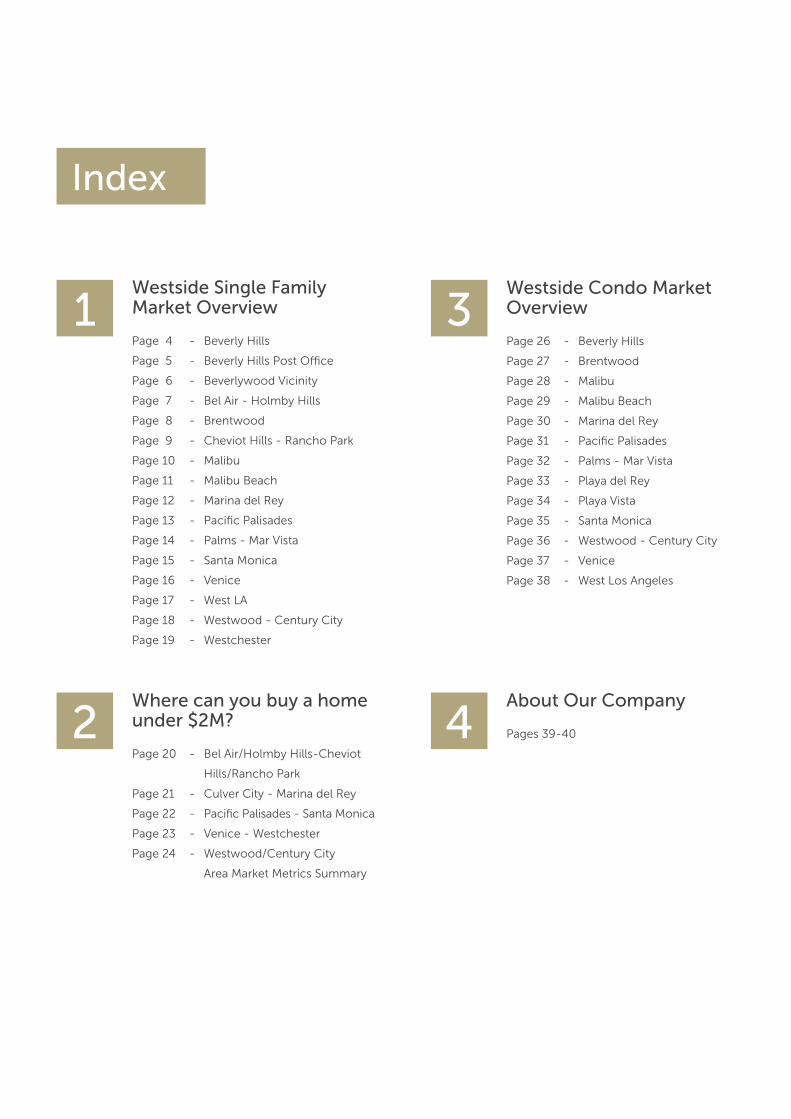
Westside Condo Market Overview
Page 26 - Beverly Hills
Page 27 - Brentwood
Page 28 - Malibu
Page 29 - Malibu Beach
Page 30 - Marina del Rey
Page 31 - Pacific Palisades
Page 32 - Palms - Mar Vista
Page 33 - Playa del Rey
Page 34 - Playa Vista
Page 35 - Santa Monica
Page 36 - Westwood - Century City
Page 37 - Venice
Page 38 - West Los Angeles
Index
1 3
4Where can you buy a home under $2M?
Page 20 - Bel Air/Holmby Hills-Cheviot
Hills/Rancho Park
Page 21 - Culver City - Marina del Rey
Page 22 - Pacific Palisades - Santa Monica
Page 23 - Venice - Westchester
Page 24 - Westwood/Century City
Area Market Metrics Summary
About Our Company
Pages 39-40
Westside Single Family Market Overview
Page 4 - Beverly Hills
Page 5 - Beverly Hills Post Office
Page 6 - Beverlywood Vicinity
Page 7 - Bel Air - Holmby Hills
Page 8 - Brentwood
Page 9 - Cheviot Hills - Rancho Park
Page 10 - Malibu
Page 11 - Malibu Beach
Page 12 - Marina del Rey
Page 13 - Pacific Palisades
Page 14 - Palms - Mar Vista
Page 15 - Santa Monica
Page 16 - Venice
Page 17 - West LA
Page 18 - Westwood - Century City
Page 19 - Westchester
Westside Single Family Market Overview
Sale-to-List Ratio Months Supply of Inventory
New Listings
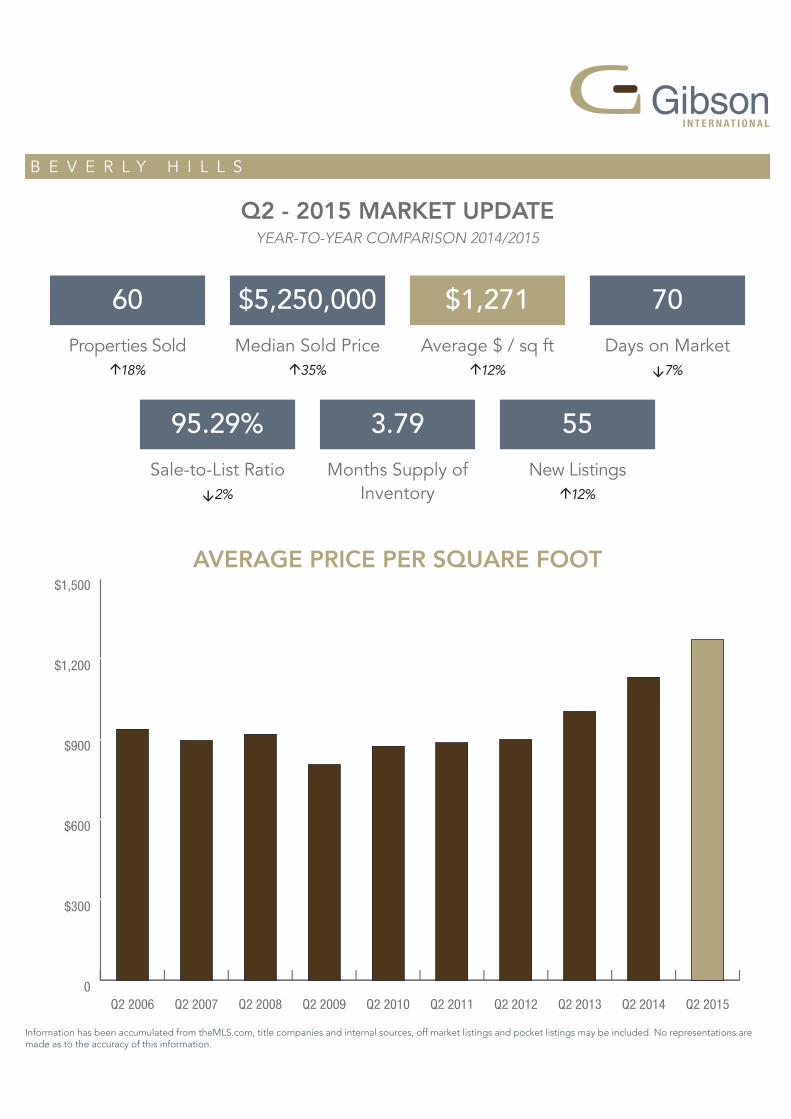
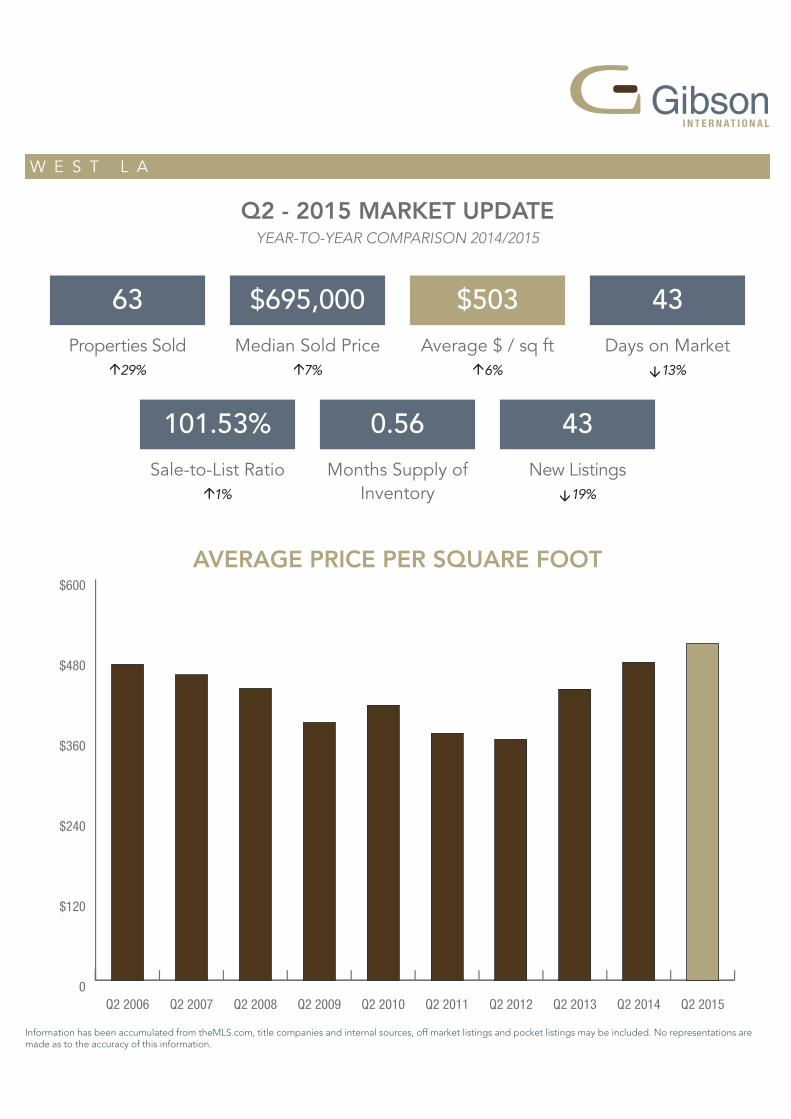
Information has been accumulated from theMLS.com, title companies and internal sources, off market listings and pocket listings may be included. No representations are made as to the accuracy of this information.
Days on Market Properties Sold Median Sold Price Average $ / sq ft
AVERAGE PRICE PER SQUARE FOOT
Q2 - 2015 MARKET UPDATEYEAR-TO-YEAR COMPARISON 2014/2015
B E V E R L Y H I L L S
60
95.29%
â2%
$5,250,000
3.79
$1,271
55
á12%
70
â7%á18% á35% á12%
0
$300
$600
$900
$1,200
$1,500
Q2 2015Q2 2014Q2 2013Q2 2012Q2 2011Q2 2010Q2 2009Q2 2008Q2 2007Q2 2006
Sale-to-List Ratio Months Supply of Inventory
New Listings
Information has been accumulated from theMLS.com, title companies and internal sources, off market listings and pocket listings may be included. No representations are made as to the accuracy of this information.
Days on Market Properties Sold Median Sold Price Average $ / sq ft
AVERAGE PRICE PER SQUARE FOOT
Q2 - 2015 MARKET UPDATEYEAR-TO-YEAR COMPARISON 2014/2015
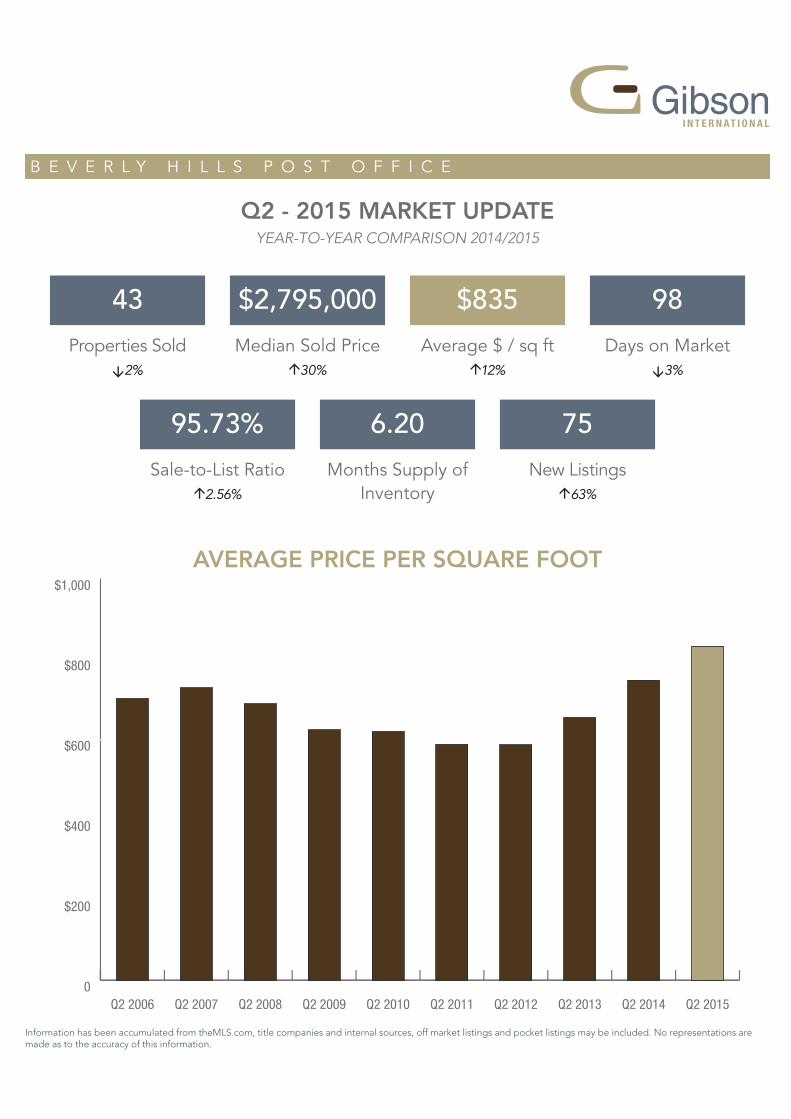
B E V E R L Y H I L L S P O S T O F F I C E
43
95.73%
á2.56%
$2,795,000
6.20
$835
75
á63%
98
â3%â2% á30% á12%
0
$200
$400
$600
$800
$1,000
Q2 2015Q2 2014Q2 2013Q2 2012Q2 2011Q2 2010Q2 2009Q2 2008Q2 2007Q2 2006
Sale-to-List Ratio Months Supply of Inventory
New Listings
Information has been accumulated from theMLS.com, title companies and internal sources, off market listings and pocket listings may be included. No representations are made as to the accuracy of this information.
Days on Market Properties Sold Median Sold Price Average $ / sq ft
AVERAGE PRICE PER SQUARE FOOT
Q2 - 2015 MARKET UPDATEYEAR-TO-YEAR COMPARISON 2014/2015
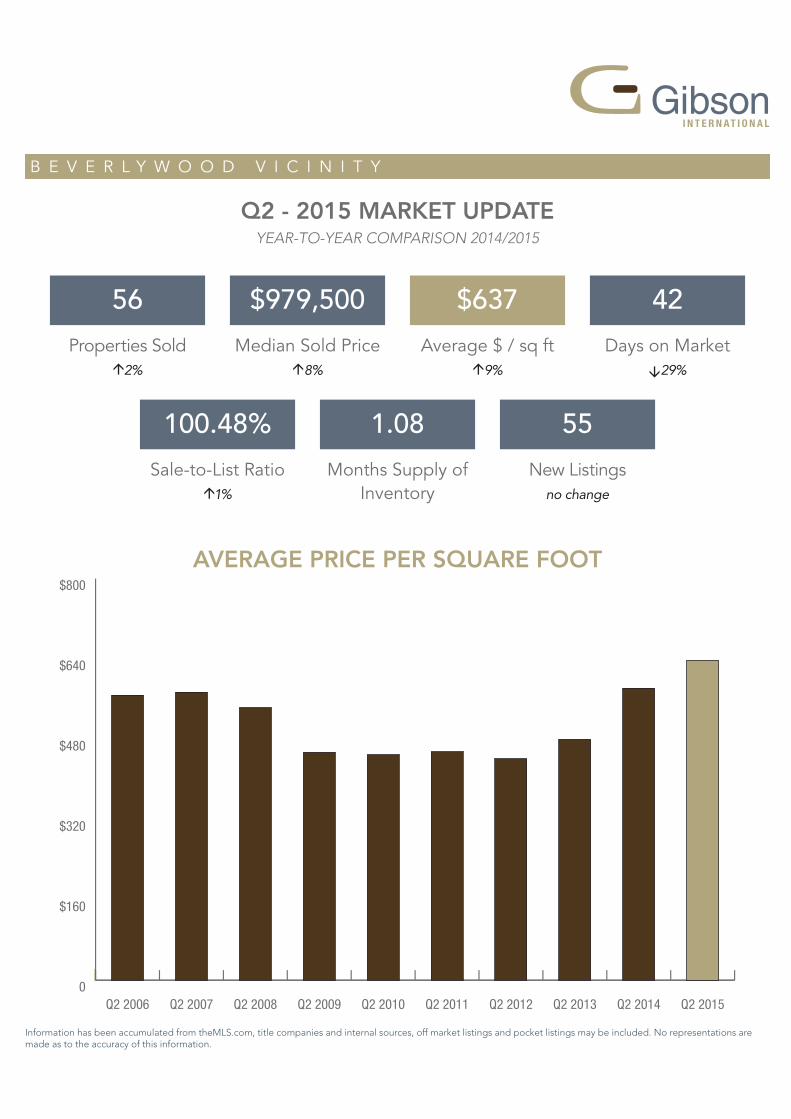
B E V E R L Y W O O D V I C I N I T Y
56
100.48%
á1%
$979,500
1.08
$637
55
no change
42
â29%á2% á8% á9%
0
$160
$320
$480
$640
$800
Q2 2015Q2 2014Q2 2013Q2 2012Q2 2011Q2 2010Q2 2009Q2 2008Q2 2007Q2 2006
Sale-to-List Ratio Months Supply of Inventory
New Listings
Information has been accumulated from theMLS.com, title companies and internal sources, off market listings and pocket listings may be included. No representations are made as to the accuracy of this information.
Days on Market Properties Sold Median Sold Price Average $ / sq ft
AVERAGE PRICE PER SQUARE FOOT
Q2 - 2015 MARKET UPDATEYEAR-TO-YEAR COMPARISON 2014/2015
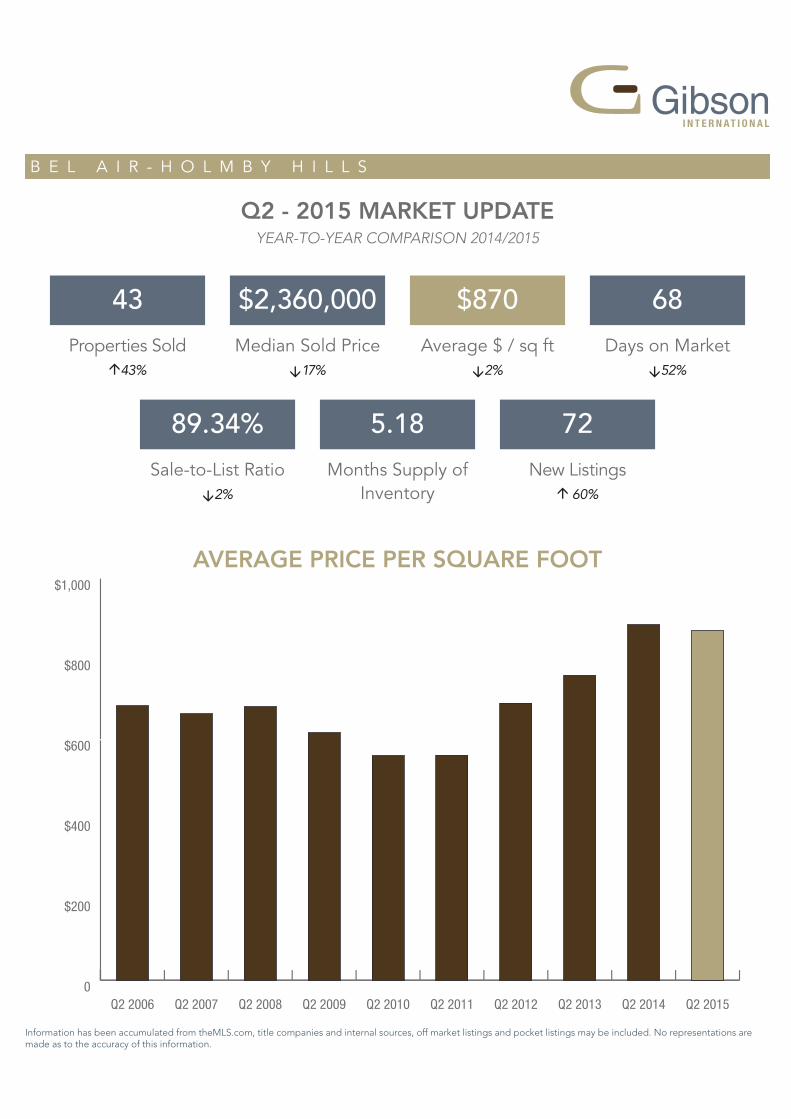
B E L A I R - H O L M B Y H I L L S
43
89.34%
â2%
$2,360,000
5.18
$870
72
á 60%
68
â52%á43% â17% â2%
0
$200
$400
$600
$800
$1,000
Q2 2015Q2 2014Q2 2013Q2 2012Q2 2011Q2 2010Q2 2009Q2 2008Q2 2007Q2 2006

Sale-to-List Ratio Months Supply of Inventory
New Listings
Information has been accumulated from theMLS.com, title companies and internal sources, off market listings and pocket listings may be included. No representations are made as to the accuracy of this information.
Days on Market Properties Sold Median Sold Price Average $ / sq ft
AVERAGE PRICE PER SQUARE FOOT
Q2 - 2015 MARKET UPDATEYEAR-TO-YEAR COMPARISON 2014/2015
B R E N T W O O D
72
102.29%
á9%
$2,796,725
3.46
$940
89
á33%
53
â27%á4% á1% á2%
0
$200
$400
$600
$800
$1,000
Q2 2015Q2 2014Q2 2013Q2 2012Q2 2011Q2 2010Q2 2009Q2 2008Q2 2007Q2 2006
Sale-to-List Ratio Months Supply of Inventory
New Listings
Information has been accumulated from theMLS.com, title companies and internal sources, off market listings and pocket listings may be included. No representations are made as to the accuracy of this information.
Days on Market Properties Sold Median Sold Price Average $ / sq ft
AVERAGE PRICE PER SQUARE FOOT
Q2 - 2015 MARKET UPDATEYEAR-TO-YEAR COMPARISON 2014/2015
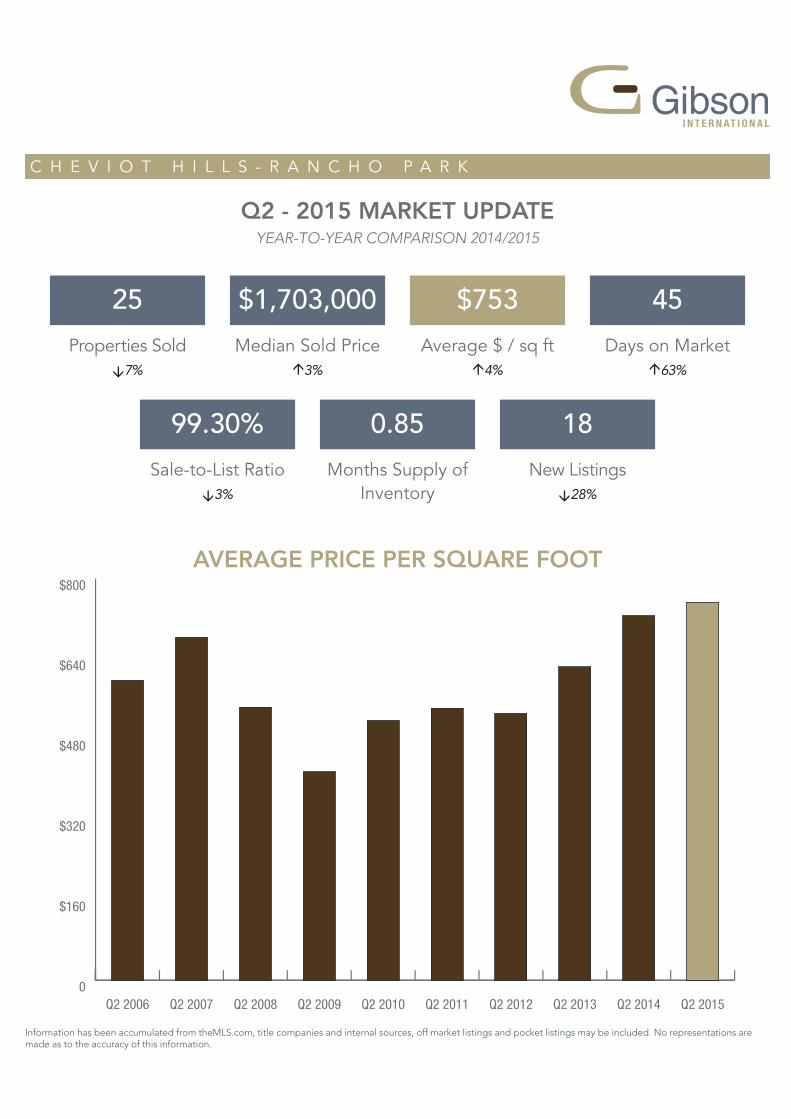
C H E V I O T H I L L S - R A N C H O P A R K
25
99.30%
â3%
$1,703,000
0.85
$753
18
â28%
45
á63%â7% á3% á4%
0
$160
$320
$480
$640
$800
Q2 2015Q2 2014Q2 2013Q2 2012Q2 2011Q2 2010Q2 2009Q2 2008Q2 2007Q2 2006
Sale-to-List Ratio Months Supply of Inventory
New Listings
Information has been accumulated from theMLS.com, title companies and internal sources, off market listings and pocket listings may be included. No representations are made as to the accuracy of this information.
Days on Market Properties Sold Median Sold Price Average $ / sq ft
AVERAGE PRICE PER SQUARE FOOT
Q2 - 2015 MARKET UPDATEYEAR-TO-YEAR COMPARISON 2014/2015
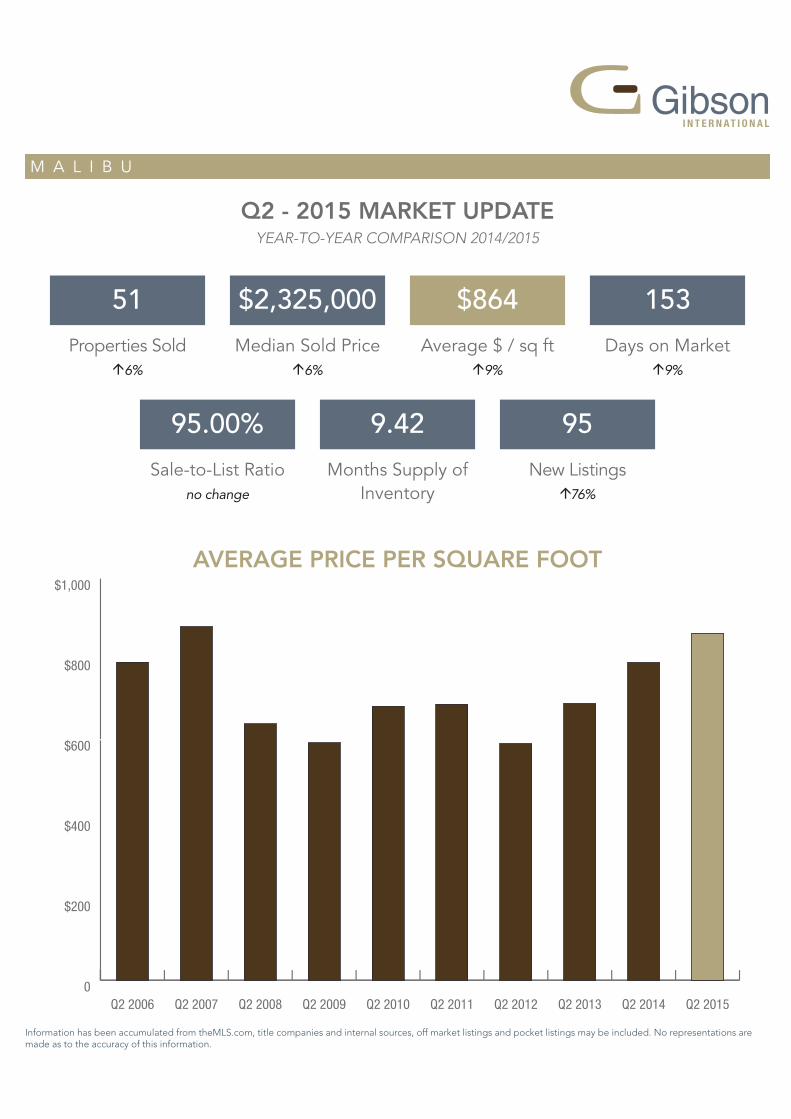
M A L I B U
51
95.00%
no change
$2,325,000
9.42
$864
95
á76%
153
á9%á6% á6% á9%
0
$200
$400
$600
$800
$1,000
Q2 2015Q2 2014Q2 2013Q2 2012Q2 2011Q2 2010Q2 2009Q2 2008Q2 2007Q2 2006
Sale-to-List Ratio Months Supply of Inventory
New Listings
Information has been accumulated from theMLS.com, title companies and internal sources, off market listings and pocket listings may be included. No representations are made as to the accuracy of this information.
Days on Market Properties Sold Median Sold Price Average $ / sq ft
AVERAGE PRICE PER SQUARE FOOT
Q2 - 2015 MARKET UPDATEYEAR-TO-YEAR COMPARISON 2014/2015
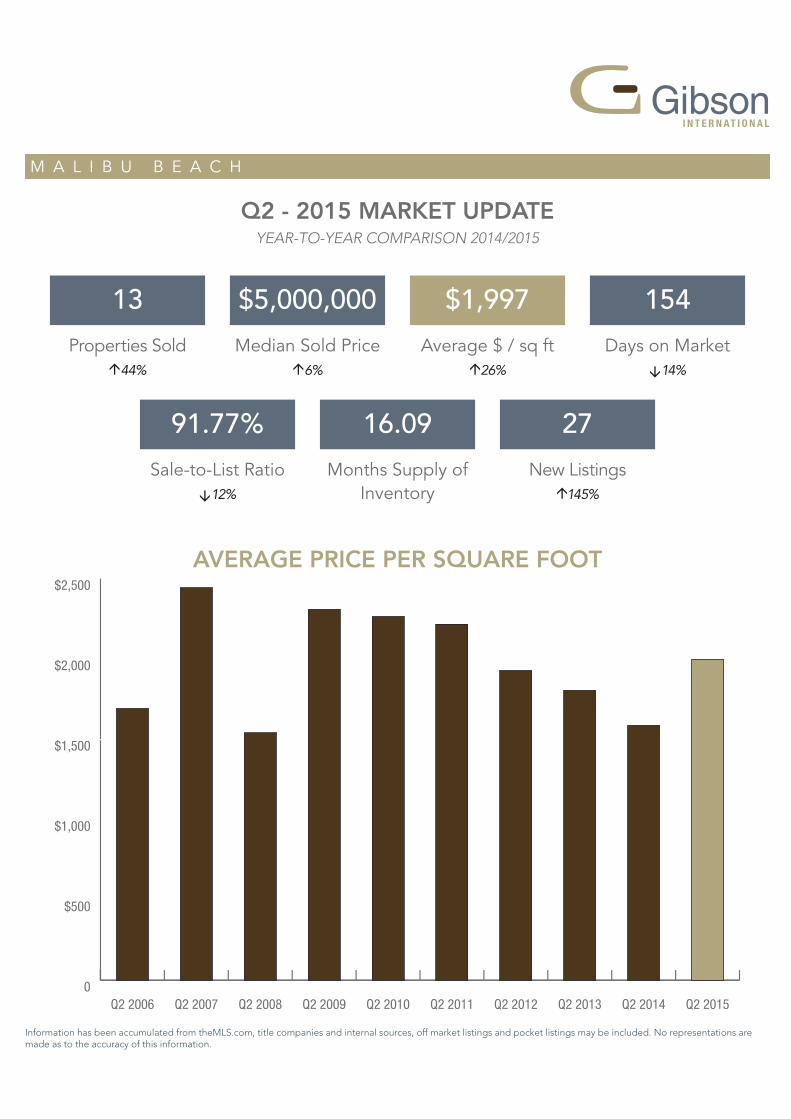
M A L I B U B E A C H
13
91.77%
â12%
$5,000,000
16.09
$1,997
27
á145%
154
â14%á44% á6% á26%
0
$500
$1,000
$1,500
$2,000
$2,500
Q2 2015Q2 2014Q2 2013Q2 2012Q2 2011Q2 2010Q2 2009Q2 2008Q2 2007Q2 2006
Sale-to-List Ratio Months Supply of Inventory
New Listings
Information has been accumulated from theMLS.com, title companies and internal sources, off market listings and pocket listings may be included. No representations are made as to the accuracy of this information.
Days on Market Properties Sold Median Sold Price Average $ / sq ft
AVERAGE PRICE PER SQUARE FOOT
Q2 - 2015 MARKET UPDATEYEAR-TO-YEAR COMPARISON 2014/2015
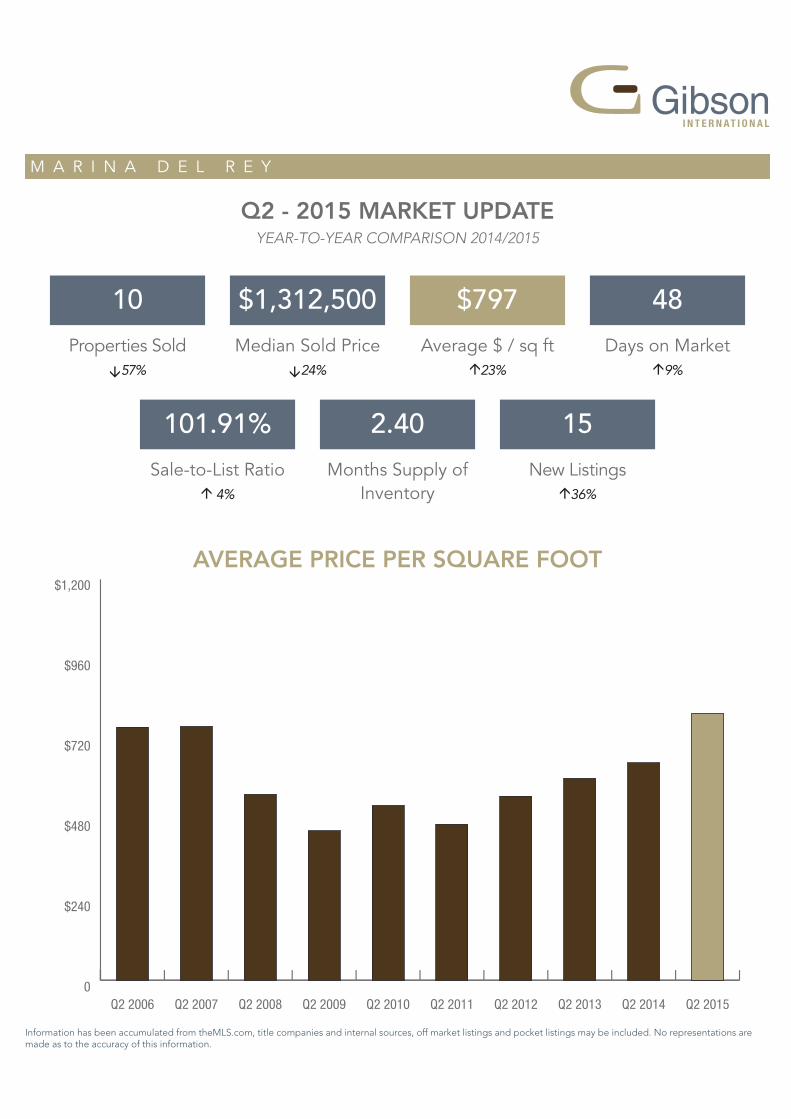
M A R I N A D E L R E Y
10
101.91%
á 4%
$1,312,500
2.40
$797
15
á36%
48
á9%â57% â24% á23%
0
$240
$480
$720
$960
$1,200
Q2 2015Q2 2014Q2 2013Q2 2012Q2 2011Q2 2010Q2 2009Q2 2008Q2 2007Q2 2006
Sale-to-List Ratio Months Supply of Inventory
New Listings
Information has been accumulated from theMLS.com, title companies and internal sources, off market listings and pocket listings may be included. No representations are made as to the accuracy of this information.
Days on Market Properties Sold Median Sold Price Average $ / sq ft
AVERAGE PRICE PER SQUARE FOOT
Q2 - 2015 MARKET UPDATEYEAR-TO-YEAR COMPARISON 2014/2015
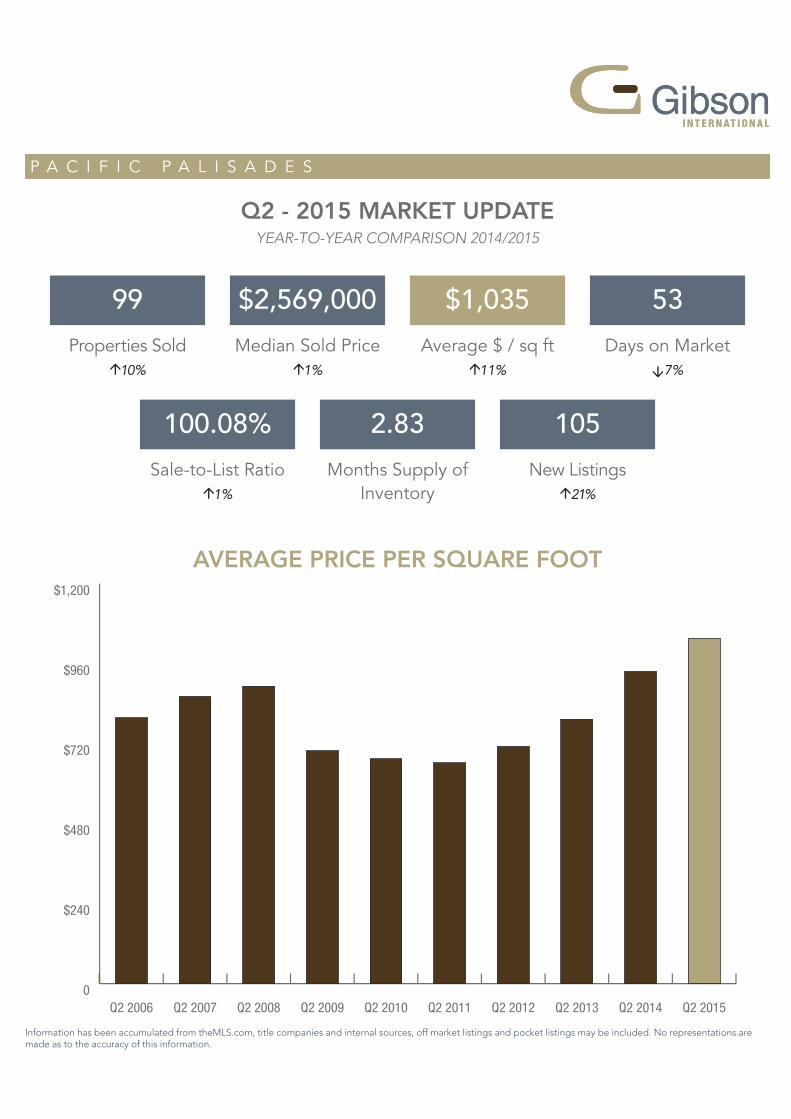
P A C I F I C P A L I S A D E S
99
100.08%
á1%
$2,569,000
2.83
$1,035
105
á21%
53
â7%á10% á1% á11%
0
$240
$480
$720
$960
$1,200
Q2 2015Q2 2014Q2 2013Q2 2012Q2 2011Q2 2010Q2 2009Q2 2008Q2 2007Q2 2006
Sale-to-List Ratio Months Supply of Inventory
New Listings
Information has been accumulated from theMLS.com, title companies and internal sources, off market listings and pocket listings may be included. No representations are made as to the accuracy of this information.
Days on Market Properties Sold Median Sold Price Average $ / sq ft
AVERAGE PRICE PER SQUARE FOOT
Q2 - 2015 MARKET UPDATEYEAR-TO-YEAR COMPARISON 2014/2015
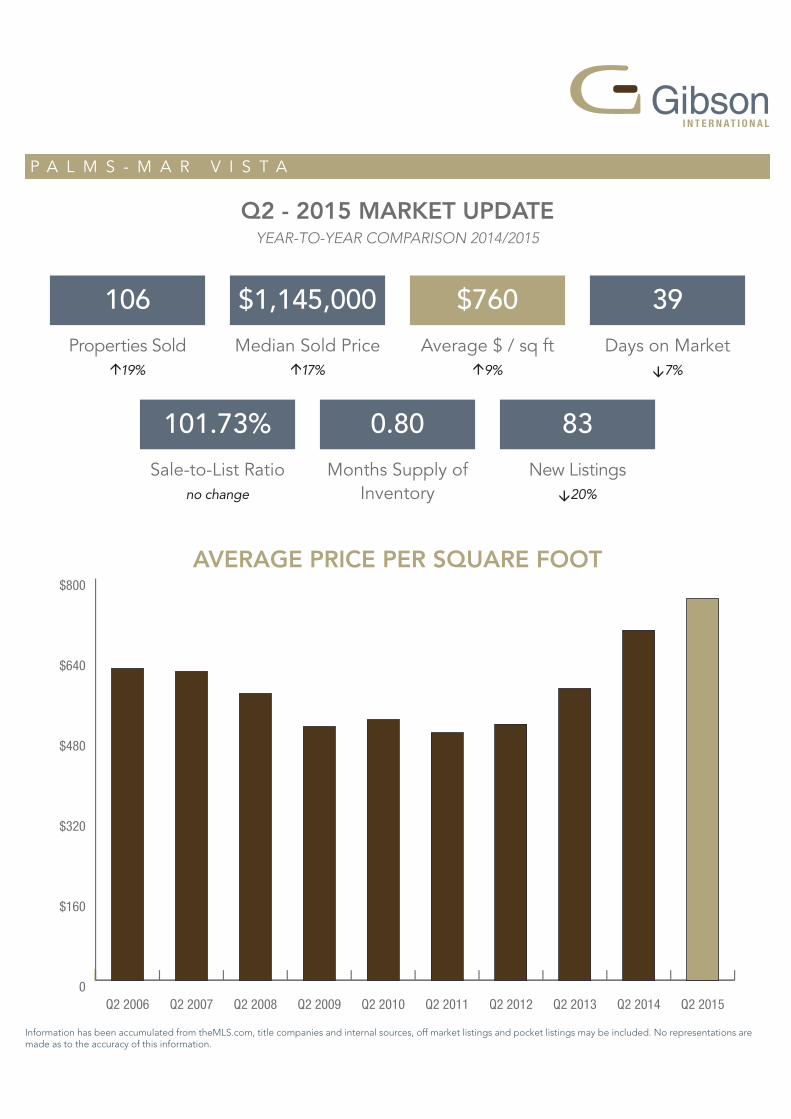
P A L M S - M A R V I S T A
106
101.73%
no change
$1,145,000
0.80
$760
83
â20%
39
â7%á19% á17% á9%
0
$160
$320
$480
$640
$800
Q2 2015Q2 2014Q2 2013Q2 2012Q2 2011Q2 2010Q2 2009Q2 2008Q2 2007Q2 2006
Sale-to-List Ratio Months Supply of Inventory
New Listings
Information has been accumulated from theMLS.com, title companies and internal sources, off market listings and pocket listings may be included. No representations are made as to the accuracy of this information.
Days on Market Properties Sold Median Sold Price Average $ / sq ft
AVERAGE PRICE PER SQUARE FOOT
Q2 - 2015 MARKET UPDATEYEAR-TO-YEAR COMPARISON 2014/2015
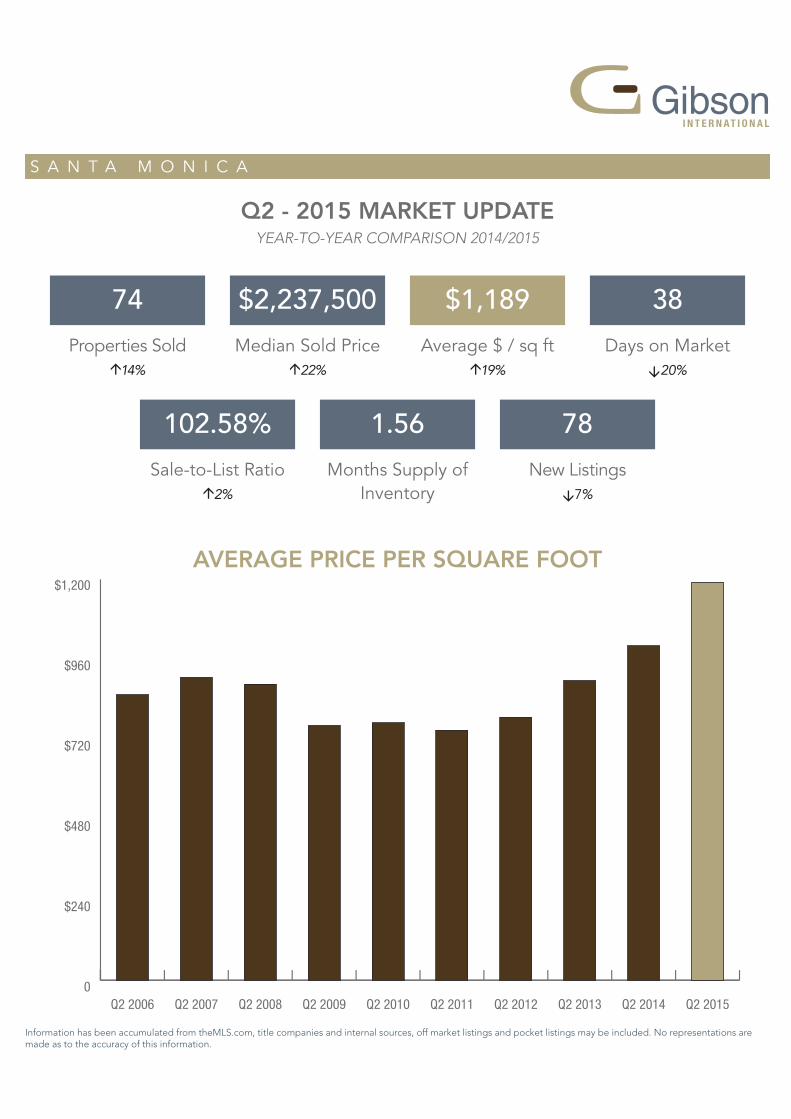
S A N T A M O N I C A
74
102.58%
á2%
$2,237,500
1.56
$1,189
78
â7%
38
â20%á14% á22% á19%
0
$240
$480
$720
$960
$1,200
Q2 2015Q2 2014Q2 2013Q2 2012Q2 2011Q2 2010Q2 2009Q2 2008Q2 2007Q2 2006
Sale-to-List Ratio Months Supply of Inventory
New Listings
Information has been accumulated from theMLS.com, title companies and internal sources, off market listings and pocket listings may be included. No representations are made as to the accuracy of this information.
Days on Market Properties Sold Median Sold Price Average $ / sq ft
AVERAGE PRICE PER SQUARE FOOT
Q2 - 2015 MARKET UPDATEYEAR-TO-YEAR COMPARISON 2014/2015
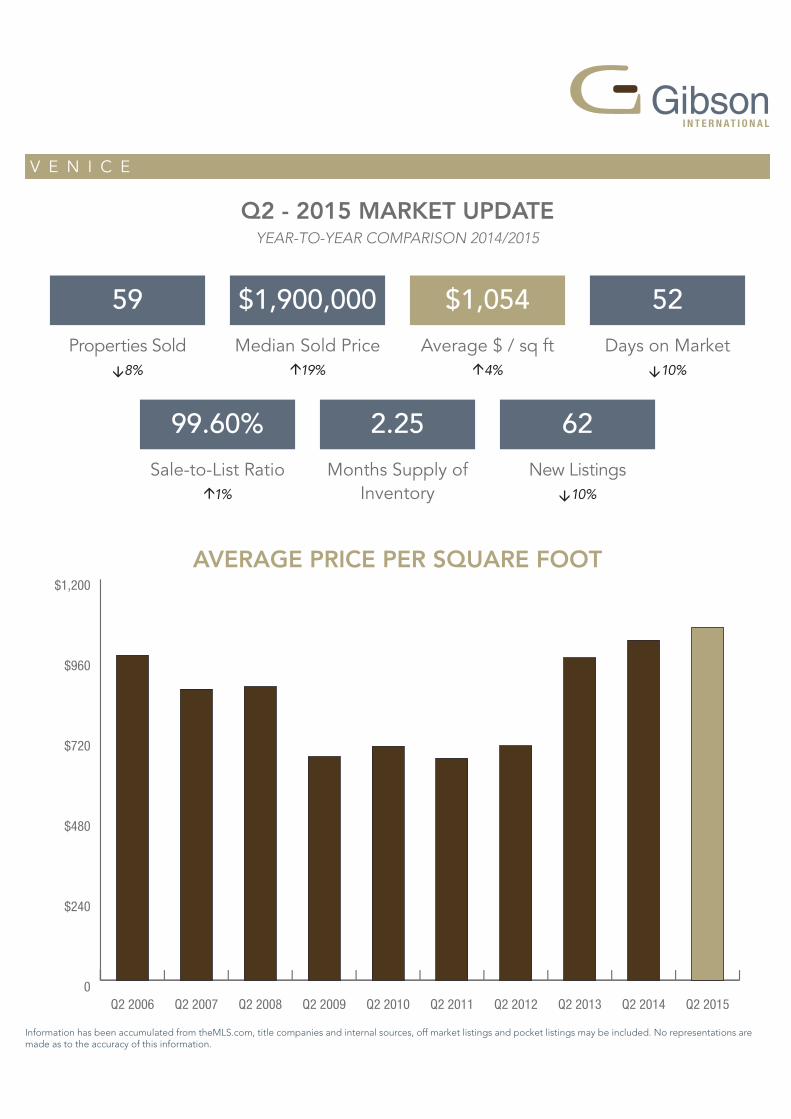
V E N I C E
59
99.60%
á1%
$1,900,000
2.25
$1,054
62
â10%
52
â10%â8% á19% á4%
0
$240
$480
$720
$960
$1,200
Q2 2015Q2 2014Q2 2013Q2 2012Q2 2011Q2 2010Q2 2009Q2 2008Q2 2007Q2 2006
Sale-to-List Ratio Months Supply of Inventory
New Listings
Information has been accumulated from theMLS.com, title companies and internal sources, off market listings and pocket listings may be included. No representations are made as to the accuracy of this information.
Days on Market Properties Sold Median Sold Price Average $ / sq ft
AVERAGE PRICE PER SQUARE FOOT
Q2 - 2015 MARKET UPDATEYEAR-TO-YEAR COMPARISON 2014/2015
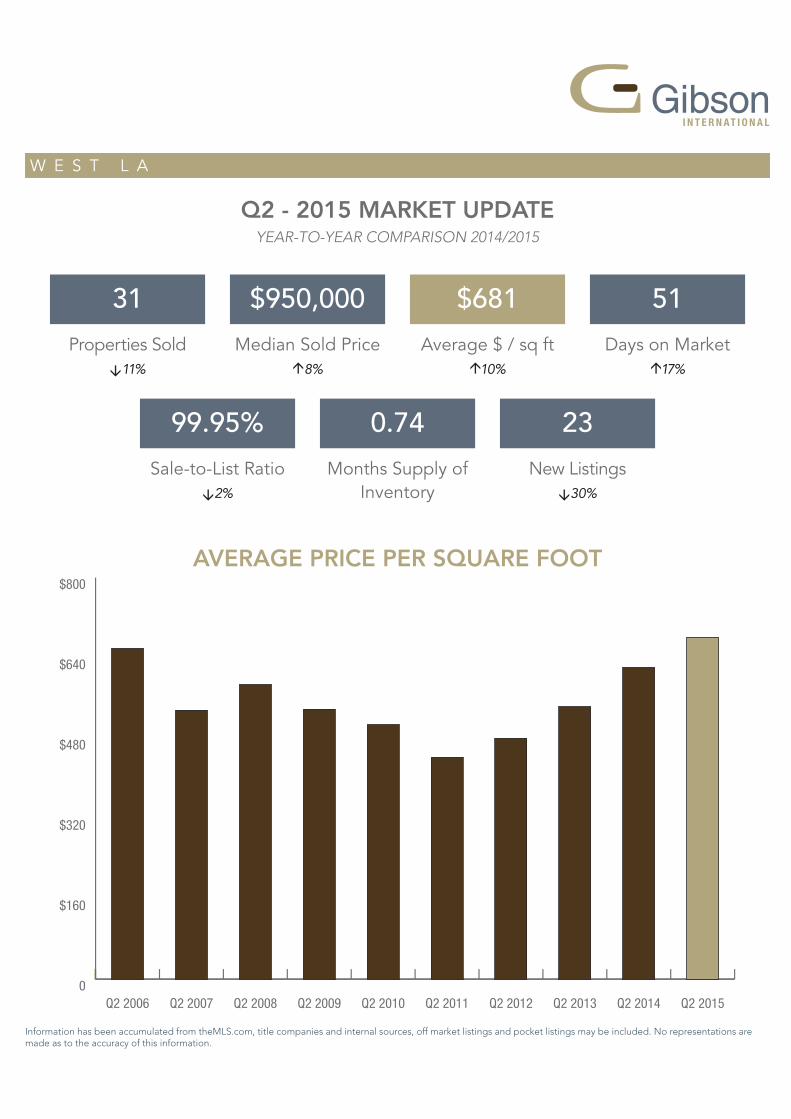
W E S T L A
31
99.95%
â2%
$950,000
0.74
$681
23
â30%
51
á17%â11% á8% á10%
0
$160
$320
$480
$640
$800
Q2 2015Q2 2014Q2 2013Q2 2012Q2 2011Q2 2010Q2 2009Q2 2008Q2 2007Q2 2006
Sale-to-List Ratio Months Supply of Inventory
New Listings
Information has been accumulated from theMLS.com, title companies and internal sources, off market listings and pocket listings may be included. No representations are made as to the accuracy of this information.
Days on Market Properties Sold Median Sold Price Average $ / sq ft
AVERAGE PRICE PER SQUARE FOOT
Q2 - 2015 MARKET UPDATEYEAR-TO-YEAR COMPARISON 2014/2015
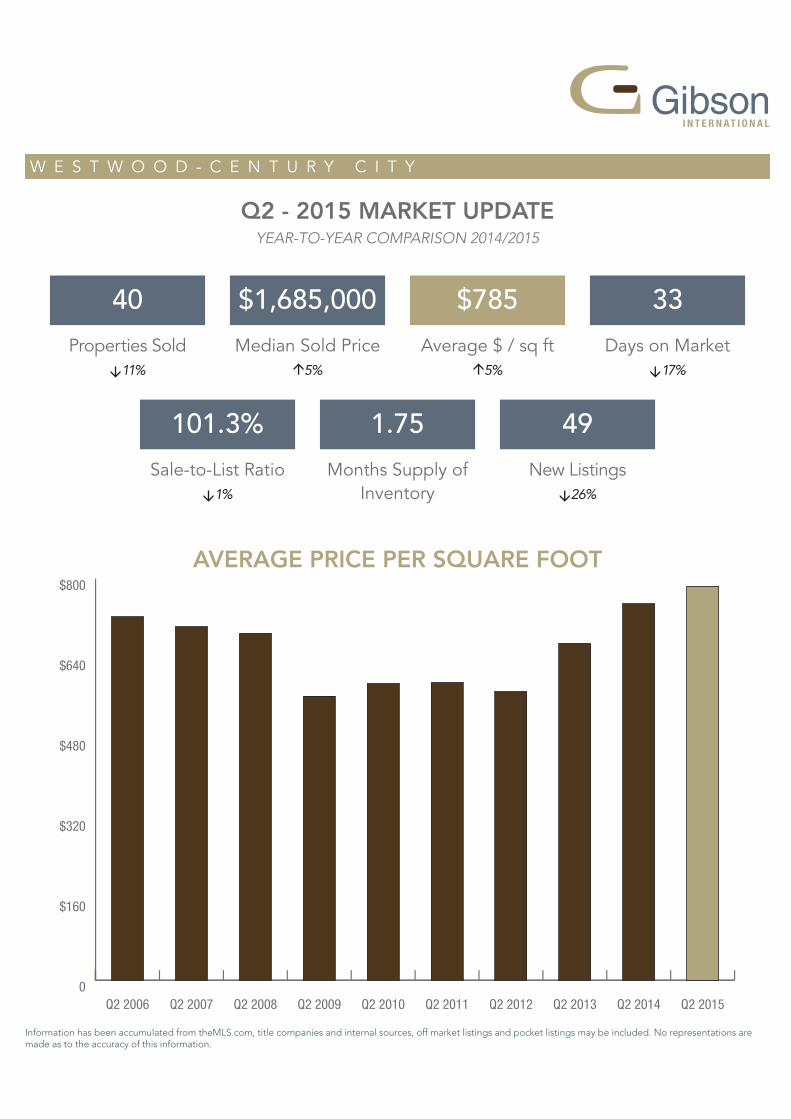
W E S T W O O D - C E N T U R Y C I T Y
40
101.3%
â1%
$1,685,000
1.75
$785
49
â26%
33
â17%â11% á5% á5%
0
$160
$320
$480
$640
$800
Q2 2015Q2 2014Q2 2013Q2 2012Q2 2011Q2 2010Q2 2009Q2 2008Q2 2007Q2 2006
Sale-to-List Ratio Months Supply of Inventory
New Listings
Information has been accumulated from theMLS.com, title companies and internal sources, off market listings and pocket listings may be included. No representations are made as to the accuracy of this information.
Days on Market Properties Sold Median Sold Price Average $ / sq ft
AVERAGE PRICE PER SQUARE FOOT
Q2 - 2015 MARKET UPDATEYEAR-TO-YEAR COMPARISON 2014/2015
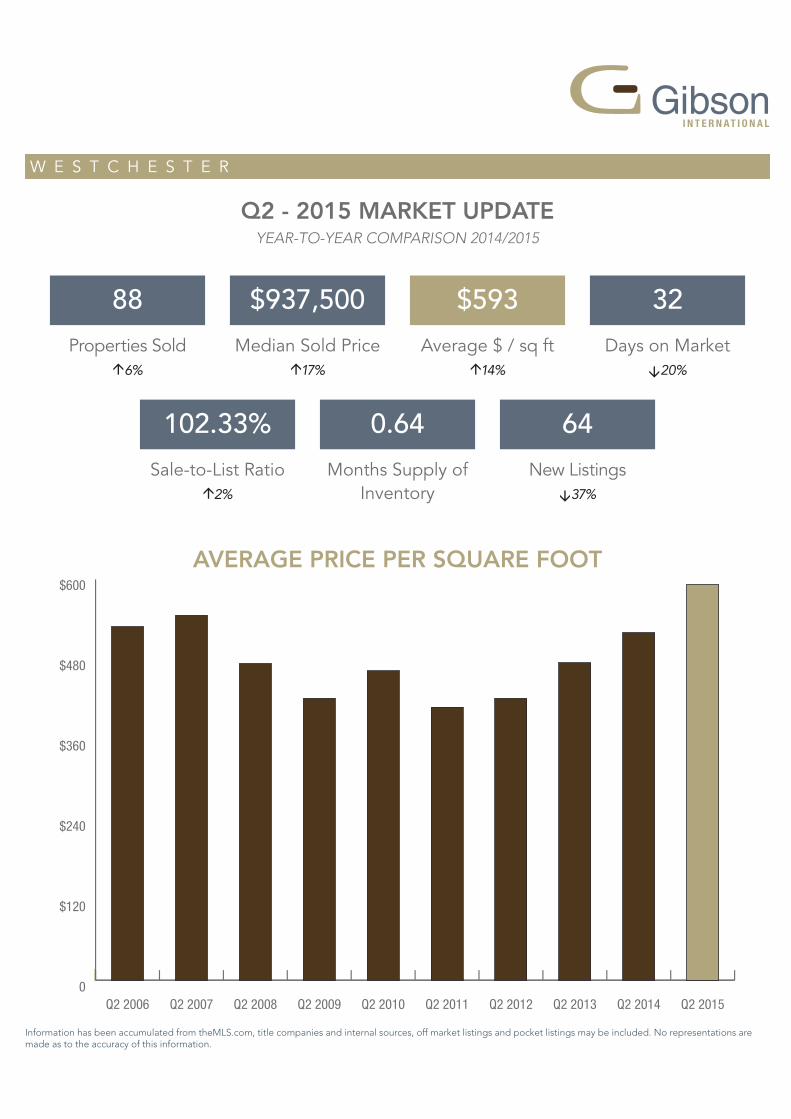
W E S T C H E S T E R
88
102.33%
á2%
$937,500
0.64
$593
64
â37%
32
â20%á6% á17% á14%
0
$120
$240
$360
$480
$600
Q2 2015Q2 2014Q2 2013Q2 2012Q2 2011Q2 2010Q2 2009Q2 2008Q2 2007Q2 2006
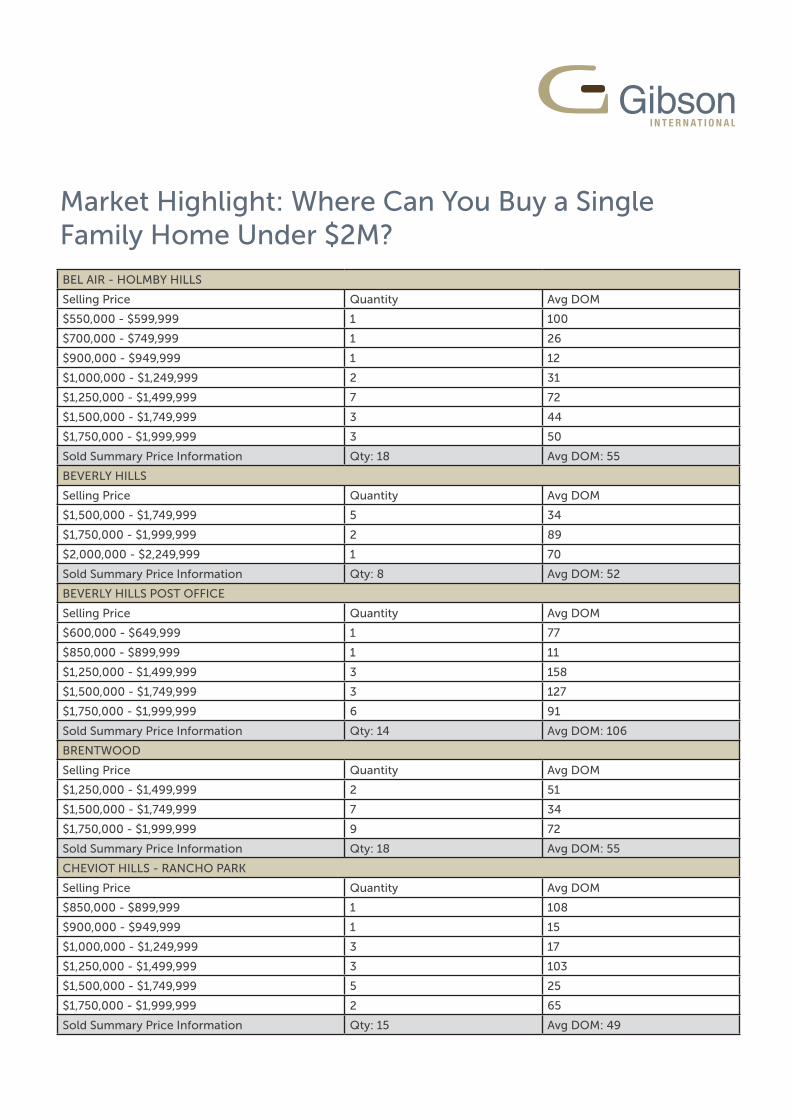
Market Highlight: Where Can You Buy a Single Family Home Under $2M?
BEL AIR - HOLMBY HILLS
Selling Price Quantity Avg DOM
$550,000 - $599,999 1 100
$700,000 - $749,999 1 26
$900,000 - $949,999 1 12
$1,000,000 - $1,249,999 2 31
$1,250,000 - $1,499,999 7 72
$1,500,000 - $1,749,999 3 44
$1,750,000 - $1,999,999 3 50
Sold Summary Price Information Qty: 18 Avg DOM: 55
BEVERLY HILLS
Selling Price Quantity Avg DOM
$1,500,000 - $1,749,999 5 34
$1,750,000 - $1,999,999 2 89
$2,000,000 - $2,249,999 1 70
Sold Summary Price Information Qty: 8 Avg DOM: 52
BEVERLY HILLS POST OFFICE
Selling Price Quantity Avg DOM
$600,000 - $649,999 1 77
$850,000 - $899,999 1 11
$1,250,000 - $1,499,999 3 158
$1,500,000 - $1,749,999 3 127
$1,750,000 - $1,999,999 6 91
Sold Summary Price Information Qty: 14 Avg DOM: 106
BRENTWOOD
Selling Price Quantity Avg DOM
$1,250,000 - $1,499,999 2 51
$1,500,000 - $1,749,999 7 34
$1,750,000 - $1,999,999 9 72
Sold Summary Price Information Qty: 18 Avg DOM: 55
CHEVIOT HILLS - RANCHO PARK
Selling Price Quantity Avg DOM
$850,000 - $899,999 1 108
$900,000 - $949,999 1 15
$1,000,000 - $1,249,999 3 17
$1,250,000 - $1,499,999 3 103
$1,500,000 - $1,749,999 5 25
$1,750,000 - $1,999,999 2 65
Sold Summary Price Information Qty: 15 Avg DOM: 49
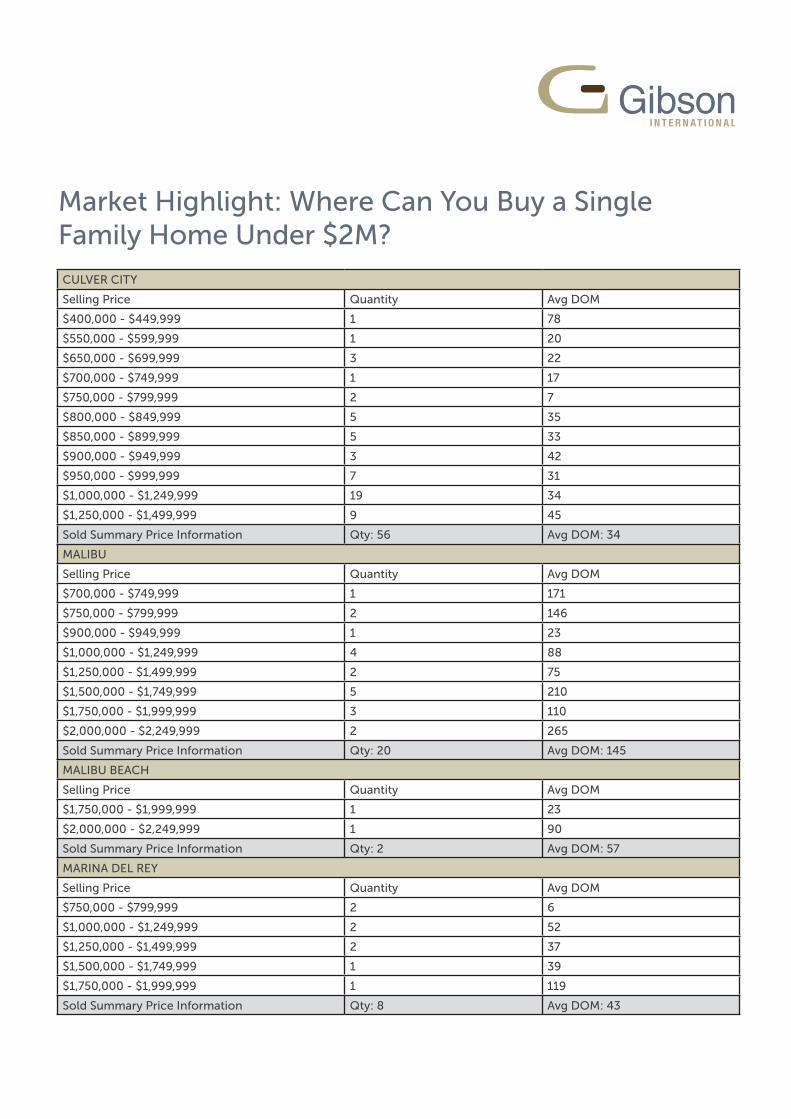
CULVER CITY
Selling Price Quantity Avg DOM
$400,000 - $449,999 1 78
$550,000 - $599,999 1 20
$650,000 - $699,999 3 22
$700,000 - $749,999 1 17
$750,000 - $799,999 2 7
$800,000 - $849,999 5 35
$850,000 - $899,999 5 33
$900,000 - $949,999 3 42
$950,000 - $999,999 7 31
$1,000,000 - $1,249,999 19 34
$1,250,000 - $1,499,999 9 45
Sold Summary Price Information Qty: 56 Avg DOM: 34
MALIBU
Selling Price Quantity Avg DOM
$700,000 - $749,999 1 171
$750,000 - $799,999 2 146
$900,000 - $949,999 1 23
$1,000,000 - $1,249,999 4 88
$1,250,000 - $1,499,999 2 75
$1,500,000 - $1,749,999 5 210
$1,750,000 - $1,999,999 3 110
$2,000,000 - $2,249,999 2 265
Sold Summary Price Information Qty: 20 Avg DOM: 145
MALIBU BEACH
Selling Price Quantity Avg DOM
$1,750,000 - $1,999,999 1 23
$2,000,000 - $2,249,999 1 90
Sold Summary Price Information Qty: 2 Avg DOM: 57
MARINA DEL REY
Selling Price Quantity Avg DOM
$750,000 - $799,999 2 6
$1,000,000 - $1,249,999 2 52
$1,250,000 - $1,499,999 2 37
$1,500,000 - $1,749,999 1 39
$1,750,000 - $1,999,999 1 119
Sold Summary Price Information Qty: 8 Avg DOM: 43
Market Highlight: Where Can You Buy a Single Family Home Under $2M?
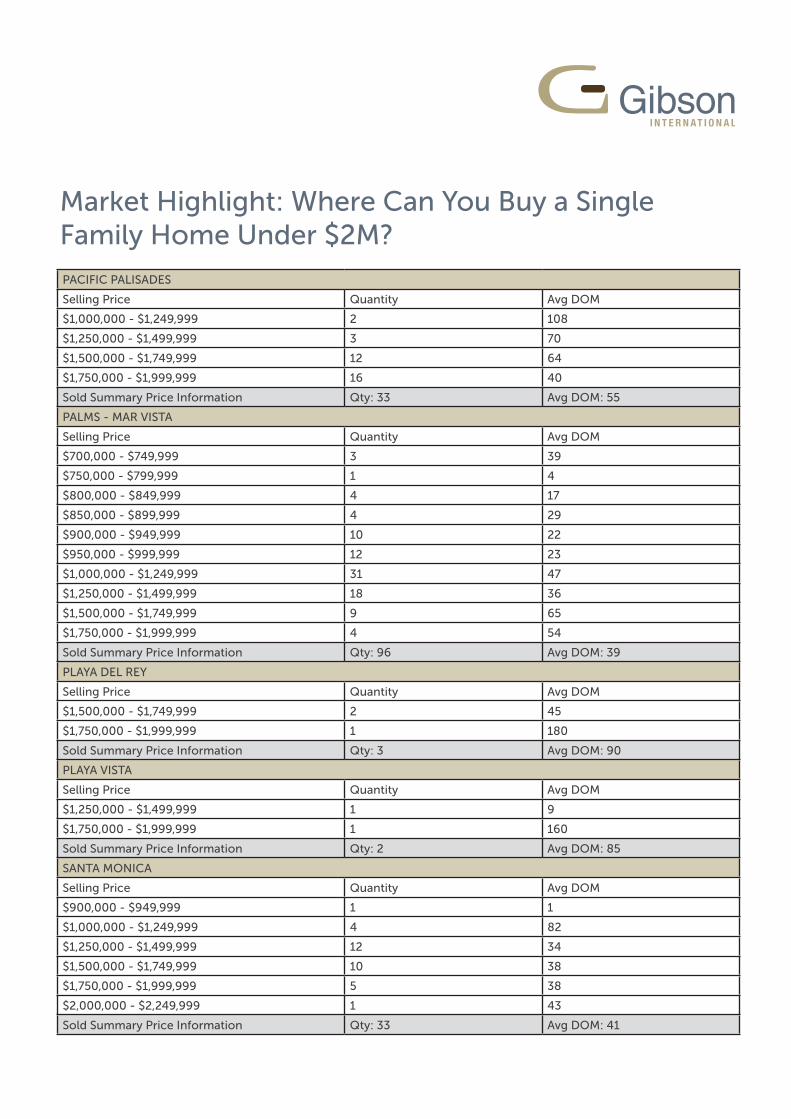
PACIFIC PALISADES
Selling Price Quantity Avg DOM
$1,000,000 - $1,249,999 2 108
$1,250,000 - $1,499,999 3 70
$1,500,000 - $1,749,999 12 64
$1,750,000 - $1,999,999 16 40
Sold Summary Price Information Qty: 33 Avg DOM: 55
PALMS - MAR VISTA
Selling Price Quantity Avg DOM
$700,000 - $749,999 3 39
$750,000 - $799,999 1 4
$800,000 - $849,999 4 17
$850,000 - $899,999 4 29
$900,000 - $949,999 10 22
$950,000 - $999,999 12 23
$1,000,000 - $1,249,999 31 47
$1,250,000 - $1,499,999 18 36
$1,500,000 - $1,749,999 9 65
$1,750,000 - $1,999,999 4 54
Sold Summary Price Information Qty: 96 Avg DOM: 39
PLAYA DEL REY
Selling Price Quantity Avg DOM
$1,500,000 - $1,749,999 2 45
$1,750,000 - $1,999,999 1 180
Sold Summary Price Information Qty: 3 Avg DOM: 90
PLAYA VISTA
Selling Price Quantity Avg DOM
$1,250,000 - $1,499,999 1 9
$1,750,000 - $1,999,999 1 160
Sold Summary Price Information Qty: 2 Avg DOM: 85
SANTA MONICA
Selling Price Quantity Avg DOM
$900,000 - $949,999 1 1
$1,000,000 - $1,249,999 4 82
$1,250,000 - $1,499,999 12 34
$1,500,000 - $1,749,999 10 38
$1,750,000 - $1,999,999 5 38
$2,000,000 - $2,249,999 1 43
Sold Summary Price Information Qty: 33 Avg DOM: 41
Market Highlight: Where Can You Buy a Single Family Home Under $2M?
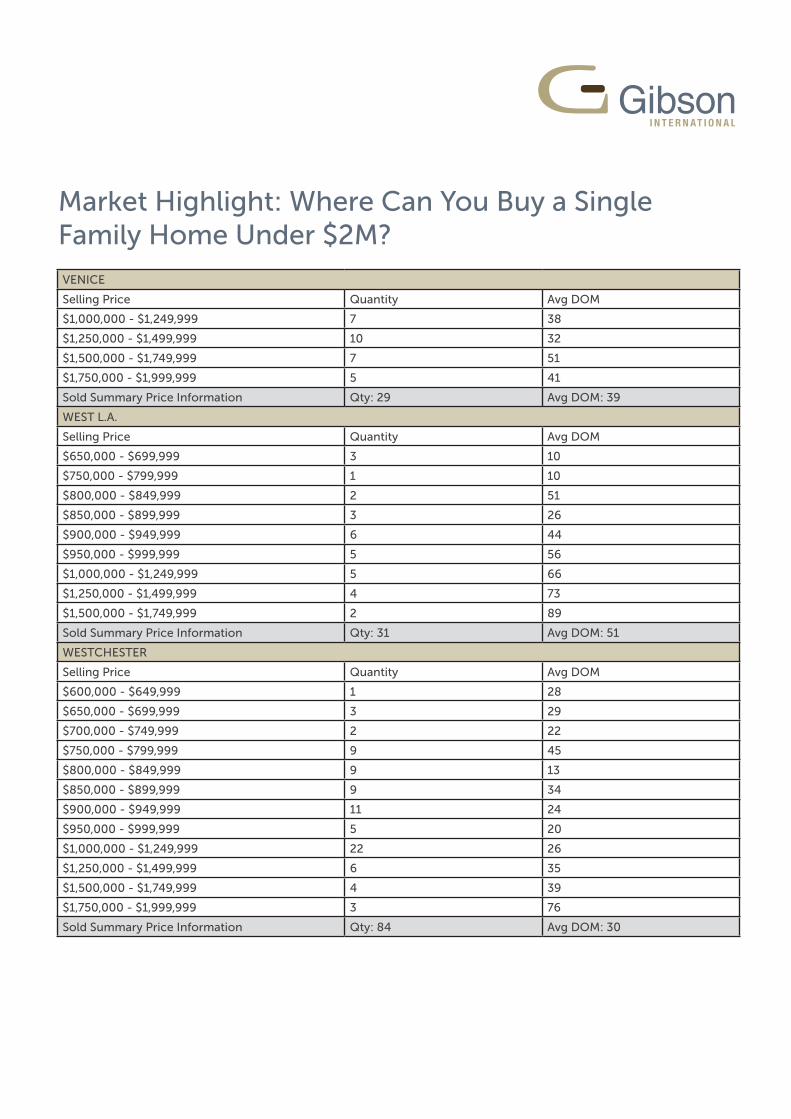
VENICE
Selling Price Quantity Avg DOM
$1,000,000 - $1,249,999 7 38
$1,250,000 - $1,499,999 10 32
$1,500,000 - $1,749,999 7 51
$1,750,000 - $1,999,999 5 41
Sold Summary Price Information Qty: 29 Avg DOM: 39
WEST L.A.
Selling Price Quantity Avg DOM
$650,000 - $699,999 3 10
$750,000 - $799,999 1 10
$800,000 - $849,999 2 51
$850,000 - $899,999 3 26
$900,000 - $949,999 6 44
$950,000 - $999,999 5 56
$1,000,000 - $1,249,999 5 66
$1,250,000 - $1,499,999 4 73
$1,500,000 - $1,749,999 2 89
Sold Summary Price Information Qty: 31 Avg DOM: 51
WESTCHESTER
Selling Price Quantity Avg DOM
$600,000 - $649,999 1 28
$650,000 - $699,999 3 29
$700,000 - $749,999 2 22
$750,000 - $799,999 9 45
$800,000 - $849,999 9 13
$850,000 - $899,999 9 34
$900,000 - $949,999 11 24
$950,000 - $999,999 5 20
$1,000,000 - $1,249,999 22 26
$1,250,000 - $1,499,999 6 35
$1,500,000 - $1,749,999 4 39
$1,750,000 - $1,999,999 3 76
Sold Summary Price Information Qty: 84 Avg DOM: 30
Market Highlight: Where Can You Buy a Single Family Home Under $2M?
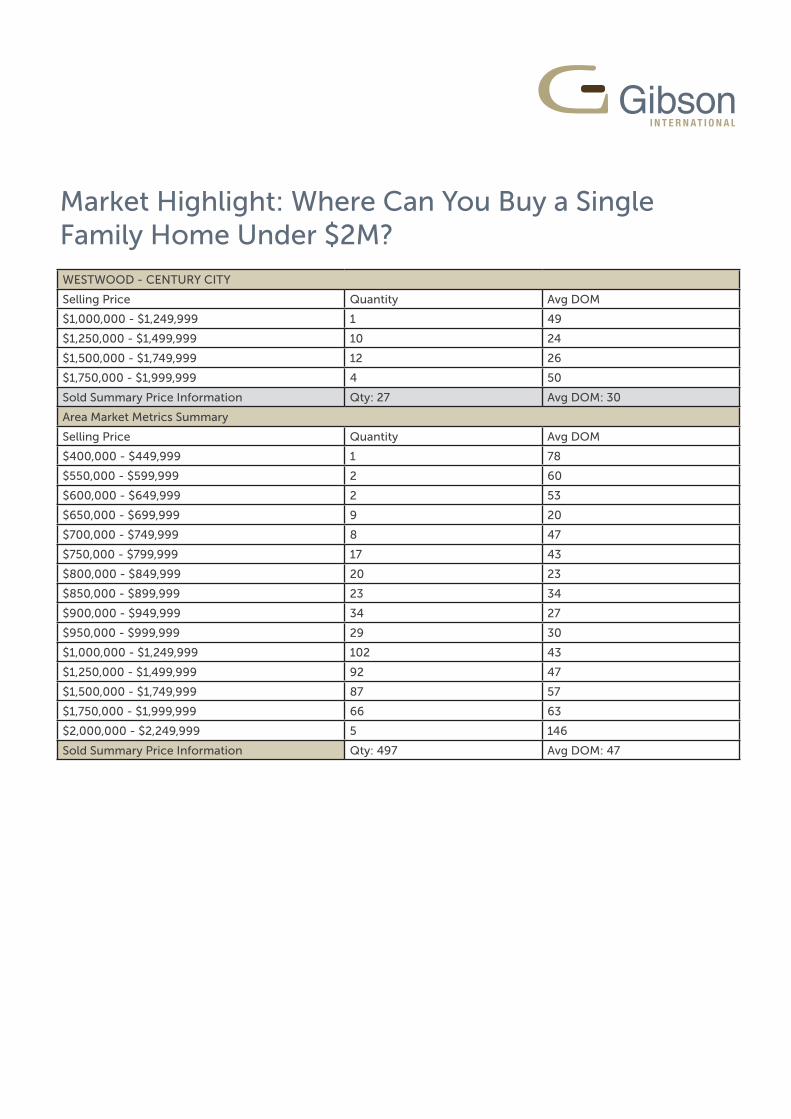
WESTWOOD - CENTURY CITY
Selling Price Quantity Avg DOM
$1,000,000 - $1,249,999 1 49
$1,250,000 - $1,499,999 10 24
$1,500,000 - $1,749,999 12 26
$1,750,000 - $1,999,999 4 50
Sold Summary Price Information Qty: 27 Avg DOM: 30
Area Market Metrics Summary
Selling Price Quantity Avg DOM
$400,000 - $449,999 1 78
$550,000 - $599,999 2 60
$600,000 - $649,999 2 53
$650,000 - $699,999 9 20
$700,000 - $749,999 8 47
$750,000 - $799,999 17 43
$800,000 - $849,999 20 23
$850,000 - $899,999 23 34
$900,000 - $949,999 34 27
$950,000 - $999,999 29 30
$1,000,000 - $1,249,999 102 43
$1,250,000 - $1,499,999 92 47
$1,500,000 - $1,749,999 87 57
$1,750,000 - $1,999,999 66 63
$2,000,000 - $2,249,999 5 146
Sold Summary Price Information Qty: 497 Avg DOM: 47
Market Highlight: Where Can You Buy a Single Family Home Under $2M?

Westside Condo Market Overview
Sale-to-List Ratio Months Supply of Inventory
New Listings
Information has been accumulated from theMLS.com, title companies and internal sources, off market listings and pocket listings may be included. No representations are made as to the accuracy of this information.
Days on Market Properties Sold Median Sold Price Average $ / sq ft
AVERAGE PRICE PER SQUARE FOOT
Q2 - 2015 MARKET UPDATEYEAR-TO-YEAR COMPARISON 2014/2015
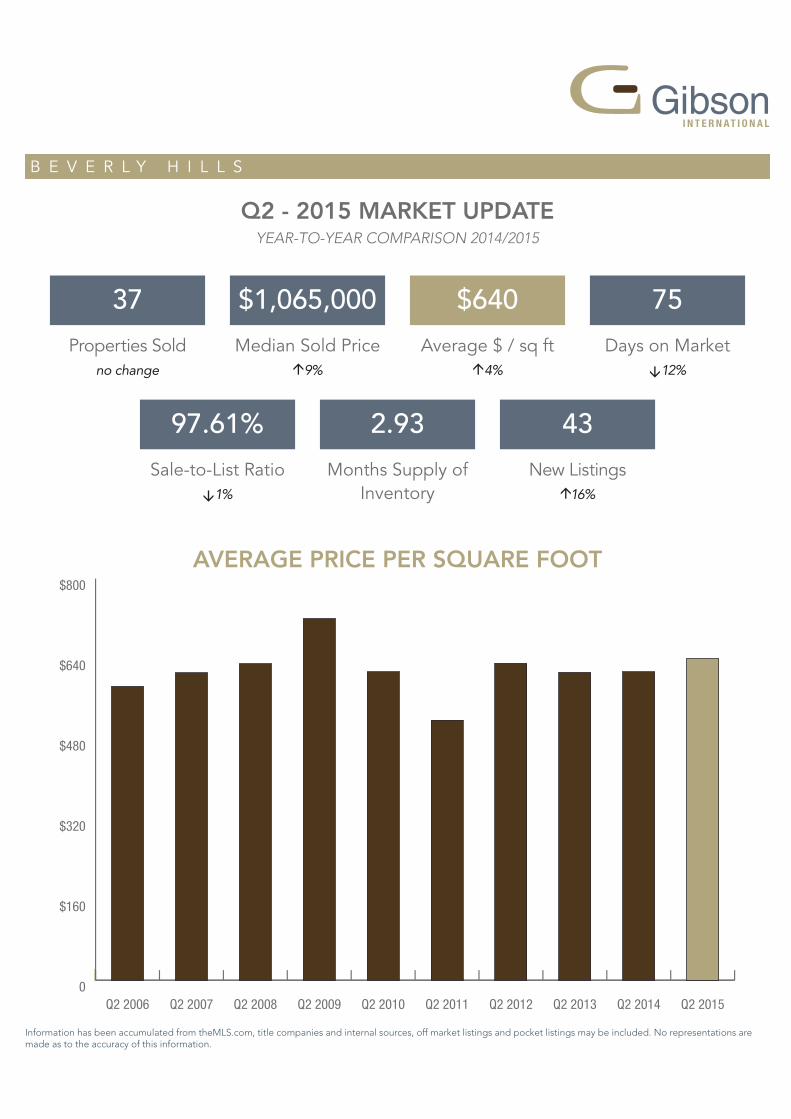
B E V E R L Y H I L L S
37
97.61%
â1%
$1,065,000
2.93
$640
43
á16%
75
â12%no change á9% á4%
0
$160
$320
$480
$640
$800
Q2 2015Q2 2014Q2 2013Q2 2012Q2 2011Q2 2010Q2 2009Q2 2008Q2 2007Q2 2006
Sale-to-List Ratio Months Supply of Inventory
New Listings
Information has been accumulated from theMLS.com, title companies and internal sources, off market listings and pocket listings may be included. No representations are made as to the accuracy of this information.
Days on Market Properties Sold Median Sold Price Average $ / sq ft
AVERAGE PRICE PER SQUARE FOOT
Q2 - 2015 MARKET UPDATEYEAR-TO-YEAR COMPARISON 2014/2015
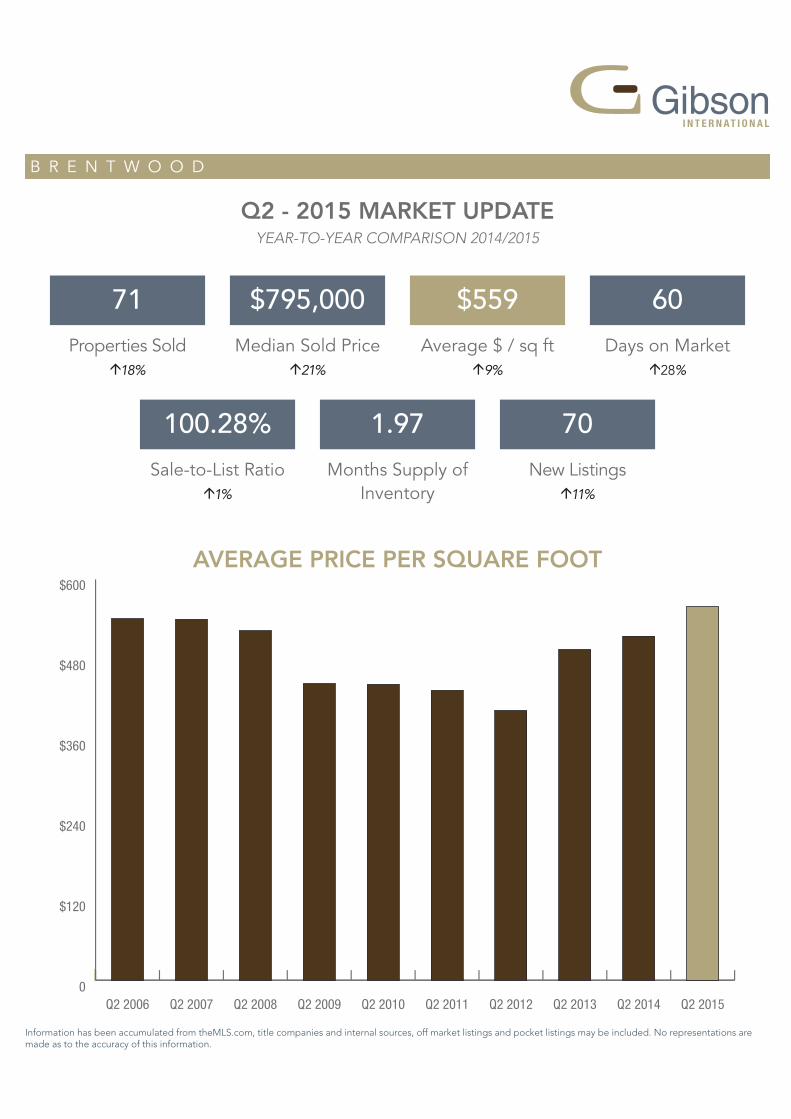
B R E N T W O O D
0
$120
$240
$360
$480
$600
Q2 2015Q2 2014Q2 2013Q2 2012Q2 2011Q2 2010Q2 2009Q2 2008Q2 2007Q2 2006
71
100.28%
á1%
$795,000
1.97
$559
70
á11%
60
á28%á18% á21% á9%

Sale-to-List Ratio Months Supply of Inventory
New Listings
Information has been accumulated from theMLS.com, title companies and internal sources, off market listings and pocket listings may be included. No representations are made as to the accuracy of this information.
Days on Market Properties Sold Median Sold Price Average $ / sq ft
AVERAGE PRICE PER SQUARE FOOT
Q2 - 2015 MARKET UPDATEYEAR-TO-YEAR COMPARISON 2014/2015
M A L I B U
20
95.46%
á1%
$749,500
5.63
$572
22
á175%
94
â29%á150% â25% â8%
0
$160
$320
$480
$640
$800
Q2 2015Q2 2014Q2 2013Q2 2012Q2 2011Q2 2010Q2 2009Q2 2008Q2 2007Q2 2006
Sale-to-List Ratio Months Supply of Inventory
New Listings
Information has been accumulated from theMLS.com, title companies and internal sources, off market listings and pocket listings may be included. No representations are made as to the accuracy of this information.
Days on Market Properties Sold Median Sold Price Average $ / sq ft
AVERAGE PRICE PER SQUARE FOOT
Q2 - 2015 MARKET UPDATEYEAR-TO-YEAR COMPARISON 2014/2015
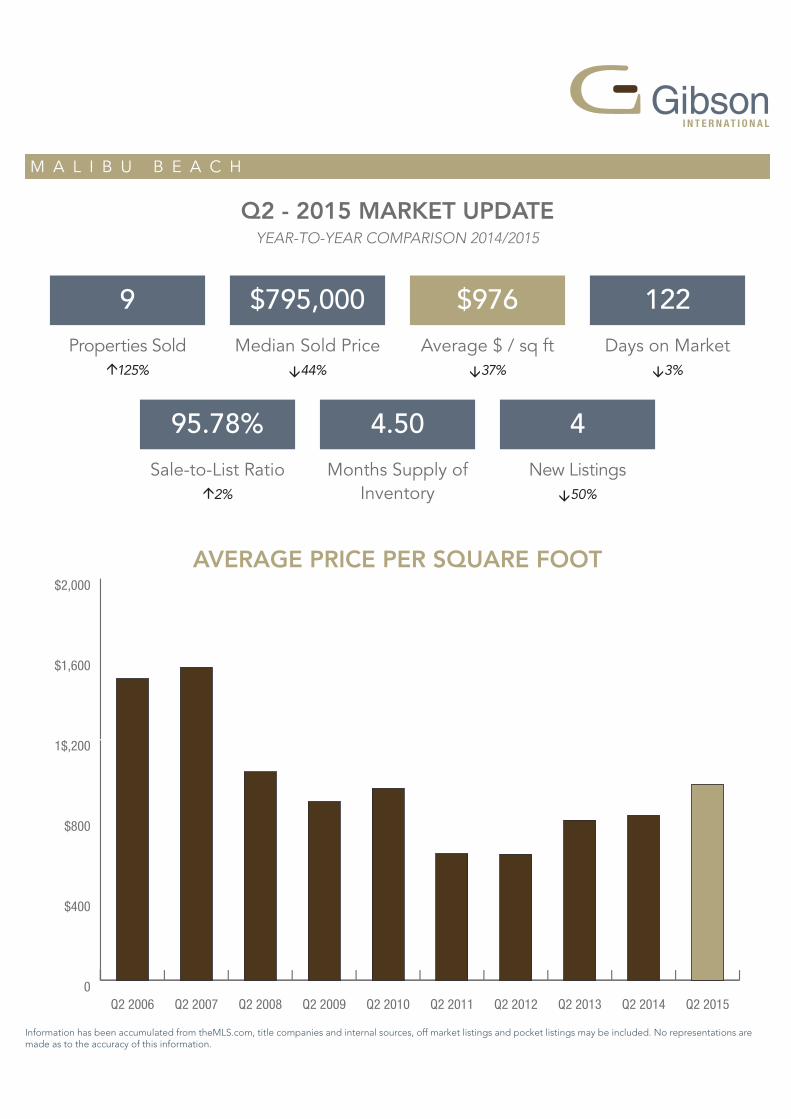
M A L I B U B E A C H
0
$400
$800
1$,200
$1,600
$2,000
Q2 2015Q2 2014Q2 2013Q2 2012Q2 2011Q2 2010Q2 2009Q2 2008Q2 2007Q2 2006
9
95.78%
á2%
$795,000
4.50
$976
4
â50%
122
â3%á125% â44% â37%

Sale-to-List Ratio Months Supply of Inventory
New Listings
Information has been accumulated from theMLS.com, title companies and internal sources, off market listings and pocket listings may be included. No representations are made as to the accuracy of this information.
Days on Market Properties Sold Median Sold Price Average $ / sq ft
AVERAGE PRICE PER SQUARE FOOT
Q2 - 2015 MARKET UPDATEYEAR-TO-YEAR COMPARISON 2014/2015
M A R I N A D E L R E Y
0
$160
$320
$480
$640
$800
Q2 2015Q2 2014Q2 2013Q2 2012Q2 2011Q2 2010Q2 2009Q2 2008Q2 2007Q2 2006
85
98.86%
á1%
$830,000
1.98
$624
60
â38%
80
á6%â9% á7% á13%
Sale-to-List Ratio Months Supply of Inventory
New Listings
Information has been accumulated from theMLS.com, title companies and internal sources, off market listings and pocket listings may be included. No representations are made as to the accuracy of this information.
Days on Market Properties Sold Median Sold Price Average $ / sq ft
AVERAGE PRICE PER SQUARE FOOT
Q2 - 2015 MARKET UPDATEYEAR-TO-YEAR COMPARISON 2014/2015
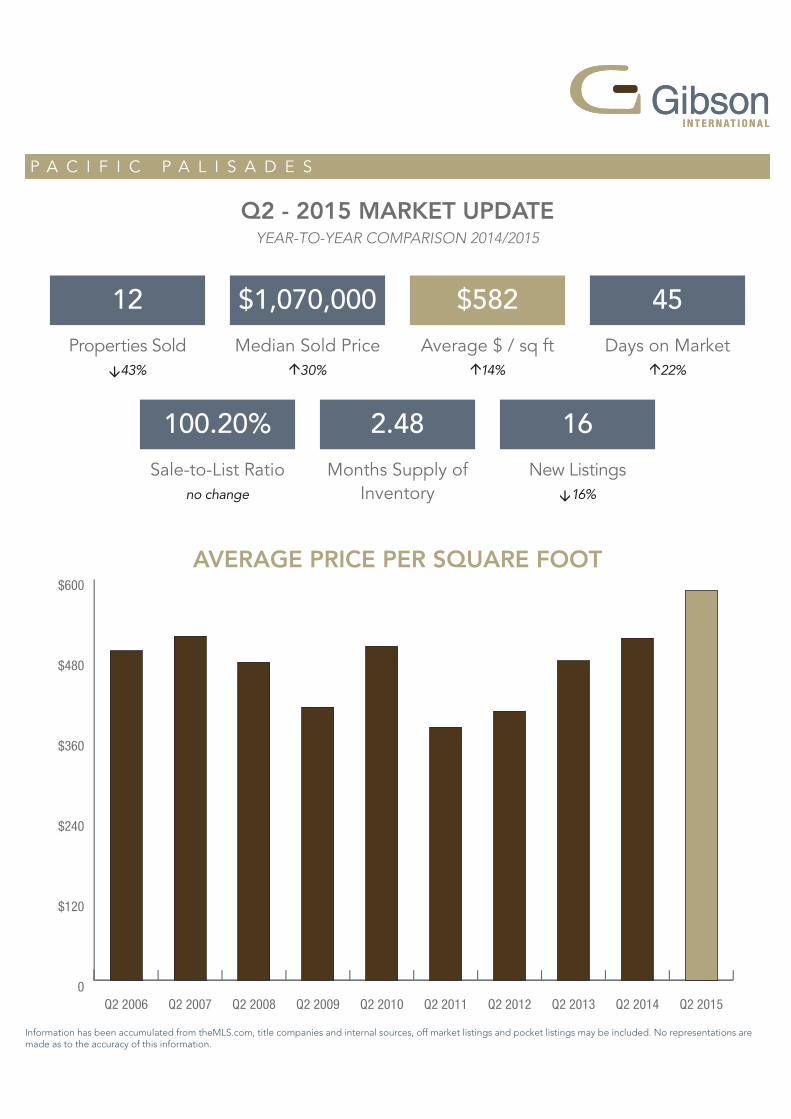
P A C I F I C P A L I S A D E S
0
$120
$240
$360
$480
$600
Q2 2015Q2 2014Q2 2013Q2 2012Q2 2011Q2 2010Q2 2009Q2 2008Q2 2007Q2 2006
12
100.20%
no change
$1,070,000
2.48
$582
16
â16%
45
á22%â43% á30% á14%
Sale-to-List Ratio Months Supply of Inventory
New Listings
Information has been accumulated from theMLS.com, title companies and internal sources, off market listings and pocket listings may be included. No representations are made as to the accuracy of this information.
Days on Market Properties Sold Median Sold Price Average $ / sq ft
AVERAGE PRICE PER SQUARE FOOT
Q2 - 2015 MARKET UPDATEYEAR-TO-YEAR COMPARISON 2014/2015
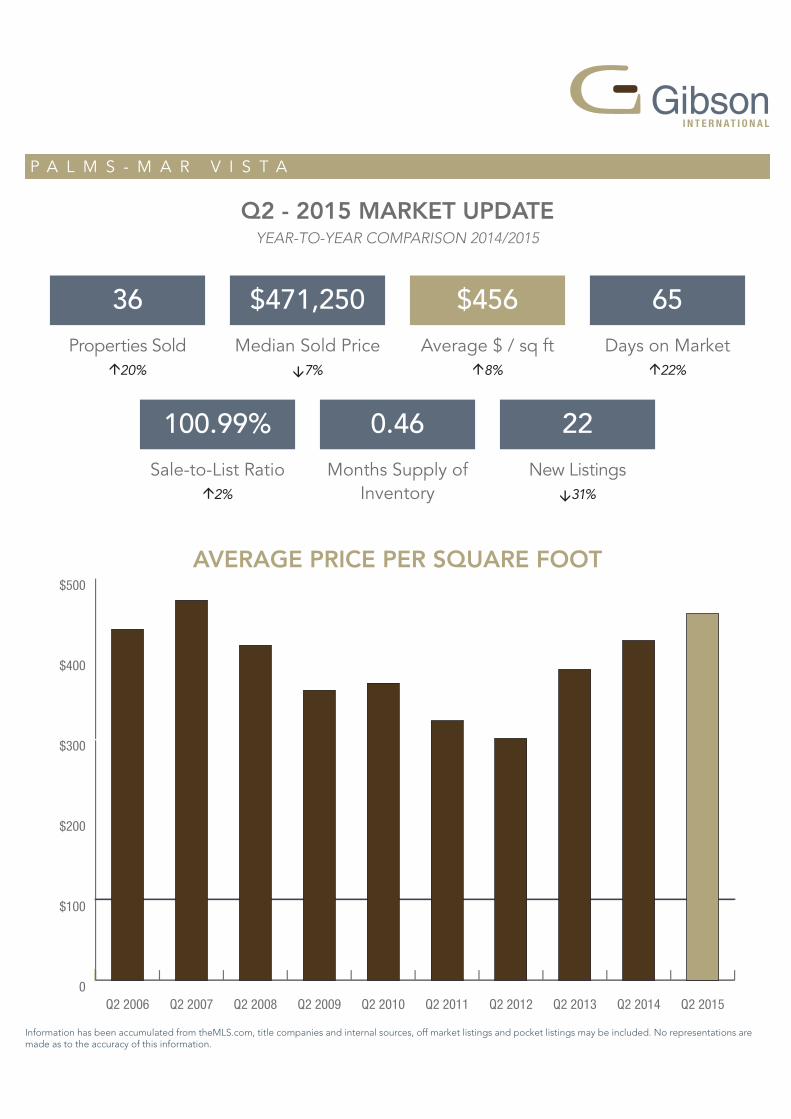
P A L M S - M A R V I S T A
0
$100
$200
$300
$400
$500
Q2 2015Q2 2014Q2 2013Q2 2012Q2 2011Q2 2010Q2 2009Q2 2008Q2 2007Q2 2006
36
100.99%
á2%
$471,250
0.46
$456
22
â31%
65
á22%á20% â7% á8%
Sale-to-List Ratio Months Supply of Inventory
New Listings
Information has been accumulated from theMLS.com, title companies and internal sources, off market listings and pocket listings may be included. No representations are made as to the accuracy of this information.
Days on Market Properties Sold Median Sold Price Average $ / sq ft
AVERAGE PRICE PER SQUARE FOOT
Q2 - 2015 MARKET UPDATEYEAR-TO-YEAR COMPARISON 2014/2015
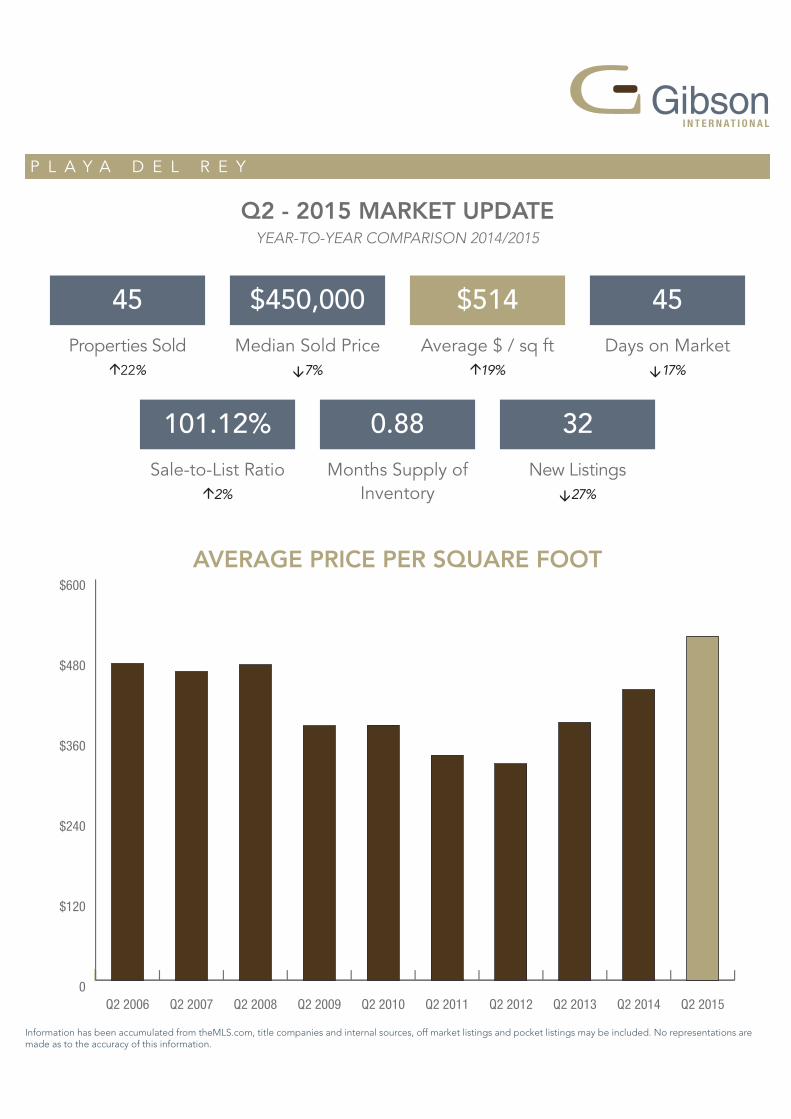
P L A Y A D E L R E Y
45
101.12%
á2%
$450,000
0.88
$514
32
â27%
45
â17%á22% â7% á19%
0
$120
$240
$360
$480
$600
Q2 2015Q2 2014Q2 2013Q2 2012Q2 2011Q2 2010Q2 2009Q2 2008Q2 2007Q2 2006
Sale-to-List Ratio Months Supply of Inventory
New Listings
Information has been accumulated from theMLS.com, title companies and internal sources, off market listings and pocket listings may be included. No representations are made as to the accuracy of this information.
Days on Market Properties Sold Median Sold Price Average $ / sq ft
AVERAGE PRICE PER SQUARE FOOT
Q2 - 2015 MARKET UPDATEYEAR-TO-YEAR COMPARISON 2014/2015
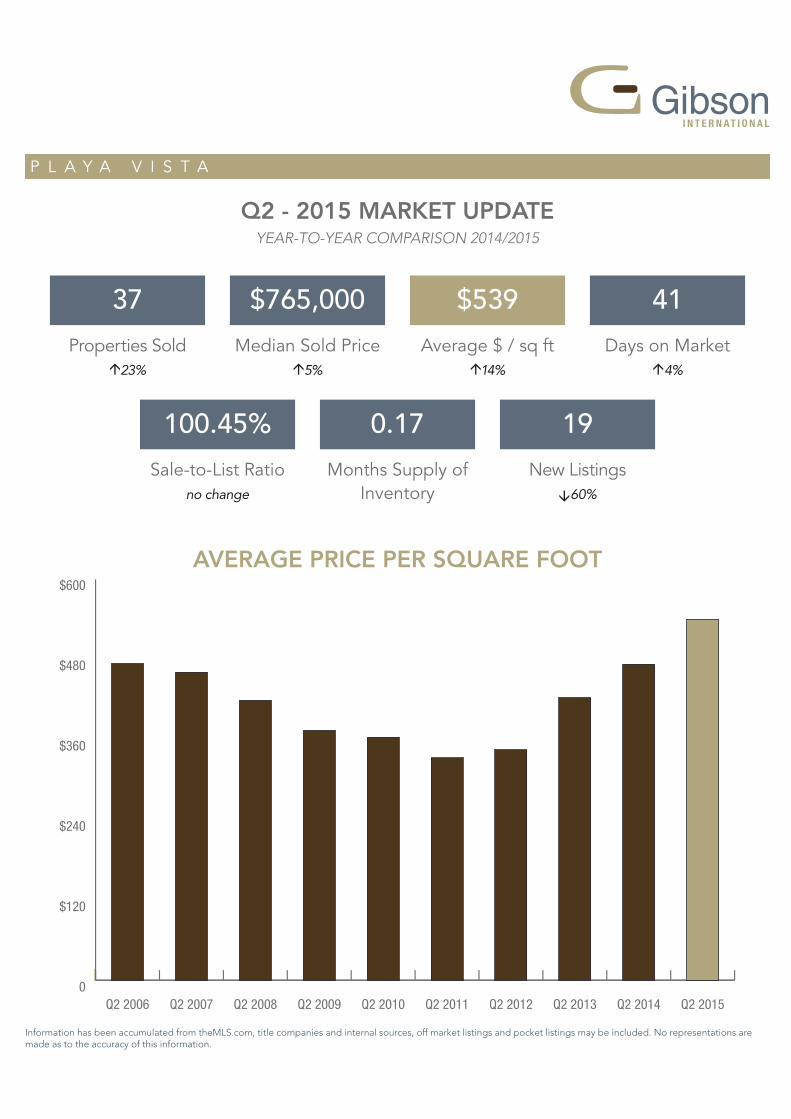
P L A Y A V I S T A
37
100.45%
no change
$765,000
0.17
$539
19
â60%
41
á4%á23% á5% á14%
0
$120
$240
$360
$480
$600
Q2 2015Q2 2014Q2 2013Q2 2012Q2 2011Q2 2010Q2 2009Q2 2008Q2 2007Q2 2006

Sale-to-List Ratio Months Supply of Inventory
New Listings
Information has been accumulated from theMLS.com, title companies and internal sources, off market listings and pocket listings may be included. No representations are made as to the accuracy of this information.
Days on Market Properties Sold Median Sold Price Average $ / sq ft
AVERAGE PRICE PER SQUARE FOOT
Q2 - 2015 MARKET UPDATEYEAR-TO-YEAR COMPARISON 2014/2015
S A N T A M O N I C A
0
$200
$400
$600
$800
$1,000
Q2 2015Q2 2014Q2 2013Q2 2012Q2 2011Q2 2010Q2 2009Q2 2008Q2 2007Q2 2006
146
101.13%
no change
$1,067,500
1.53
$854
110
â19%
55
á15%á6% á17% á6%

Sale-to-List Ratio Months Supply of Inventory
New Listings
Information has been accumulated from theMLS.com, title companies and internal sources, off market listings and pocket listings may be included. No representations are made as to the accuracy of this information.
Days on Market Properties Sold Median Sold Price Average $ / sq ft
AVERAGE PRICE PER SQUARE FOOT
Q2 - 2015 MARKET UPDATEYEAR-TO-YEAR COMPARISON 2014/2015
W E S T W O O D - C E N T U R Y C I T Y
0
$120
$240
$360
$480
$600
Q2 2015Q2 2014Q2 2013Q2 2012Q2 2011Q2 2010Q2 2009Q2 2008Q2 2007Q2 2006
178
95.98%
â1%
$767,500
3.24
$586
184
á26%
70
â9%á25% á3% no change
Sale-to-List Ratio Months Supply of Inventory
New Listings
Information has been accumulated from theMLS.com, title companies and internal sources, off market listings and pocket listings may be included. No representations are made as to the accuracy of this information.
Days on Market Properties Sold Median Sold Price Average $ / sq ft
AVERAGE PRICE PER SQUARE FOOT
Q2 - 2015 MARKET UPDATEYEAR-TO-YEAR COMPARISON 2014/2015
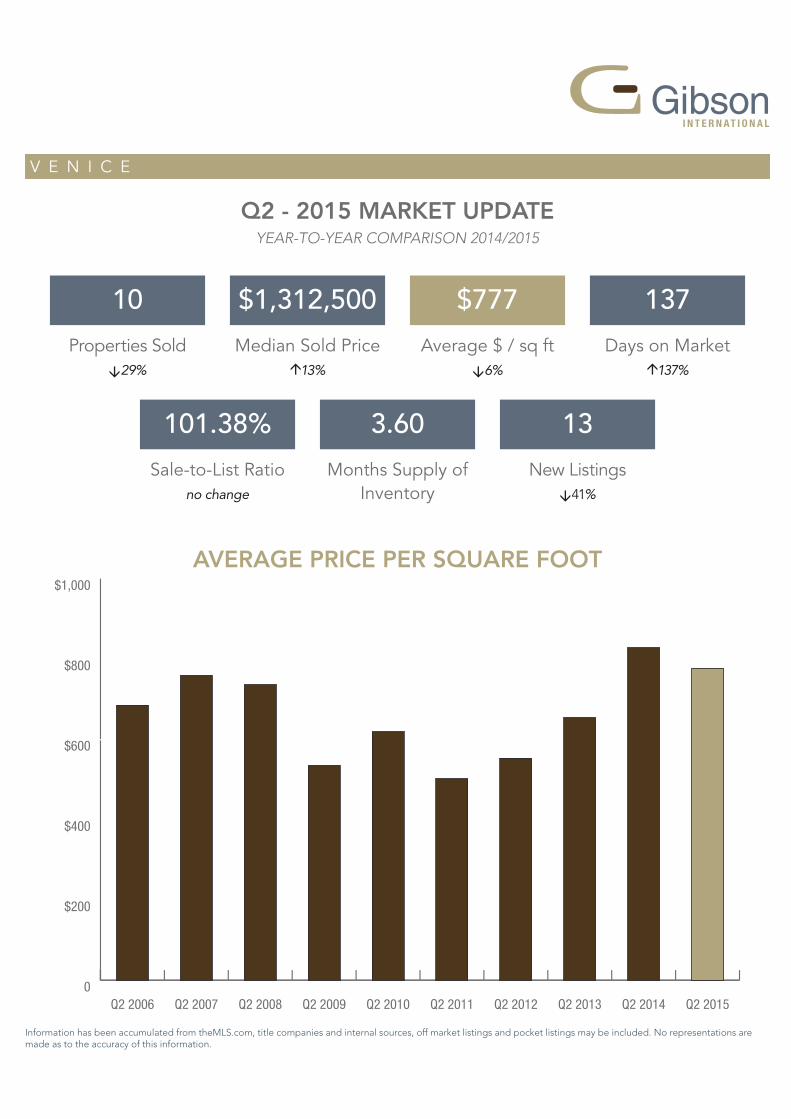
V E N I C E
0
$200
$400
$600
$800
$1,000
Q2 2015Q2 2014Q2 2013Q2 2012Q2 2011Q2 2010Q2 2009Q2 2008Q2 2007Q2 2006
10
101.38%
no change
$1,312,500
3.60
$777
13
â41%
137
á137%â29% á13% â6%
Sale-to-List Ratio Months Supply of Inventory
New Listings
Information has been accumulated from theMLS.com, title companies and internal sources, off market listings and pocket listings may be included. No representations are made as to the accuracy of this information.
Days on Market Properties Sold Median Sold Price Average $ / sq ft
AVERAGE PRICE PER SQUARE FOOT
Q2 - 2015 MARKET UPDATEYEAR-TO-YEAR COMPARISON 2014/2015
W E S T L A
0
$120
$240
$360
$480
$600
Q2 2015Q2 2014Q2 2013Q2 2012Q2 2011Q2 2010Q2 2009Q2 2008Q2 2007Q2 2006
63
101.53%
á1%
$695,000
0.56
$503
43
â19%
43
â13%á29% á7% á6%
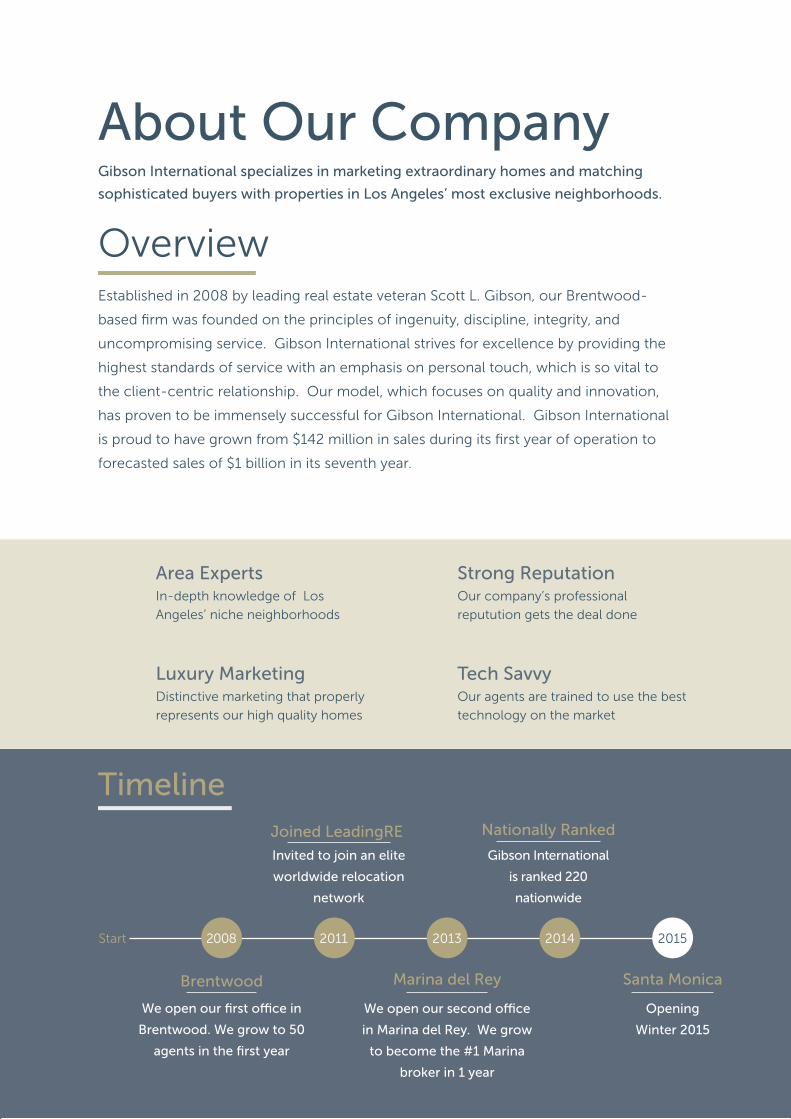
Established in 2008 by leading real estate veteran Scott L. Gibson, our Brentwood-
based fi rm was founded on the principles of ingenuity, discipline, integrity, and
uncompromising service. Gibson International strives for excellence by providing the
highest standards of service with an emphasis on personal touch, which is so vital to
the client-centric relationship. Our model, which focuses on quality and innovation,
has proven to be immensely successful for Gibson International. Gibson International
is proud to have grown from $142 million in sales during its fi rst year of operation to
forecasted sales of $1 billion in its seventh year.
Area ExpertsIn-depth knowledge of Los
Angeles’ niche neighborhoods
Strong ReputationOur company’s professional
reputution gets the deal done
Luxury Marketing
Brentwood Marina del Rey
Joined LeadingRE Nationally Ranked
Distinctive marketing that properly
represents our high quality homes
We open our fi rst offi ce in
Brentwood. We grow to 50
agents in the fi rst year
We open our second offi ce
in Marina del Rey. We grow
to become the #1 Marina
broker in 1 year
Invited to join an elite
worldwide relocation
network
Gibson International
is ranked 220
nationwide
Tech SavvyOur agents are trained to use the best
technology on the market
About Our Company
Timeline
Overview
Gibson International specializes in marketing extraordinary homes and matching
sophisticated buyers with properties in Los Angeles’ most exclusive neighborhoods.
Start
Santa Monica
Opening
Winter 2015
2011 2015201420132008
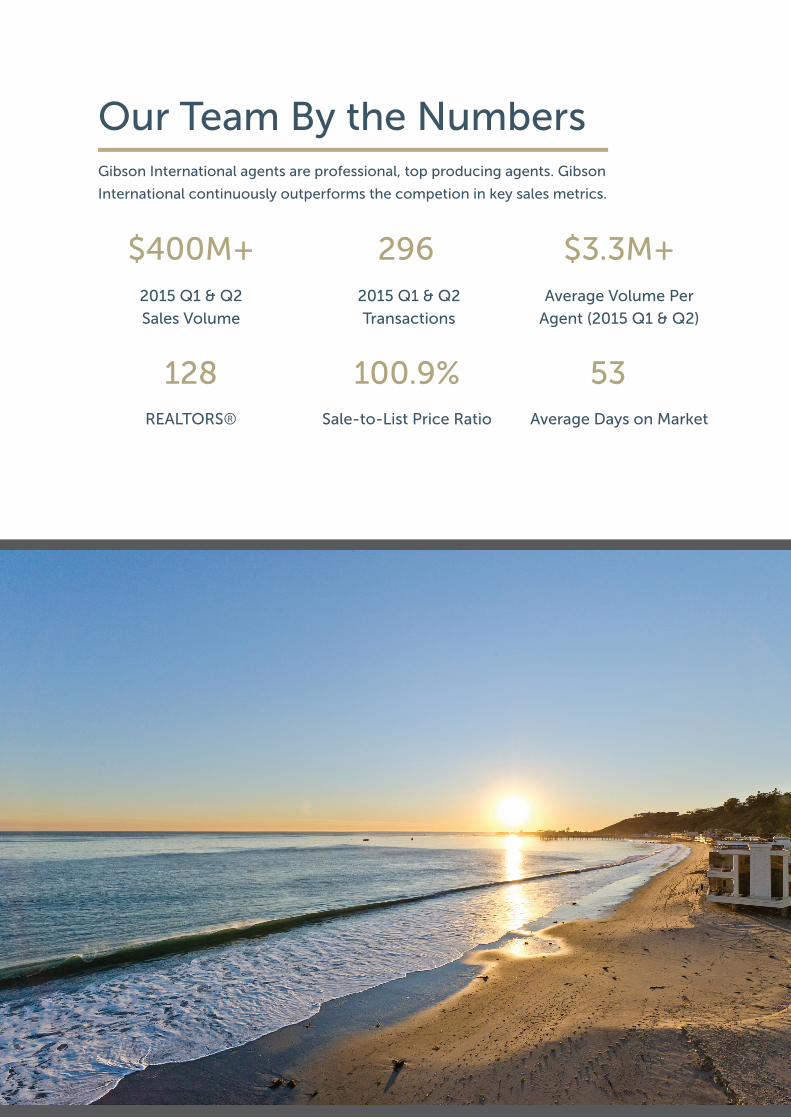
Gibson International agents are professional, top producing agents. Gibson
International continuously outperforms the competion in key sales metrics.
2015 Q1 & Q2
Sales Volume
Our Team By the Numbers
$400M+
REALTORS®
128
2015 Q1 & Q2
Transactions
296
Sale-to-List Price Ratio
100.9%
Average Volume Per
Agent (2015 Q1 & Q2)
$3.3M+
Average Days on Market
53

Brentwood
11538 San Vicente Blvd
Los Angeles, CA 90049
310.820.0195
Marina del Rey
330 Washington Blvd, #D
Marina del Rey, CA 90292
310.301.1003
Pacifc Palisades
15207 Sunset Blvd, #A
Pacific Palisades, CA 90272
310.454.4159
Santa Monica - Coming Soon!
1010 Montana Avenue
Santa Monica, CA 90403
Related Documents


