2020 Second Quarter Business Review (Unaudited) July 28, 2020

Welcome message from author
This document is posted to help you gain knowledge. Please leave a comment to let me know what you think about it! Share it to your friends and learn new things together.
Transcript

2020 Second Quarter Business Review(Unaudited)
July 28, 2020

22020 Q1 Earnings – April 28, 2020. All rights reserved.
Events
2020 Earnings Calls
Q3 October 27
32020 Q2 Earnings – July 28, 2020. All rights reserved.
Forward looking statementThis presentation contains forward-looking information about 3M's financial results and estimates and business prospects that involve substantial risks and uncertainties. You can identify these statements by the use of words such as "anticipate," "estimate," "expect," "aim," "project," "intend," "plan," "believe," "will," "should," "could," "target," "forecast" and other words and terms of similar meaning in connection with any discussion of future operating or financial performance or business plans or prospects. Among the factors that could cause actual results to differ materially are the following: (1) worldwide economic, political, regulatory, capital markets and other external conditions and other factors beyond the Company's control, including natural and other disasters or climate change affecting the operations of the Company or its customers and suppliers; (2) risks related to public health crises such as the global pandemic associated with the coronavirus (COVID-19); (3) liabilities related to certain fluorochemicals, including lawsuits concerning various PFAS-related products and chemistries, and claims and governmental regulatory proceedings and inquiries related to PFAS in a variety of jurisdictions; (4) legal proceedings, including significant developments that could occur in the legal and regulatory proceedings described in the Company's Annual Report on Form 10-K for the year ended Dec. 31, 2019, and any subsequent quarterly reports on Form 10-Q (the “Reports”); (5) competitive conditions and customer preferences; (6) foreign currency exchange rates and fluctuations in those rates; (7) the timing and market acceptance of new product offerings; (8) the availability and cost of purchased components, compounds, raw materials and energy (including oil and natural gas and their derivatives) due to shortages, increased demand or supply interruptions (including those caused by natural and other disasters and other events); (9) unanticipated problems or delays with the phased implementation of a global enterprise resource planning (ERP) system, or security breaches and other disruptions to the Company's information technology infrastructure; (10) the impact of acquisitions, strategic alliances, divestitures, and other unusual events resulting from portfolio management actions and other evolving business strategies, and possible organizational restructuring; (11) operational execution, including scenarios where the Company generates fewer productivity improvements than estimated; (12) financial market risks that may affect the Company’s funding obligations under defined benefit pension and postretirement plans; and (13) the Company's credit ratings and its cost of capital. Changes in such assumptions or factors could produce significantly different results. A further description of these factors is located in the Reports under "Cautionary Note Concerning Factors That May Affect Future Results" and "Risk Factors" in Part I, Items 1 and 1A (Annual Report) and in Part I, Item 2 and Part II, Item 1A (Quarterly Reports), as updated by applicable Current Reports on Form 8-K. The information contained in this presentation is as of the date indicated. The Company assumes no obligation to update any forward-looking statements contained in this presentation as a result of new information or future events or developments.
This presentation refers to certain non-GAAP financial measures. Refer to 3M’s July 28, 2020 press release for descriptions of non-GAAP financial measures such as adjusted free cash flow, adjusted free cash flow conversion, adjusted EBITDA, and various measures that adjust for the impacts of special items. These non-GAAP measures are not in accordance with, nor are they a substitute for, GAAP measures. Reconciliations of these non-GAAP financial measures to the most directly comparable GAAP financial measures can be found in that press release.
Note on non-GAAP financial measures
42020 Q2 Earnings – July 28, 2020. All rights reserved.
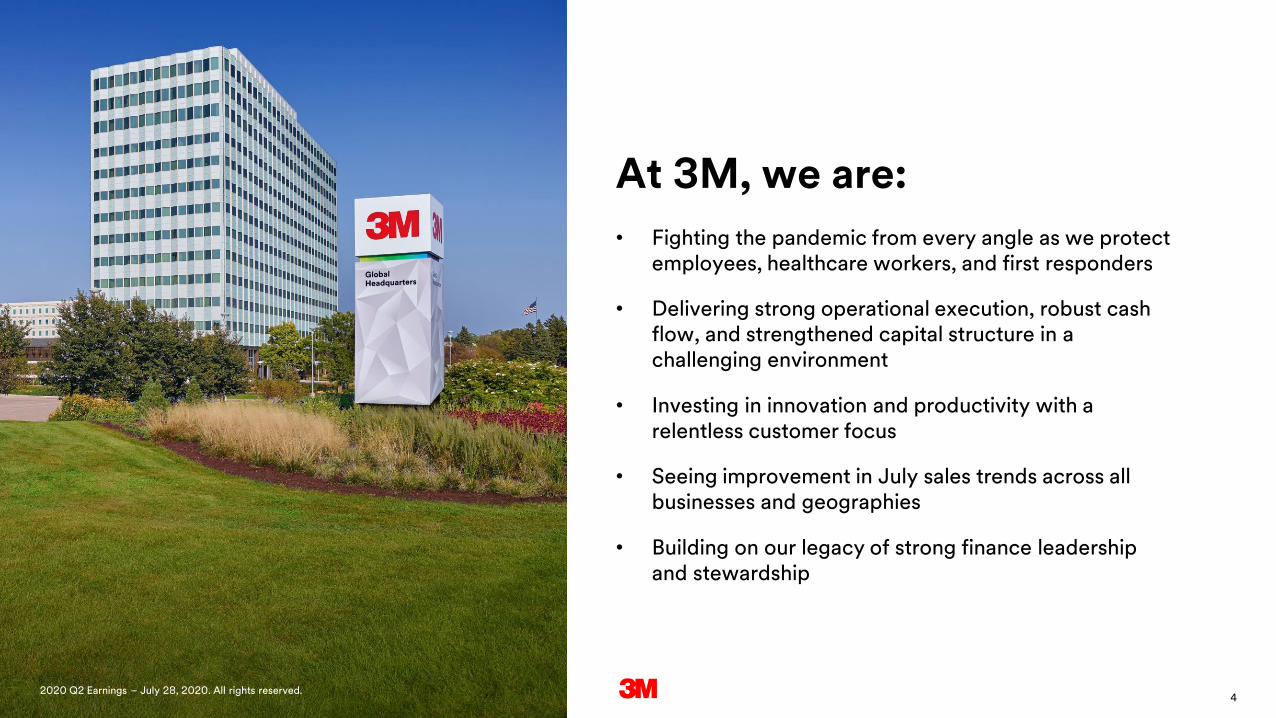
At 3M, we are:
• Fighting the pandemic from every angle as we protect employees, healthcare workers, and first responders
• Delivering strong operational execution, robust cash flow, and strengthened capital structure in a challenging environment
• Investing in innovation and productivity with a relentless customer focus
• Seeing improvement in July sales trends across all businesses and geographies
• Building on our legacy of strong finance leadership and stewardship
2020 Q2 Earnings – July 28, 2020. All rights reserved.
52020 Q2 Earnings – July 28, 2020. All rights reserved.
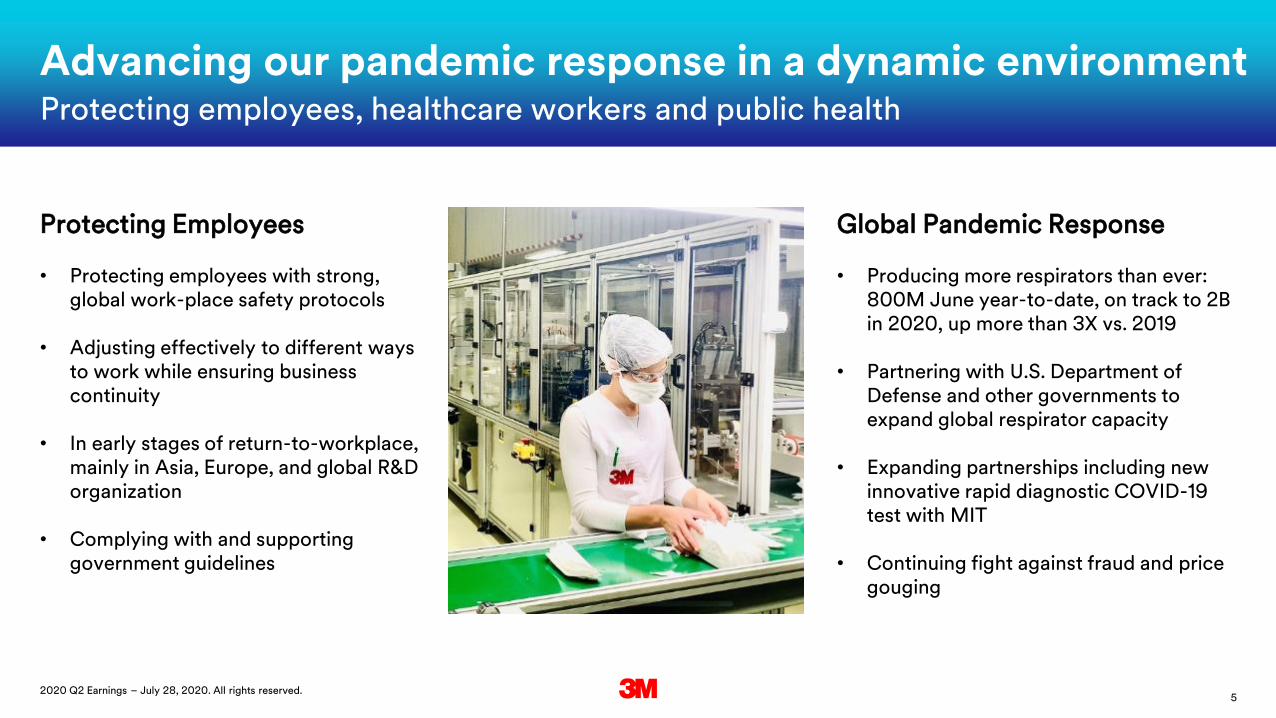
Protecting Employees
• Protecting employees with strong, global work-place safety protocols
• Adjusting effectively to different ways to work while ensuring business continuity
• In early stages of return-to-workplace, mainly in Asia, Europe, and global R&D organization
• Complying with and supporting government guidelines
Global Pandemic Response
• Producing more respirators than ever: 800M June year-to-date, on track to 2B in 2020, up more than 3X vs. 2019
• Partnering with U.S. Department of Defense and other governments to expand global respirator capacity
• Expanding partnerships including new innovative rapid diagnostic COVID-19 test with MIT
• Continuing fight against fraud and price gouging
Advancing our pandemic response in a dynamic environmentProtecting employees, healthcare workers and public health
62020 Q2 Earnings – July 28, 2020. All rights reserved.
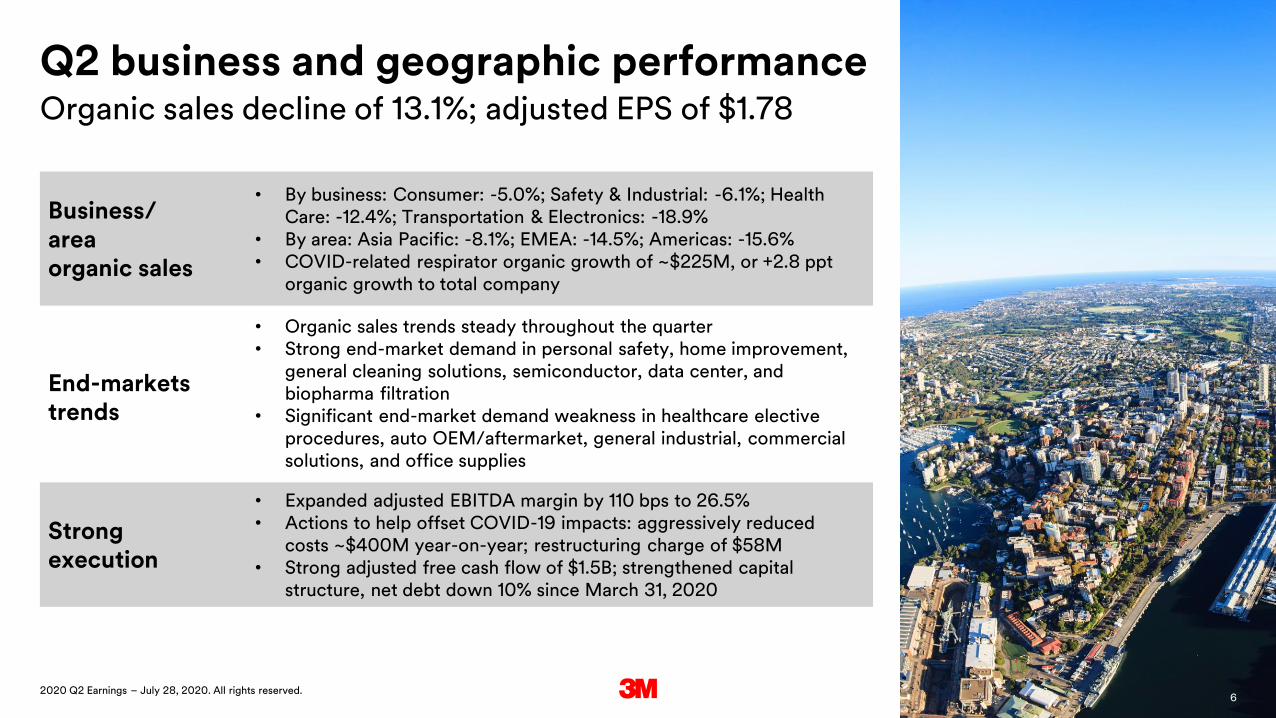
Q2 business and geographic performanceOrganic sales decline of 13.1%; adjusted EPS of $1.78
Business/ areaorganic sales
• By business: Consumer: -5.0%; Safety & Industrial: -6.1%; Health Care: -12.4%; Transportation & Electronics: -18.9%
• By area: Asia Pacific: -8.1%; EMEA: -14.5%; Americas: -15.6%• COVID-related respirator organic growth of ~$225M, or +2.8 ppt
organic growth to total company
End-marketstrends
• Organic sales trends steady throughout the quarter• Strong end-market demand in personal safety, home improvement,
general cleaning solutions, semiconductor, data center, and biopharma filtration
• Significant end-market demand weakness in healthcare elective procedures, auto OEM/aftermarket, general industrial, commercial solutions, and office supplies
Strong execution
• Expanded adjusted EBITDA margin by 110 bps to 26.5% • Actions to help offset COVID-19 impacts: aggressively reduced
costs ~$400M year-on-year; restructuring charge of $58M• Strong adjusted free cash flow of $1.5B; strengthened capital
structure, net debt down 10% since March 31, 2020
6
2020 Q2 Earnings – July 28, 2020. All rights reserved. 7
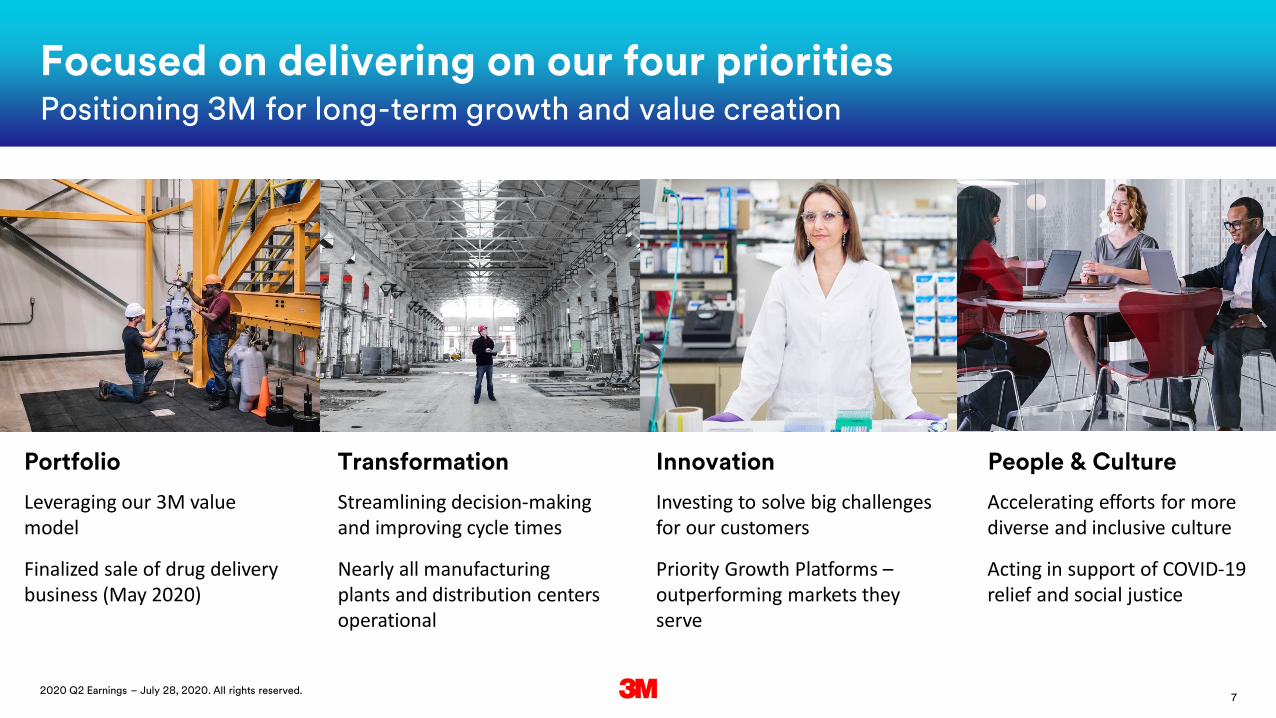
Focused on delivering on our four prioritiesPositioning 3M for long-term growth and value creation
People & CultureInnovation
Investing to solve big challenges for our customers
Priority Growth Platforms –outperforming markets they serve
Transformation
Streamlining decision-making and improving cycle times
Nearly all manufacturing plants and distribution centers operational
Portfolio
Leveraging our 3M value model
Finalized sale of drug delivery business (May 2020)
Accelerating efforts for more diverse and inclusive culture
Acting in support of COVID-19 relief and social justice

2020 Q2 Earnings – July 28, 2020. All rights reserved. 8
Nick GangestadSenior Vice President and
Chief Financial Officer(Retiring August 1, 2020)
Monish PatolawalaSenior Vice President and
Chief Financial Officer(Effective July 1, 2020)
Continuing legacy of strong finance leadershipBuilding on our legacy of strong finance leadership
92020 Q2 Earnings – July 28, 2020. All rights reserved.
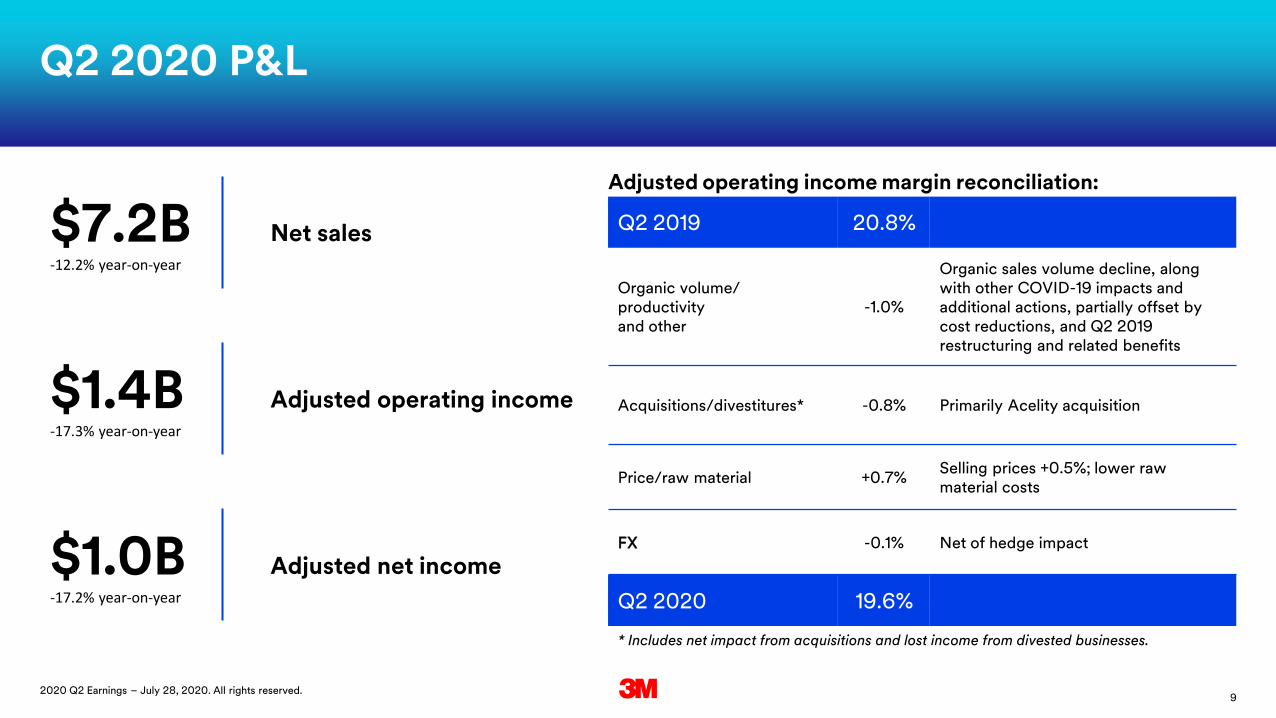
Q2 2020 P&L
$7.2B -12.2% year-on-year
Net sales
$1.4B-17.3% year-on-year
Adjusted operating income
$1.0B-17.2% year-on-year
Adjusted net income
Q2 2019 20.8%
Organic volume/ productivity and other
-1.0%
Organic sales volume decline, along with other COVID-19 impacts and additional actions, partially offset by cost reductions, and Q2 2019 restructuring and related benefits
Acquisitions/divestitures* -0.8% Primarily Acelity acquisition
Price/raw material +0.7%Selling prices +0.5%; lower raw material costs
FX -0.1% Net of hedge impact
Q2 2020 19.6%
Adjusted operating income margin reconciliation:
* Includes net impact from acquisitions and lost income from divested businesses.
102020 Q2 Earnings – July 28, 2020. All rights reserved.
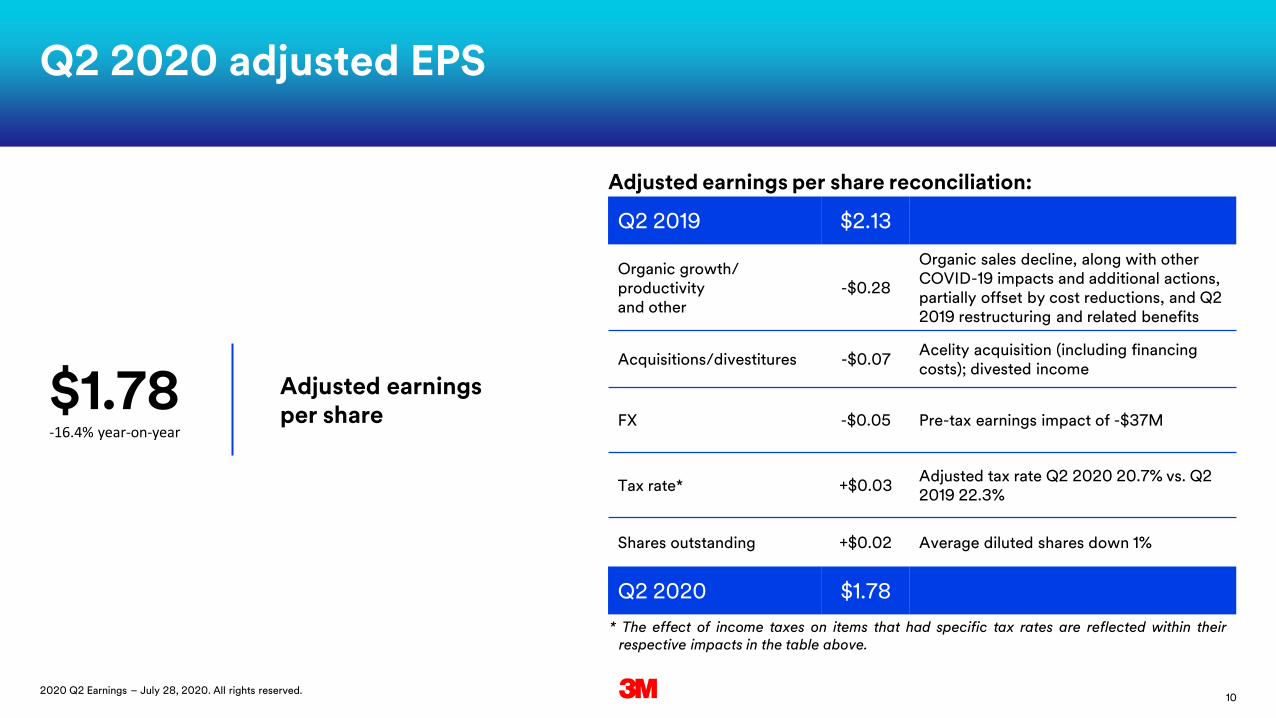
Q2 2019 $2.13
Organic growth/ productivity and other
-$0.28
Organic sales decline, along with other COVID-19 impacts and additional actions, partially offset by cost reductions, and Q2 2019 restructuring and related benefits
Acquisitions/divestitures -$0.07Acelity acquisition (including financing costs); divested income
FX -$0.05 Pre-tax earnings impact of -$37M
Tax rate* +$0.03Adjusted tax rate Q2 2020 20.7% vs. Q2 2019 22.3%
Shares outstanding +$0.02 Average diluted shares down 1%
Q2 2020 $1.78
Q2 2020 adjusted EPS
+9.0%$1.78-16.4% year-on-year
Adjusted earnings per share
* The effect of income taxes on items that had specific tax rates are reflected within theirrespective impacts in the table above.
Adjusted earnings per share reconciliation:
112020 Q2 Earnings – July 28, 2020. All rights reserved.
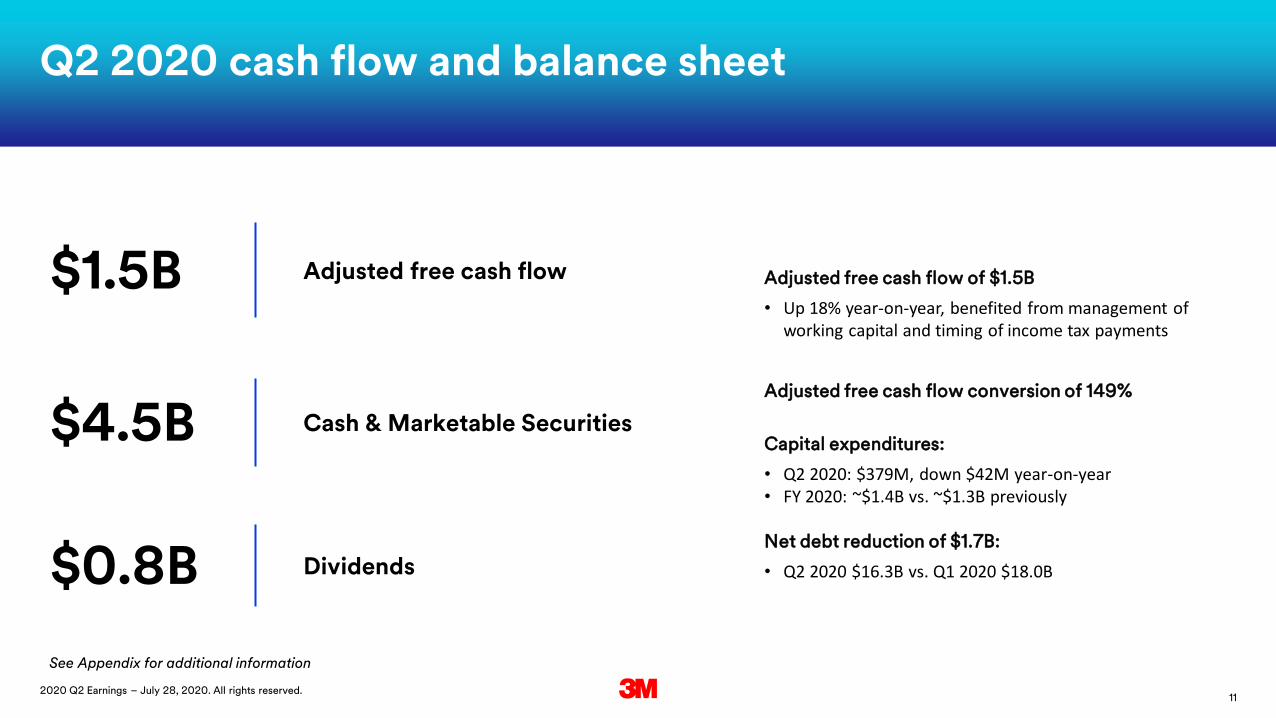
Q2 2020 cash flow and balance sheet
Adjusted free cash flow of $1.5B
• Up 18% year-on-year, benefited from management of working capital and timing of income tax payments
Adjusted free cash flow conversion of 149%
Capital expenditures:
• Q2 2020: $379M, down $42M year-on-year• FY 2020: ~$1.4B vs. ~$1.3B previously
Net debt reduction of $1.7B:
• Q2 2020 $16.3B vs. Q1 2020 $18.0B
See Appendix for additional information
$1.5B Adjusted free cash flow
$4.5B Cash & Marketable Securities
$0.8B Dividends
122020 Q2 Earnings – July 28, 2020. All rights reserved.
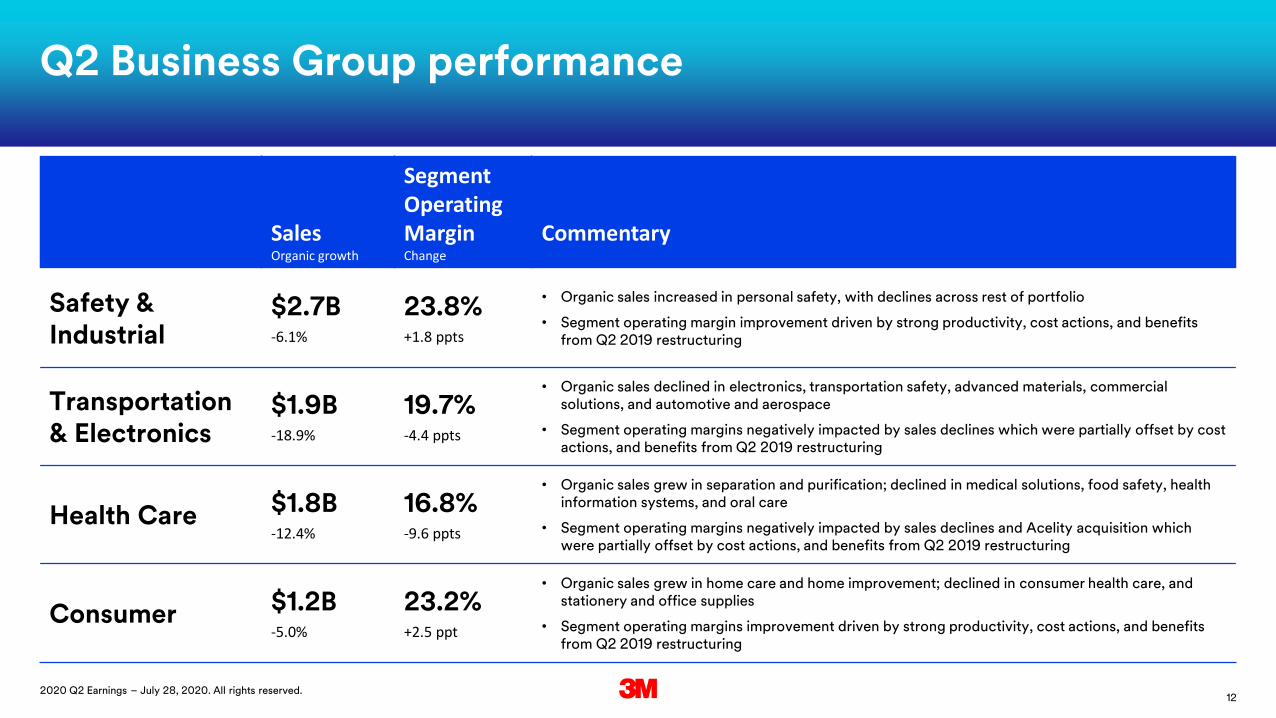
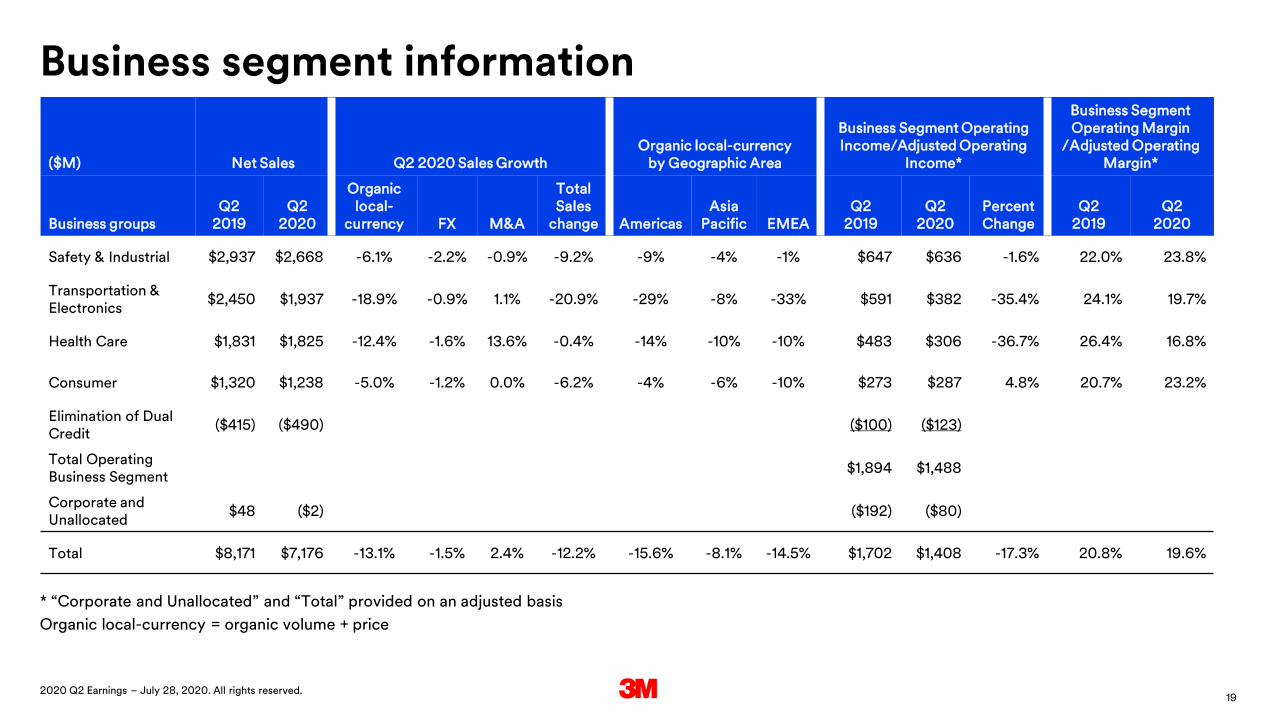
Q2 Business Group performance
SalesOrganic growth
Segment Operating MarginChange
CommentaryChange
Safety & Industrial
$2.7B-6.1%
23.8%+1.8 ppts
• Organic sales increased in personal safety, with declines across rest of portfolio
• Segment operating margin improvement driven by strong productivity, cost actions, and benefits from Q2 2019 restructuring
Transportation & Electronics
$1.9B-18.9%
19.7%-4.4 ppts
• Organic sales declined in electronics, transportation safety, advanced materials, commercial solutions, and automotive and aerospace
• Segment operating margins negatively impacted by sales declines which were partially offset by cost actions, and benefits from Q2 2019 restructuring
Health Care $1.8B-12.4%
16.8%-9.6 ppts
• Organic sales grew in separation and purification; declined in medical solutions, food safety, health information systems, and oral care
• Segment operating margins negatively impacted by sales declines and Acelity acquisition which were partially offset by cost actions, and benefits from Q2 2019 restructuring
Consumer $1.2B-5.0%
23.2%+2.5 ppt
• Organic sales grew in home care and home improvement; declined in consumer health care, and stationery and office supplies
• Segment operating margins improvement driven by strong productivity, cost actions, and benefits from Q2 2019 restructuring
132020 Q2 Earnings – July 28, 2020. All rights reserved.
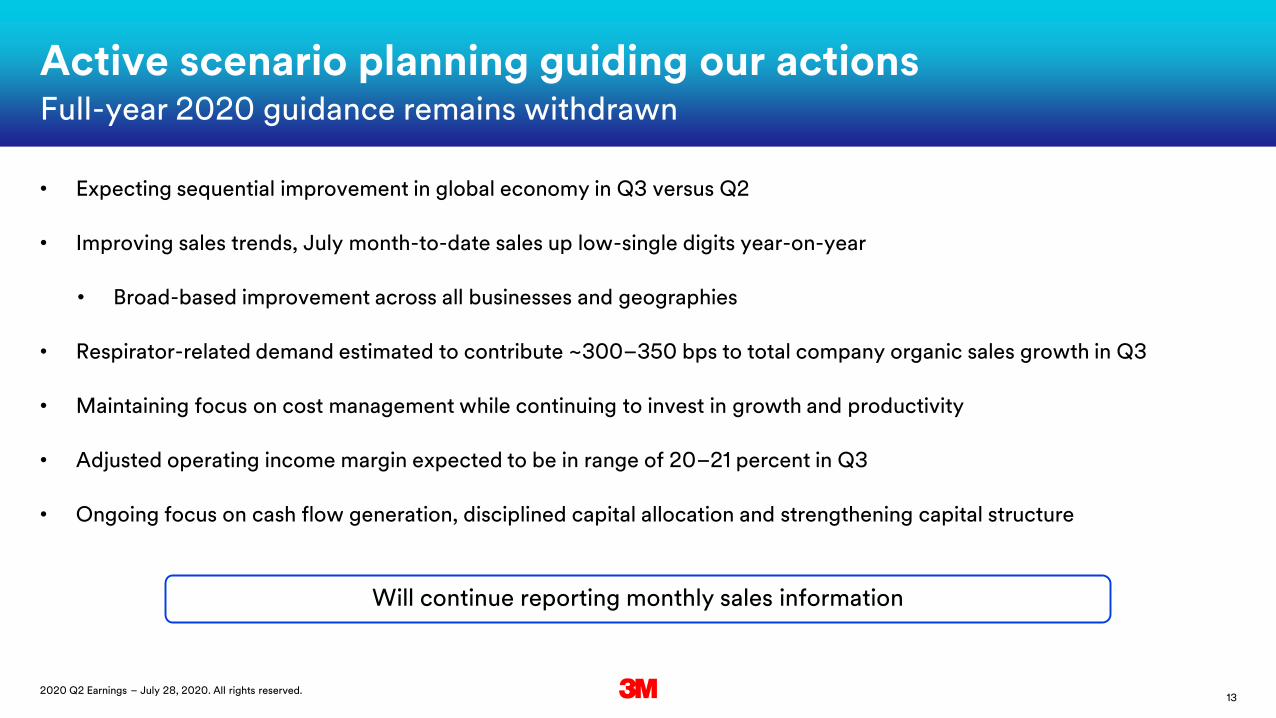
Active scenario planning guiding our actions
• Expecting sequential improvement in global economy in Q3 versus Q2
• Improving sales trends, July month-to-date sales up low-single digits year-on-year
• Broad-based improvement across all businesses and geographies
• Respirator-related demand estimated to contribute ~300–350 bps to total company organic sales growth in Q3
• Maintaining focus on cost management while continuing to invest in growth and productivity
• Adjusted operating income margin expected to be in range of 20–21 percent in Q3
• Ongoing focus on cash flow generation, disciplined capital allocation and strengthening capital structure
Full-year 2020 guidance remains withdrawn
Will continue reporting monthly sales information
142020 Q1 Earnings – April 28, 2020. All rights reserved.
Q&A
Mike Roman
Chairman and Chief Executive Officer
Monish Patolawala
Senior Vice President and Chief Financial Officer
Nick Gangestad
Senior Vice President and Chief Financial Officer(retiring August 1, 2020)
Bruce Jermeland
Vice President, Investor Relations

152020 Q2 Earnings – July 28, 2020. All rights reserved.
Appendix
162020 Q2 Earnings – July 28, 2020. All rights reserved.
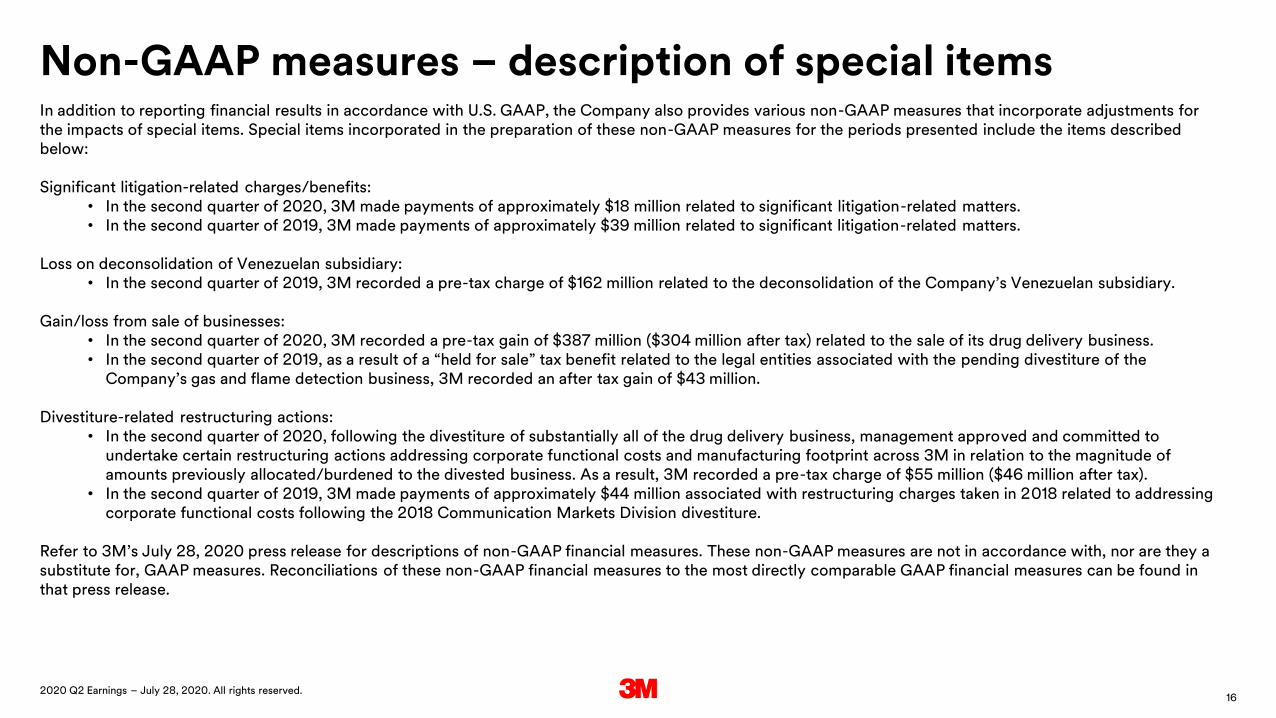
Non-GAAP measures – description of special itemsIn addition to reporting financial results in accordance with U.S. GAAP, the Company also provides various non-GAAP measures that incorporate adjustments for the impacts of special items. Special items incorporated in the preparation of these non-GAAP measures for the periods presented include the items described below:
Significant litigation-related charges/benefits:• In the second quarter of 2020, 3M made payments of approximately $18 million related to significant litigation-related matters.• In the second quarter of 2019, 3M made payments of approximately $39 million related to significant litigation-related matters.
Loss on deconsolidation of Venezuelan subsidiary:• In the second quarter of 2019, 3M recorded a pre-tax charge of $162 million related to the deconsolidation of the Company’s Venezuelan subsidiary.
Gain/loss from sale of businesses:• In the second quarter of 2020, 3M recorded a pre-tax gain of $387 million ($304 million after tax) related to the sale of its drug delivery business.• In the second quarter of 2019, as a result of a “held for sale” tax benefit related to the legal entities associated with the pending divestiture of the
Company’s gas and flame detection business, 3M recorded an after tax gain of $43 million.
Divestiture-related restructuring actions:• In the second quarter of 2020, following the divestiture of substantially all of the drug delivery business, management approved and committed to
undertake certain restructuring actions addressing corporate functional costs and manufacturing footprint across 3M in relation to the magnitude of amounts previously allocated/burdened to the divested business. As a result, 3M recorded a pre-tax charge of $55 million ($46 million after tax).
• In the second quarter of 2019, 3M made payments of approximately $44 million associated with restructuring charges taken in 2018 related to addressing corporate functional costs following the 2018 Communication Markets Division divestiture.
Refer to 3M’s July 28, 2020 press release for descriptions of non-GAAP financial measures. These non-GAAP measures are not in accordance with, nor are they a substitute for, GAAP measures. Reconciliations of these non-GAAP financial measures to the most directly comparable GAAP financial measures can be found in that press release.
172020 Q2 Earnings – July 28, 2020. All rights reserved.
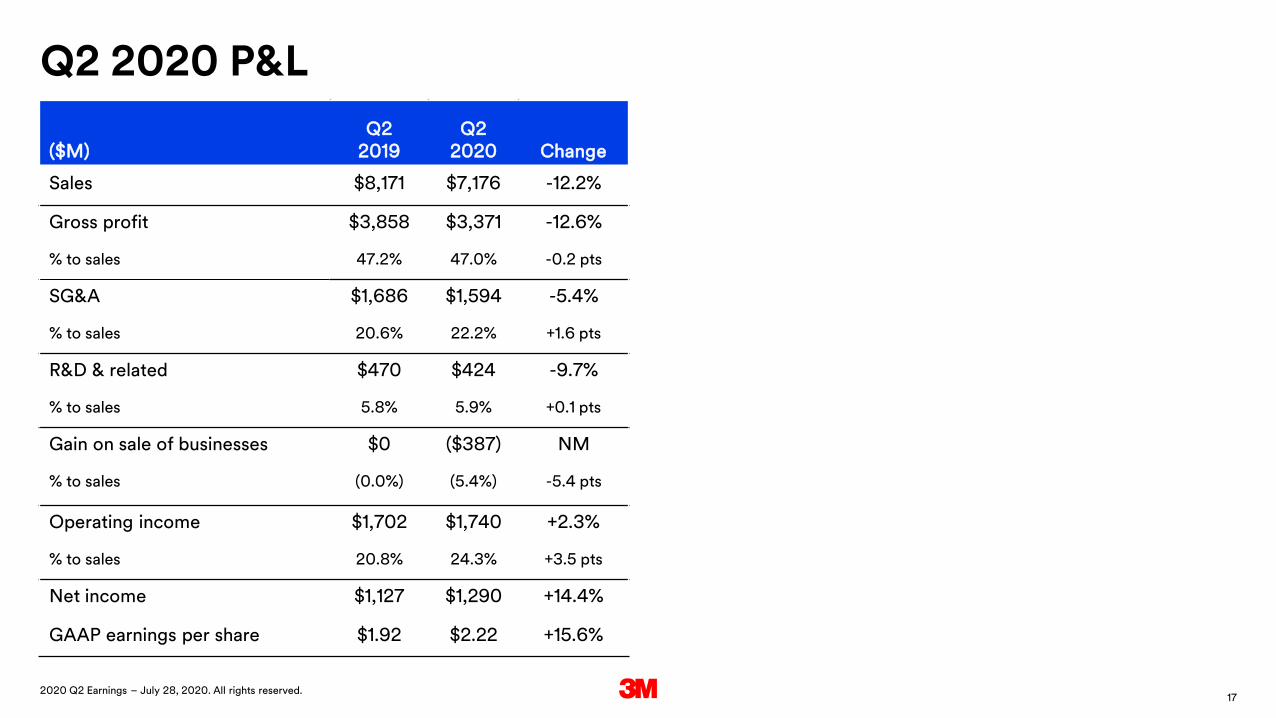
Q2 2020 P&L
($M)Q2
2019Q2
2020 Change
Sales $8,171 $7,176 -12.2%
Gross profit $3,858 $3,371 -12.6%
% to sales 47.2% 47.0% -0.2 pts
SG&A $1,686 $1,594 -5.4%
% to sales 20.6% 22.2% +1.6 pts
R&D & related $470 $424 -9.7%
% to sales 5.8% 5.9% +0.1 pts
Gain on sale of businesses $0 ($387) NM
% to sales (0.0%) (5.4%) -5.4 pts
Operating income $1,702 $1,740 +2.3%
% to sales 20.8% 24.3% +3.5 pts
Net income $1,127 $1,290 +14.4%
GAAP earnings per share $1.92 $2.22 +15.6%
182020 Q2 Earnings – July 28, 2020. All rights reserved.
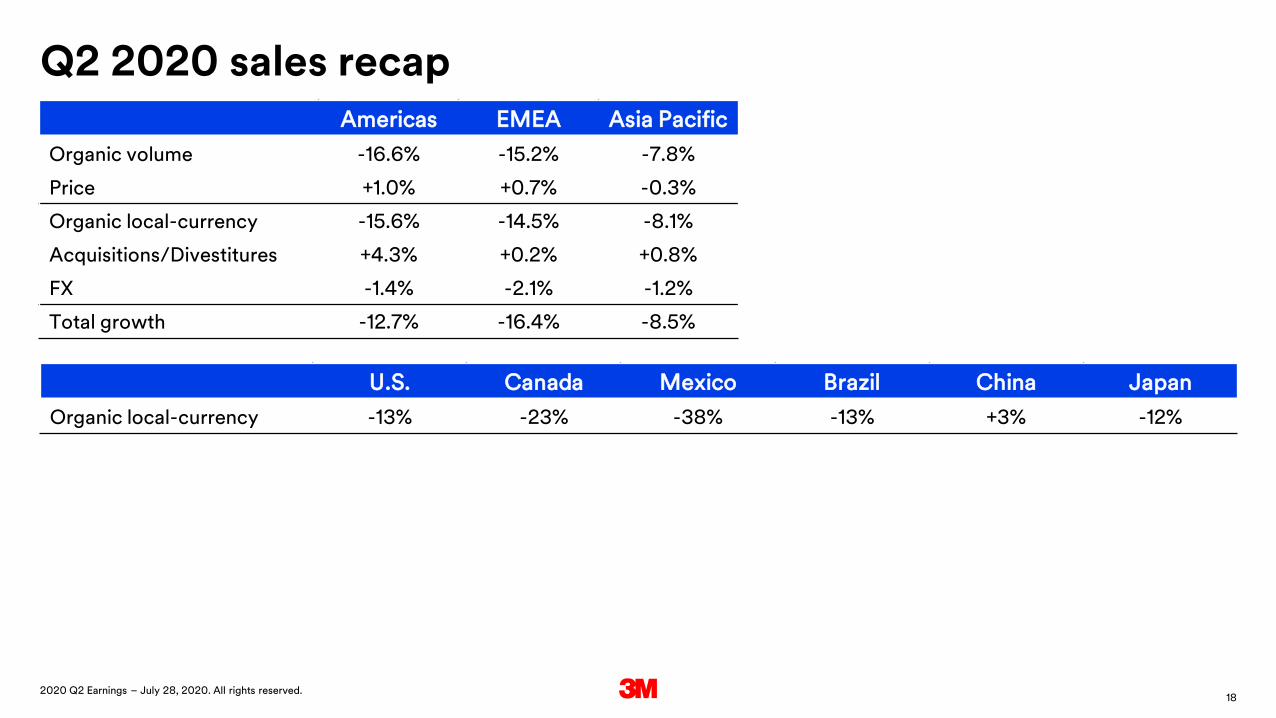
Q2 2020 sales recapAmericas EMEA Asia Pacific
Organic volume -16.6% -15.2% -7.8%
Price +1.0% +0.7% -0.3%
Organic local-currency -15.6% -14.5% -8.1%
Acquisitions/Divestitures +4.3% +0.2% +0.8%
FX -1.4% -2.1% -1.2%
Total growth -12.7% -16.4% -8.5%
U.S. Canada Mexico Brazil China Japan
Organic local-currency -13% -23% -38% -13% +3% -12%
192020 Q2 Earnings – July 28, 2020. All rights reserved.
Business segment information
($M) Net Sales Q2 2020 Sales GrowthOrganic local-currency
by Geographic Area
Business Segment Operating Income/Adjusted Operating
Income*
Business Segment Operating Margin
/Adjusted Operating Margin*
Business groups Q2
2019Q2
2020
Organic local-
currency FX M&A
TotalSales
change AmericasAsia
Pacific EMEAQ2
2019Q2
2020PercentChange
Q22019
Q22020
Safety & Industrial $2,937 $2,668 -6.1% -2.2% -0.9% -9.2% -9% -4% -1% $647 $636 -1.6% 22.0% 23.8%
Transportation & Electronics
$2,450 $1,937 -18.9% -0.9% 1.1% -20.9% -29% -8% -33% $591 $382 -35.4% 24.1% 19.7%
Health Care $1,831 $1,825 -12.4% -1.6% 13.6% -0.4% -14% -10% -10% $483 $306 -36.7% 26.4% 16.8%
Consumer $1,320 $1,238 -5.0% -1.2% 0.0% -6.2% -4% -6% -10% $273 $287 4.8% 20.7% 23.2%
Elimination of Dual Credit
($415) ($490) ($100) ($123)
Total Operating Business Segment
$1,894 $1,488
Corporate and Unallocated
$48 ($2) ($192) ($80)
Total $8,171 $7,176 -13.1% -1.5% 2.4% -12.2% -15.6% -8.1% -14.5% $1,702 $1,408 -17.3% 20.8% 19.6%
Organic local-currency = organic volume + price
* “Corporate and Unallocated” and “Total” provided on an adjusted basis
202020 Q2 Earnings – July 28, 2020. All rights reserved.
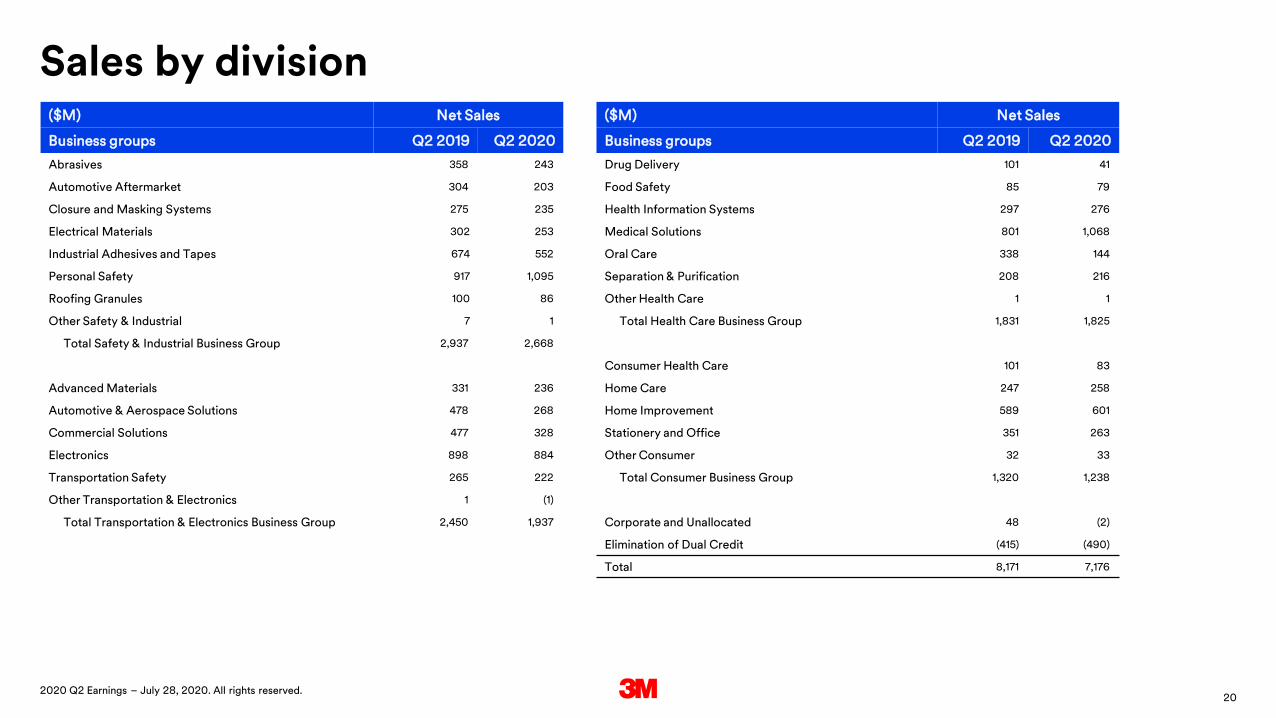
Sales by division($M) Net Sales
Business groups Q2 2019 Q2 2020
Abrasives 358 243
Automotive Aftermarket 304 203
Closure and Masking Systems 275 235
Electrical Materials 302 253
Industrial Adhesives and Tapes 674 552
Personal Safety 917 1,095
Roofing Granules 100 86
Other Safety & Industrial 7 1
Total Safety & Industrial Business Group 2,937 2,668
Advanced Materials 331 236
Automotive & Aerospace Solutions 478 268
Commercial Solutions 477 328
Electronics 898 884
Transportation Safety 265 222
Other Transportation & Electronics 1 (1)
Total Transportation & Electronics Business Group 2,450 1,937
($M) Net Sales
Business groups Q2 2019 Q2 2020
Drug Delivery 101 41
Food Safety 85 79
Health Information Systems 297 276
Medical Solutions 801 1,068
Oral Care 338 144
Separation & Purification 208 216
Other Health Care 1 1
Total Health Care Business Group 1,831 1,825
Consumer Health Care 101 83
Home Care 247 258
Home Improvement 589 601
Stationery and Office 351 263
Other Consumer 32 33
Total Consumer Business Group 1,320 1,238
Corporate and Unallocated 48 (2)
Elimination of Dual Credit (415) (490)
Total 8,171 7,176

Related Documents