RESULTS FOR THE QUARTER ended 31 March 2018 8 MAY 2018 Q1 2018 MARKET UPDATE

Welcome message from author
This document is posted to help you gain knowledge. Please leave a comment to let me know what you think about it! Share it to your friends and learn new things together.
Transcript
RESULTS FOR THE QUARTERended 31 March 2018
8 MAY 2018
Q1 2018MARKET UPDATE
DISCLAIMER
Q1 2018 MARKET UPDATE 2
Certain statements contained in this document, other than statements of historical fact, including, without limitation, those concerning the economicoutlook for the gold mining industry, expectations regarding gold prices, production, total cash costs, all-in sustaining costs, all-in costs, cost savings andother operating results, productivity improvements, growth prospects and outlook of AngloGold Ashanti’s operations, individually or in the aggregate,including the achievement of project milestones, commencement and completion of commercial operations of certain of AngloGold Ashanti’s explorationand production projects and the completion of acquisitions, dispositions or joint venture transactions, AngloGold Ashanti’s liquidity and capital resourcesand capital expenditures and the outcome and consequence of any potential or pending litigation or regulatory proceedings or environmental health andsafety issues, are forward-looking statements regarding AngloGold Ashanti’s operations, economic performance and financial condition.
These forward-looking statements or forecasts involve known and unknown risks, uncertainties and other factors that may cause AngloGold Ashanti’sactual results, performance or achievements to differ materially from the anticipated results, performance or achievements expressed or implied in theseforward-looking statements. Although AngloGold Ashanti believes that the expectations reflected in such forward-looking statements and forecasts arereasonable, no assurance can be given that such expectations will prove to have been correct. Accordingly, results could differ materially from those setout in the forward-looking statements as a result of, among other factors, changes in economic, social and political and market conditions, the success ofbusiness and operating initiatives, changes in the regulatory environment and other government actions, including environmental approvals, fluctuationsin gold prices and exchange rates, the outcome of pending or future litigation proceedings, and business and operational risk management.
For a discussion of such risk factors, refer to AngloGold Ashanti’s annual report on Form 20-F, which was filed with the United States Securities andExchange Commission (“SEC”). These factors are not necessarily all of the important factors that could cause AngloGold Ashanti’s actual results to differmaterially from those expressed in any forward-looking statements. Other unknown or unpredictable factors could also have material adverse effects onfuture results. Consequently, readers are cautioned not to place undue reliance on forward-looking statements. AngloGold Ashanti undertakes noobligation to update publicly or release any revisions to these forward-looking statements to reflect events or circumstances after the date hereof or toreflect the occurrence of unanticipated events, except to the extent required by applicable law. All subsequent written or oral forward-looking statementsattributable to AngloGold Ashanti or any person acting on its behalf are qualified by the cautionary statements herein.
The financial information contained in this market update presentation has not been reviewed or reported on by the Company's external auditors.
This communication may contain certain “Non-GAAP” financial measures. AngloGold Ashanti utilises certain Non-GAAP performance measures andratios in managing its business. Non-GAAP financial measures should be viewed in addition to, and not as an alternative for, the reported operatingresults or cash flow from operations or any other measures of performance prepared in accordance with IFRS. In addition, the presentation of thesemeasures may not be comparable to similarly titled measures other companies may use. AngloGold Ashanti posts information that is important toinvestors on the main page of its website at www.anglogoldashanti.com and under the “Investors” tab on the main page. This information is updatedregularly. Investors should visit this website to obtain important information about AngloGold Ashanti.

POSITIONED TO CREATE VALUE THROUGH THE CYCLE
Q1 2018 MARKET UPDATE 3
Focus on sustainable improvements to margins and cash flow
Consistent delivery on targets; improving cost management on key metrics and enhancing margins
Decisive action on operations, and ensuring balance sheet flexibility
Maintaining optionality to deliver value-adding growth
Ongoing portfolio improvements and rationalisation
Working towards zero harm through the elimination of high consequence events
Responding decisively and proactively to create sustainable value through the cycle
Focus on people, safety and sustainability
Supporting our strategy for
sustainable cash flow
improvements and returns
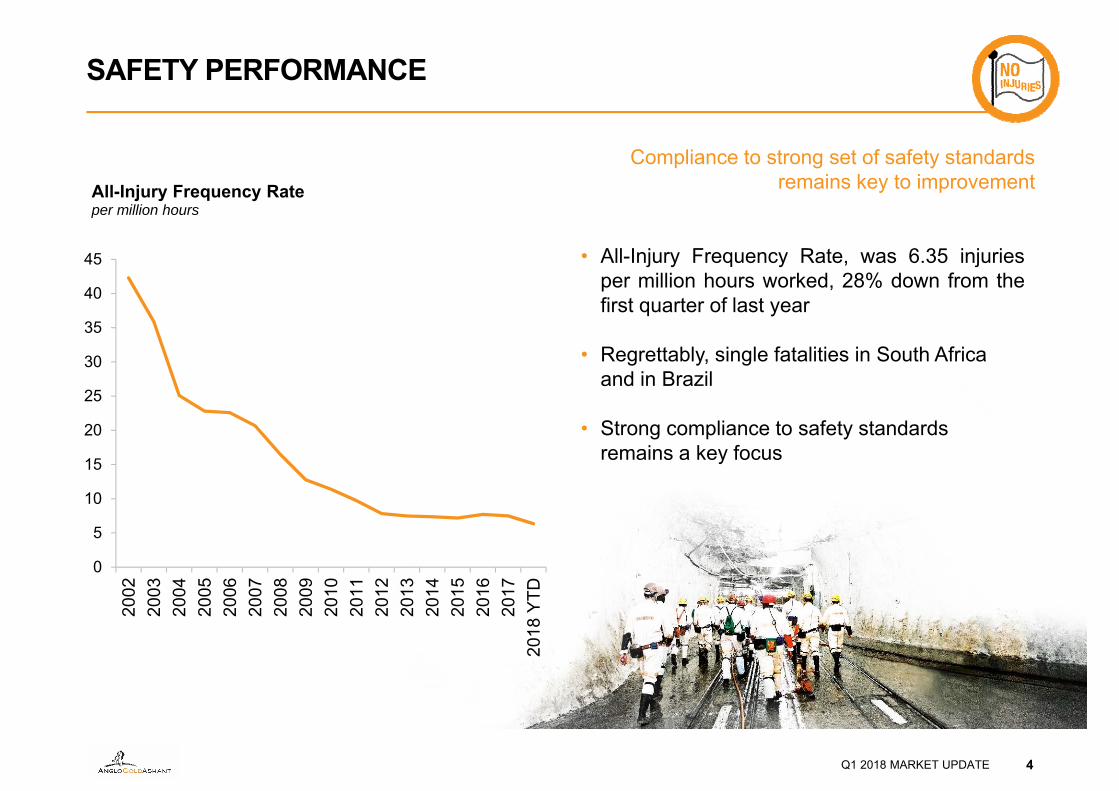
SAFETY PERFORMANCE
4Q1 2018 MARKET UPDATE
Compliance to strong set of safety standards remains key to improvement
• All-Injury Frequency Rate, was 6.35 injuriesper million hours worked, 28% down from thefirst quarter of last year
• Regrettably, single fatalities in South Africa and in Brazil
• Strong compliance to safety standards remains a key focus
2002
2003
2004
2005
2006
2007
2008
2009
2010
2011
2012
2013
2014
2015
2016
2017
2018
YTD
0
5
10
15
20
25
30
35
40
45
All-Injury Frequency Rateper million hours

A BALANCED, GLOBAL PORTFOLIO
Q1 2018 MARKET UPDATE 5
23%of Q1 2018 production
38% of Q1 2018 production
19%of Q1 2018 production
20%of Q1 2018 production
843
954
Q1 2018
Q1 2017
*World Gold Council standard, excludes stockpiles written off“Retained operations” exclude closed and sold operations Note: rounding of numbers
1,046
1,045
Q1 2018
Q1 2017
Q1 2018 MARKET UPDATE 5
963
939
Q1 2018
Q1 2017
1,292
1,327
Q1 2018
Q1 2017
AISC* $/oz AISC* $/oz AISC* $/oz AISC* $/oz
AmericasContinental
Africa South Africa Australia
14%of Q1 2018 production from
retained operations
41%of Q1 2018 production from
retained operations
20%of Q1 2018 production from
retained operations
25%of Q1 2018 production from
retained operations
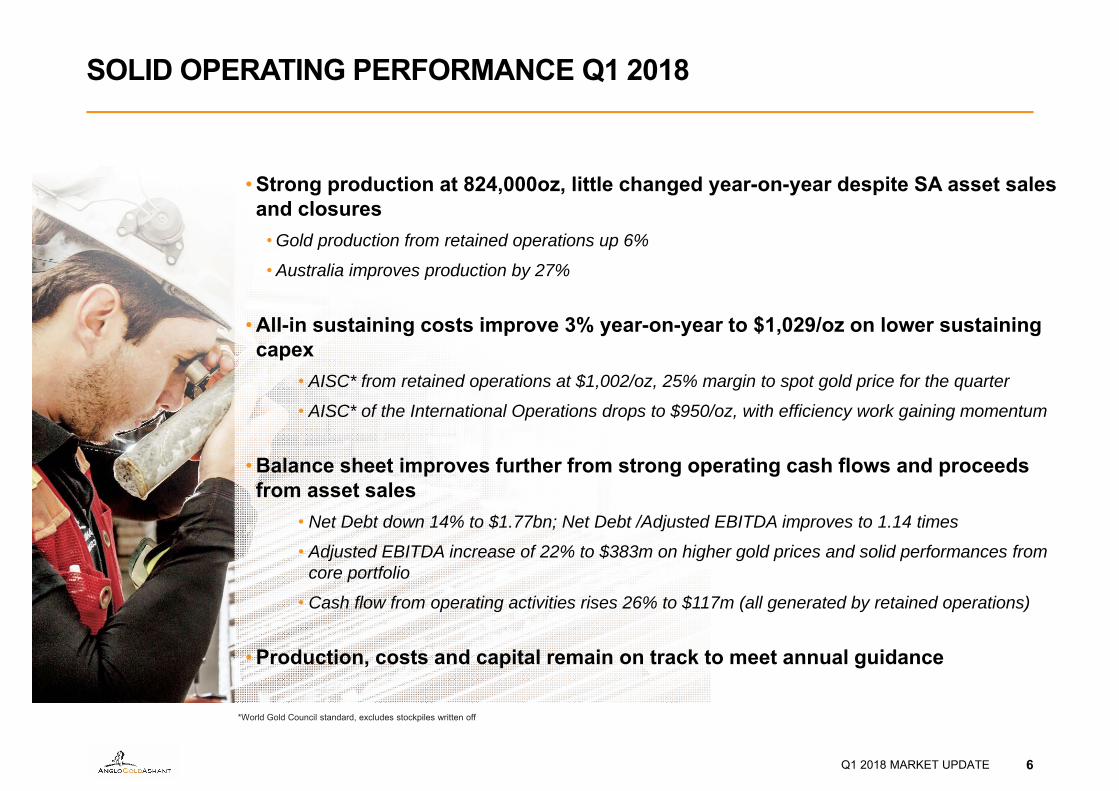
SOLID OPERATING PERFORMANCE Q1 2018
Q1 2018 MARKET UPDATE 6
*World Gold Council standard, excludes stockpiles written off
• Strong production at 824,000oz, little changed year-on-year despite SA asset sales and closures
• Gold production from retained operations up 6%
• Australia improves production by 27%
• All-in sustaining costs improve 3% year-on-year to $1,029/oz on lower sustaining capex
• AISC* from retained operations at $1,002/oz, 25% margin to spot gold price for the quarter
• AISC* of the International Operations drops to $950/oz, with efficiency work gaining momentum
• Balance sheet improves further from strong operating cash flows and proceeds from asset sales
• Net Debt down 14% to $1.77bn; Net Debt /Adjusted EBITDA improves to 1.14 times
• Adjusted EBITDA increase of 22% to $383m on higher gold prices and solid performances from core portfolio
• Cash flow from operating activities rises 26% to $117m (all generated by retained operations)
• Production, costs and capital remain on track to meet annual guidance
Q1 2018 MARKET UPDATE 7
Strong, consistent results
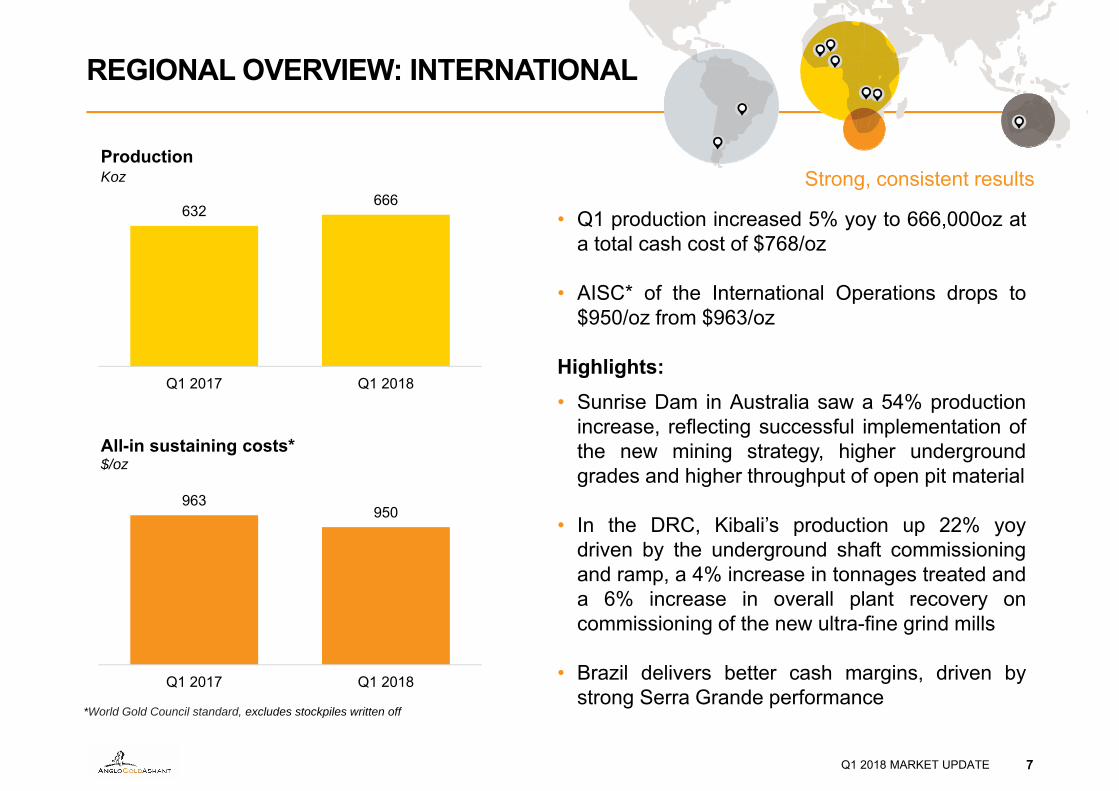
REGIONAL OVERVIEW: INTERNATIONAL
• Q1 production increased 5% yoy to 666,000oz ata total cash cost of $768/oz
• AISC* of the International Operations drops to$950/oz from $963/oz
Highlights:• Sunrise Dam in Australia saw a 54% production
increase, reflecting successful implementation ofthe new mining strategy, higher undergroundgrades and higher throughput of open pit material
• In the DRC, Kibali’s production up 22% yoydriven by the underground shaft commissioningand ramp, a 4% increase in tonnages treated anda 6% increase in overall plant recovery oncommissioning of the new ultra-fine grind mills
• Brazil delivers better cash margins, driven bystrong Serra Grande performance
632666
Q1 2017 Q1 2018
ProductionKoz
963950
Q1 2017 Q1 2018
All-in sustaining costs*$/oz
*World Gold Council standard, excludes stockpiles written off
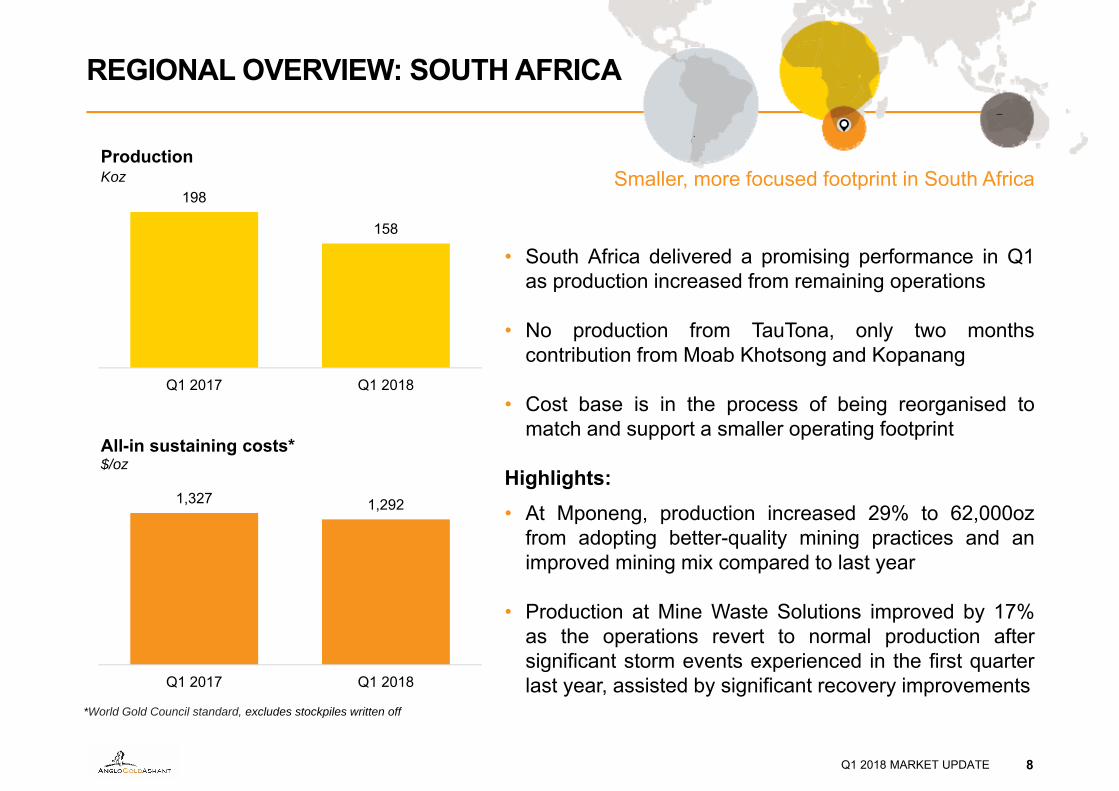
REGIONAL OVERVIEW: SOUTH AFRICA
Q1 2018 MARKET UPDATE 8
Smaller, more focused footprint in South Africa
• South Africa delivered a promising performance in Q1as production increased from remaining operations
• No production from TauTona, only two monthscontribution from Moab Khotsong and Kopanang
• Cost base is in the process of being reorganised tomatch and support a smaller operating footprint
Highlights:• At Mponeng, production increased 29% to 62,000oz
from adopting better-quality mining practices and animproved mining mix compared to last year
• Production at Mine Waste Solutions improved by 17%as the operations revert to normal production aftersignificant storm events experienced in the first quarterlast year, assisted by significant recovery improvements
198
158
Q1 2017 Q1 2018
ProductionKoz
1,327 1,292
Q1 2017 Q1 2018
All-in sustaining costs*$/oz
*World Gold Council standard, excludes stockpiles written off
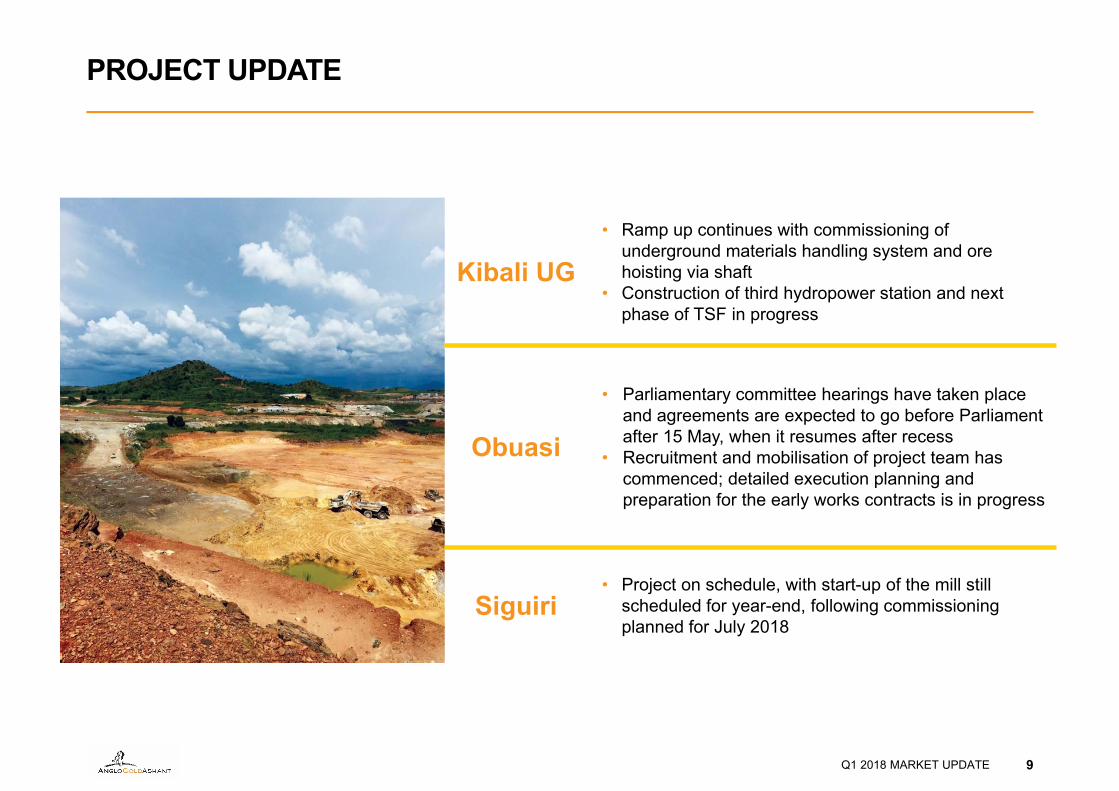
PROJECT UPDATE
9Q1 2018 MARKET UPDATE
Kibali UG• Ramp up continues with commissioning of
underground materials handling system and ore hoisting via shaft
• Construction of third hydropower station and next phase of TSF in progress
Obuasi
• Parliamentary committee hearings have taken place and agreements are expected to go before Parliament after 15 May, when it resumes after recess
• Recruitment and mobilisation of project team has commenced; detailed execution planning and preparation for the early works contracts is in progress
Siguiri• Project on schedule, with start-up of the mill still
scheduled for year-end, following commissioning planned for July 2018

1,034 1,005
920 928 937860 860
962
1,071 1,047 1,060 1,082 1,0711,006 1,029
Q3 2014 Q4 2014 Q1 2015 Q2 2015 Q3 2015 Q4 2015 Q1 2016 Q2 2016 Q3 2016 Q4 2016 Q1 2017 Q2 2017 Q3 2017 Q4 2017 Q1 2018
AISC* Margin$/oz
AISC* Average gold price All-in costs*
FOCUS ON MARGINS CONTINUES
Q1 2018 MARKET UPDATE 10
Margins expand to highest level since 2016, with work underway to realise additional efficiencies from across the portfolio
*World Gold Council standard, excludes stockpiles write-off
23%13%27%24%

COST PERFORMANCE
Q1 2018 MARKET UPDATE 11
*AISC - World Gold Council standard, excludes stockpiles written off
500
600
700
800
900
1,000
813 (27) 21 40 847 (19) 18 (7) (5) 834 803
Q1 2017 ClosedOps
Exch-ange
Inflation Total Volume&
Grade
Effic-iency
SA assetsales
Other Q1 2018 Q1 2018from retained
operations
Total cash costs Q1 2018 vs. Q1 2017 $oz
850
950
1,050
1,150
1,060 20 (49) (2) 1,029 1,002
Q1 2017 Totalcashcosts
Totalsustaining
capex
Other Q1 2018 Q1 2018 from retainedoperations
All-in sustaining cost Q1 2018 vs Q1 2017 $/oz

BALANCE SHEET FLEXIBILITY
12
Balance sheet improves further after proceeds from Vaal River Sales applied to reduce SA debt
Undrawn facilities* at 31 March 2018
*Total calculated with ZAR facility at R11.83/$ (excluding DMTNP), AUD facility at 0.7677$ to A$
Last-12-months Net debt to adjusted EBITDA ratio
Net debt and Net debt to Adjusted EBITDA
A$305mAUD RCF
R5.25bnZAR RCFs
US$975mUSD RCFs
US$318mCash
$1.971bn1.811.70
1.94 2.02 1.95
1.54 1.49 1.47 1.441.26 1.24
1.381.56 1.49
1.351.14
1500
2000
2500
3000
3500
0.5
1
1.5
2
2.5
3
3.5
Q22014
Q32014
Q42014
Q12015
Q22015
Q32015
Q42015
Q12016
Q22016
Q32016
Q42016
Q12017
Q22017
Q32017
Q42017
Q12018
Net
deb
t $m
Net
deb
t to
Adju
sted
EBI
TDA
Net debt to Adjusted EBITDA Net debt

ON TRACK TO MEET FULL YEAR GUIDANCE
Q1 2018 MARKET UPDATE 13
2018 FY Guidance Q1 Results Commentary
Gold Production (000 oz) 3,325 – 3,450 824 24% of guidance midpoint in seasonally slow Q1
All-in sustaining costs* ($/oz) 990 – 1,060 1,029Sustaining Capex spend to increase
as per past trends
Total cash costs ($/oz) 770 – 830 834 Stronger rand and Aussie dollar, inflation and seasonally slow production Q1
Corporate costs ($m) 70 – 80 17 23% of guidance midpoint
Expensed expl./study costs ($m) 115 – 125 21 18% of guidance midpoint
Total Capex ($m) 800 – 920 16920% of guidance midpoint;Capex to increase in H2
Sustaining Capex ($m) 600 – 670 140 22% of guidance midpoint
Non-sustaining Capex ($m) 200 – 250 29 13% of guidance midpoint
*World Gold Council standard, excludes stockpiles written off
SENSITIVITIES(based on $1,250/oz gold price and the same assumptions used for guidance)
AISC ($/oz)
Cash from operating activities before taxes for remaining 9
months of 2018 ($m)
10% change in the oil price 5 12
10% change in local currency 62 129
5% change in the gold price 2 156
50koz change in production 14 45
Currency and commodity assumptions
$/R exchange rate 12.79
A$/$ exchange rate 0.78
$/BRL exchange rate 3.20
$/ARS exchange rate 19.61
Oil ($/bbl) 62
Both production and cost estimates assume neither labour interruptions or power disruptions, nor further changes to asset portfolio and/or operating mines and have not been reviewed by our external auditors. Other unknown or unpredictable factors could also have material adverse effects on our future results and no assurance can be given that any expectations expressed by AngloGold Ashanti will prove to have been correct. Please refer to the Risk Factors section in AngloGold Ashanti’s annual report on Form 20-F for the year ended 31 December 2017, filed with the United States Securities and Exchange Commission (SEC).

CONCLUSION
Q1 2018 MARKET UPDATE 14
Focus areas for remainder of 2018:• Continue focus on safety
• Complete SA restructuring process
• Ongoing engagement with DRC, Tanzania over
legislative changes
• Advance high-return brownfield projects
• Obuasi ratifications; advance project
• Continue Operational Excellence programme
• Improve free cash flow
Another consistent performance
Supporting our strategy for sustainable cash flow
improvements and returns
Related Documents


![Result Update Presentation Q1 FY 16 [Company Update]](https://static.cupdf.com/doc/110x72/577cb2961a28aba7118c175a/result-update-presentation-q1-fy-16-company-update.jpg)
![Investor Update Q1 FY16 [Company Update]](https://static.cupdf.com/doc/110x72/577cb41b1a28aba7118c4de4/investor-update-q1-fy16-company-update.jpg)