Q1 2018 EMAIL PROGRAM REVIEW June 21, 2018

Welcome message from author
This document is posted to help you gain knowledge. Please leave a comment to let me know what you think about it! Share it to your friends and learn new things together.
Transcript

Q1 2018 EMAIL PROGRAM REVIEW June 21, 2018

Q1 REVIEW MEETING AGENDA Performance Summary
Key Initiatives & Campaign Highlights
Core Campaigns

Q1 PERFORMANCE SUMMARY

EMAIL PERFORMANCE 4
FIRST QUARTER MADE POSITIVE KPI REBOUNDS VS. LQ
313.6M Emails Delivered -18.6% QoQ +13.1% YoY
9.1% CTO Rate
+21.3% QoQ +6.6% YoY
8.5% Conversion Rate
+0% QoQ -14.3% YoY
1.7 Bookings/Delivered (K)
+30.8% QoQ -10.5% YoY
22.3M Mailable Audience +3.6% QoQ +17.6% YoY
• Delivered increase is positive for exposure; open rates down YoY but CTOR has a healthy increase • Stronger emphasis on non-booking benefits correlated with declines in conversion and booking
1.27M Room Nights
+10% QoQ +1.3% YoY
22.3% Open Rate
+8.3% QoQ -2.1% YoY
*Financials based on EIR data

INDUSTRY ENGAGEMENT
PERFORMANCE CONSISTENT WITH Q1 2018 YLM BENCHMARKS
• The average number of emails sent per engaged subscriber declined by 29.3% from Q4 2017 to Q1 2018.
• The average open rate increased by 5.8% and the average unique click rate jumped by 12.1% QoQ.
Except… • The average unsubscribe rate increased by 15.7% QoQ.
• The unique click rate decreased by 7% YoY.
5

GROWTH OF MR EMAIL ENGAGEMENT 6
MEMBER ENGAGEMENT HAS STEADILY INCREASED OVER THE PAST 4 QUARTERS Fewer unengaged
members

EXECUTIVE DASHBOARD 7
Q1 2018 Email Performance:
• Expanded reach but BPK is down across the board, with the exception of Destinations mailings
• Destinations, Solos and Lifecycle are driving overall positive performance of program; Hotel Specials continues to underperform
• Lifecycle emails have the best CTOR of all categories at 22.4%
Program eNews
Hotel
Specials Dest. Solos Lifecycle MRCC METT313.6 M 44.6 M 29.0 M 41.7 M 111.1 M 21.4 M 47.0 M 18.9 M
13.1% 3.7% -6.9% 11.6% 27.3% 26.7% 7.5% 4.9%
0.16% 0.11% 0.15% 0.14% 0.14% 0.32% 0.22% 0.18%
-0.0 pts -0.0 pts -0.0 pts 0.0 pts 0.0 pts 0.1 pts -0.0 pts -0.1 pts
99.0% 99.2% 99.2% 99.2% 99.2% 97.3% 98.7% 98.8%
0.2 pts 0.1 pts -0.3 pts -0.3 pts -0.1 pts 0.8 pts -0.1 pts 3.3 pts
22.3% 19.6% 18.4% 19.7% 25.0% 27.0% 20.7% 22.5%
-0.5 pts -1.8 pts -1.5 pts -2.6 pts 2.1 pts -4.3 pts -2.3 pts 0.2 pts
69.9 M 8.7 M 5.3 M 8.2 M 27.8 M 5.8 M 9.7 M 4.3 M
10.7% -5.1% -13.9% -1.2% 39.1% 9.2% -3.4% 5.8%
2.0% 2.2% 1.4% 1.5% 2.4% 6.1% 0.7% 0.6%
0.1 pts -0.6 pts -0.1 pts 0.3 pts 0.2 pts 0.6 pts -0.1 pts -0.4 pts
6.3 M 960.1 K 396.0 K 636.0 K 2.6 M 1.3 M 308.8 K 113.2 K
18.1% -19.0% -12.1% 40.8% 39.9% 42.0% -1.3% -36.4%
9.1% 11.0% 7.4% 7.8% 9.5% 22.4% 3.2% 2.7%
0.6 pts -1.9 pts 0.2 pts 2.3 pts 0.1 pts 5.2 pts 0.1 pts -1.8 pts
540.5 K 107.3 K 30.3 K 38.0 K 248.5 K 76.0 K 29.0 K 11.4 K
1.2% -12.8% -24.9% 23.2% 20.2% -0.3% -20.0% -44.3%
1.3 M 254.3 K 69.1 K 91.6 K 577.8 K 187.6 K 62.8 K 26.5 K
1.3% -12.3% -26.1% 23.1% 19.3% 1.2% -21.1% -41.5%
$196.9 M $40.0 M $10.8 M $14.7 M $89.4 M $29.1 M $8.6 M $4.4 M
2.0% -10.3% -25.9% 24.7% 19.7% 2.2% -27.3% -38.5%
8.5% 11.2% 7.6% 6.0% 9.4% 5.9% 9.4% 10.1%
-1.4 pts 0.8 pts -1.3 pts -0.9 pts -1.5 pts -2.5 pts -2.2 pts -1.4 pts
1.7 2.4 1.0 0.9 2.2 3.6 0.6 0.6
-10.5% -15.9% -19.4% 10.4% -5.6% -21.4% -25.6% -46.9%
Aud
ienc
e
Total
Delivered
Unsub Rate
Delivery Rate
Enga
gem
ent
Open Rate
Opens
Click Rate
Unique Clicks
Click to Open
Rate
Fina
ncia
l
Bookings
RoomNights
Revenue
Conversion Rate
Bookings per
Delivered(K)

PROGRAM SUMMARY 8
BPK DOWN 20% MONTH OVER MONTH March bookings per thousand delivered (BPK) have been consistently lower than January & February since ’15 The decline seems to be reflecting a larger Booking/Delivered trend Decline reflects increase in emails delivered + shift in email focus to program benefit support
Booking/Delivered Jan Feb Mar Annual Avg.
2015 3 2.9 2.3 2.2 2016 2.1 2.2 2.1 2.1 2017 2.4 1.8 1.7 1.7 2018 2.1 1.8 1.3 -

PROGRAM SUMMARY 9
SOLO’S DRIVE PROGRAM METRICS • 50% increase in number of unique Solo emails sent YoY • 83% of Q1 Solo’s were focused on program benefits (non-booking) • Increase in Solo room nights are positive for the program
Q1 '18
Delivered vs. LY Q1 '18 Room Nts. vs. LY Q1 '18
BPK vs. LY
eNews 44.6 M 4% 254.3 K -12% 2.4 -16% Hotel Specials 29.0 M -7% 69.1 K -26% 1.0 -19%
Solo 111.1 M 27% 577.8 K 19% 2.2 -6% Lifecycle 21.4 M 27% 187.6 K 1% 3.6 -21%
MRCC 47.0 M 8% 62.8 K -21% 0.6 -26% METT 18.9 M 5% 26.5 K -41% 0.6 -47%
Destinations 41.7 M 12% 91.6 K 23% 0.9 10% Grand Total 313.6 M 13% 1.3 M 1% 1.7 -10%
Solo’s drive program: 35% of Delivered
46% of Room Nights

PROGRAM SUMMARY 10
RECOMMENDATIONS • Establish tracking & reporting process for business
partner KPI’s o Redemptions (MR Moments, RewardsPlus) o Registrations (MegaBonus) o Acquisitions (by segment for cobrand card solicitations) o Partner Revenue (Marriott Vacations Worldwide, Hertz)
• Use customer data to improve targeting; expected hit on emails delivered

KEY INITIATIVES & CAMPAIGN HIGHLIGHTS
• Moments Testing & Optimization • MRCC Canada Winback • Spring MegaBonus Support

Q1 ‘18 MOMENTS RECAP 12
MOMENTS ENGAGEMENT CONTINUES TO IMPROVE • CTOR spiked in Feb; High points group up 19% MoM and Low up 22%
o Possible impact from deployment change – from typical Monday’s to Tuesday o Consider day of week testing to determine best day for email and redemption engagement
• March open rate for Low jumped 10% MoM and CTOR up 43% o Drop in delivered counts MoM effected metrics by boosting rates o The March subject line used ‘intrigue’ to drive engagement; consider testing with first name
Low Group Subject Lines Delivered Open Rate
JAN: Discover Your Best Moment Ever 2.1M 41.0%
FEB: Discover Moments to <3, [FNAME] 1.6M 42.9%
MAR: These Moments Are for Members Only 1.4M 47.4%

MOMENTS IMAGE A/B TEST 13
CREATIVE TEST CONCLUDES ANIMATED MOSAIC DRIVES CTOR LIFTS VS. FULL SPAN IMAGE • Final 3 month test results show
higher Section and Campaign CTO rates with the animated mosaic treatment o CTOR lifts up to 19% for section and
3% for campaign
• Animated mosaic may be a contributing factor to lifts; consider testing with & without animation
• Leverage mosaic style going forward o Opportunity to use Wylei
optimization to enhance with other category images

MRCC CANADA WINBACK RECAP 14
HIGH ENGAGEMENT WITH CANADA CREDIT CARD EMAILS: NOTIFICATION & WINBACK OFFER
Overview: • Notification sent in mid-Jan to
Canadian cardholders about the cancellation of their credit card
• Late Jan, a winback offer was sent promoting the Amex SPG card product
Observations: • High open rate with initial
notification; minimal links resulted in low CTOR • Reminders drove incremental
engagement • Consider using propensity
data to improve performance of 3rd reminder
1/19: Initial Notification
1/29: Winback
Spikes coincide with email deployments

MRCC CANADA WINBACK RECAP 15
45% OF NEW WINBACK ACCOUNTS FROM EMAIL
• 14,000+ total new accounts
• 45% of new accounts were acquired from MR email channel
• eNews drove 45% more new accounts vs. SPG’s monthly newsletter banner
Use tactics to partner on future non-U.S. cross-product promotions

SPRING ‘18 MEGABONUS SUPPORT OVERVIEW 16
$45.3M FROM SPRING MEGABONUS EMAIL SUPPORT
• Bookings are down YoY despite increased reach through more deliveries
• One major difference was Spring 2017 had an Announcement, which drove $20.4M in Revenue
Spring ‘17 Summer ’17 Fall ’17 Spring ‘18
# campaigns featured 9 9 11 8
Reach 68.8M 85.4M 91.7M 86.1M
Revenue (EIR) $52.2M $45.2M $58M $45.3M
Booking 144.8K 133.2K 171.9K 124.4K
*Promotion results are for first 3 months

SPRING ‘18 MEGABONUS SUPPORT 17
RECOMMENDATIONS • Announcements: leverage eNews and Solo to non-openers • Registration Confirmation:
o Use “Book now” CTA o Include booking content (Travel Deals, hotel propensity)
• Reminder Solo’s: segment audience based on promo activity and tailor content to each segment
• Achievement Solo: use hotel propensity for next stay reco • Include offer in subject lines
Apply above recommendations to other emails with MegaBonus content

CORE CAMPAIGNS

CORE CAMPAIGNS 19
ENEWS
Delivered 4% more emails QoQ, but opens & clicks decreased MoM • MegaBonus feature saw
fewer section clicks in Feb. (-24% vs. 12M avg.)
• Marriott Vacations feature in Mar. saw fewer clicks (-36% vs. 12M avg.)
Consider using SL test & roll and content optimization in feature to lift clicks • Retest winning styles: • Promo: “Sign up for…” • Intrigue: “The Most Popular
Benefits Are…”
• When possible, leverage image optimization or DCA/Wylei to lift CTOR’s
19.6% Open Rate -1.8 pts.
11.0% CTO Rate -1.9 pts.
2.2% Click Rate -0.6 pts.
Engagement
2.4 BPK
-15.9%
254.3K Room Nights
-12.3%
11.2% Conversion 0.8 pts.
$40MM Revenue -10.3%
Financial
CORE CAMPAIGNS 20
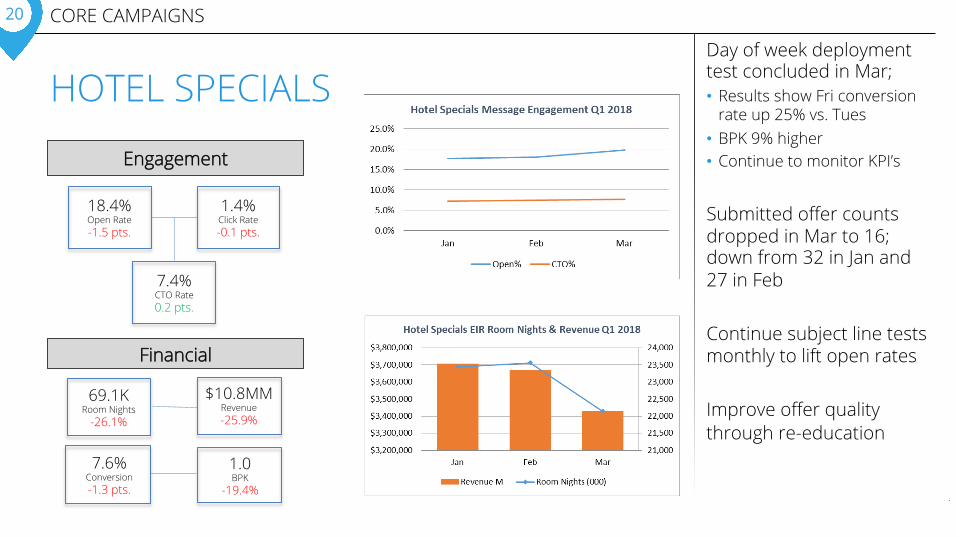
HOTEL SPECIALS
Day of week deployment test concluded in Mar; • Results show Fri conversion
rate up 25% vs. Tues • BPK 9% higher • Continue to monitor KPI’s Submitted offer counts dropped in Mar to 16; down from 32 in Jan and 27 in Feb Continue subject line tests monthly to lift open rates Improve offer quality through re-education
18.4% Open Rate -1.5 pts.
7.4% CTO Rate 0.2 pts.
1.4% Click Rate -0.1 pts.
1.0 BPK
-19.4%
69.1K Room Nights
-26.1%
7.6% Conversion -1.3 pts.
$10.8MM Revenue -25.9%
Engagement
Financial

CORE CAMPAIGNS 21
DESTINATIONS
Sat vs. Fri deployment test generated higher open & CTO rates in Feb and Mar: • Open rate: up 2% and 4% • CTO rate: up 8% and 13% • April shows same trends
Continue SL test & roll to lift open rates; down almost 3 pts. QoQ; re-test winning styles: • Personal tone: “Let’s Talk
Vacation, [FNAME]” • Listicle: “4 Trips for Every
Relationship Style” • Intrigue/FOMO: “Don’t Miss
This Road Trip”
QoQ, clicks are up 41%; Mar saw the highest CTOR since 2016 at 9.7% • Started summer travel series • Positive impact of day of wk.
test
19.7% Open Rate -2.6 pts.
7.8% CTO Rate 2.3 pts.
1.5% Click Rate 0.3 pts.
0.9 BPK
10.4%
91.6K Room Nights
23.1%
6.0% Conversion -0.9 pts.
$14.7MM Revenue 24.7%
Engagement
Financial

ACTIONABLE INSIGHTS

ACTIONABLE INSIGHTS 23
RECOMMENDATIONS • Improve campaign insights by establishing business partner feedback
loop and analysis plans for KPI’s like redemptions, promo registrations
• Develop MegaBonus communication plan at the beginning of promo using learnings and best practices o Contact strategy o Message outline o Optimization efforts
• Leverage winning subject line styles to lift open rates in eNews and Destinations o Winning styles: intrigue, listicle, promo targeted, personal/conversational

MARRIOTT TRAVELER Q1 2018 NEWSLETTER
PERFORMANCE RESULTS

TRAVELER PERFORMANCE RECAP
Feb
• Above goal open rates each month from subject line testing
• Audience expansion had impact on engagement; click rates at an all time low
• However, February quiz drove record high click engagement
Jan Mar Feb

EMAIL PERFORMANCE RESULTS: Q1 2018
11.2M Deployed
97% Delivery Rate
18% Open Rate 15% is Goal
(+3 pts. vs. goal)
1% Click Rate
5.8% Click-to-Open
Rate 15% is Goal
(-9.2 pts. vs. goal)
0.06% Unsubscribe Rate
Data source: Harmony; based on unique counts Report time period: 2 weeks post-launch for Oct, Nov, and Dec emails
• Deployment increased 24% QoQ; deliverability rate also increased by 7% • Open rates up 60% QoQ & 20% above goal; positive gains from subject line testing • 112K+ unique clicks in Q1; up 46% from Q4 ‘17 • CTOR down 61%; noticeable MoM declines especially in March at 3.9% (lowest to-date)

CTOR DECLINES WITH INCREASED DELIVERY QOQ • Low CTOR, high open & stable unsub suggests engagement opp. • Large # of new subscribers brought metrics back to starting point
0.00%
5.00%
10.00%
15.00%
20.00%
0
2,000,000
4,000,000
6,000,000
8,000,000
10,000,000
12,000,000
Q32017 Q42017 Q12018
Delivered OpenRate CTOR
0.05%
0.04%
0.06%
0.00%
0.03%
0.06%
0.09%
Q32017 Q42017 Q12018
UnsubRate

CONTENT SUMMARY Impact of audience expansion on engagement
• % of clicks on most sections were down QoQ except Header, Popular, & Curated C – Header up 19%; mostly from Feb & Mar – Popular Articles up 43%; mostly from Mar
• March Feature % of clicks down 67% MoM; some clicks shifted to video & Popular (+24%)
Feb Feature quiz resulted in 35% of clicks; highest for quarter
March video generated 5% of email clicks – 0.25% CTOR and 76.1% click to play rate (CTPR) – Compared to other video’s, CTOR +8.6%, CTPR -3.5%
Header–13.3%clicks
CuratedFeature–29.6%clicks
CuratedArHclesA–13.8%clicks
PopularArHcles–16.8%clicks
Banner1–0.21%clicks
Banner2–0.20%clicks
Banner3–0.14%clicks
CuratedArHclesB–2.9%clicks
SHckyContent–1.3%clicks
CuratedArHclesC–10.9%clicks
Footer–9.9%clicks

• Monitor new and existing audience engagement with new reporting structure
• Test day of week deployment to lift key metrics (open & CTR rates)
• Improve personalization in subject lines and content modules (roadmap)
• Increase engagement through video, surveys, and animation
ACTIONABLE INSIGHTS

THANK YOU!
Related Documents