Hospitality Properties Trust Q1 2016 Investor Presentation Royal Sonesta Hotel New Orleans, New Orleans, LA Operator: Sonesta International Hotels Corp. Guest Rooms: 483

Welcome message from author
This document is posted to help you gain knowledge. Please leave a comment to let me know what you think about it! Share it to your friends and learn new things together.
Transcript

Hospitality Properties Trust Q1 2016 Investor Presentation
Royal Sonesta Hotel New Orleans, New Orleans, LA
Operator: Sonesta International Hotels Corp.
Guest Rooms: 483
Hospitality Properties Trust
Disclaimer.
THIS PRESENTATION CONTAINS FORWARD LOOKING STATEMENTS WITHIN THE MEANING OF THE
PRIVATE SECURITIES LITIGATION REFORM ACT OF 1995 AND OTHER SECURITIES LAWS. ALSO,
WHENEVER WE USE WORDS SUCH AS "BELIEVE," "EXPECT," "ANTICIPATE," "INTEND," "PLAN,"
"ESTIMATE," OR SIMILAR EXPRESSIONS, WE ARE MAKING FORWARD LOOKING STATEMENTS. THESE
FORWARD LOOKING STATEMENTS ARE BASED UPON OUR PRESENT INTENT, BELIEFS OR
EXPECTATIONS. FORWARD LOOKING STATEMENTS ARE NOT GUARANTEED TO OCCUR AND MAY NOT
OCCUR. ACTUAL RESULTS MAY DIFFER MATERIALLY FROM THOSE CONTAINED IN OR IMPLIED BY OUR
FORWARD LOOKING STATEMENTS AS A RESULT OF VARIOUS FACTORS. YOU SHOULD NOT PLACE
UNDUE RELIANCE UPON ANY FORWARD LOOKING STATEMENT. EXCEPT AS REQUIRED BY APPLICABLE
LAW, WE UNDERTAKE NO OBLIGATION TO UPDATE OR REVISE ANY FORWARD LOOKING STATEMENT AS
A RESULT OF NEW INFORMATION, FUTURE EVENTS OR OTHERWISE.
THIS PRESENTATION CONTAINS NON-GAAP FINANCIAL MEASURES, INCLUDING ADJUSTED EBITDA AND
NORMALIZED FUNDS FROM OPERATIONS.
2 Unless otherwise noted, all data presented is as of March 31, 2016.

Hospitality Properties Trust
HPT’s high quality properties, conservative profile and secure
cash flows provide a growing and well covered dividend.
3
• Favorable market trends – lodging and travel center industry.
• Diversified portfolio of recently renovated, high quality properties.
• Long term portfolio agreements that can provide security of cash flow.
• Hotel RevPAR growth outperforming the industry.
• Ramping portfolio and external growth opportunities.
• Conservative profile. Capacity to support continued disciplined growth.
Hospitality Properties Trust
Economic growth continues. U.S. hotel industry forecasts
remain optimistic.
4 STR Quarterly Hotel Review and PWC US Lodging Forecast– January 2016
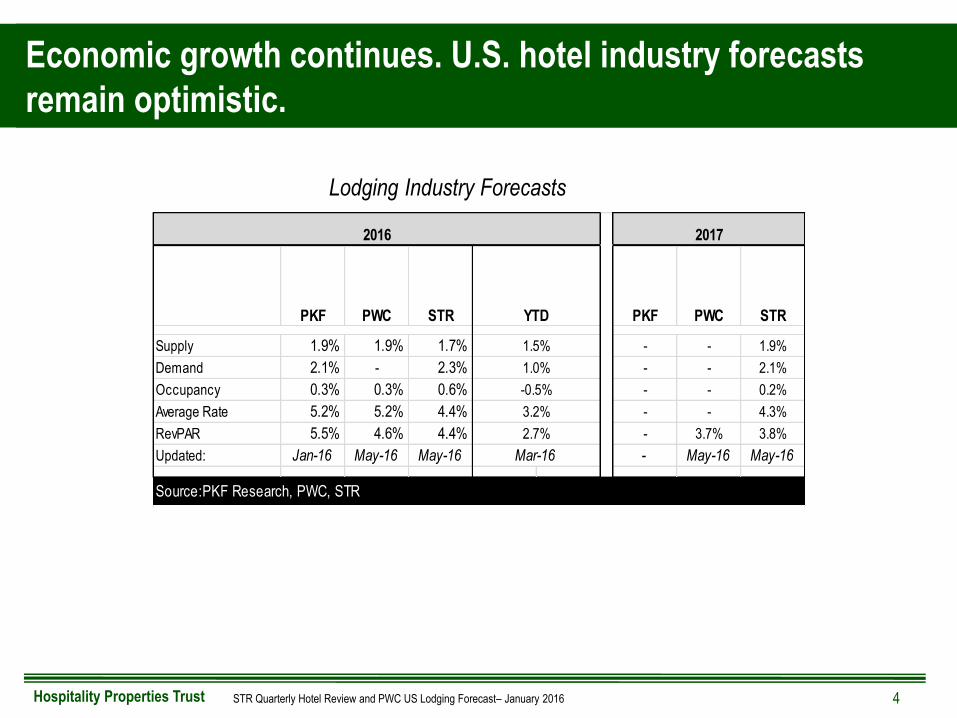
Lodging Industry Forecasts
1.9% 1.9% 1.7% - - 1.9%
2.1% - 2.3% - - 2.1%
0.3% 0.3% 0.6% - - 0.2%
5.2% 5.2% 4.4% - - 4.3%
5.5% 4.6% 4.4% - 3.7% 3.8%
Jan-16 May-16 May-16 - May-16 May-16
2017
PKF PWC
Source:PKF Research, PWC, STR
STR YTD PKF PWC STR
Supply 1.5%
2016
RevPAR
Updated:
1.0%
-0.5%
3.2%
2.7%
Mar-16
Demand
Occupancy
Average Rate
Hospitality Properties Trust
Economic growth continues. Increasing regulation may cater to
full service travel center advantages.
5
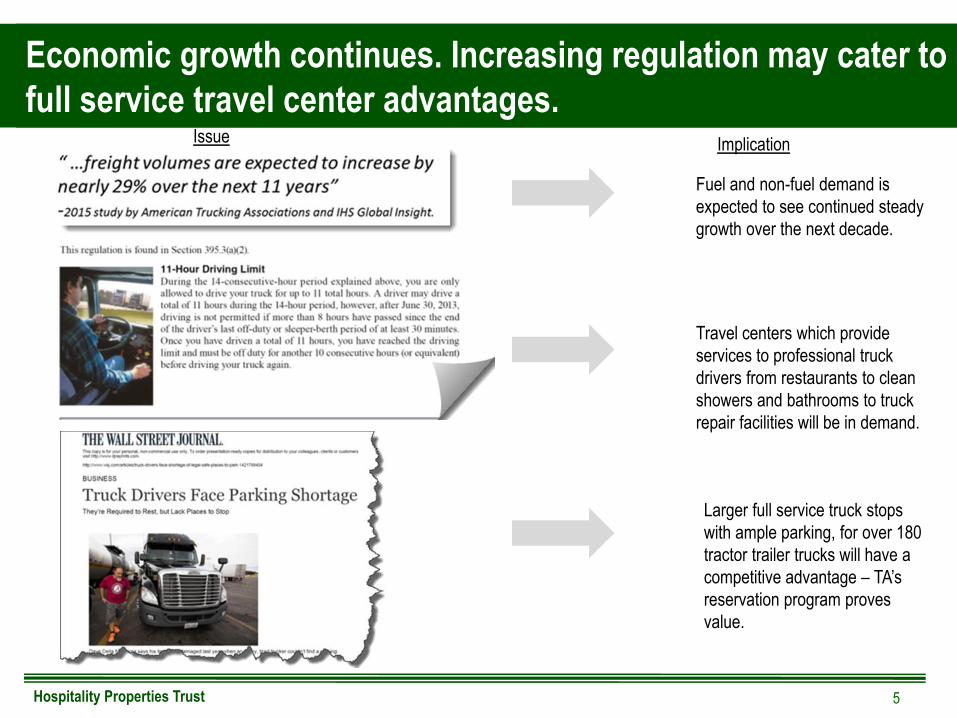
Issue Implication
Fuel and non-fuel demand is
expected to see continued steady
growth over the next decade.
Travel centers which provide
services to professional truck
drivers from restaurants to clean
showers and bathrooms to truck
repair facilities will be in demand.
Larger full service truck stops
with ample parking, for over 180
tractor trailer trucks will have a
competitive advantage – TA’s
reservation program proves
value.
Hospitality Properties Trust
HPT is one of the most geographically diverse lodging REITs that owns hotels
and travel centers operated under recognized brands.
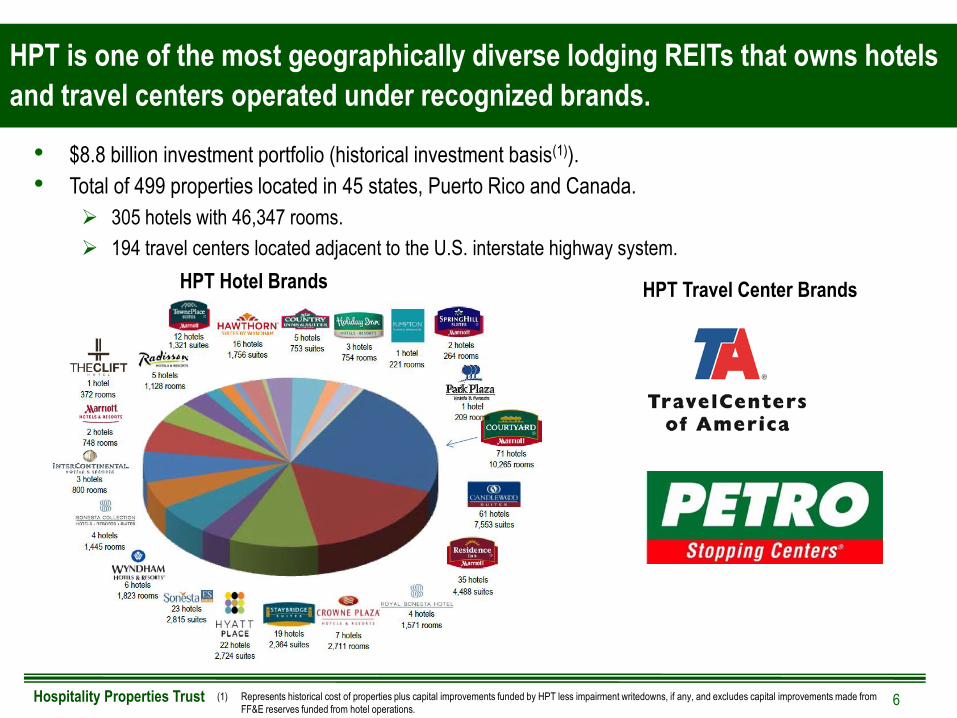
• $8.8 billion investment portfolio (historical investment basis(1)).
• Total of 499 properties located in 45 states, Puerto Rico and Canada.
305 hotels with 46,347 rooms.
194 travel centers located adjacent to the U.S. interstate highway system.
6 (1) Represents historical cost of properties plus capital improvements funded by HPT less impairment writedowns, if any, and excludes capital improvements made from
FF&E reserves funded from hotel operations.
HPT Hotel Brands
HPT Travel Center Brands
Hospitality Properties Trust
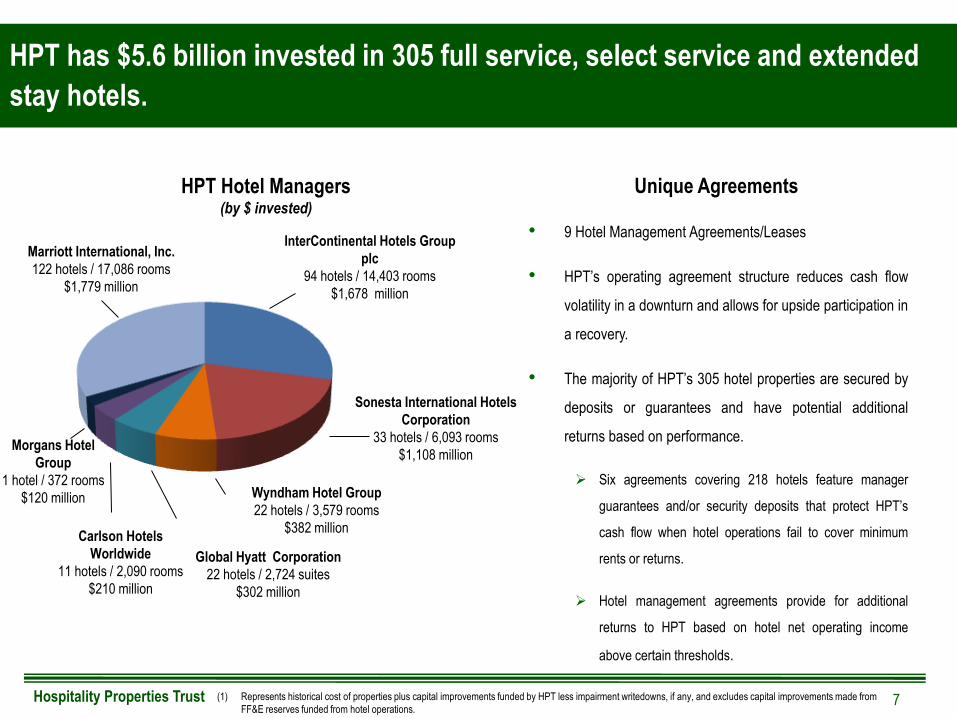
HPT has $5.6 billion invested in 305 full service, select service and extended
stay hotels.
7 (1) Represents historical cost of properties plus capital improvements funded by HPT less impairment writedowns, if any, and excludes capital improvements made from
FF&E reserves funded from hotel operations.
Sonesta International Hotels
Corporation
33 hotels / 6,093 rooms
$1,108 million
InterContinental Hotels Group
plc
94 hotels / 14,403 rooms
$1,678 million
Carlson Hotels
Worldwide
11 hotels / 2,090 rooms
$210 million
Marriott International, Inc.
122 hotels / 17,086 rooms
$1,779 million
HPT Hotel Managers
(by $ invested)
Morgans Hotel
Group
1 hotel / 372 rooms
$120 million
Global Hyatt Corporation
22 hotels / 2,724 suites
$302 million
Wyndham Hotel Group
22 hotels / 3,579 rooms
$382 million
• 9 Hotel Management Agreements/Leases
• HPT’s operating agreement structure reduces cash flow
volatility in a downturn and allows for upside participation in
a recovery.
• The majority of HPT’s 305 hotel properties are secured by
deposits or guarantees and have potential additional
returns based on performance.
Six agreements covering 218 hotels feature manager
guarantees and/or security deposits that protect HPT’s
cash flow when hotel operations fail to cover minimum
rents or returns.
Hotel management agreements provide for additional
returns to HPT based on hotel net operating income
above certain thresholds.
Unique Agreements

Hospitality Properties Trust 8
Wyndham Grand Chicago Riverfront, Chicago, IL
Operator: Wyndham Hotel Group
Guest Rooms: 334
Vacation Rental Units: 48

Hospitality Properties Trust
Supplemental Operating and Financial Data, March 31, 2016
Hawthorn Suites by Wyndham, Wheeling, IL
Operator: Wyndham Hotel Group
Guest Rooms: 141
9
Hospitality Properties Trust
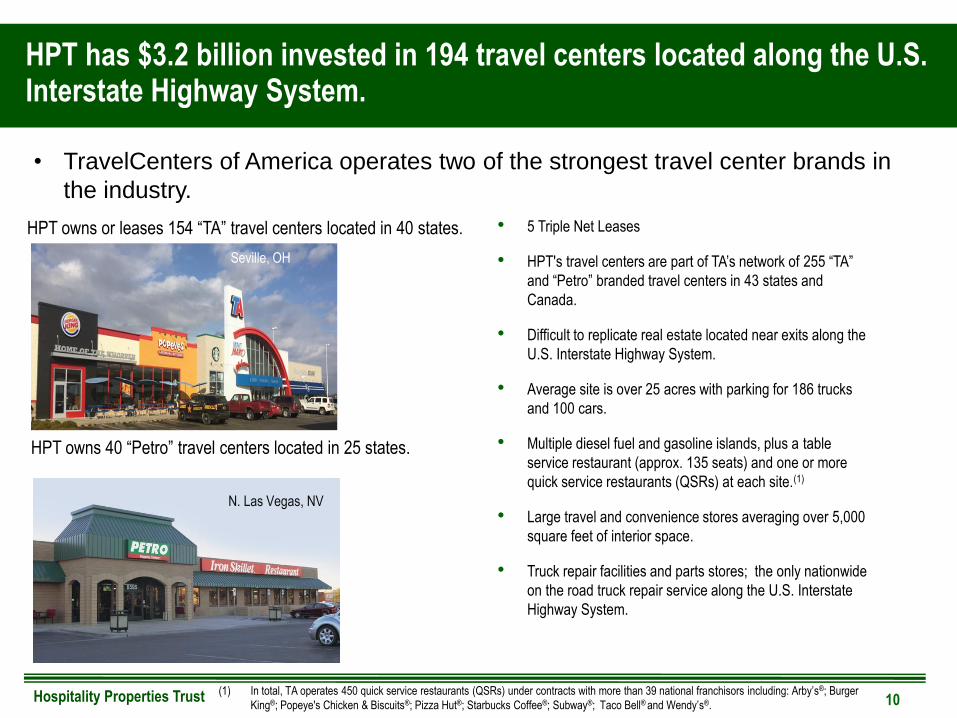
HPT has $3.2 billion invested in 194 travel centers located along the U.S. Interstate Highway System.
10
HPT owns or leases 154 “TA” travel centers located in 40 states.
HPT owns 40 “Petro” travel centers located in 25 states.
Seville, OH
N. Las Vegas, NV
• TravelCenters of America operates two of the strongest travel center brands in
the industry.
• 5 Triple Net Leases
• HPT's travel centers are part of TA’s network of 255 “TA”
and “Petro” branded travel centers in 43 states and
Canada.
• Difficult to replicate real estate located near exits along the
U.S. Interstate Highway System.
• Average site is over 25 acres with parking for 186 trucks
and 100 cars.
• Multiple diesel fuel and gasoline islands, plus a table
service restaurant (approx. 135 seats) and one or more
quick service restaurants (QSRs) at each site.(1)
• Large travel and convenience stores averaging over 5,000
square feet of interior space.
• Truck repair facilities and parts stores; the only nationwide
on the road truck repair service along the U.S. Interstate
Highway System.
(1) In total, TA operates 450 quick service restaurants (QSRs) under contracts with more than 39 national franchisors including: Arby’s®; Burger
King®; Popeye's Chicken & Biscuits®; Pizza Hut®; Starbucks Coffee®; Subway®; Taco Bell® and Wendy’s®.
Hospitality Properties Trust
Q1 LTM Security Features
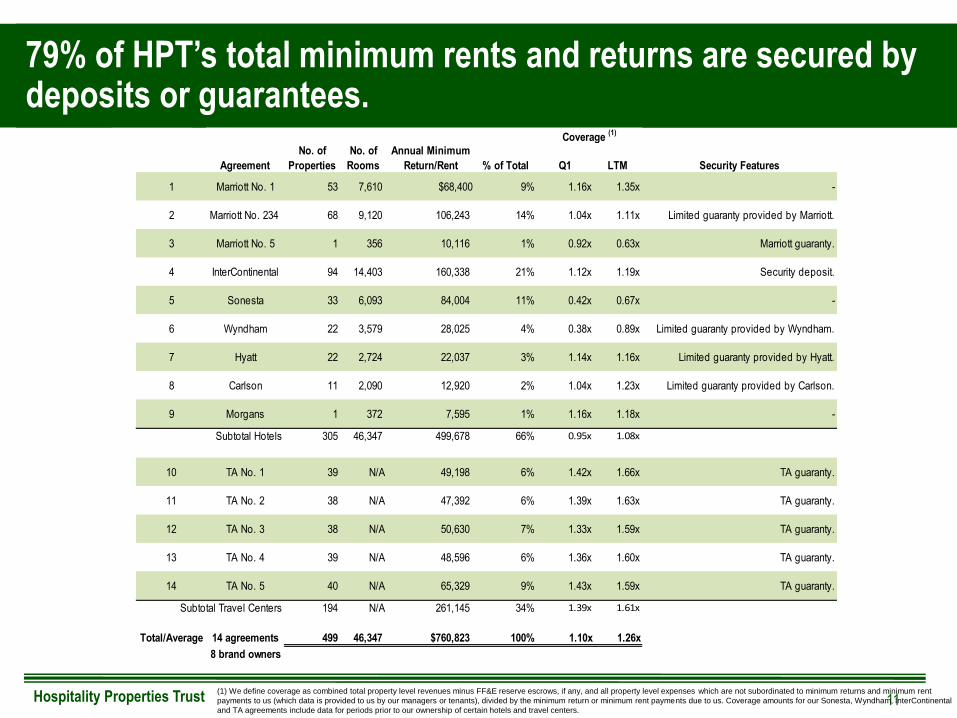
Total/Average 14 agreements 499 46,347 $760,823 100% 1.10x 1.26x
8 brand owners
Agreement
No. of
Properties
No. of
Rooms
Annual Minimum
Return/Rent % of Total
1.36x
1.43x
1.35x
1.11x
0.63x
1.19x
0.67x
0.89x
1.16x
1.23x
1.18x
1.66x
1.63x
1.59x
1.60x
1.59x
7%
Coverage (1)
-
2 Marriott No. 234 68 9,120 106,243 14% Limited guaranty provided by Marriott.
1 Marriott No. 1 53 7,610 $68,400 9% 1.16x
1.04x
Marriott guaranty.
4 InterContinental 94 14,403 160,338 21% Security deposit.
3 Marriott No. 5 1 356 10,116 1% 0.92x
1.12x
-
6 Wyndham 22 3,579 28,025 4% Limited guaranty provided by Wyndham.
5 Sonesta 33 6,093 84,004 11% 0.42x
0.38x
Limited guaranty provided by Hyatt.
8 Carlson 11 2,090 12,920 2% Limited guaranty provided by Carlson.
7 Hyatt 22 2,724 22,037 3% 1.14x
1.04x
-
10 TA No. 1 39 N/A 49,198 6% TA guaranty.
9 Morgans 1 372 7,595 1% 1.16x
1.42x
Subtotal Hotels 305 46,347 499,678 66% 0.95x 1.08x
TA guaranty.
11 TA No. 2 38 N/A 47,392 6% 1.39x
1.33x12 TA No. 3 38 N/A 50,630
TA guaranty.
Subtotal Travel Centers 194 N/A 261,145 34% 1.39x 1.61x
TA guaranty.
14 TA No. 5 40 N/A 65,329 9% TA guaranty.
13 TA No. 4 39 N/A 48,596 6%
79% of HPT’s total minimum rents and returns are secured by deposits or guarantees.
11 (1) We define coverage as combined total property level revenues minus FF&E reserve escrows, if any, and all property level expenses which are not subordinated to minimum returns and minimum rent
payments to us (which data is provided to us by our managers or tenants), divided by the minimum return or minimum rent payments due to us. Coverage amounts for our Sonesta, Wyndham, InterContinental
and TA agreements include data for periods prior to our ownership of certain hotels and travel centers.
Hospitality Properties Trust
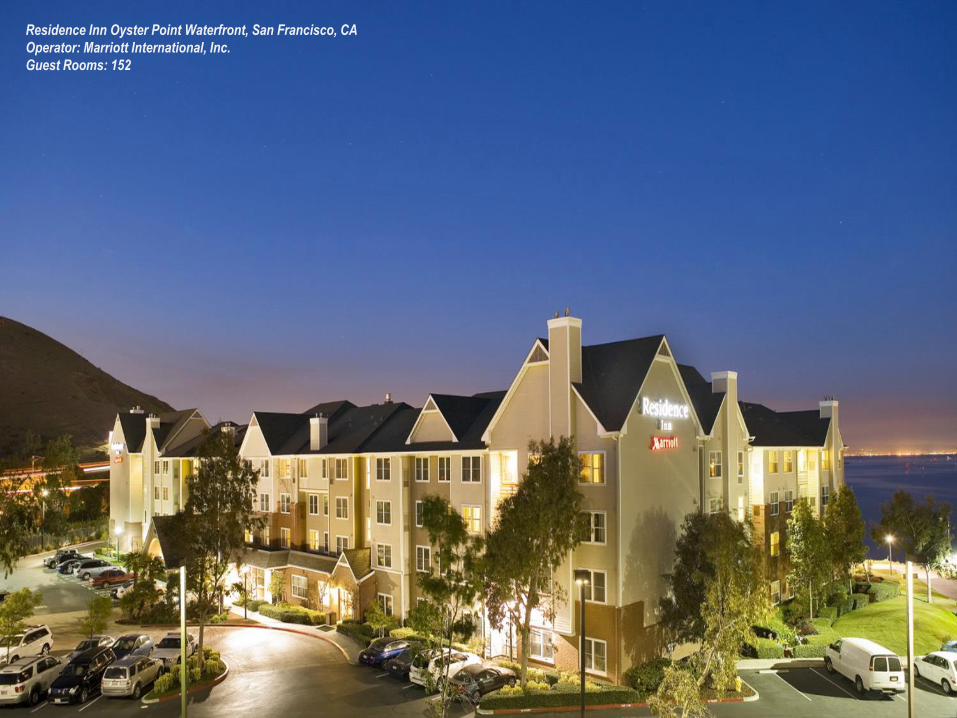
Residence Inn Oyster Point Waterfront, San Francisco, CA
Operator: Marriott International, Inc.
Guest Rooms: 152

Hospitality Properties Trust
13
Marriott Residence Inn San Antonio Downtown/Alamo Plaza, San Antonio, TX
Operator: Marriott International, Inc.
Guest Rooms: 220
Hospitality Properties Trust
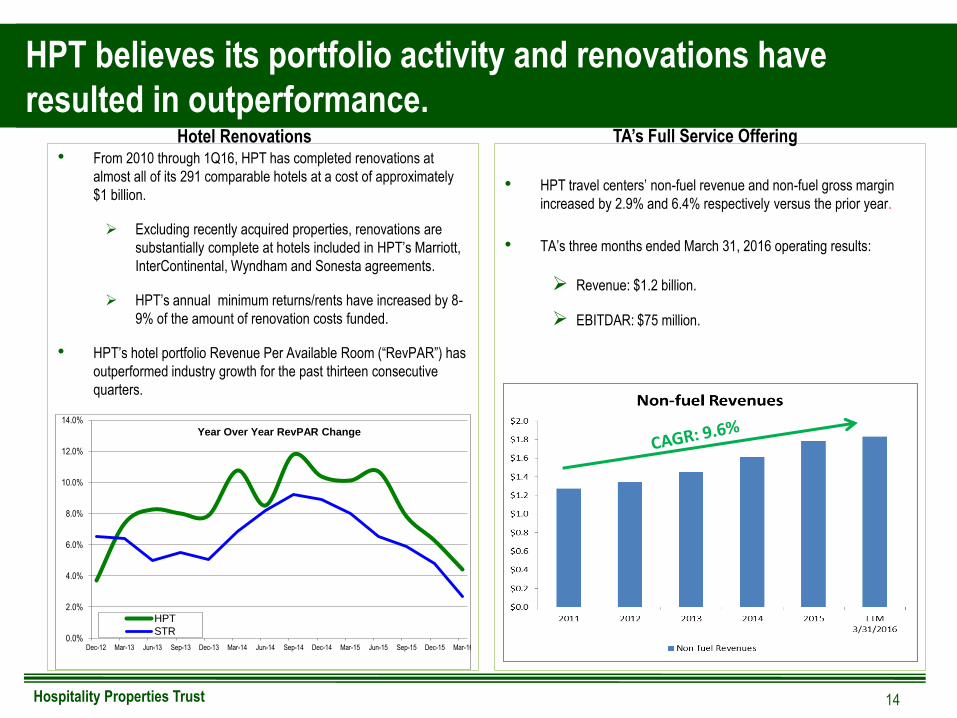
HPT believes its portfolio activity and renovations have
resulted in outperformance.
• From 2010 through 1Q16, HPT has completed renovations at
almost all of its 291 comparable hotels at a cost of approximately
$1 billion.
Excluding recently acquired properties, renovations are
substantially complete at hotels included in HPT’s Marriott,
InterContinental, Wyndham and Sonesta agreements.
HPT’s annual minimum returns/rents have increased by 8-
9% of the amount of renovation costs funded.
• HPT’s hotel portfolio Revenue Per Available Room (“RevPAR”) has
outperformed industry growth for the past thirteen consecutive
quarters.
14
• HPT travel centers’ non-fuel revenue and non-fuel gross margin
increased by 2.9% and 6.4% respectively versus the prior year.
• TA’s three months ended March 31, 2016 operating results:
Revenue: $1.2 billion.
EBITDAR: $75 million.
Hotel Renovations TA’s Full Service Offering
0.0%
2.0%
4.0%
6.0%
8.0%
10.0%
12.0%
14.0%
Dec-12 Mar-13 Jun-13 Sep-13 Dec-13 Mar-14 Jun-14 Sep-14 Dec-14 Mar-15 Jun-15 Sep-15 Dec-15 Mar-16
Year Over Year RevPAR Change
HPT
STR

Hospitality Properties Trust 15
Sonesta ES Suites Princeton, Princeton, NJ
Operator: Sonesta International Hotels Corp.
Guest Rooms: 124
Hospitality Properties Trust 16
Staybridge Suites Lake Buena Vista, Orlando, FL
Operator: InterContinental Hotels Group
Guest Rooms: 150
Hospitality Properties Trust
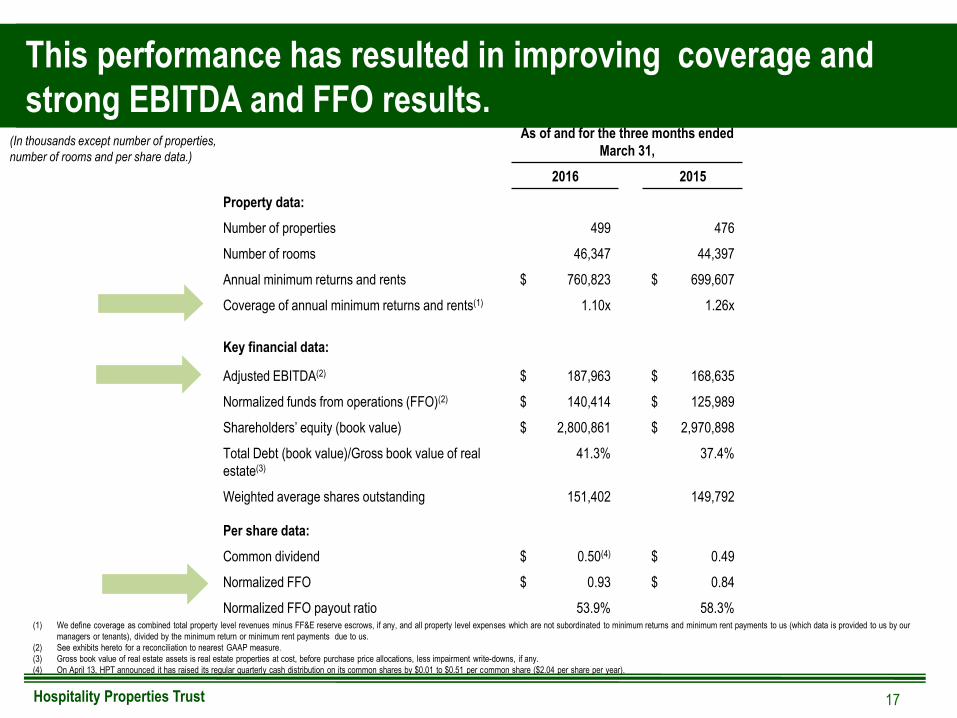
This performance has resulted in improving coverage and
strong EBITDA and FFO results.
17
(1) We define coverage as combined total property level revenues minus FF&E reserve escrows, if any, and all property level expenses which are not subordinated to minimum returns and minimum rent payments to us (which data is provided to us by our
managers or tenants), divided by the minimum return or minimum rent payments due to us.
(2) See exhibits hereto for a reconciliation to nearest GAAP measure.
(3) Gross book value of real estate assets is real estate properties at cost, before purchase price allocations, less impairment write-downs, if any.
(4) On April 13, HPT announced it has raised its regular quarterly cash distribution on its common shares by $0.01 to $0.51 per common share ($2.04 per share per year).
(In thousands except number of properties,
number of rooms and per share data.)
As of and for the three months ended
March 31,
2016 2015
Property data:
Number of properties 499 476
Number of rooms 46,347 44,397
Annual minimum returns and rents $ 760,823 $ 699,607
Coverage of annual minimum returns and rents(1) 1.10x 1.26x
Key financial data:
Adjusted EBITDA(2) $ 187,963 $ 168,635
Normalized funds from operations (FFO)(2) $ 140,414 $ 125,989
Shareholders’ equity (book value) $ 2,800,861 $ 2,970,898
Total Debt (book value)/Gross book value of real
estate(3)
41.3% 37.4%
Weighted average shares outstanding 151,402 149,792
Per share data:
Common dividend $ 0.50(4) $ 0.49
Normalized FFO $ 0.93 $ 0.84
Normalized FFO payout ratio 53.9% 58.3%
Hospitality Properties Trust
HPT believes it will continue benefitting from hotel renovations and
travel center improvements and from overall health of the portfolio.
• HPT funded $12.5 million dollars of hotel improvements during Q1. HPT expects to fund an
additional $69 million of hotel improvements during the remainder of 2016.
• HPT expects to have 14 hotels under renovation for all or part of the second quarter.
• HPT funded $20.6 million dollars of travel center improvements in 2016. HPT expects to
fund an additional $129 million of travel center improvements during the remainder of 2016.
• HPT’s hotel operators continue to anticipate full-year 2016 RevPAR growth generally in the 5
to 7% range, and GOP margin percentage improvement of 100 to 150 basis points versus
the same period in 2015.
18
Hospitality Properties Trust
Acquisition activity.
• In February, 2016, HPT acquired the previously announced extended stay transaction
consisting of two extended stay hotels with 262 suites located in Cleveland, OH and Westlake,
OH for an aggregate purchase price of $12.0 million. HPT converted these hotels to Sonesta
ES Suites and added them to its management agreement with Sonesta.
• In March, 2016, HPT acquired the luxury boutique Hotel Monaco in the center of downtown
Portland, Oregon for a purchase price of $114 million dollars. This hotel has 221 rooms, the
successful Red Star Tavern restaurant and bar, over 8,000 square feet of meeting space and
full service spa. The hotel was added to HPT’s management agreement with IHG and IHG
provided an additional security deposit to us of 9 million dollars.
• In March 2016, HPT acquired from TA a newly developed travel center near Dallas for $19.7
million dollars. This property features 200 truck parking spots, an 18,000 sq. truck service stop,
large convenience store and Virtual Ranger’s Sports Café among other amenities. This
property was added to its TA No. 4 lease. Annual minimum rent associated with this property is
1.7 million dollars. This property is one of five newly developed TA sites that HPT has
committed to acquire later this year and next.
• We continue to evaluate investment opportunities but intend to remain disciplined.
19
Hospitality Properties Trust
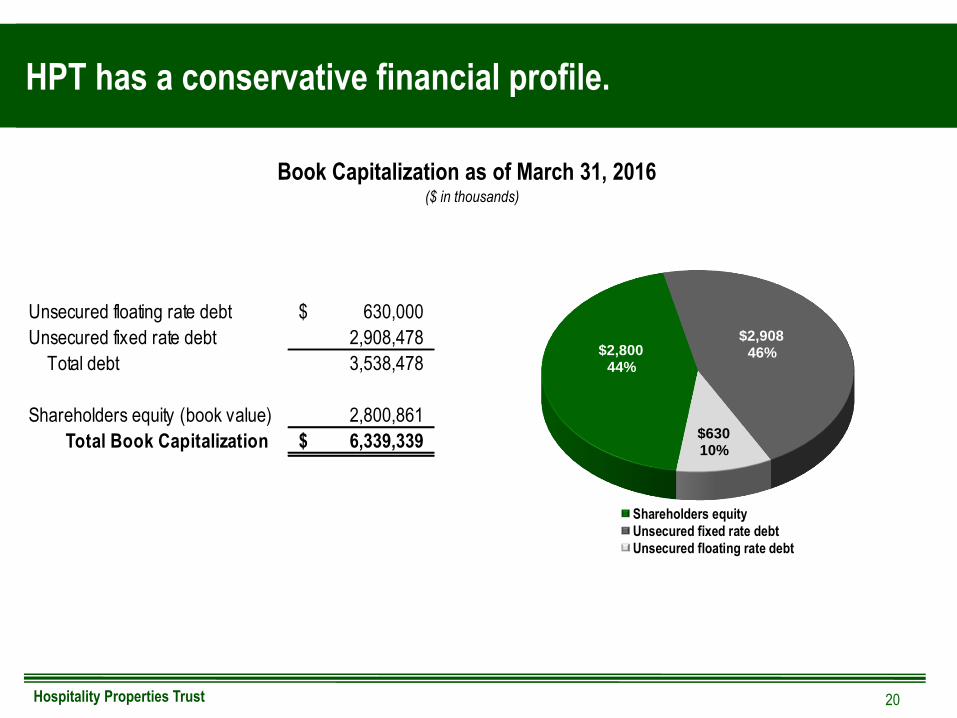
HPT has a conservative financial profile.
20
($ in thousands)
Book Capitalization as of March 31, 2016
Unsecured floating rate debt 630,000$
Unsecured fixed rate debt 2,908,478
Total debt 3,538,478
Shareholders equity (book value) 2,800,861
Total Book Capitalization 6,339,339$
$2,80044%
$2,90846%
$63010%
Shareholders equity
Unsecured fixed rate debt
Unsecured floating rate debt
Hospitality Properties Trust
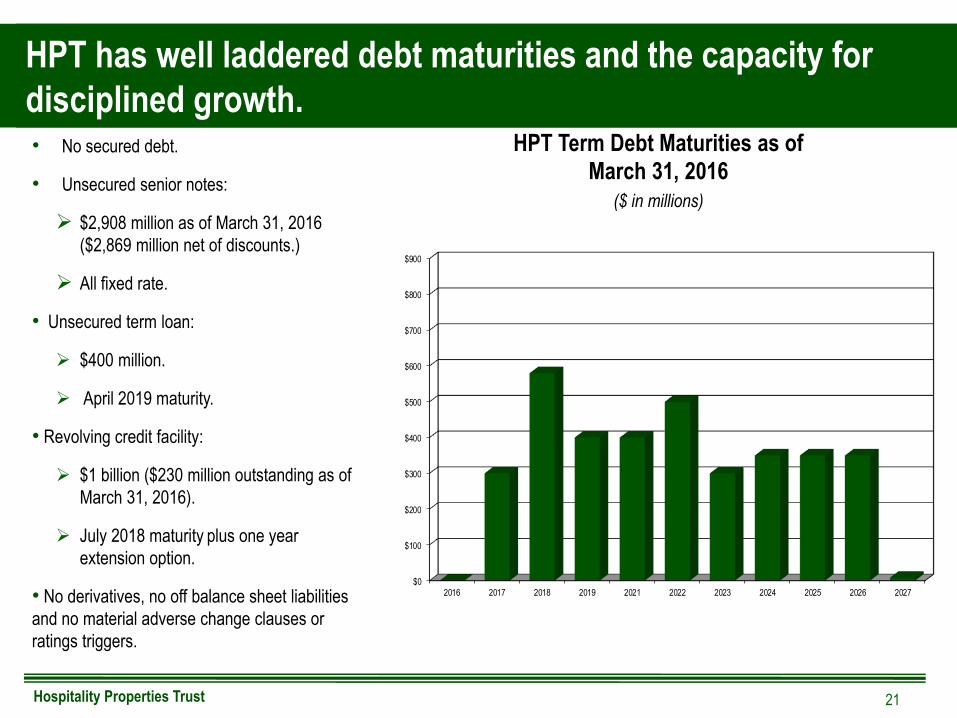
HPT has well laddered debt maturities and the capacity for
disciplined growth.
21
$0
$100
$200
$300
$400
$500
$600
$700
$800
$900
2016 2017 2018 2019 2021 2022 2023 2024 2025 2026 2027
• No secured debt.
• Unsecured senior notes:
$2,908 million as of March 31, 2016
($2,869 million net of discounts.)
All fixed rate.
• Unsecured term loan:
$400 million.
April 2019 maturity.
• Revolving credit facility:
$1 billion ($230 million outstanding as of
March 31, 2016).
July 2018 maturity plus one year
extension option.
• No derivatives, no off balance sheet liabilities
and no material adverse change clauses or
ratings triggers.
HPT Term Debt Maturities as of
March 31, 2016 ($ in millions)
Hospitality Properties Trust
HPT’s high quality properties, conservative profile and secure
cash flows provide a growing and well covered dividend.
22
• Favorable market trends – lodging and travel center industry.
• Diversified portfolio of recently renovated, high quality properties.
• Long term portfolio agreements that can provide security of cash flow.
• Hotel RevPAR growth outperforming the industry.
• Ramping portfolio and external growth opportunities.
• Conservative profile. Capacity to support continued disciplined growth.
Hospitality Properties Trust
Calculation of EBITDA and Adjusted EBITDA.
23
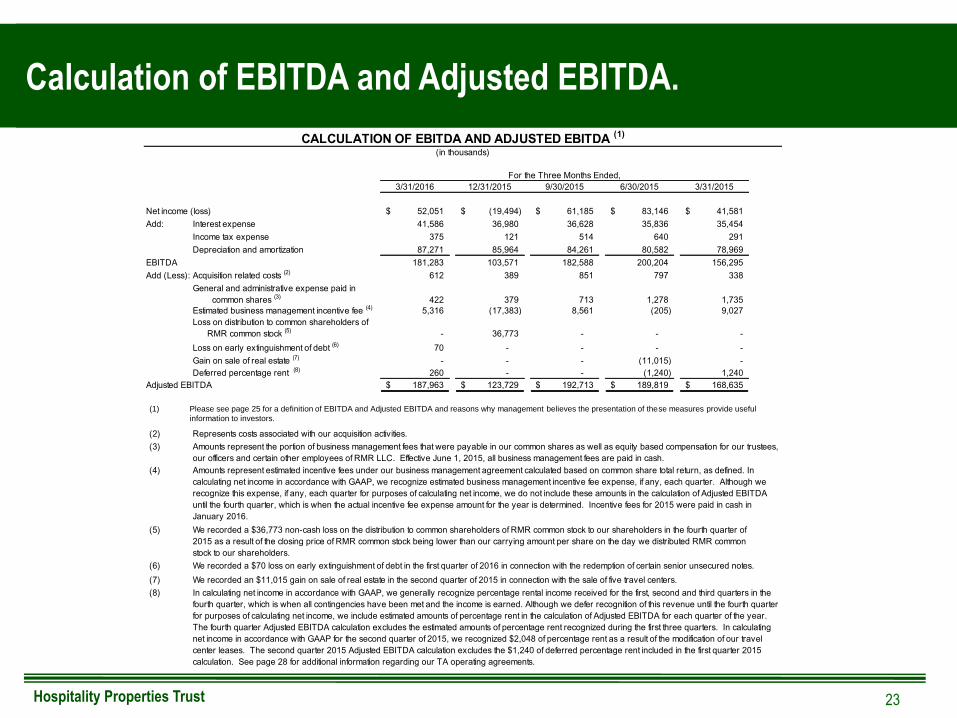
3/31/2016 12/31/2015 9/30/2015 6/30/2015 3/31/2015
Net income (loss) 52,051$ (19,494)$ 61,185$ 83,146$ 41,581$
Add: Interest expense 41,586 36,980 36,628 35,836 35,454
Income tax expense 375 121 514 640 291
Depreciation and amortization 87,271 85,964 84,261 80,582 78,969
EBITDA 181,283 103,571 182,588 200,204 156,295
Add (Less): Acquisition related costs (2) 612 389 851 797 338
General and administrative expense paid in
common shares (3) 422 379 713 1,278 1,735
Estimated business management incentive fee (4) 5,316 (17,383) 8,561 (205) 9,027
Loss on distribution to common shareholders of
RMR common stock (5) - 36,773 - - -
Loss on early extinguishment of debt (6) 70 - - - -
Gain on sale of real estate (7) - - - (11,015) -
Deferred percentage rent (8) 260 - - (1,240) 1,240
Adjusted EBITDA 187,963$ 123,729$ 192,713$ 189,819$ 168,635$
(1)
(2)
(3)
(4)
(5)
(6)
(7)
(8)
We recorded an $11,015 gain on sale of real estate in the second quarter of 2015 in connection with the sale of five travel centers.
Please see page 34 for a definition of EBITDA and Adjusted EBITDA and reasons why management believes the presentation of these measures provide
useful information to investors.
In calculating net income in accordance with GAAP, we generally recognize percentage rental income received for the first, second and third quarters in the
fourth quarter, which is when all contingencies have been met and the income is earned. Although we defer recognition of this revenue until the fourth quarter
for purposes of calculating net income, we include estimated amounts of percentage rent in the calculation of Adjusted EBITDA for each quarter of the year.
The fourth quarter Adjusted EBITDA calculation excludes the estimated amounts of percentage rent recognized during the first three quarters. In calculating
net income in accordance with GAAP for the second quarter of 2015, we recognized $2,048 of percentage rent as a result of the modification of our travel
center leases. The second quarter 2015 Adjusted EBITDA calculation excludes the $1,240 of deferred percentage rent included in the first quarter 2015
calculation. See page 28 for additional information regarding our TA operating agreements.
Amounts represent the portion of business management fees that were payable in our common shares as well as equity based compensation for our trustees,
our officers and certain other employees of RMR LLC. Effective June 1, 2015, all business management fees are paid in cash.
Represents costs associated with our acquisition activities.
Amounts represent estimated incentive fees under our business management agreement calculated based on common share total return, as defined. In
calculating net income in accordance with GAAP, we recognize estimated business management incentive fee expense, if any, each quarter. Although we
recognize this expense, if any, each quarter for purposes of calculating net income, we do not include these amounts in the calculation of Adjusted EBITDA
until the fourth quarter, which is when the actual incentive fee expense amount for the year is determined. Incentive fees for 2015 were paid in cash in
January 2016.
We recorded a $36,773 non-cash loss on the distribution to common shareholders of RMR common stock to our shareholders in the fourth quarter of
2015 as a result of the closing price of RMR common stock being lower than our carrying amount per share on the day we distributed RMR common
stock to our shareholders.
We recorded a $70 loss on early extinguishment of debt in the first quarter of 2016 in connection with the redemption of certain senior unsecured notes.
For the Three Months Ended,
CALCULATION OF EBITDA AND ADJUSTED EBITDA (1)
(in thousands)
(1) Please see page 25 for a definition of EBITDA and Adjusted EBITDA and reasons why management believes the presentation of these measures provide useful
information to investors.
Hospitality Properties Trust
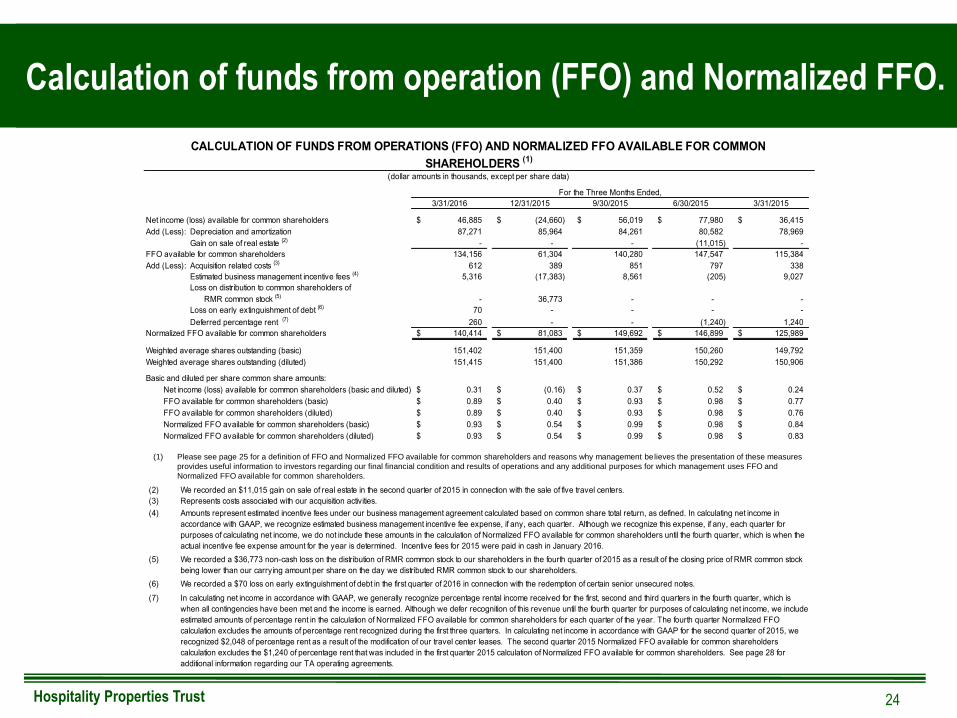
3/31/2016 12/31/2015 9/30/2015 6/30/2015 3/31/2015
Net income (loss) available for common shareholders 46,885$ (24,660)$ 56,019$ 77,980$ 36,415$
Add (Less): Depreciation and amortization 87,271 85,964 84,261 80,582 78,969
Gain on sale of real estate (2) - - - (11,015) -
FFO available for common shareholders 134,156 61,304 140,280 147,547 115,384
Add (Less): Acquisition related costs (3) 612 389 851 797 338
5,316 (17,383) 8,561 (205) 9,027
Loss on distribution to common shareholders of
RMR common stock (5) - 36,773 - - -
70 - - - -
Deferred percentage rent (7) 260 - - (1,240) 1,240
Normalized FFO available for common shareholders 140,414$ 81,083$ 149,692$ 146,899$ 125,989$
Weighted average shares outstanding (basic) 151,402 151,400 151,359 150,260 149,792
Weighted average shares outstanding (diluted) 151,415 151,400 151,386 150,292 150,906
Basic and diluted per share common share amounts:
Net income (loss) available for common shareholders (basic and diluted) 0.31$ (0.16)$ 0.37$ 0.52$ 0.24$
FFO available for common shareholders (basic) 0.89$ 0.40$ 0.93$ 0.98$ 0.77$
FFO available for common shareholders (diluted) 0.89$ 0.40$ 0.93$ 0.98$ 0.76$
Normalized FFO available for common shareholders (basic) 0.93$ 0.54$ 0.99$ 0.98$ 0.84$
Normalized FFO available for common shareholders (diluted) 0.93$ 0.54$ 0.99$ 0.98$ 0.83$
(1)
(2)
(3)
(4)
(5)
(6)
(7)
Loss on early extinguishment of debt (6)
Estimated business management incentive fees (4)
For the Three Months Ended,
Please see page 34 for a definition of FFO and Normalized FFO available for common shareholders and reasons why management believes the presentation of these measures
provides useful information to investors regarding our financial condition and results of operations and any additional purposes for which management uses FFO and Normalized FFO
available for common shareholders.
We recorded an $11,015 gain on sale of real estate in the second quarter of 2015 in connection with the sale of five travel centers.
Represents costs associated with our acquisition activities.
Amounts represent estimated incentive fees under our business management agreement calculated based on common share total return, as defined. In calculating net income in
accordance with GAAP, we recognize estimated business management incentive fee expense, if any, each quarter. Although we recognize this expense, if any, each quarter for
purposes of calculating net income, we do not include these amounts in the calculation of Normalized FFO available for common shareholders until the fourth quarter, which is when the
actual incentive fee expense amount for the year is determined. Incentive fees for 2015 were paid in cash in January 2016.
In calculating net income in accordance with GAAP, we generally recognize percentage rental income received for the first, second and third quarters in the fourth quarter, which is
when all contingencies have been met and the income is earned. Although we defer recognition of this revenue until the fourth quarter for purposes of calculating net income, we include
estimated amounts of percentage rent in the calculation of Normalized FFO available for common shareholders for each quarter of the year. The fourth quarter Normalized FFO
calculation excludes the amounts of percentage rent recognized during the first three quarters. In calculating net income in accordance with GAAP for the second quarter of 2015, we
recognized $2,048 of percentage rent as a result of the modification of our travel center leases. The second quarter 2015 Normalized FFO available for common shareholders
calculation excludes the $1,240 of percentage rent that was included in the first quarter 2015 calculation of Normalized FFO available for common shareholders. See page 28 for
additional information regarding our TA operating agreements.
We recorded a $70 loss on early extinguishment of debt in the first quarter of 2016 in connection with the redemption of certain senior unsecured notes.
We recorded a $36,773 non-cash loss on the distribution of RMR common stock to our shareholders in the fourth quarter of 2015 as a result of the closing price of RMR common stock
being lower than our carrying amount per share on the day we distributed RMR common stock to our shareholders.
CALCULATION OF FUNDS FROM OPERATIONS (FFO) AND NORMALIZED FFO AVAILABLE FOR COMMON
SHAREHOLDERS (1)
(dollar amounts in thousands, except per share data)
Calculation of funds from operation (FFO) and Normalized FFO.
24
(1) Please see page 25 for a definition of FFO and Normalized FFO available for common shareholders and reasons why management believes the presentation of these measures
provides useful information to investors regarding our final financial condition and results of operations and any additional purposes for which management uses FFO and
Normalized FFO available for common shareholders.
Hospitality Properties Trust
Non-GAAP financial measures definitions.
25
Definition of EBITDA
We calculate EBITDA and Adjusted EBITDA as shown in Exhibit A. We consider EBITDA and Adjusted EBITDA to be appropriate measures of our operating performance, along with
net income, net income available for common shareholders, operating income and cash flow from operating activities. We believe that EBITDA and Adjusted EBITDA provide useful
information to investors because by excluding the effects of certain historical amounts, such as interest, depreciation and amortization expense, EBITDA and Adjusted EBITDA may
facilitate a comparison of current operating performance with our past operating performance. EBITDA and Adjusted EBITDA do not represent cash generated by operating activities
in accordance with GAAP and should not be considered an alternative to net income, net income available for common shareholders, operating income or cash flow from operating
activities determined in accordance with GAAP or as an indicator of financial performance or liquidity, nor are these measures necessarily indicative of sufficient cash flow to fund all of
our needs. These measures should be considered in conjunction with net income, net income available for common shareholders, operating income and cash flow from operating
activities as presented in our consolidated statements of income and consolidated statements of cash flows. Other REITs and real estate companies may calculate EBITDA and
Adjusted EBITDA differently than we do.
Definition of FFO and Normalized FFO We calculate FFO available for common shareholders and Normalized FFO available for common shareholders as shown in Exhibit B. FFO available for common shareholders is
calculated on the basis defined by The National Association of Real Estate Investment Trusts, or NAREIT, which is net income available for common shareholders calculated in
accordance with GAAP, excluding any gain or loss on sale of properties and loss on impairment of real estate assets, plus real estate depreciation and amortization, as well as certain
other adjustments currently not applicable to us. Our calculation of Normalized FFO available for common shareholders differs from NAREIT's definition of FFO available for common
shareholders because we include estimated percentage rent in the period to which we estimate that it relates rather than when it is recognized as income in accordance with GAAP,
we include estimated business management incentive fees, if any, only in the fourth quarter versus the quarter when they are recognized as expense in accordance with GAAP and we
exclude acquisition related costs, loss on distribution to common shareholders of RMR common stock and loss on early extinguishment of debt. We consider FFO available for
common shareholders and Normalized FFO available for common shareholders to be appropriate measures of operating performance for a REIT, along with net income, net income
available for common shareholders, operating income and cash flow from operating activities. We believe that FFO available for common shareholders and Normalized FFO available
for common shareholders provide useful information to investors because by excluding the effects of certain historical amounts, such as depreciation expense, FFO available for
common shareholders and Normalized FFO available for common shareholders may facilitate a comparison of our operating performance between periods and with other REITs. FFO
available for common shareholders and Normalized FFO available for common shareholders are among the factors considered by our Board of Trustees when determining the amount
of distributions to shareholders. Other factors include, but are not limited to, requirements to maintain our qualification for taxation as a REIT, limitations in our revolving credit facility
and term loan agreement and public debt covenants, the availability to us of debt and equity capital, our expectation of our future capital requirements and operating performance, and
our expected needs for and availability of cash to pay our obligations. FFO available for common shareholders and Normalized FFO available for common shareholders do not
represent cash generated by operating activities in accordance with GAAP and should not be considered as alternatives to net income, net income available for common shareholders,
operating income or cash flow from operating activities determined in accordance with GAAP or as indicators of our financial performance or liquidity, nor are these measures
necessarily indicative of sufficient cash flow to fund all of our needs. These measures should be considered in conjunction with net income, net income available for common
shareholders, operating income and cash flow from operating activities as presented in our consolidated statements of income and consolidated statements of cash flows. Other
REITs and real estate companies may calculate FFO available for common shareholders and Normalized FFO available for common shareholders differently than we do.

Hospitality Properties Trust 26
Courtyard by Marriott, Camarillo, CA.
Guest Rooms: 130.
Sonesta Resort, Hilton Head, SC
Operator: Sonesta International Hotels Corp.
Guest Rooms: 340

Hospitality Properties Trust Q1 2016 Investor Presentation
Royal Sonesta Hotel New Orleans, New Orleans, LA
Operator: Sonesta International Hotels Corp.
Guest Rooms: 483
Related Documents