Q1 2015 Earnings Presentation May 1, 2015

Welcome message from author
This document is posted to help you gain knowledge. Please leave a comment to let me know what you think about it! Share it to your friends and learn new things together.
Transcript
Q1 2015 Earnings Presentation
May 1, 2015

Safe Harbor Statement
2
Statements made in this presentation that relate to future events or PNM Resources’ (“PNMR”), Public Service Company of New Mexico’s (“PNM”), or Texas‐New Mexico Power Company’s (“TNMP”) (collectively, the “Company”) expectations, projections, estimates, intentions, goals, targets, and strategies are made pursuant to the Private Securities Litigation Reform Act of 1995. Readers are cautioned that all forward‐looking statements are based upon current expectations and estimates. PNMR, PNM, and TNMP assume no obligation to update this information. Because actual results may differ materially from those expressed or implied by these forward‐looking statements, PNMR, PNM, and TNMP caution readers not to place undue reliance on these statements. PNMR's, PNM's, and TNMP's business, financial condition, cash flow, and operating results are influenced by many factors, which are often beyond their control, that can cause actual results to differ from those expressed or implied by the forward‐looking statements. For a discussion of risk factors and other important factors affecting forward‐looking statements, please see the Company’s Form 10‐K and 10‐Q filings with the Securities and Exchange Commission, which factors are specifically incorporated by reference herein.
Non‐GAAP Financial MeasuresFor an explanation of the non‐GAAP financial measures that appear on certain slides in this presentation (ongoing earnings and ongoing earnings per diluted share), as well as a reconciliation to GAAP measures, please refer to the Company’s website as follows: http://www.pnmresources.com/investors/results.cfm.

Opening Remarks & OverviewPat Vincent‐CollawnChairman, President and CEO
Q1 2015 Financial Results and Company Updates
4
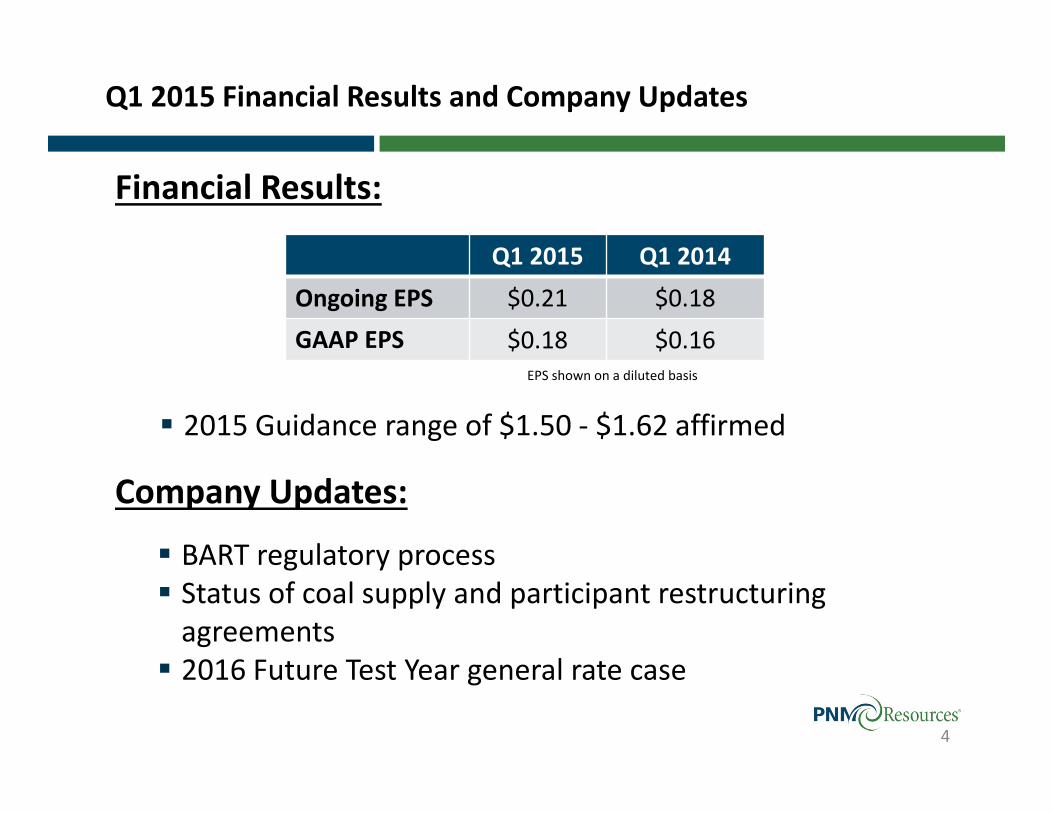
Q1 2015 Q1 2014
Ongoing EPS $0.21 $0.18GAAP EPS $0.18 $0.16
2015 Guidance range of $1.50 ‐ $1.62 affirmed
EPS shown on a diluted basis
Financial Results:
Company Updates:
BART regulatory process Status of coal supply and participant restructuring agreements 2016 Future Test Year general rate case
BART Regulatory Process Update
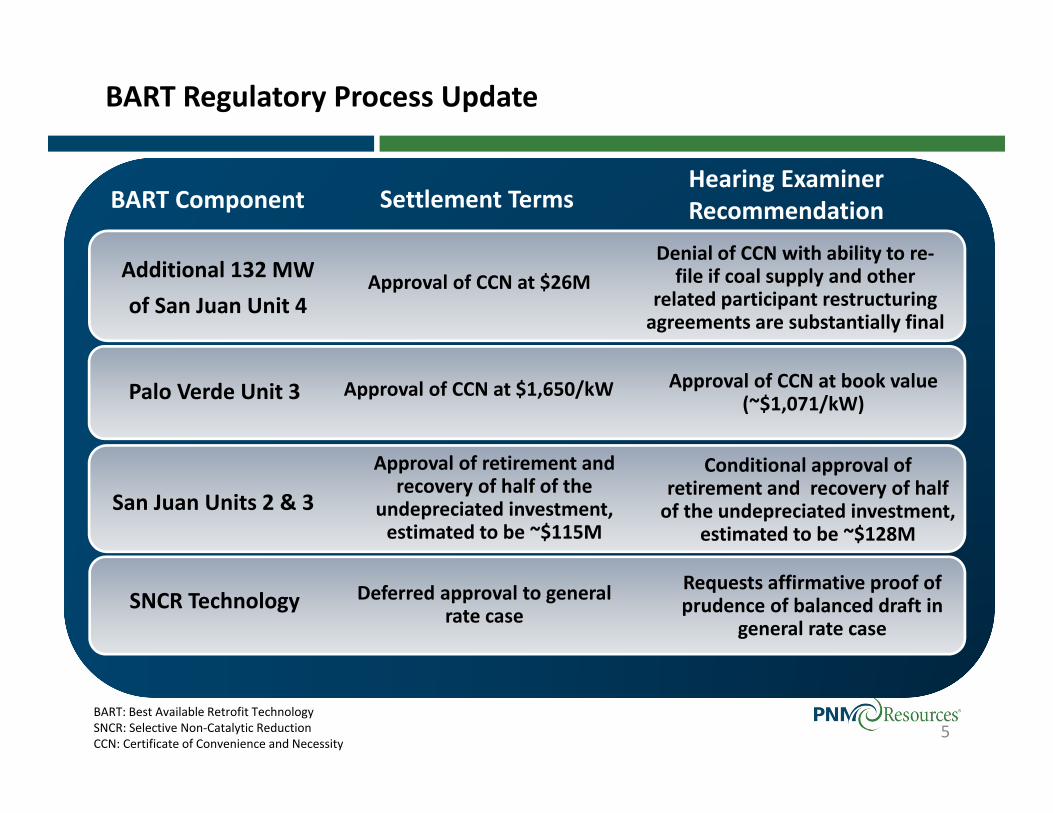
5BART: Best Available Retrofit TechnologySNCR: Selective Non‐Catalytic ReductionCCN: Certificate of Convenience and Necessity
Additional 132 MWof San Juan Unit 4
Denial of CCN with ability to re‐file if coal supply and other
related participant restructuring agreements are substantially final
Approval of CCN at $26M
Palo Verde Unit 3 Approval of CCN at $1,650/kW Approval of CCN at book value (~$1,071/kW)
San Juan Units 2 & 3
Approval of retirement and recovery of half of the
undepreciated investment, estimated to be ~$115M
Conditional approval of retirement and recovery of half of the undepreciated investment,
estimated to be ~$128M
BART Component Settlement TermsHearing Examiner Recommendation
SNCR Technology Deferred approval to general rate case
Requests affirmative proof of prudence of balanced draft in
general rate case
San Juan Agreements Status Update
6
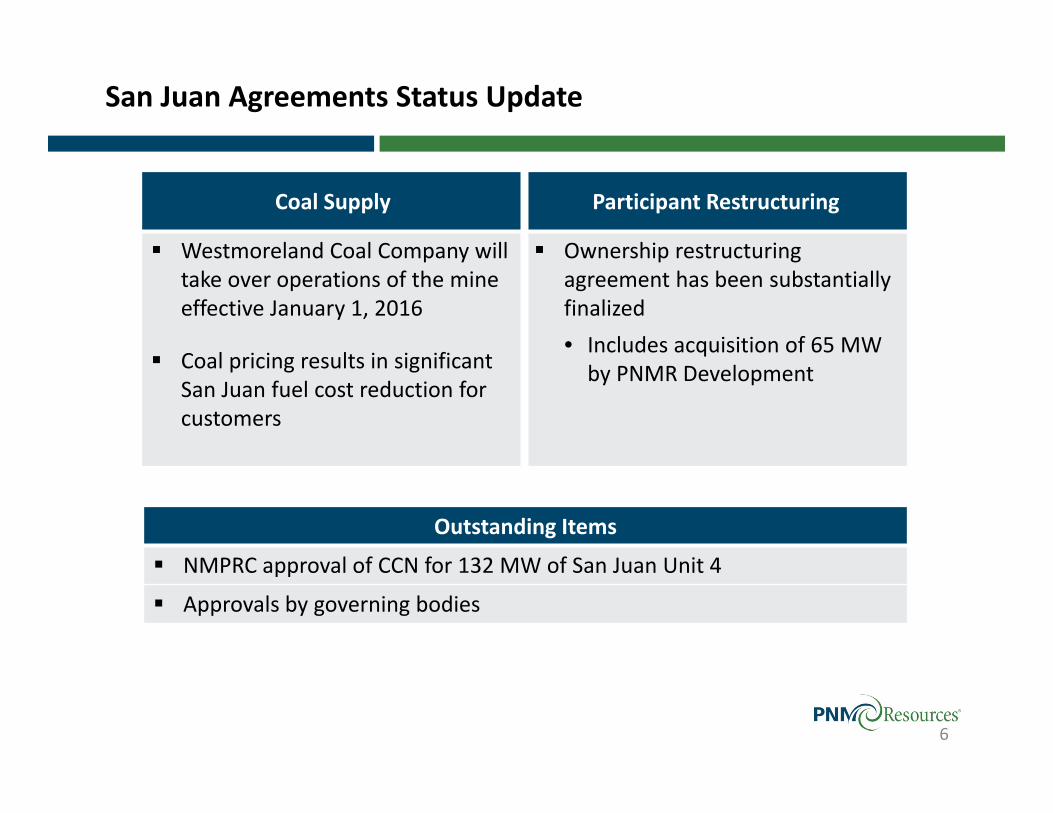
Coal Supply Participant Restructuring
Westmoreland Coal Company will take over operations of the mine effective January 1, 2016
Coal pricing results in significant San Juan fuel cost reduction for customers
Ownership restructuring agreement has been substantially finalized• Includes acquisition of 65 MW by PNMR Development
Outstanding Items
NMPRC approval of CCN for 132 MW of San Juan Unit 4
Approvals by governing bodies

PNM 2016 Future Test Year General Rate Case
7
Current Procedural ScheduleMay 6, 2015 Intervention deadline
June 5, 2015 Staff and Intervenor testimony due
June 29, 2015 Rebuttal testimony due
July 20 – August 7, 2015
Hearings conducted
October 2015 Recommended Decision expected
November 2015 Final Order Expected
2016 Future Test Year General Rate Case Requested revenue increase of $107 million Based on 2016 future test year and 10.5% ROE Reflects $585 million increase in rate base from 2010 filing Includes structural rate design changes, DG Interconnection fee, decoupling mechanism
Hearing Examiner Initial Recommendation
Application for rates should be found incomplete and should be rejected based on:• Procedural defects in the filing (not based on merits of the application) including:• Inappropriate justification of forecasted costs and
• Lack of fully functional electronic files
Allows calendar year 2016 future test year to be kept for the case Recognizes that an alternative to dismissing the application would be to allow PNM to supplement the filing

Regulatory Update
8
Filing Date Filed Timing Docket No.
PNM:BART Filing Filed December 20, 2013 Final approval expected Q2/Q3 2015 13‐00390‐UT
2016 Future Test YearGeneral Rate Case
Filed December 11, 2014 Rates effective dependent upon NMPRC action regarding the Hearing Examiner’s Initial Recommended Decision
14‐00332‐UT
FERC:Transmission Formula Rates
Filed December 31, 2012 Settlement filed March 20, 2015 with rates effective April 1, 2015
ER13‐685‐000 and ER13‐690‐000
TNMP:TNMP TCOS Filed January 16, 2015 Rates effective March 16, 2015 44340

Financial OverviewChuck Eldred
Executive Vice President and CFO

San Juan Generating Station
10
Ownership Restructuring Changes
Unit Owner2018MW
1 PNMTucson Electric Power Company
170170
4 PNMCity of FarmingtonLos Alamos CountyUAMPS (1)PNMR Development Company
3274336.535.565
Total 847(1) Utah Associated Municipal Power Systems
Agreement with Westmoreland Coal Company through 2022 with ability to extend
Significantly improved pricing
Includes mine reclamation and ash disposal
Coal Supply Agreement
Exiting Participants:
Southern California Power Authority
Tri‐State(2)
M‐S‐R Public Power Agency
City of Anaheim(2) Tri‐State Generation and Transmission Association, Inc.

Load and Economic Conditions
11
Regulated Retail Energy Sales (weather‐normalized)
PNM
% of FY 2014 Sales
Q1 2015 vs. Q1 2014
Residential 39% 2.0%
Commercial 47% (4.0%)
Industrial 12% (2.9%)
Total Retail (1.3%)
2015 Load Forecast: (2%) – 0%
TNMP
% of FY 2014 Sales
Q1 2015 vs. Q1 2014
Residential 50% 2.1%
Commercial 46% 1.6%
Total Retail 1.7%
2015 Load Forecast: 2% – 3%
Average Customer Growth
PNM TNMP
Q1 2015 0.7% 1.4%
2015 Forecast 0.5% 1.0%
(1) U.S. Bureau of Labor Statistics, March 2015
6.1%
4.2%5.5%
U.S.TX
Unemployment Rate(1)
NM
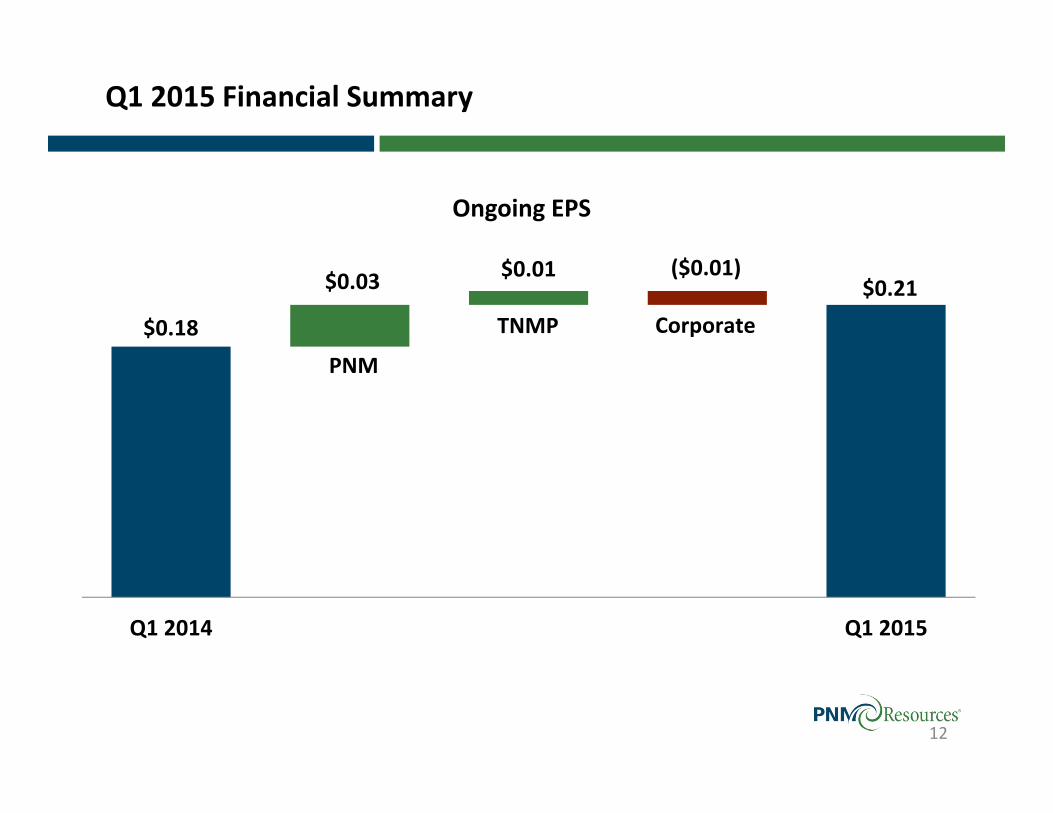
Q1 2015 Financial Summary
12
$0.18
$0.21 $0.03 $0.01 ($0.01)
Q1 2014 Q1 2015
Ongoing EPS
PNM
TNMP Corporate

PNM and TNMP: Q1 2015 vs Q1 2014 EPS (Ongoing)
$0.11$0.14
Q1 2014 Q1 2015
13
$0.09 $0.10
Q1 2014 Q1 2015
PNM
TNMP
Q1 2015 Key Performance Drivers ∆ EPS
Palo Verde Unit 1 leases at half price $0.03
Palo Verde spent fuel reimbursement $0.01
AFUDC $0.01
Refined coal $0.01
Palo Verde Nuclear Decommissioning Trust gains $0.01
Load ($0.01)
Depreciation and property tax ($0.01)
FERC Generation Gallup contract ($0.01)
Other ($0.01)
Q1 2015 Key Performance Drivers ∆ EPS
TCOS rate relief $0.02
Depreciation and property tax ($0.01)

2015 Guidance (Ongoing)
14
2015 Guidance Range:
$1.50 Consolidated EPS $1.62
PNM$1.14 ‐ $1.21
TNMP$0.45 ‐ $0.48
Corp/Other($0.09) – ($0.07)

Questions & Answers

Appendix

2016 Potential Earnings Power
17
(1) The 2016 Future Test Year Rate Case proposes a 10.5% ROE. As this rate case has not yet been approved, the currently authorized 10% ROE has been used for this presentation.
(2) PNM FERC is made up of both Transmission and Wholesale Generation business. Transmission represents about 75% of rate base and is recovered through formula rates.
(3) The potential earnings power assumes a 2016 forward market price of $37/MWh. A price of $43/MWh is required to break even in 2016. (4) Consists primarily of Palo Verde Nuclear Decommissioning Trust gains and losses, AFUDC, refined coal, certain incentive compensation and pension‐related costs
associated with the sale of PNM Gas.(5) TNMP EPS includes $0.02 of CTC, which amortizes to zero in 2020.(6) PNM Resources’ $119 M 9.25% debt matures May 15, 2015.
This table is not intended to represent a forward‐looking projection of 2016 earnings guidance.
Allowed Return /
Equity Ratio
2015 Guidance Mid Point 2016 Earnings Potential
Avg Rate Base Return EPS Avg Rate
Base Growth EPS
PNM Retail (1) 10% / 50% $2.0 B 8.4% $1.02 $2.4 B $0.47 $1.49
PNM Renewables 10% / 50% $105 M 10.0% $0.07 $100 M ($0.01) $0.06
PNM FERC (2) 9‐10% / 50% $235 M 5.5% $0.08 $235 M ($0.01)‐$0.01 $0.07‐$0.09
PV3 (3) ($0.01) ($0.04) ($0.05)
Items not in rates (4) $0.02 ($0.06)‐($0.03) ($0.04)‐($0.01)
Total PNM $2.3 B $1.18 $2.7 B $0.35 ‐ $0.40 $1.53 ‐ $1.58
TNMP (5) 10.125% / 45% $680 M 10.125% $0.46 $750 M ($0.01) $0.45
Corporate/Other(6) ($0.08) $0.00‐$0.02 ($0.08)‐($0.06)
Total PNM Resources $3.0 B $1.56 $3.5 B $0.34 ‐ $0.41 $1.90 ‐ $1.97

2019 Potential Earnings Power
18
(1) The 2016 Future Test Year Rate Case proposes a 10.5% ROE. As this rate case has not yet been approved, the currently authorized 10% ROE has been used for this presentation.
(2) PNM FERC is made up of both Transmission and Wholesale Generation business. Transmission represents about 75% of rate base and is recovered through formula rates.
(3) PV 3 included in PNM rates starting in 2018.(4) Consists primarily of Palo Verde Nuclear Decommissioning Trust gains and losses, AFUDC, refined coal, certain incentive compensation and pension‐related
costs associated with the sale of PNM Gas.(5) TNMP Earnings Potential includes refinancing $172M of 9.5% debt and $0.01 of CTC in 2019.(6) Does not include potential additional 65 MW ownership of San Juan Unit 4 of approximately ($0.02) – ($0.03).
This table is not intended to represent a forward‐looking projection of 2016 or 2019 earnings guidance.
2016 Earnings Potential 2019 Earnings Potential
Avg Rate Base EPS Avg Rate Base Growth EPS
PNM Retail (1) $2.4 B $1.49 $2.6 B $0.11 $1.60
PNM Renewables $100 M $0.06 $85 M ($0.01) $0.05
PNM FERC (2) $235 M $0.07‐$0.09 $270 M $0.01 $0.08‐$0.10
PV3 (3) ($0.05) Included in PNM $0.05 Included in PNM
Items not in rates (4) ($0.04)‐($0.01) $0.03 ($0.01)‐$0.02
Total PNM $2.7 B $1.53 ‐ $1.58 $2.9 B $0.19 $1.72 ‐ $1.77
TNMP (5) $750 M $0.45 $890 M $0.09 $0.54
Corporate/Other ($0.08)‐($0.06) $0.02 ($0.06)‐($0.04)(6)
Total PNM Resources $3.5 B $1.90 ‐ $1.97 $3.8 B $0.30 $2.20 ‐ $2.27

5‐Year Capital Forecast
19
2015 – 2019 Total Capital Plan: $2.2B PNM 2014‐2019 Rate Base CAGR: 5 ‐7%(1)
TNMP 2014‐2019 Rate Base CAGR: 5 ‐7%
(1)Includes the addition of PV3 to rate base, which does not have associated capital spending.(2)Includes the potential additional 65 MW ownership of San Juan Unit 4.Beginning in 2016, depreciation rates reflect the full rate change included in the 2016 future test year general rate case filingAmounts may not add due to rounding
$209
$313 $265
$116 $96
$134
$89
$70
$65 $121
$79
$43
$121 $93
$93
$106
$105
$33
$20
$16
$15
$17
2015 2016 2017 2018 2019
(In millions)
PNM Generation PNM T&D PNM Renewables TNMP Corporate/Other Depreciation
$577
$515
$444
$302
$382
Palo Verde Unit 3
added to rate base
(2)

Weather Impact
20
PNM Q1 2015 Q1 2014 2015 Normal(1)
Heating Degree Days 1,794 1,793 1,962
Cooling Degree Days 0 0 0
EPS Impact compared to normal
($0.01) ($0.01)
TNMP Q1 2015 Q1 2014 2015 Normal(1)
Heating Degree Days 1,190 1,200 856
Cooling Degree Days 52 44 106
EPS Impact compared to normal
$0.01 $0.01
(1) 2015 normal weather assumption reflects the 10‐year average for the period 2004 ‐ 2013.
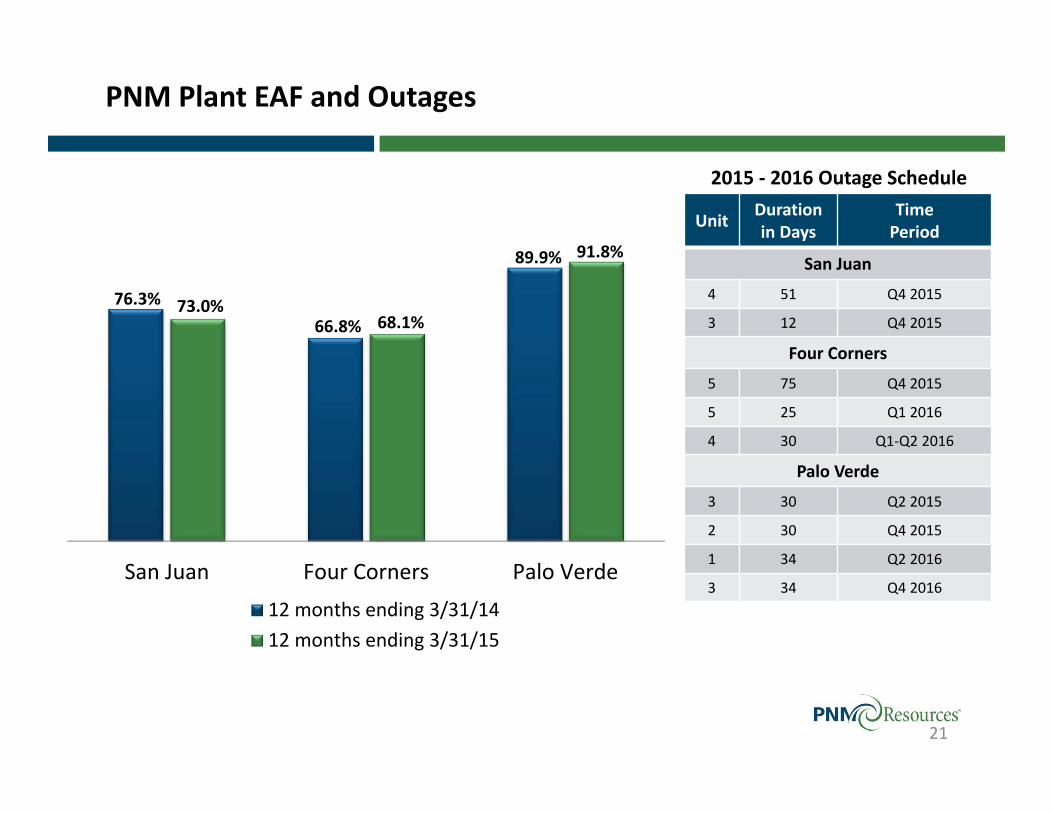
PNM Plant EAF and Outages
21
2015 ‐ 2016 Outage Schedule
76.3%66.8%
89.9%
73.0%68.1%
91.8%
San Juan Four Corners Palo Verde12 months ending 3/31/1412 months ending 3/31/15
Unit Duration in Days
Time Period
San Juan
4 51 Q4 2015
3 12 Q4 2015
Four Corners
5 75 Q4 2015
5 25 Q1 2016
4 30 Q1‐Q2 2016
Palo Verde
3 30 Q2 2015
2 30 Q4 2015
1 34 Q2 2016
3 34 Q4 2016

Balance Sheet and Credit Metrics

Liquidity as of April 24, 2015
23
PNM TNMPCorporate/
Other
PNM Resources
Consolidated
Financing Capacity(1): (In millions)
Revolving credit facilities $450.0 $75.0 $300.0 $825.0
As of 4/24/15:
Short‐term debt and LOC balances $3.2 $0.1 $7.7 $11.0
Remaining availability 446.8 74.9 292.3 814.0
Invested cash ‐ ‐ 87.4 87.4
Available liquidity as of 4/24/15: $446.8 $74.9 $379.7 $901.4
(1) Not included are:PNM’s fully drawn $175M term loan due 9/4/15,PNM’s multi‐draw $125M term loan ($100M drawn as of 4/24/15) due 6/21/16,Corporate/Other’s fully drawn $100M term loan due 12/21/15, and Corporate/Other’s fully drawn $150M term loan due 3/9/18.

Selected Balance Sheet Information
24
(1) Excludes inter‐company debtAmounts may not add due to rounding
(In millions) Dec 31, 2014 Mar 31, 2015
Long‐Term Debt (incl. current portion)
PNM $1,490.7 $1,490.7
TNMP 365.7 365.6
Corporate/Other 118.8 268.8
Consolidated $1,975.1 $2,125.0
Total Debt (incl. short‐term) (1)
PNM $1,490.7 $1,490.7
TNMP 370.7 365.6
Corporate/Other 219.4 368.8
Consolidated $2,080.7 $2,225.0
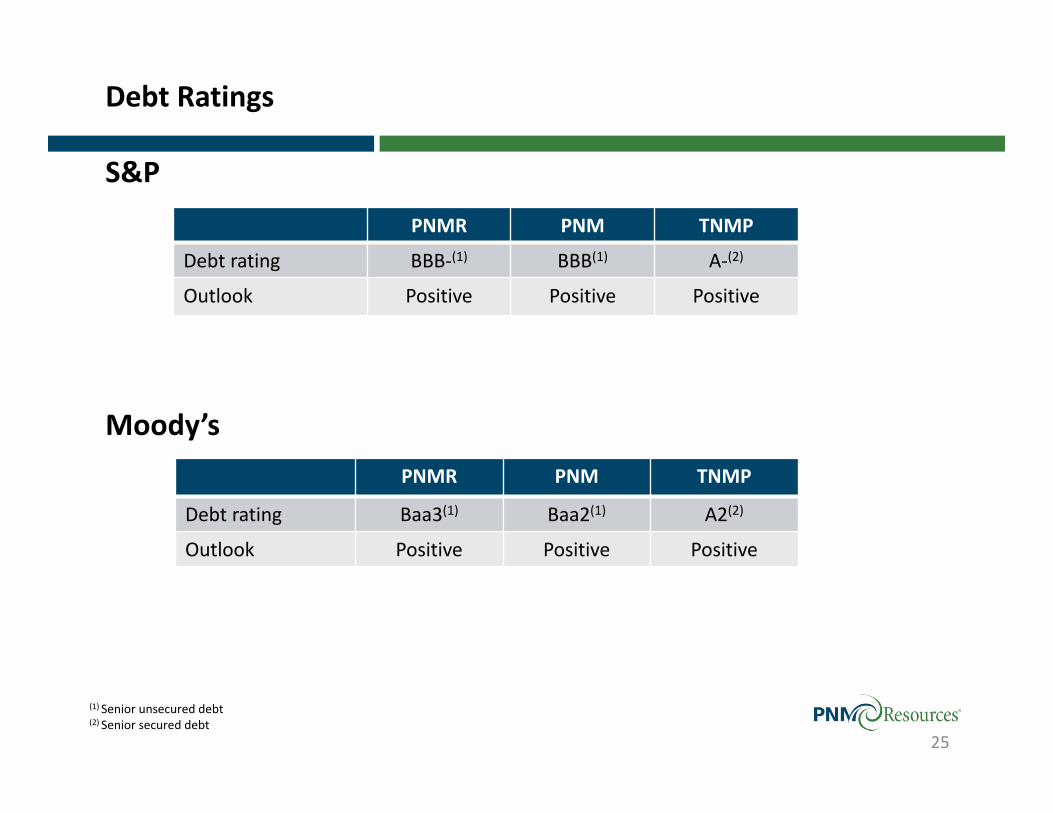
PNMR PNM TNMP
Debt rating Baa3(1) Baa2(1) A2(2)
Outlook Positive Positive Positive
Debt Ratings
S&P
Moody’s
25
PNMR PNM TNMP
Debt rating BBB‐(1) BBB(1) A‐(2)
Outlook Positive Positive Positive
(1) Senior unsecured debt(2) Senior secured debt

Environmental Compliance

Environmental Control Equipment at Coal Units
27
Coal UnitPNM Share Capacity (MW)
Low NOx Burners/
Overfired Air
Activated Carbon
Injection (1)SNCR (2) SCR (2) Baghouse (3) Scrubbers
San Juan Unit 1 170 X X X X X
San Juan Unit 2 170 X X X X
San Juan Unit 3 248 X X X X
San Juan Unit 4 195 X X Expected2016 X X
Four Corners Unit 4 100
Pre‐2000 low NOx burners‐considered outdated
Expected 2018 X X
Four Corners Unit 5 100
Pre‐2000 low NOx burners‐considered outdated
Expected 2018 X X
(1) Activated carbon injection systems reduce mercury emissions. For San Juan, the installation was completed in 2009, as part of a 3‐year, $320M environmental upgrade.(2) SNCR refers to selective non‐catalytic reduction systems. SCR refers to selective catalytic reduction systems. Both systems reduce NOx emissions.(3) Baghouses collect flyash and other particulate matter. For San Juan, the installation was completed in 2009, as part of a 3‐year, $320M environmental upgrade.

Impact of Proposed Environmental Regulation
28
Estimated Compliance Costs(PNM Share) Comments
San Juan Generating Station
Clean Air Act – Regional Haze (StateAlternative) – SNCR $91M(1) SNCR technology on 2 units; Retire 2 units.
Clean Air Act – National Ambient Air Quality Standards (NAAQS)
Included in SNCR and SCR(1)estimates
On November 25, 2014, EPA released a proposed rule that would revise the NAAQS for ground level ozone. The rule would reduce the current primary 8‐hour ozone NAAQS from 75 parts per billion (ppb) to between 70 and 65 ppb. Balanced Draft , which has been included in the Regional
Haze solution, would assist with compliance with NAAQS.
Mercury Rules (MATS) None to minimal Testing shows 99% or greater removal.
Resource Conservation and Recovery Act – Coal Ash Minimal to some exposure
EPA issued the final coal combustion residuals (CCR) rule on December 19, 2014. The rule regulates CCR as a non‐hazardous waste under
Subtitle D of RCRA. This rule does not apply to placement of coal ash in mines – Office of Surface Mining (OSM) is expected to issue its own rule
in 2015 and they will likely follow EPA’s .
Clean Water Act – 316(b) Minimal to some exposure
PNM is performing analyses based upon EPA’s May 19, 2014 ruling on the issue. PNM will work with EPA Region 6 to address 316(b)
requirements in SJGS’ next National Pollutant Discharge Elimination System permit renewal. There is a low expected impact.
Effluent Limitation Guidelines (proposed) Minimal to some exposure PNM has reviewed the proposed rule and continues to assess the impact on SJGS. EPA has until September 30, 2015 to issue final effluent limits.
(1) Includes the impact of 65 MW of Unit 4 capacity from PNMR Development and Management Company
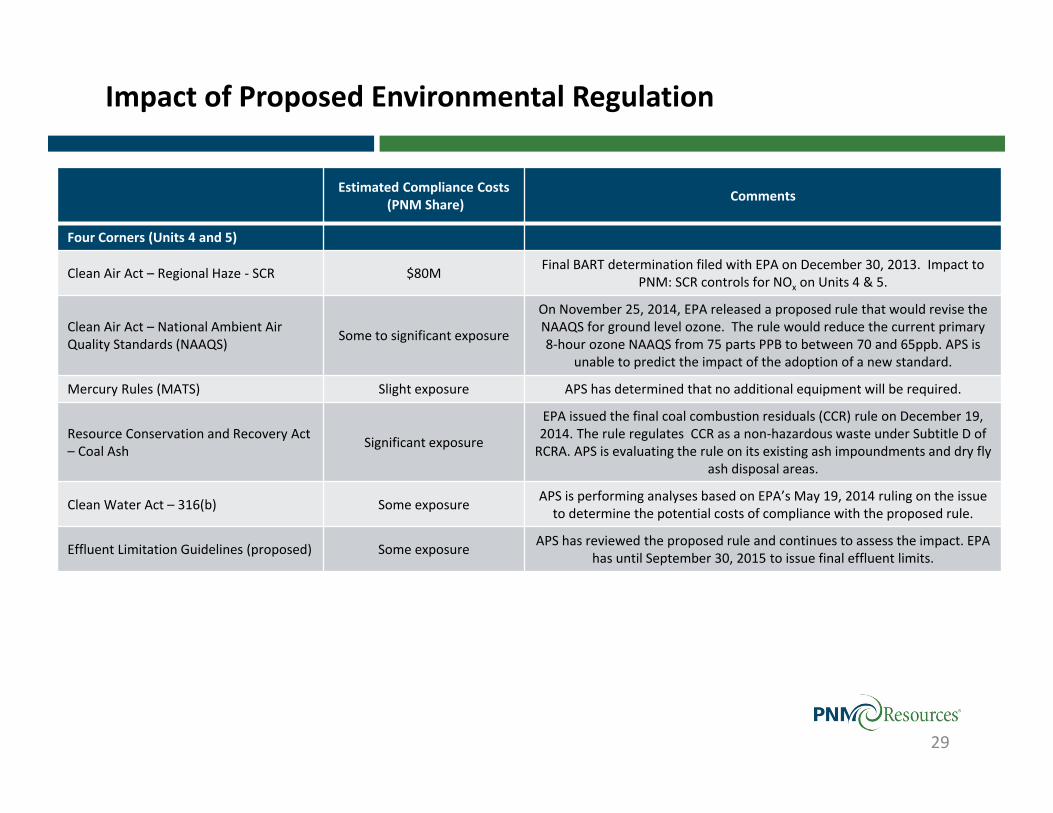
Impact of Proposed Environmental Regulation
29
Estimated Compliance Costs(PNM Share) Comments
Four Corners (Units 4 and 5)
Clean Air Act – Regional Haze ‐ SCR $80M Final BART determination filed with EPA on December 30, 2013. Impact to PNM: SCR controls for NOx on Units 4 & 5.
Clean Air Act – National Ambient Air Quality Standards (NAAQS) Some to significant exposure
On November 25, 2014, EPA released a proposed rule that would revise the NAAQS for ground level ozone. The rule would reduce the current primary 8‐hour ozone NAAQS from 75 parts PPB to between 70 and 65ppb. APS is
unable to predict the impact of the adoption of a new standard.
Mercury Rules (MATS) Slight exposure APS has determined that no additional equipment will be required.
Resource Conservation and Recovery Act – Coal Ash Significant exposure
EPA issued the final coal combustion residuals (CCR) rule on December 19, 2014. The rule regulates CCR as a non‐hazardous waste under Subtitle D of RCRA. APS is evaluating the rule on its existing ash impoundments and dry fly
ash disposal areas.
Clean Water Act – 316(b) Some exposure APS is performing analyses based on EPA’s May 19, 2014 ruling on the issue to determine the potential costs of compliance with the proposed rule.
Effluent Limitation Guidelines (proposed) Some exposure APS has reviewed the proposed rule and continues to assess the impact. EPA has until September 30, 2015 to issue final effluent limits.
Related Documents