Q-TOF LC/MS Screening and Confirming of Non-Targeted Pesticides in a Strawberry Extract Abstract A process for rapid screening and confirming of non-target pesticides is presented using a fruit-extract example. A strawberry extract was rapidly screened for pesticide content using the Molecular Feature Extraction (MFE) algorithm of the Agilent MassHunter software, a 600-pesticide database, and accurate mass spectra using liquid-chromatography, electrospray, quadrupole-time-of-flight mass spectrometry (Q-TOF LC/MS). Accurate masses of the ions detected and identified by MFE were compared to the exact masses of compounds in the pesticide database. Positive com- pounds were then confirmed using the MS/MS (Q-TOF LC/MS) mode. Authors Chin-Kai Meng and Jerry Zweigenbaum Agilent Technologies Inc. 2850 Centerville Road Wilmington, Delaware 19808 USA Peter Fürst and Eva Blanke Chemisches Landes- und Staatliches Veterinäruntersuchungsamt Joseph-König-Straße 40, D-48147 Münster, Germany Application Note Food Safety

Welcome message from author
This document is posted to help you gain knowledge. Please leave a comment to let me know what you think about it! Share it to your friends and learn new things together.
Transcript

Q-TOF LC/MS Screening andConfirming of Non-TargetedPesticides in a Strawberry Extract
Abstract
A process for rapid screening and confirming of non-target pesticides is presented
using a fruit-extract example. A strawberry extract was rapidly screened for pesticide
content using the Molecular Feature Extraction (MFE) algorithm of the Agilent
MassHunter software, a 600-pesticide database, and accurate mass spectra using
liquid-chromatography, electrospray, quadrupole-time-of-flight mass spectrometry
(Q-TOF LC/MS). Accurate masses of the ions detected and identified by MFE were
compared to the exact masses of compounds in the pesticide database. Positive com-
pounds were then confirmed using the MS/MS (Q-TOF LC/MS) mode.
Authors
Chin-Kai Meng and Jerry Zweigenbaum
Agilent Technologies Inc.
2850 Centerville Road
Wilmington, Delaware 19808
USA
Peter Fürst and Eva Blanke
Chemisches Landes- und Staatliches
Veterinäruntersuchungsamt
Joseph-König-Straße 40, D-48147
Münster, Germany
Application Note
Food Safety
2
Introduction
As the food industry has globalized in recent years, govern-
ment regulations to enforce food safety standards have
increased. The United States has more than 1000 registered
pesticides. Of these, approximately 400 have EPA-established
and FDA-enforced tolerance levels in foods. Over 1100 pesti-
cides are monitored in food and animal feed in Europe as a
result of the European Union's strict food pesticide regula-
tions. Over 500 pesticides have established maximum residue
levels (MRLs) in Japan [1]. Consumer concern along with
these types of regulations has led to an increased demand for
data on pesticide levels in foods. This includes both target
pesticides, which the analyst investigates, as well as, nontar-
get pesticides, which the analyst might not anticipate.
LC/MS/MS technology using LC in tandem with a triple
quadrupole mass spectrometer (LC/QQQ) has become the
approach of choice for target analyses of LC-amenable ana-
lytes in food. This highly selective and sensitive methodology
has proven remarkably rugged and rapid for analyzing target-
ed pesticides at trace levels in complex matrices. Now, with
the advent of Q-TOF LC/MS as a complementary form of
LC/MS/MS, rapid screening for non-target pesticides at trace
levels in foods becomes feasible.
LC/QQQ uses the Multiple Reaction Monitoring (MRM)
process to essentially remove chemical background from the
sample matrix. However, LC single and triple quadrupole
instruments cannot readily be used for nontarget identifica-
tions for two reasons. Full scan mode is required to acquire
the full spectra needed to identify unknowns, but in scanning,
the instrument sensitivity is significantly reduced. In this
mode, LC single and triple quadrupole instruments do not
have the selectivity gained by the MRM approach that
focuses on ion transitions. Without good selectivity, charac-
teristic ions of an analyte are sometimes overwhelmed by
chemical noise. Plus, common LC-MS spectral libraries are
unavailable due to difficulties in standardizing and reproduc-
ing fragmentation energies among instruments from different
vendors. In contrast, the Q-TOF LC/MS application acquires
accurate-mass spectra providing superior selectivity while
maintaining high sensitivity.
LC/Q-TOF, first introduced commercially in the mid-nineties, is
similar to LC/QQQ except the third quadrupole is replaced by
an analyzer known for delivering accurate mass, the TOF. This
configuration gives excellent selectivity from high mass reso-
lution and high mass accuracy with full spectra [2, 3, 4]. The
Agilent 6510 Q-TOF LC/MS system used for this work has
demonstrated mass accuracy values of < 2 ppm for small mol-
ecules. With this extraordinary accuracy comes the ability to
distinguish between compounds of very similar molecular
mass. Since the exact or theoretical mass is uniquely deter-
mined by the molecular formula, obtaining accurate experi-
mental masses allows an analyst to quickly narrow a search
to a limited number of possible molecular formulas. In addi-
tion, using the accurate mass and relative abundance of iso-
topes further limits the possible molecular formulas. Unlike
fragmentation patterns, molecular formulas by exact mass are
reliably catalogued in databases and can be easily and quickly
searched using computerized algorithms.
For confirmation of identity, compounds can be further ana-
lyzed using the collision induced dissociation (CID) in Q-TOF
MS/MS mode. Comparison of the structure of the proposed
compound with the fragments obtained can confirm the iden-
tity. Accurate mass data and isotopic distributions for the pre-
cursor and product ions can be compared to spectral data of
reference compounds, if available, obtained under identical
conditions for final confirmation.
Several unique features allow the Agilent 6510 Q-TOF LC/MS
system to achieve the 2 ppm level of mass accuracy. One fea-
ture is automatic internal referencing. The Agilent 6510
adjusts for variation in conditions by using internal reference
standards. In this technique, two compounds of known mass
are introduced continuously in the Q-TOF ion source. The soft-
ware automatically calibrates the mass axis of every spec-
trum.
A second feature includes a shift from a time-to-digital con-
verter (TDC) to analog-to-digital converter (ADC). Older TDC
technology only registers an ion's arrival if its signal is above
a certain intensity and gives the same response whether the
signal is the result of one or many ions. As a result, the TDC
approach cannot maintain mass accuracy over a wide dynam-
ic range. ADC technology creates a continuous digital repre-
sentation of the detector's signal and can provide up to three
decades of dynamic range, thereby allowing components to
be found in the presence of higher-abundance components
[5].
Another benefit of the Agilent 6510 Q-TOF LC/MS system is
temperature stability. The flight tube in this model is con-
structed from a metal alloy with an extremely low coefficient
of thermal expansion. This effectively insulates the system
from temperature fluctuations such that 1 to 2 ppm errors in
mass accuracy can be readily attained [5].
While excellent MS and MS/MS mass-accuracy enables con-
fident, simultaneous screening for thousands of compounds
using confirmatory MS/MS data [6], the quantity and com-
plexity of data produced is significant. Powerful software
tools are needed to efficiently process the data. Agilent's
Molecular Feature Extraction (MFE) algorithm reduces data

3
To confirm the identity, a "Targeted MS/MS" method is devel-
oped for the pesticides that were found in the MFE and data-
base search. In the method, the retention time and precursor
ion for each target are entered. A second injection using the
targeted MS/MS method is made. In the second analysis, the
experimental accurate-mass MS/MS information is used to
calculate formulas with the molecular formula generation
(MFG) tool. This confirmation step compares not only exact
mass and retention times but also fragment patterns and iso-
tope ratios. A diagram depicting this "screen and confirm"
workflow is shown in Figure 1.
Experimental
LC/MS
• Agilent 1200 Series Rapid Resolution LC system with:
• Agilent 1200 Series binary pump SL and degasser
• Agilent 1200 Series high performance autosampler
SL (ALS SL)
• Agilent 1200 Series thermostatted column com-
partment (TCC)
• Agilent 1200 Series diode-array detector SL (DAD
SL) - for method development and troubleshooting
processing time by automatically finding all sample compo-
nents down to the lowest-level abundance and extracting all
relevant spectral and chromatographic information [6, 7]. In
addition, the proprietary, Molecular Formula Generator (MFG)
software provides high-confidence identification of
unknowns, using multiple dimensions of information to gener-
ate and score lists of possible molecular formulas. The MFG
reduces the number of plausible formulas by using the accu-
rate-mass of adduct ions and their isotopes [6].
Screening and Confirming WorkflowThis application note describes a "screen and confirm" work-
flow for the identification of nontargeted pesticides in a
strawberry extract. The process starts with an injection of an
aliquot of the sample extract into the Q-TOF LC/MS. The ana-
lytes from the chromatographic column are ionized and
passed through the first quadrupole and into the TOF without
CID. The resulting data file is cleaned of extraneous back-
ground noise and unrelated ions by the Molecular Feature
Extraction (MFE) tool. The MFE then creates a listing of all
possible components as represented by the full TOF mass
spectral data. An exact mass database is then searched for
hits to identify the pesticides in the data file.
QuEChERSextraction
1. Screen
Backgroundnoise andunrelated ions
MolecularFeatureExtractor(MFE)
Match vs.database ofpesticides
aliquotLC Q-TOF
Full Single MassSpectra Data File
List ofcomponents
Identification ofpesticide
2. Confirm, if necessary
LC
aliquot
Pesticideconfirmed by
formula
Confirmation
MolecularFormulaGenerator(MFG)
Analyst reviewsion fragments toconfirm identity
TargetedMS/MS Data
File
Q-TOF
Figure 1. Screen and Confirm - LC/Q-TOF analysis and software workflow.

4
• Agilent 6510 Accurate-Mass Q-TOF LC/MS
• Column: 2.1 mm × 100 mm, 1.8 µm
ZORBAX Eclipse Plus C18, RRHT, 600 bar (p/n, 959764-902)
QuEChERS Sample Preparation Method QuEChERS is the acronym for the sample preparation method,
which stands for quick, easy, cheap, effective, rugged, and
safe. It is a method that is widely receiving acceptance for
rapid extraction of pesticides in food (8, 9).
Extraction: • Chop samples into small pieces and freeze in a bag
overnight before grinding. Dry ice should be added during
grinding.
• Weigh 10 g of an homogenized sample into a
50-mL Teflon centrifuge tube.
• Add 10 mL of acetonitrile (and ISTD solution, if used).
• Add 4 g of anhydrous magnesium sulphate, 1 g of sodium
chloride, 1 g of trisodium citrate dehydrate, and 0.5 g of
disodium hydrogen citrate sesquihydrate to the tube.
• Adjust the pH to 5-5.5 using 5 N NaOH.
• Shake the sample vigorously for 1 min by using a vortex
mixer at maximum speed or by hand shaking.
• Centrifuge for 5 minutes at 3000 rpm.
Cleanup: • Transfer 6 mL of supernatant into a 12-mL polypropolyene
centrifuge tube which contains 150 mg of primary-secondary
amine (PSA) adsorbent and 900 mg of MgSO4.
• Shake for 30 s.
• Centrifuge for 5 min at 3000 rpm.
• Adjust the pH of the cleaned extract to 5.0 for analysis, if
necessary.
Results and Discussion
A sample of strawberries was extracted with acetonitrile
using the QuEChERS protocol and analyzed as described in
the screening workflow section. The raw TOF (MS1 Mode)
Full Spectrum TIC for the sample is shown in Figure 2. The
TOF data was processed using the Molecular Feature
Extraction (MFE) algorithm of the MassHunter Workstation
software to find likely compounds. This algorithm is designed
to find all ions in the data file that represent real compounds
[7]. Figure 3 shows the molecular feature method editor
menu and specific search criteria for the strawberry extract.
LC (1200) and MS (6510 QTOF) MethodParameters
The HPLC and MS were operated under the following conditions:Flow Rate 0.3 mL/min
Injection Volume 10 µL
Solvent A 0.1% formic acid in water
Solvent B 100% acetonitrile
Gradient Time (min) Solvent B
0 10%
20 95%
25 95%
Ion Source ESI
Drying Gas Temperature 325 °C
Drying Gas Flow 10 L/min
Nebulizer 50 psi
VCap 4000 V
Fragmentor 175 V
Reference Masses 121.050873 and 922.009798
Acquisition Mode MS1
Min Range 100
Max Range 1000
Scan Rate 1
Acquisition Mode Targeted MS/MS
MS Min Range 100 MS/MS Min Range 100
MS Max Range 1000 MS/MS Max Range 1000
MS Scan Rate 1.4 MS/MS Scan Rate 0.7
Max Time Between MS 10
Varied Collision Energy with Mass
Slope 5
Offset 5

Extraction Peak filter: Use peaks with height £ 1000
Ion species Positive Ions: H, Na, K, NH4
Charge state Peak spacing tolerance: 0.0025 m/z, plus 7.0 ppm
Limit assigned charge states to a maximum of 1
Compound filters Relative height £ 0.2 %
Mass filters None
Mass defect Filtering not used
Results Delete previous compounds
Highlight all compounds
5
Figure 2. The raw TOF (MS1 Mode) Full Spectrum TIC for an acetonitrile extract of a sample of strawberries.
Figure 3 . MFE Method Editor Menu and settings for pesticide screening of the strawberry extract.

6
The MFE produced 822 potential compounds. Figure 4 shows
the TIC, the hyperlinked extracted compound chromatogram
(ECC), and the mass spectrum for one of these compounds.
Since ECCs are created when one of the MFE “Find
Compounds” algorithms is run, the ECC consists of all the
related ions and no chemical noise.
The accurate mass of each of these compounds was subse-
quently searched against a working exact mass database of
600 pesticides1. The criteria used in this search are shown in
Figure 5. Twenty-six of the 822 compounds had mass matches
(3 ppm tolerance) with pesticides in the database. Three plau-
sible exact-mass match compounds, cyprodinil, azoxystrobin,
and boscalid were then selected for further confirmation
using MS/MS (Q-TOF) analysis with the same instrument.
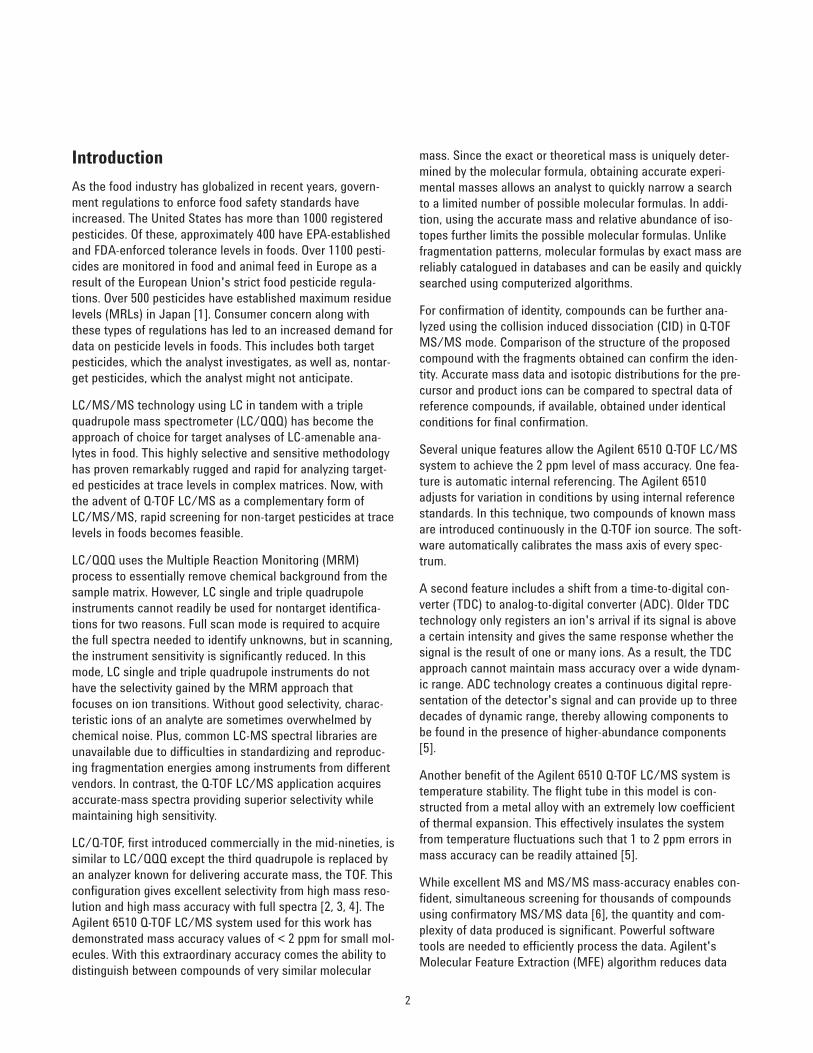
The ECC and mass spectrum for each of the three are provid-
ed in Figure 6 along with the database search results showing
a difference of less than 1 ppm in experimental and database
masses. The precursor ion (M + H)+ masses chosen for the
MS/MS analysis of the strawberry extract were exact masses
from the database: 226.13395, 404.12410, and 343.03995 for
cyprodinil, azoxystrobin, and boscalid, respectively. Criteria for
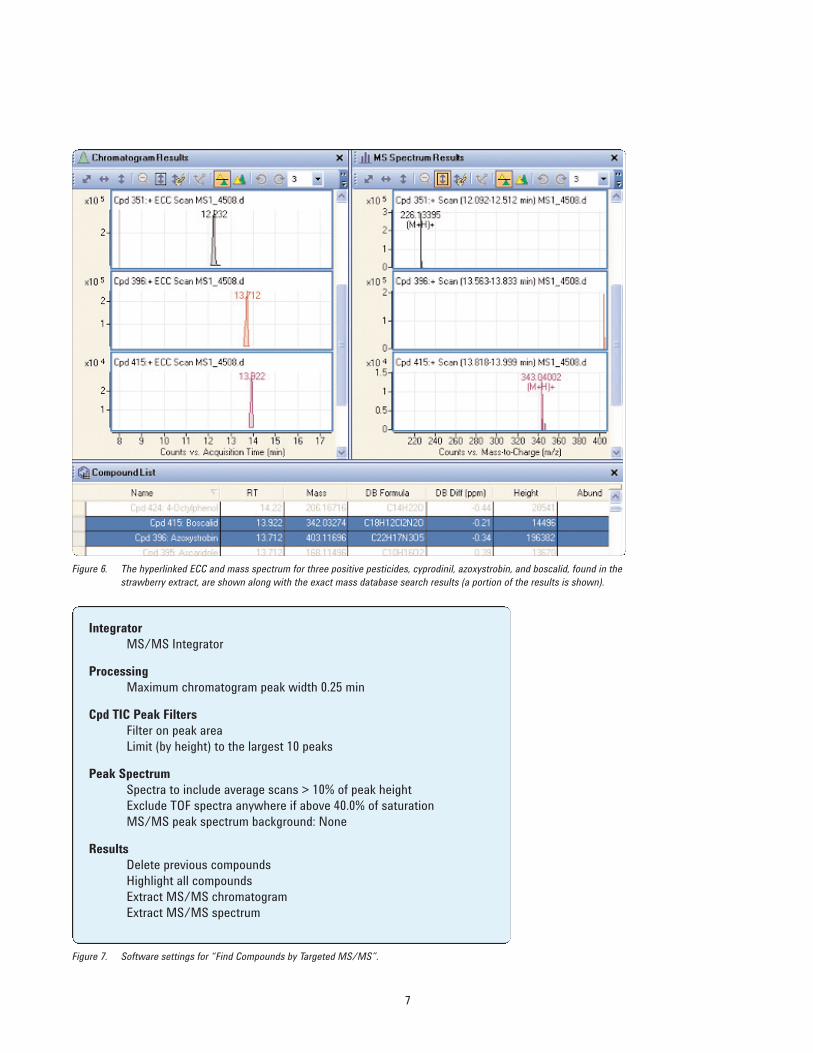
finding compounds in the resulting MS/MS chromatogram
are listed in Figure 7. Using the accurate MS/MS masses for
the fragment ions, formulas were generated for each com-
pound found in this step.
Figure 4. The ECC and mass spectrum are shown for one of 822 compounds found using the MFE software along with the TIC.
Search criteria Match Mass only with 3.00 ppm tolerance
Database Your Exact Mass compound database
Peak limits 10
Positive Ions H, Na, K, NH4
Charge state range 1-2
No neutral losses
Search results Limit to the best 5 hits
Figure 5. Exact mass database search menu and settings.
1 A 1600-compound Mass Hunter Personal Pesticide Database (G6854AA) is available for Exact Mass Searching.
7
Figure 6. The hyperlinked ECC and mass spectrum for three positive pesticides, cyprodinil, azoxystrobin, and boscalid, found in the
strawberry extract, are shown along with the exact mass database search results (a portion of the results is shown).
IntegratorMS/MS Integrator
ProcessingMaximum chromatogram peak width 0.25 min
Cpd TIC Peak FiltersFilter on peak area
Limit (by height) to the largest 10 peaks
Peak SpectrumSpectra to include average scans > 10% of peak height
Exclude TOF spectra anywhere if above 40.0% of saturation
MS/MS peak spectrum background: None
ResultsDelete previous compounds
Highlight all compounds
Extract MS/MS chromatogram
Extract MS/MS spectrum
Figure 7. Software settings for “Find Compounds by Targeted MS/MS”.

8
The confirmation process for azoxystrobin will be further dis-
cussed as an example. In Figure 8, the best-fit (with mass
accuracy of 0.26 ppm and isotopes) formula generated from
the Targeted MS/MS analysis for one of the compounds was
C22H17N3O5, the formula for azoxystrobin. The two associated
fragment masses for this peak had less than 1 ppm difference
in mass (0.31 and 0.2 ppm) when compared to the database
masses for fragments expected from the C22H17N3O5 parent
formula. In addition, the three isotope masses for the molecu-
lar ion all differed by less than 1 ppm. The table outlined in
Figure 8 shows that the experimental isotope abundances of
the three isotopes match well with the calculated (theoreti-
cal) abundances. The boxes in Figure 9 surrounding the iso-
topes represent the theoretical isotope abundances.
Final confirmation of the structure is obtained by comparing
the experimental fragment masses to likely theoretical frag-
ment ion masses. Analysis of the structural formula, as seen
in Figure 10, shows two likely fragments, with masses of
344.10351 and 372.09843 that match closely in mass to the
Figure 8. Results from the formula analysis of MS and MS/MS data of a compound (azoxystrobin) in the strawberry
extract.

9
two fragment ions found in the MS/MS data: 344.10286 and
372.09781 amu. The difference between experimental and cal-
culated is 0.31 and 0.20 ppm, respectively. The accuracy of
this comparison, along with the MS data identification and
MS/MS formula generation results all strongly suggest the
presence of azoxystrobin in the analyzed strawberry extract.
Conclusion
This application note demonstrates that the high degree of
mass accuracy (and selectivity) now available in combination
with powerful database searching tools can be used to suc-
cessfully identify nontargeted pesticides in food. The mea-
sured mass is used to generate a few potential molecular for-
mulas and thereby frees the analyst from labor-intensive man-
ual comparison of fragmentation patterns. These formulas,
when combined with one or two fragment ions of accurate
mass, can be used to quickly and confidently identify nontar-
geted pesticides in food samples.
Figure 9. The experimental isotope abundances of the three isotopes match well with the theoretical abundances (outlined in boxes).
O
O
O
NN
O
N
OH3C CH3
344.10351
372.09843
Figure 10. Structural analysis for Azoxystrobin fragments.
www.agilent.com/chem
Agilent shall not be liable for errors contained herein or
for incidental or consequential damages in connection
with the furnishing, performance, or use of this material.
Information, descriptions, and specifications in this
publication are subject to change without notice.
© Agilent Technologies, Inc., 2009
Printed in the USA
May 5, 2009
5990-3935EN
References
1. P. Wylie, J. Zweigenbaum, M. Churley, C.-K. Meng, and C. Zhe, "Comprehensive
Screening, Confirmation, and Quantification of Organic Pesticides in Foods by
GC-MS and LC-MS," (2008) Current Trends in Mass Spectrometry, November.
2 I. V. Chernushevich, A. V. Loboda, and B. A.Thomson, "An Introduction to
Quadrupole-Time-of-Flight Mass Spectrometry," (2001) J. Mass Spectrom.
36: 849-865.
3. H. R. Morris, T. Paxton, A. Dell, J. Langhorne, M. Berg, R. S. Bordoli, J. Hoyes,
and R. H. Bateman, "High Sensitivity Collisionally-activated Decomposition
Tandem Mass Spectrometry on a Novel Quadrupole/Orthogonal-acceleration
Time-of-flight Mass Spectrometer," (1996) Rapid Commun. Mass Spectrom.
10: 889.
4. A.A. Shevchenko, I.V. Chernushevich, W. Ens, K.G.Standing, B, Thomson,
M.Wilm, and M. Mann, "Rapid ‘de novo’ peptide sequencing by a combination
of nanoelectrospray, isotopic labeling and a quadrupole/time-of-flight mass
spectrometer," (1997) Rapid Commun. Mass Spectrom. 11: 1015.
5. K. Imatani, "Advances in Accurate-Mass TOF and Q-TOF LC-MS Systems,"
(2008) American Laboratory, 40:12-16.
6. "Achieving Unmatched Speed and Confidence for Complex Sample Analyses:
Agilent True High-Definition TOF Technology," Agilent Technologies, publication
5990-3168EN.
7 E. M. Thurman, I. Ferrer, and J. A. Zweigenbaum, "Automated Screening of 600
Pesticides in Food by LC/TOF MS Using a Molecular-Feature Database Search,"
Agilent Technologies, publication 5989-5496EN.
8. M. Anastassiades, S. J. Lehotay, D. Stajnbaher, and F. J. Schenck, "Fast and
Easy Multiresidue Method Employing Acetonitrile Extraction/Partitioning and
"Dispersive Solid-Phase Extraction" for the Determination of Pesticide Residues
in Produce," (2003) Journal of AOAC International, 86:412-431.
9. S. J. Lehotay, K. Maštovská, and A. R. Lightfield, "Use of Buffering and Other
Means to Improve Results of Problematic Pesticides in a Fast and Easy Method
for Residue Analysis of Fruits and Vegetables," (2005) Journal of AOAC
International, 88:615-629.
For More Information
For more information on our products and services, visit our Web site at
www.agilent.com/chem.
Related Documents