Pyrolysis kinetics of algal consortia grown using swine manure wastewater Mahmoud A. Sharara, Nathan Holeman, Sammy S. Sadaka ⇑ , Thomas A. Costello Biological and Agricultural Engineering Department, University of Arkansas – Division of Agriculture, AR, USA highlights Characterization of algae grown using swine manure slurry in different seasons. Determination of pyrolysis TG–DTG characteristics under different heating rates. Determination of apparent activation energies using isoconversional methods. Modeling algae consortia pyrolysis as four independent parallel reactions. article info Article history: Received 2 June 2014 Received in revised form 28 June 2014 Accepted 30 June 2014 Available online 16 July 2014 Keywords: Microalgae Phycoremediation Pyrolysis TGA Kinetic modeling abstract In this study, pyrolysis kinetics of periphytic microalgae consortia grown using swine manure slurry in two seasonal climatic patterns in northwest Arkansas were investigated. Four heating rates (5, 10, 20 and 40 °C min 1 ) were used to determine the pyrolysis kinetics. Differences in proximate, ultimate, and heating value analyses reflected variability in growing substrate conditions, i.e., flocculant use, manure slurry dilution, and differences in diurnal solar radiation and air temperature regimes. Peak decomposition temperature in algal harvests varied with changing the heating rate. Analyzing pyrolysis kinetics using differential and integral isoconversional methods (Friedman, Flynn–Wall–Ozawa, and Kissinger–Akahira–Sunose) showed strong dependency of apparent activation energy on the degree of conversion suggesting parallel reaction scheme. Consequently, the weight loss data in each thermogravi- metric test was modeled using independent parallel reactions (IPR). The quality of fit (QOF) for the model ranged between 2.09% and 3.31% indicating a good agreement with the experimental data. Ó 2014 Elsevier Ltd. All rights reserved. 1. Introduction Thermogravimetry is a powerful and versatile tool in under- standing and modeling biomass reactions. It is also a quick and reliable approach to determine the moisture, organic matter, and ash contents in biomass (García et al., 2013). Other uses of thermo- gravimetric analysis (TGA) include quantification of the hemicellu- lose and a-cellulose contents in wood (Carrier et al., 2011), as well as evaluation of digestate stability during anaerobic digestion (Gómez et al., 2007). The predominant use of TGA, however, is to determine the rate of thermal decomposition for various feed- stocks. A survey of the literature shows the importance of this analysis to the determination of decomposition kinetics of woody biomass (Gomez et al., 2005), crop residue (Mani et al., 2010), animal manures (Sharara and Sadaka, 2014), and municipal solid waste (Sanchez et al., 2009). However, the recent interest in aquatic biomass, as a biofuel and bioenergy crop, brought to light the dearth of thermogravimetric studies on this class of biomass. Historically, microalgae mass-production was mostly accom- plished to support aquaculture systems (Muller-Feuga, 2000) as well as to extract important bioactive compounds (Skulberg, 2004). Recently, however, interest in sustainable biofuel sources brought attention to microalgae due to the high lipid content in certain species, which can be converted via ‘‘transesterification’’ to biodiesel. The oil content in microalgae species such as Schizo- chytrium sp. can exceed 75% on a dry-weight basis (Demirbas and Fatih Demirbas, 2011). A vital ecological service that microal- gae could provide is treatment of nutrient-rich wastewater efflu- ents, i.e., phycoremediation. This particular service is becoming increasingly crucial with the increase in global urbanization, indus- trialization, and intensive cropping activities (Heathwaite, 2010). Contamination of surface and ground water with nitrogen (N), phosphorous (P), polycyclic aromatic hydrocarbons (PAH), and http://dx.doi.org/10.1016/j.biortech.2014.06.111 0960-8524/Ó 2014 Elsevier Ltd. All rights reserved. ⇑ Corresponding author. Tel.: +1 501 671 2298; fax: +1 501 671 2303. E-mail address: [email protected] (S.S. Sadaka). Bioresource Technology 169 (2014) 658–666 Contents lists available at ScienceDirect Bioresource Technology journal homepage: www.elsevier.com/locate/biortech

Welcome message from author
This document is posted to help you gain knowledge. Please leave a comment to let me know what you think about it! Share it to your friends and learn new things together.
Transcript
Bioresource Technology 169 (2014) 658–666
Contents lists available at ScienceDirect
Bioresource Technology
journal homepage: www.elsevier .com/locate /bior tech
Pyrolysis kinetics of algal consortia grown using swine manurewastewater
http://dx.doi.org/10.1016/j.biortech.2014.06.1110960-8524/� 2014 Elsevier Ltd. All rights reserved.
⇑ Corresponding author. Tel.: +1 501 671 2298; fax: +1 501 671 2303.E-mail address: [email protected] (S.S. Sadaka).
Mahmoud A. Sharara, Nathan Holeman, Sammy S. Sadaka ⇑, Thomas A. CostelloBiological and Agricultural Engineering Department, University of Arkansas – Division of Agriculture, AR, USA
h i g h l i g h t s
� Characterization of algae grown using swine manure slurry in different seasons.� Determination of pyrolysis TG–DTG characteristics under different heating rates.� Determination of apparent activation energies using isoconversional methods.� Modeling algae consortia pyrolysis as four independent parallel reactions.
a r t i c l e i n f o
Article history:Received 2 June 2014Received in revised form 28 June 2014Accepted 30 June 2014Available online 16 July 2014
Keywords:MicroalgaePhycoremediationPyrolysisTGAKinetic modeling
a b s t r a c t
In this study, pyrolysis kinetics of periphytic microalgae consortia grown using swine manure slurry intwo seasonal climatic patterns in northwest Arkansas were investigated. Four heating rates (5, 10, 20and 40 �C min�1) were used to determine the pyrolysis kinetics. Differences in proximate, ultimate,and heating value analyses reflected variability in growing substrate conditions, i.e., flocculant use,manure slurry dilution, and differences in diurnal solar radiation and air temperature regimes. Peakdecomposition temperature in algal harvests varied with changing the heating rate. Analyzing pyrolysiskinetics using differential and integral isoconversional methods (Friedman, Flynn–Wall–Ozawa, andKissinger–Akahira–Sunose) showed strong dependency of apparent activation energy on the degree ofconversion suggesting parallel reaction scheme. Consequently, the weight loss data in each thermogravi-metric test was modeled using independent parallel reactions (IPR). The quality of fit (QOF) for the modelranged between 2.09% and 3.31% indicating a good agreement with the experimental data.
� 2014 Elsevier Ltd. All rights reserved.
1. Introduction
Thermogravimetry is a powerful and versatile tool in under-standing and modeling biomass reactions. It is also a quick andreliable approach to determine the moisture, organic matter, andash contents in biomass (García et al., 2013). Other uses of thermo-gravimetric analysis (TGA) include quantification of the hemicellu-lose and a-cellulose contents in wood (Carrier et al., 2011), as wellas evaluation of digestate stability during anaerobic digestion(Gómez et al., 2007). The predominant use of TGA, however, is todetermine the rate of thermal decomposition for various feed-stocks. A survey of the literature shows the importance of thisanalysis to the determination of decomposition kinetics of woodybiomass (Gomez et al., 2005), crop residue (Mani et al., 2010),animal manures (Sharara and Sadaka, 2014), and municipal solid
waste (Sanchez et al., 2009). However, the recent interest inaquatic biomass, as a biofuel and bioenergy crop, brought to lightthe dearth of thermogravimetric studies on this class of biomass.
Historically, microalgae mass-production was mostly accom-plished to support aquaculture systems (Muller-Feuga, 2000) aswell as to extract important bioactive compounds (Skulberg,2004). Recently, however, interest in sustainable biofuel sourcesbrought attention to microalgae due to the high lipid content incertain species, which can be converted via ‘‘transesterification’’to biodiesel. The oil content in microalgae species such as Schizo-chytrium sp. can exceed 75% on a dry-weight basis (Demirbasand Fatih Demirbas, 2011). A vital ecological service that microal-gae could provide is treatment of nutrient-rich wastewater efflu-ents, i.e., phycoremediation. This particular service is becomingincreasingly crucial with the increase in global urbanization, indus-trialization, and intensive cropping activities (Heathwaite, 2010).
Contamination of surface and ground water with nitrogen (N),phosphorous (P), polycyclic aromatic hydrocarbons (PAH), and
M.A. Sharara et al. / Bioresource Technology 169 (2014) 658–666 659
heavy metals is the primary cause behind hypoxic conditions,eutrophication, and the collapse of aquatic habitats in rivers andlakes (Conley et al., 2009). Uptake and biosorption of these con-taminants by algal species has been investigated on a variety ofwastewater substrates, i.e., municipal, industrial, and agriculturalwastewater streams (Pittman et al., 2011). Adopting phycoremedi-ation in livestock wastewater management can offer anadded-advantage by minimizing phosphorus loss. Algal specieswere successfully grown on raw swine manure effluents,9 g m�2 day�1, but were found to be sensitive to the loading ratesof N and P (Kebede-Westhead et al., 2006).
The harvested phycoremediation algae can be directed to a vari-ety of uses such as composting, anaerobic digestion, and the extrac-tion of lipids and sugars for biodiesel and ethanol production.Alternatively, the algal biomass can be utilized through thermo-chemical conversion processes. The end-use for a specific algae har-vest is highly dependent on its composition. Algae used in waterremediation are typically indigenous species grown in open systemsthat results in a diverse species consortium in the collected biomass.Thermogravimetric analyses can assist in the effort to characterizethe harvested microalgae and to direct them to the optimal end-uses. For instance, TGA decomposition rate curves were proveneffective in detecting and quantifying the lipid contents in Chlorellasp. (Na et al., 2011). Understanding the decomposition kinetics ofmicroalgae in various atmospheres, in addition to providing insightinto the proximate composition, is essential to the design and opti-mization of thermochemical conversion processes. There is a need inresearch for studies covering the thermal decomposition kinetics ofmixed algae consortia grown for water remediation purposes, espe-cially as part of sustainable livestock production scenarios. The goalof this research is to study the thermal decomposition of indigenousperiphytic microalgae grown in an open water-remediation systemfor a swine production facility under nitrogen environment usingthermogravimetric analysis (TGA).
2. Methods
2.1. Swine wastewater treatment system
Algal biomass was produced using open channel raceways linedwith a growth medium for periphyton attachment and irrigated bycirculation of swine-manure based wastewater. Algae consortiaproduced using two systems were investigated in this study. Sys-tem 1 was a small system with 8 raceways that were each 15 cmwide by 3.0 m long. It was sited outdoors adjacent to the Universityof Arkansas Biological and Agricultural Engineering Research Lab,Fayetteville, Arkansas. System 2 was a larger pilot system with 4raceways that were each 1.5 m wide by 61 m long. It was con-structed at the University of Arkansas Swine Research GrowerFacility, near Savoy Arkansas. The raceways in both systems werelined with specialty fibrous carpeting (proprietary fiber selectionand layout intended to optimize periphyton growth, provided byInterface, Inc.) to maximize algae attachment during water circula-tion. System 1 was operated during the summer of 2013 (June–July) on swine manure slurries at different degrees of dilution tovary targeted starting ammonia (NH3) concentrations between 5and 40 mg L�1 (mg = 10�6 kg). Details of the NH3 loading influencewill be discussed in a separate publication. System 1 was seededwith mixed consortia which were collected from a local streamin Fayetteville, AR whereas System 2 was seeded from the mixedconsortia harvested from System 1. Wastewater used in System 2was pumped from swine slurry storage lagoon, then treated withalum (aluminum sulfate 14-hydrate granules, Al2(SO4)3�14H2O,addition rate 2 g L�1) to flocculate solids. After a 24 h settlingperiod, the undiluted supernatant was removed for circulation in
the raceway. System 2 was operated during the fall of 2013(November–December). Both systems were open during produc-tion without any control over the growing algal species.
2.2. Algae collection and preparation methods
Harvest of algae was accomplished manually, in 5-day cycles,using a rubber-bladed squeegee for removal and collection ofattached algae. Harvested algae were dried immediately or elsestored at 4 �C for 24 h before drying. Subsamples of fresh algaewere stored for analysis and species identification. One compositesample was collected from each algae consortium for the thermo-gravimetric analysis (TGA). Composite algae samples were dried at105 �C for 24 h before grinding to 1 mm (Thomas Wiley� cuttingmill-Model 3383L10, Swedesboro, NJ). A second grinding step,using a cutting mill (Polymix PX-MFC 90 D, Kinematica AG,Switzerland), was added to homogenize the dried samples andminimize mass transport resistance during thermogravimetricanalysis. The algal solids used in the following tests and analysesall passed through a 200 lm sieve (lm = 10�6 m).
2.3. Proximate, ultimate, heating value and pH analyses
The remaining moisture was determined, in triplet samples, asthe weight loss after drying at 105 �C, ASTM E871 – 82 (2006).Standard methods were also used to determine the volatile matter,ASTM E872 – 82 (2006), and ash content, ASTM D2974 – 87 (2007),while the fixed carbon (%) was determined by difference. Completeelemental analyses of representative samples from each algaeharvest were performed in a specialized diagnostic laboratory(Huffman laboratories, Golden, CO, USA). The heating values weredetermined on sample triplets, according to standard ASTM D5865– 12 (2012), using bomb calorimetry (Parr instruments, Model1341, Moline, IL, USA). The pH of algal biomass was determinedusing a pH electrode (SB70P, SympHony, VWR, Radnor, PA, USA)after the dry, ground samples were diluted with deionized water,10 mL per 1 g of sample, then vigorously stirred and allowed tostand for 1 h before measurement.
2.4. Thermogravimetric analysis methodology
A thermogravimetric analyzer (Model TGA 4000, PerkinElmer,Inc. Waltham, MA, USA) was used to study the decompositionbehavior of the two algal harvests. Prior to the algae decompositiontests, a curie-point temperature calibration was performed usingthree reference materials, i.e., alumel, perkalloy, and Iron, accord-ing to the manufacturer’s guidelines. Similarly, a weight calibrationwas performed, before tests, using the manufacturer suppliedreference weight. Pyrolysis of each of two algae biomasses wasstudied under four different heating rates (5, 10, 20, and40 �C min�1) from 30 to 800 �C. Nitrogen gas was used to purgethe sample (30 mL min�1) to simulate pyrolysis conditions. Thesample size was consistently kept at 5 ± 0.5 mg to minimize devi-ation (lag) between measured and actual sample temperatures,and to also ensure that the decomposition reactions were nottransport-limited. For each sample, blank, clean crucibles weretested using the same thermal decomposition programs in orderto adjust the weight baseline by compensating for the drag forceacting on the crucible.
2.5. Decomposition kinetics
The decomposition is often expressed in terms of the conver-sion (a) which describes the change in sample weight, in a dimen-sionless form.
660 M.A. Sharara et al. / Bioresource Technology 169 (2014) 658–666
a ¼ Wo �W t
Wo �W1ð1Þ
Wo, Wt, and W1 are the sample weights at the beginning, at time t,and at the end of the decomposition stage, respectively. The rate ofconversion (da/dt) is often expressed using an Arrhenius typeexpression.
dadt¼ A exp
�Ea
RT
� �f ðaÞ ð2Þ
A, Ea, R, and T are the pre-exponential coefficient (frequency factor),the activation energy, the universal gas constant, and the sampleabsolute temperature, respectively. f(a) represents the kineticmodel that describes the rate of conversion dependence on theconversion, e.g., an n-order reaction model: f(a) = (1 � a)n.
Under a constant heating-rate (b = dT/dt), the time-dependenceof the conversion rate can be transformed to a temperature-dependence which can be used to rewrite the differential form(Eq. (3)) or the integral form (Eq. (4)) of the decomposition kineticexpression.
dadT¼ A
bexp
�Ea
RT
� �f ðaÞ ð3Þ
gðaÞ ¼Z T
0
Ab
exp�Ea
RT
� �dT ð4Þ
The following sections will detail the different model-free(isoconversional) methods used to determine the apparent activa-tion energies for algae pyrolysis.
2.5.1. Model-free (isoconversional) methodsIsoconversional methods overcome the requirement of deter-
mining the reaction model, f(a), in order to determine the activa-tion energy, Ea. This is accomplished by simultaneously analyzingdecomposition curves generated under different heating rates toextract the apparent kinetics data, i.e., Ea and ln A, correspondingto each degree of conversion (a). Isoconversional methods are pop-ular in biomass decomposition studies due to the fact that biomass,a natural biopolymer, undergoes a series of overlapping reactions,during pyrolysis or oxidation, which cannot be described accu-rately by one-step, global reaction model. The downside in isocon-versional methods, however, is the inability to straightforwardlydetermine an exact model expression, f(a) or g(a), to describe theentire decomposition.
In this research, one differential isoconversional method,Friedman method (Friedman, 1965), and three integral isoconver-sional methods: Kissinger’s (Blaine and Kissinger, 2012),Flynn–Wall–Ozawa’s (Flynn and Wall, 1966; Ozawa, 1965), andKissinger–Akahira–Sunose’s (Starink, 2003) were used to deter-mine the pyrolysis kinetics of the two algae harvests under study.Below is a brief description of each the methods.
2.5.1.1. Friedman method. Re-arranging Eq. (3), then linearizing itby taking the natural log of both sides of the equation
ln bdadT
� �¼ ln ðAf ðaÞÞ � Ea
RTð5Þ
At each a, the above equation describes the linear relationshipbetween 1/T and ln (b da/dT) with each point representing a testedheating rate. The slope of this line represents the activation energyterm, Ea/RT, at this conversion degree whereas the interceptrepresents an expression combining the reaction model and thepre-exponential factor, ln (A f(a)). Calculating the slopes and inter-cepts at different a values, between 0.05 and 0.90, describe thekinetics of decomposition as a function of the conversion degree.
2.5.1.2. Kissinger method. This method determines the activationenergy (Ea) and the pre-exponential factor (A) using the tempera-tures, Tmax values, that correspond to peak decomposition rates,(da/dt)max in thermogravimetric tests under different heating rates(b). The temperature integral in Eq. (4) does not yield an analytical,closed-form solution. Therefore, it is alternatively presented asfollows (Starink, 2003)
gðaÞ ¼ AEa
bRpðxÞ ð6Þ
where x = Ea/RT, and the function p(x) represents
pðxÞ ¼Z 1
x
e�x
x2 dx ð7Þ
Many approximations were derived to determine p(x) numeri-cally. In the Kissinger method, the Murray and White approxima-tion (Starink, 2003), pðxÞ ffi e�x=x2, is used. The underlyingassumption in this method is that the decomposition follows afirst-order reaction model, i.e., f(a) = (1 � a). Eq. (8) details therelationship between Tmax, b, and Ea and A.
lnb
T2max
!¼ ln
AREa
� �� Ea
RTmaxð8Þ
By plotting ln b=T2max against (1/Tmax), the activation energy
(Ea/R) and the pre-exponential factor, ln (AR/Ea), terms can bedetermined, respectively, as the slope and the intercept of theresulting straight-line.
2.5.1.3. Kissinger–Akahira–Sunose (KAS) method. A modified form ofKissinger’s method that was described earlier, KAS method dis-penses with the kinetic model assumption, and the use of onlythe peak decomposition data. Instead, KAS is an integral methodthat relies on the different (a) values instead of the single valuecorresponding to peak decomposition (da/dt).
Eq. (8) can then be rearranged and linearized
lnb
T2
� �¼ ln
AREa
� �� ln ðgðaÞÞ � Ea
RTð9Þ
The slope of the straight lines formed by plotting ln (b/T2)against 1/T at each degree of conversion (a), with the pointscorresponding to the different b values, yields the activationenergy, Ea, corresponding to that conversion degree.
2.5.1.4. Flynn–Wall–Ozawa (FWO) method. In this method, theDoyle’s approximation (Doyle, 1962) to the temperature integral,p(x), is applied: pðxÞ ffi �5:33� 1:05x. The linearized form ofEq. (4) becomes:
ln b ¼ lnAEa
RgðaÞ
� �� 5:33� 1:052
Ea
RT
� �ð10Þ
At each degree of conversion (a), ln b and 1/T corresponding toeach heating rate are fitted into a straight line. The slope,(�1.052Ea/R), represents the apparent activation energy term,while the intercept is a coupled expression of the reaction modelin the integral form, g(a), the apparent activation energy Ea, andthe frequency factor, A.
2.5.2. Kinetic modeling of algae pyrolysisIn order to investigate the pyrolysis of the two algae consortia,
the weight loss was modeled as a series of overlapping indepen-dent, parallel reactions taking place between 100 and 700 �C. Thisapproach was presented elsewhere as a deconvolution step neces-sary to understand the devolatilization of a biopolymer by model-ing the various pseudo-components contributing to its overalldecomposition. In this study, algae pyrolysis was modeled as 4
Table 1Proximate, ultimate, ash, calorific value, and pH analyses for the two algae consortiastudied.
Algae 1 Algae 2
Proximate analysis (wt.%*)Moisture 5.14 5.09Volatile matter 64.49 56.30Fixed carbon** 10.41 6.32Ash 19.96 32.29
Ultimate analysis (wt.%)C 41.51 33.79H 5.59 4.73N 5.40 6.35S 0.51 1.57O** 27.03 21.27Ash 19.96 32.29
Ash analysis (wt.%)Al2O3 1.93 19.86SiO2 14.57 16.44P2O5 15.69 15.27K2O 6.57 12.09SO3 4.54 10.25CaO 37.15 9.85Na2O 3.08 4.88MgO 4.46 4.06Fe2O3 1.42 3.50MnO 0.08 0.17TiO2 0.06 0.15HHV*** (kJ g�1) 16.63 14.53pH 6.88 7.69
* Weight-basis percentage.** By difference.
*** Higher heating value.
M.A. Sharara et al. / Bioresource Technology 169 (2014) 658–666 661
independent, 1st order reactions. The rate of conversion (da/dt) forpseudo-component (N) is:
daN
dt¼ AN exp
�Ea N
RT
� �ð1� aNÞ; whereN ¼ 1 . . . 4 ð11Þ
Consequently, the total rate of conversion (daTotal/dt) can bedetermined from the individual pseudo-components using thefollowing expression:
daTotal
dt¼XN
i¼1
widaN
dt; and
XN
i¼1
wi ¼ 1 ð12Þ
The quantity, wi, represents the contribution of each individualpseudo-component to the overall sample conversion. The conver-sion rate can be converted to the mass loss rate using the followingrelation:
dmcalc
dt¼ �ðmo �mfÞ
daTotal
dtð13Þ
mo and mf represent the initial and final sample weights. Numericalintegration between the temperatures of interest, i.e., 100–700 �C inthis study, yields the computed overall weight, mcalc. The parame-ters of each reaction, i.e., A, Ea, and w were determined by nonlinearminimization of an objective function (O.F.) which represents thesum of squared differences between observed sample mass lossrate, dmobs/dt, and the calculated mass loss rate, dmcalc/dt:
O:F: ¼XNp
i¼1
dmcalc
dt� dmobs
dt
� �2
ð14Þ
In this study, the total number of points, Np, used in reactionmodeling for each thermogram was 300 points. The quality of fit,QOF (%), for the weight loss derivative (DTG) and the weight loss(TG) were determined using the following expressions:
QOFDTGð%Þ ¼ 100
ffiffiffiffiffiffiffiffiffiffiffiffiffiffiffiffiffiffiffiffiffiffiffiffiffiffiffiffiffiffiffiffiffiffiffiffiffiffiffiffiffiffiPNpi¼1
dmcalcdt �
dmobsdt
� �2r
Np
0BB@
1CCA,
dmobs
dt
max
ð15Þ
QOFTGð%Þ ¼ 100
ffiffiffiffiffiffiffiffiffiffiffiffiffiffiffiffiffiffiffiffiffiffiffiffiffiffiffiffiffiffiffiffiffiffiffiffiffiffiffiffiffiffiPNpi¼1ðmcalc �mobsÞ2
qNp
0@
1A,ðmobsÞmax ð16Þ
Numerical integration was performed using a numericalintegrator for stiff-equations, (ODE15s) while the constrained non-linear minimization was performed using the (fmincon) function,both of which are part of the MATLAB software package (MATLABR2013b, The Mathworks, Inc., Natick, MA, USA).
3. Results and discussions
3.1. Species identification
The harvested microalgae species were inspected non-quantita-tively using optical microscopy. The microalgae consortium in eachharvest, i.e., Algae 1 and Algae 2, consisted mostly of filamentousmicroalgae mixtures in addition to diatoms. The most commonfilamentous genus identified in Algae 1 was Mougeotia, while thegenus Cladophora dominated Algae 2 harvest. Both genera are com-mon fresh-water microalgae, which were reported to be tolerant ofa wide range of growing conditions (Higgins et al., 2008; Morris,1982). In a study of algal growths in Lake Mead (Nevada-Arizona,USA), Morris (1982) also reported the predominance of Mougeotiaspecies, in certain monitoring stations during the summer months(June–July) which then changed to Cladophora and Stigeocloniumduring the months of October and November.
3.2. Proximate analysis
Table 1 shows the results of proximate analysis of the two algae.The low moisture content in both harvests, around 5% wet-basis,represents the moisture absorbed after drying and during samplepreparation. Comparison of proximate analysis results for thetwo algae harvests showed significant differences (t-test,p < 0.01) in volatile matter, fixed carbon, and ash contents. Theash contents observed in both algae consortia: 20% in Algae 1and 32% in Algae 2 are noticeably high in comparison to the ashcontents of terrestrial biomass (wood, grasses, and crop residue)which are below 10 wt.%. This is explained by algae’s high potentialfor mineral biosorption and due to their simple cellular structures.The ash content in aquatic biomass vary drastically from less than10% (Gai et al., 2013) to more than 50% (Zhao et al., 2013), accord-ing to type of alga and growth conditions. Algae grown on waste-water or high-mineral effluents in open ponds/raceways areexpected to contain higher ash than algae produced in a closed-system on low-minerals water. The difference in ash contents, 12percentage points, in this study could be attributed to use of thealum flocculant, Al2(SO4)3�14H2O, on the swine manure slurriesused to grow Algae 2. The high percentages of Al2O3 and SO3 foundin Algae 2 ash residue, 19.86% and 10.25%, compared to Algae 1,1.93% and 4.54%, respectively, supports this hypothesis (Table 1).This difference in the ash contents also explains the relativelylow volatile matter and fixed carbon contents observed in Algae2 when compared to Algae 1.
3.3. Elemental composition, and higher heating value
Percentages of the main organic elements: carbon (C), hydrogen(H), nitrogen (N), and oxygen (O), in both algae are shown inTable 1. Algae 1 sample showed higher content of organic elementswhen compared to Algae 2 sample, except for N. These differences
662 M.A. Sharara et al. / Bioresource Technology 169 (2014) 658–666
are attributable, as discussed earlier, to the use of metal salt to pre-cipitate the suspended solids in the manure slurry used in Algae 2production. By contrast, the higher N content in Algae 2 is due tothe elimination of slurry dilution, which was employed in growingthe Algae 1 consortia. N loading was reported to influence the lipidand protein in the algal biomass (Xin et al., 2010). In lipid produc-tion from microalgae, a nutrient stress is typically imposed byreducing N-loading to induce lipid production and storage in algaecells. In phycoremediation, by contrast, algae are grown on N-richsubstrates, which increase the protein content in the cells. Fromtheir N contents, the protein content in Algae 1 and 2 can beestimated using Jones’ factor of 6.25 (Jones, 1941) to be 33.8%and 39.7%, respectively. Unlike terrestrial biomasses, which consistprimarily of cellulose, hemicellulose, and lignin, microalgae aresingle cell organisms that consist of carbohydrates, proteins, andlipids. This structural difference can be observed in the stoichiom-etric expressions for Algae 1: CH1.62N0.11O0.49 and Algae 2: CH1.68
N0.16O0.47, as compared to that for hybrid poplar wood (Jenkinset al., 1998): CH1.45N0.01O0.60.
The difference observed in the higher heating values (HHV)between the studied algae harvests, 16.6 kJ g�1 in Algae 1, and14.5 kJ g�1 in Algae 2, could be attributed to the difference in theash contents. Calculating the dry, ash-free HHV (DAF), usingthe ash contents and the dry-basis HHVs in Table 1, shows bothalgae to have similar energy contents, i.e., 21 kJ g�1
DAF.
3.4. Thermogravimetric analysis
With the temperature increase, the samples underwent a seriesof endothermic and exothermic reactions, which involved varyingdegrees of weight-loss (devolatilization) and structural change tothe sample matrix. In both algae consortia, decomposition temper-atures increased with increasing the heating rate (b). Doubling bled to an increase between 7 and 9 �C for the entire weight losscurve. Similarly, the rate of weight loss was observed to doublewith each doubling of the heating rate. In Algae 1, the pyrolysisresulted in a weight loss of 69–72% of initial weight whereas inAlgae 2 the weight loss ranged between 62% and 67% over theentire temperature range, 30–800 �C. The difference in ash con-tents between the two algal consortia was reflected in differencebetween overall weight-loss.
During algae pyrolysis, the weight loss can be divided into threeconsecutive stages: drying, active pyrolysis, and passive pyrolysis.Drying, which typically takes place below 110 �C, is the first step inalgae pyrolysis and it involves the evaporation of both free andhygroscopic water in the sample matrix. In this step the initialweight dropped around 5% with the corresponding DTG peak ataround 100 �C. After drying, the samples underwent a brief induc-tion period, between 110 and 150 �C, in which the weight loss wasminimal.
In pyrolysis, most of the weight loss takes place, between 150and 550 �C, during the active pyrolysis stage. This weight loss rep-resents the thermal depolymerization and volatilization of variousorganic matter (volatile matter) components. Algae 1 lost 58% oftotal weight during the active pyrolysis step compared to only
Table 2Pyrolysis temperature (�C) and weight loss (%) corresponding to peak decomposition rate
Heating rate (�C min�1) Algae 1
�(dW/dT)p (% �C�1) Tp (�C)
5 0.48 298.5810 0.47 308.0120 0.44 315.7240 0.45 328.31
50% weight-loss in Algae 2. Despite the similarity in peak decom-position temperatures in the two consortia (Table 2), the maxi-mum decomposition rates for Algae 1 samples, 0.44–0.48% �C�1,were consistently higher than those observed for Algae 2,0.33–0.37% �C�1.
In biopolymers such as microalgae, the thermal decompositionrepresents the summation of decomposition profiles for the indi-vidual components. Given the wide variability between microalgaespecies, in terms of main ingredients’ concentration and composi-tion, the decomposition profiles under pyrolysis can vary greatly.Maddi et al. (2011) compared pyrolysis thermograms of Lyngbyasp. and Cladophora sp., and attributed the dissimilarity todifferences in protein compositions (Maddi et al., 2011). In thisstudy, the seasonal variability between consortia induced differ-ences in algal community compositions, which were reflected inthe respective decomposition profiles. In both consortia, however,the main decomposition peak took place in the range associatedwith carbohydrates and proteins indicating a similarity in the maincomposition. Furthermore, the peak associated with lipids decom-position (above 390 �C) (Na et al., 2011) was only a small shoulderin both consortia, indicating low lipid contents.
During passive-pyrolysis (T > 550 �C), both algae harvestsshowed minimal weight-loss, which is characteristic of charpyrolysis. A minor decomposition peak (0.06 % �C) which wasobserved in Algae 1 between 650 and 700 �C was not observed inAlgae 2. In studying the pyrolysis of Chlorella vulgaris, Agrawaland Chakraborty (2013) attributed a similar high temperatureweight-loss peak (at 700 �C) to a char gasification step, whichwas explained as CO2 loss (Agrawal and Chakraborty, 2013).Maddi et al. (2011) also reported a high temperature peak duringthe decomposition of Cladophora sp. but could not identify thecomponent associated with it. The kinetics of decompositionfor both algae consortia during the active pyrolysis stage, 150–550 �C,will be discussed in the following section.
3.5. Pyrolysis kinetics
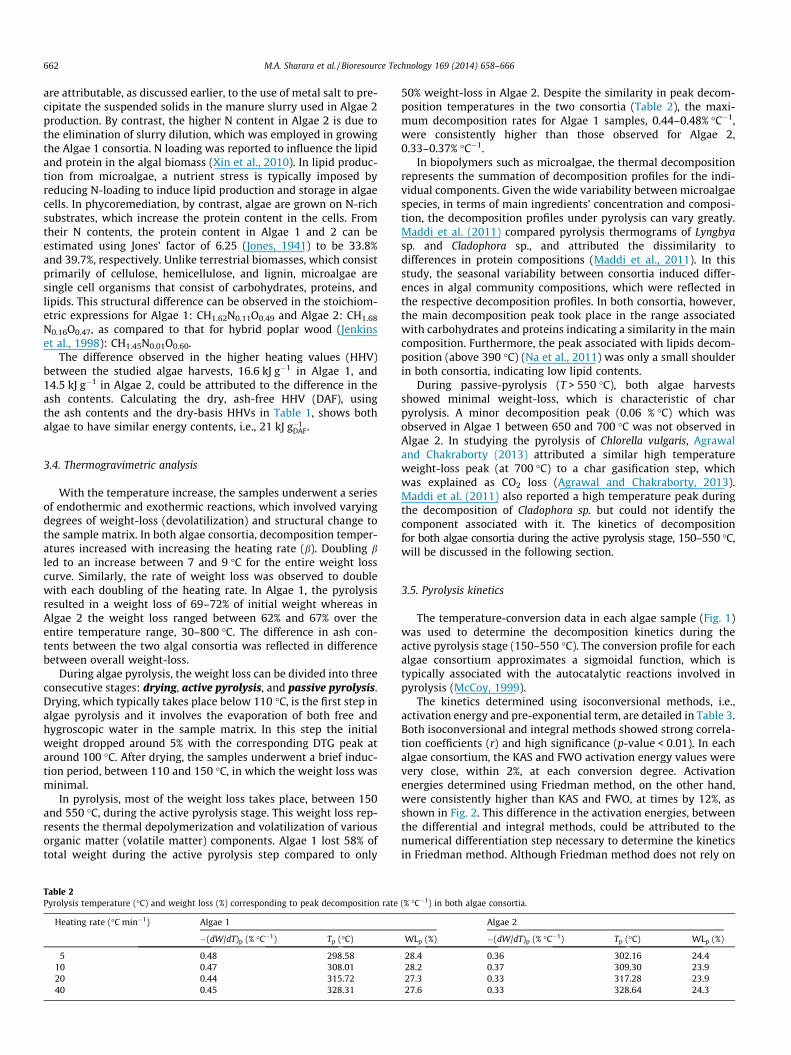
The temperature-conversion data in each algae sample (Fig. 1)was used to determine the decomposition kinetics during theactive pyrolysis stage (150–550 �C). The conversion profile for eachalgae consortium approximates a sigmoidal function, which istypically associated with the autocatalytic reactions involved inpyrolysis (McCoy, 1999).
The kinetics determined using isoconversional methods, i.e.,activation energy and pre-exponential term, are detailed in Table 3.Both isoconversional and integral methods showed strong correla-tion coefficients (r) and high significance (p-value < 0.01). In eachalgae consortium, the KAS and FWO activation energy values werevery close, within 2%, at each conversion degree. Activationenergies determined using Friedman method, on the other hand,were consistently higher than KAS and FWO, at times by 12%, asshown in Fig. 2. This difference in the activation energies, betweenthe differential and integral methods, could be attributed to thenumerical differentiation step necessary to determine the kineticsin Friedman method. Although Friedman method does not rely on
(% �C�1) in both algae consortia.
Algae 2
WLp (%) �(dW/dT)p (% �C�1) Tp (�C) WLp (%)
28.4 0.36 302.16 24.428.2 0.37 309.30 23.927.3 0.33 317.28 23.927.6 0.33 328.64 24.3
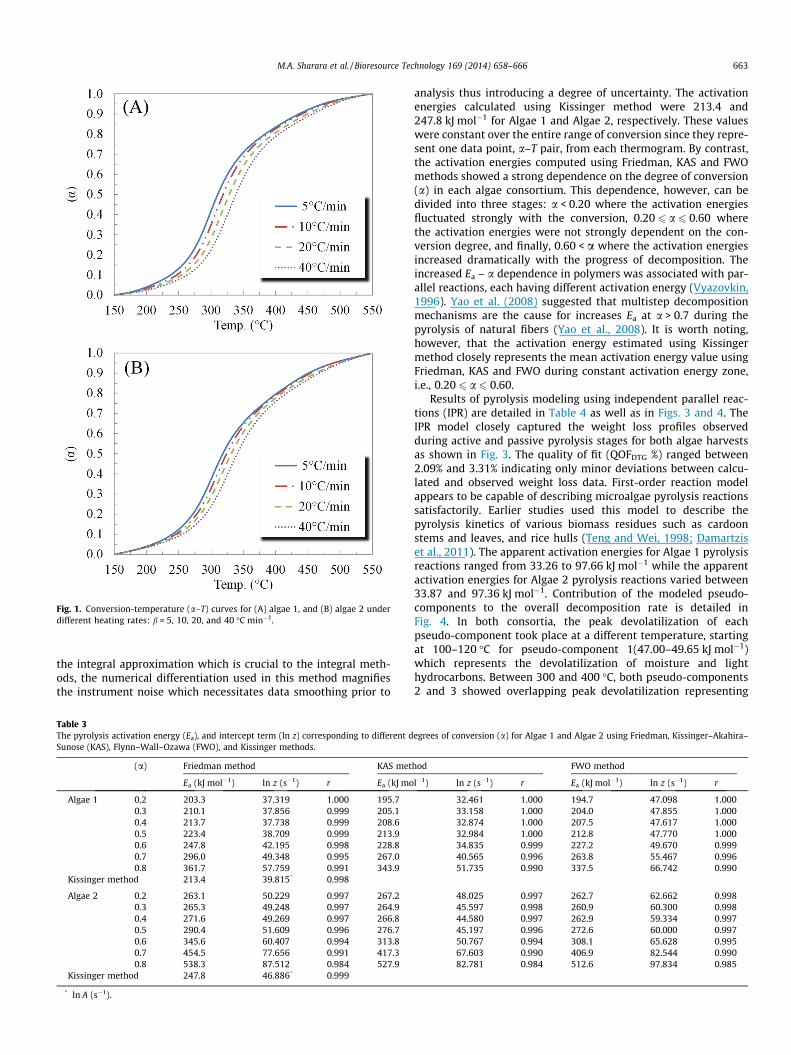
Fig. 1. Conversion-temperature (a–T) curves for (A) algae 1, and (B) algae 2 underdifferent heating rates: b = 5, 10, 20, and 40 �C min�1.
M.A. Sharara et al. / Bioresource Technology 169 (2014) 658–666 663
the integral approximation which is crucial to the integral meth-ods, the numerical differentiation used in this method magnifiesthe instrument noise which necessitates data smoothing prior to
Table 3The pyrolysis activation energy (Ea), and intercept term (ln z) corresponding to different dSunose (KAS), Flynn–Wall–Ozawa (FWO), and Kissinger methods.
(a) Friedman method KAS met
Ea (kJ mol�1) ln z (s�1) r Ea (kJ mo
Algae 1 0.2 203.3 37.319 1.000 195.70.3 210.1 37.856 0.999 205.10.4 213.7 37.738 0.999 208.60.5 223.4 38.709 0.999 213.90.6 247.8 42.195 0.998 228.80.7 296.0 49.348 0.995 267.00.8 361.7 57.759 0.991 343.9
Kissinger method 213.4 39.815* 0.998
Algae 2 0.2 263.1 50.229 0.997 267.20.3 265.3 49.248 0.997 264.90.4 271.6 49.269 0.997 266.80.5 290.4 51.609 0.996 276.70.6 345.6 60.407 0.994 313.80.7 454.5 77.656 0.991 417.30.8 538.3 87.512 0.984 527.9
Kissinger method 247.8 46.886* 0.999
* ln A (s�1).
analysis thus introducing a degree of uncertainty. The activationenergies calculated using Kissinger method were 213.4 and247.8 kJ mol�1 for Algae 1 and Algae 2, respectively. These valueswere constant over the entire range of conversion since they repre-sent one data point, a–T pair, from each thermogram. By contrast,the activation energies computed using Friedman, KAS and FWOmethods showed a strong dependence on the degree of conversion(a) in each algae consortium. This dependence, however, can bedivided into three stages: a < 0.20 where the activation energiesfluctuated strongly with the conversion, 0.20 6 a 6 0.60 wherethe activation energies were not strongly dependent on the con-version degree, and finally, 0.60 < a where the activation energiesincreased dramatically with the progress of decomposition. Theincreased Ea – a dependence in polymers was associated with par-allel reactions, each having different activation energy (Vyazovkin,1996). Yao et al. (2008) suggested that multistep decompositionmechanisms are the cause for increases Ea at a > 0.7 during thepyrolysis of natural fibers (Yao et al., 2008). It is worth noting,however, that the activation energy estimated using Kissingermethod closely represents the mean activation energy value usingFriedman, KAS and FWO during constant activation energy zone,i.e., 0.20 6 a 6 0.60.
Results of pyrolysis modeling using independent parallel reac-tions (IPR) are detailed in Table 4 as well as in Figs. 3 and 4. TheIPR model closely captured the weight loss profiles observedduring active and passive pyrolysis stages for both algae harvestsas shown in Fig. 3. The quality of fit (QOFDTG %) ranged between2.09% and 3.31% indicating only minor deviations between calcu-lated and observed weight loss data. First-order reaction modelappears to be capable of describing microalgae pyrolysis reactionssatisfactorily. Earlier studies used this model to describe thepyrolysis kinetics of various biomass residues such as cardoonstems and leaves, and rice hulls (Teng and Wei, 1998; Damartziset al., 2011). The apparent activation energies for Algae 1 pyrolysisreactions ranged from 33.26 to 97.66 kJ mol�1 while the apparentactivation energies for Algae 2 pyrolysis reactions varied between33.87 and 97.36 kJ mol�1. Contribution of the modeled pseudo-components to the overall decomposition rate is detailed inFig. 4. In both consortia, the peak devolatilization of eachpseudo-component took place at a different temperature, startingat 100–120 �C for pseudo-component 1(47.00–49.65 kJ mol�1)which represents the devolatilization of moisture and lighthydrocarbons. Between 300 and 400 �C, both pseudo-components2 and 3 showed overlapping peak devolatilization representing
egrees of conversion (a) for Algae 1 and Algae 2 using Friedman, Kissinger–Akahira–
hod FWO method
l�1) ln z (s�1) r Ea (kJ mol�1) ln z (s�1) r
32.461 1.000 194.7 47.098 1.00033.158 1.000 204.0 47.855 1.00032.874 1.000 207.5 47.617 1.00032.984 1.000 212.8 47.770 1.00034.835 0.999 227.2 49.670 0.99940.565 0.996 263.8 55.467 0.99651.735 0.990 337.5 66.742 0.990
48.025 0.997 262.7 62.662 0.99845.597 0.998 260.9 60.300 0.99844.580 0.997 262.9 59.334 0.99745.197 0.996 272.6 60.000 0.99750.767 0.994 308.1 65.628 0.99567.603 0.990 406.9 82.544 0.99082.781 0.984 512.6 97.834 0.985
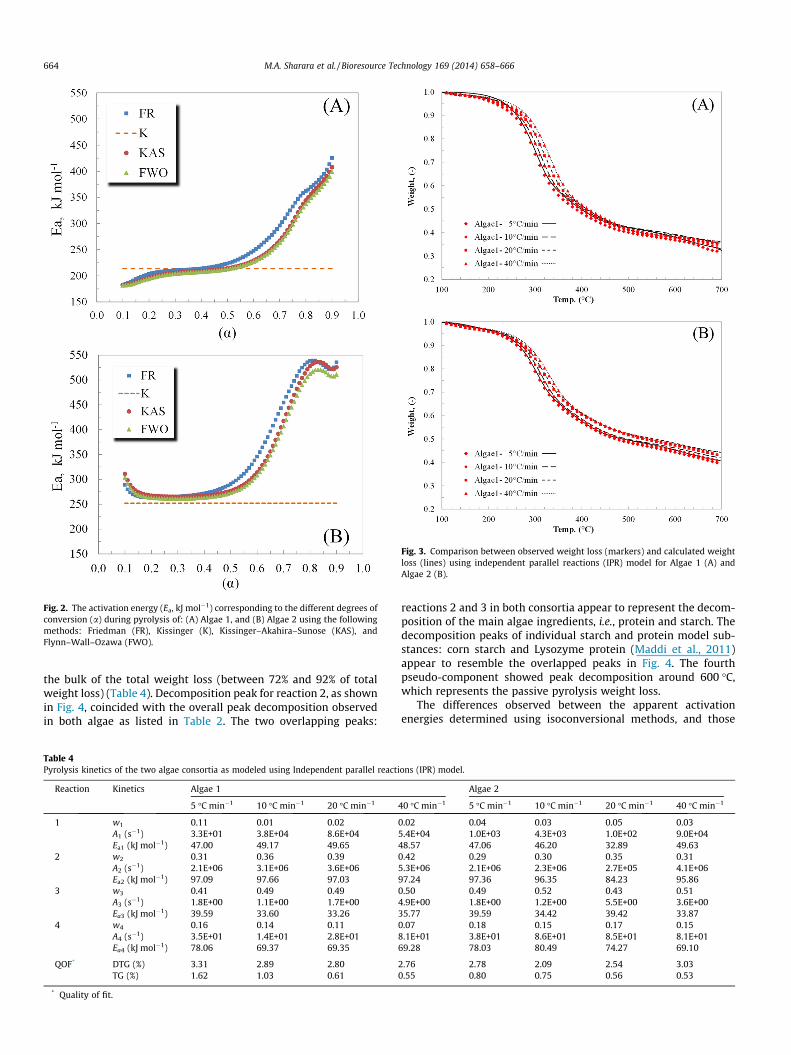
Fig. 2. The activation energy (Ea, kJ mol�1) corresponding to the different degrees ofconversion (a) during pyrolysis of: (A) Algae 1, and (B) Algae 2 using the followingmethods: Friedman (FR), Kissinger (K), Kissinger–Akahira–Sunose (KAS), andFlynn–Wall–Ozawa (FWO).
Fig. 3. Comparison between observed weight loss (markers) and calculated weightloss (lines) using independent parallel reactions (IPR) model for Algae 1 (A) andAlgae 2 (B).
664 M.A. Sharara et al. / Bioresource Technology 169 (2014) 658–666
the bulk of the total weight loss (between 72% and 92% of totalweight loss) (Table 4). Decomposition peak for reaction 2, as shownin Fig. 4, coincided with the overall peak decomposition observedin both algae as listed in Table 2. The two overlapping peaks:
Table 4Pyrolysis kinetics of the two algae consortia as modeled using Independent parallel reacti
Reaction Kinetics Algae 1
5 �C min�1 10 �C min�1 20 �C min�1
1 w1 0.11 0.01 0.02A1 (s�1) 3.3E+01 3.8E+04 8.6E+04Ea1 (kJ mol�1) 47.00 49.17 49.65
2 w2 0.31 0.36 0.39A2 (s�1) 2.1E+06 3.1E+06 3.6E+06Ea2 (kJ mol�1) 97.09 97.66 97.03
3 w3 0.41 0.49 0.49A3 (s�1) 1.8E+00 1.1E+00 1.7E+00Ea3 (kJ mol�1) 39.59 33.60 33.26
4 w4 0.16 0.14 0.11A4 (s�1) 3.5E+01 1.4E+01 2.8E+01Ea4 (kJ mol�1) 78.06 69.37 69.35
QOF* DTG (%) 3.31 2.89 2.80TG (%) 1.62 1.03 0.61
* Quality of fit.
reactions 2 and 3 in both consortia appear to represent the decom-position of the main algae ingredients, i.e., protein and starch. Thedecomposition peaks of individual starch and protein model sub-stances: corn starch and Lysozyme protein (Maddi et al., 2011)appear to resemble the overlapped peaks in Fig. 4. The fourthpseudo-component showed peak decomposition around 600 �C,which represents the passive pyrolysis weight loss.
The differences observed between the apparent activationenergies determined using isoconversional methods, and those
ons (IPR) model.
Algae 2
40 �C min�1 5 �C min�1 10 �C min�1 20 �C min�1 40 �C min�1
0.02 0.04 0.03 0.05 0.035.4E+04 1.0E+03 4.3E+03 1.0E+02 9.0E+0448.57 47.06 46.20 32.89 49.630.42 0.29 0.30 0.35 0.315.3E+06 2.1E+06 2.3E+06 2.7E+05 4.1E+0697.24 97.36 96.35 84.23 95.860.50 0.49 0.52 0.43 0.514.9E+00 1.8E+00 1.2E+00 5.5E+00 3.6E+0035.77 39.59 34.42 39.42 33.870.07 0.18 0.15 0.17 0.158.1E+01 3.8E+01 8.6E+01 8.5E+01 8.1E+0169.28 78.03 80.49 74.27 69.10
2.76 2.78 2.09 2.54 3.030.55 0.80 0.75 0.56 0.53
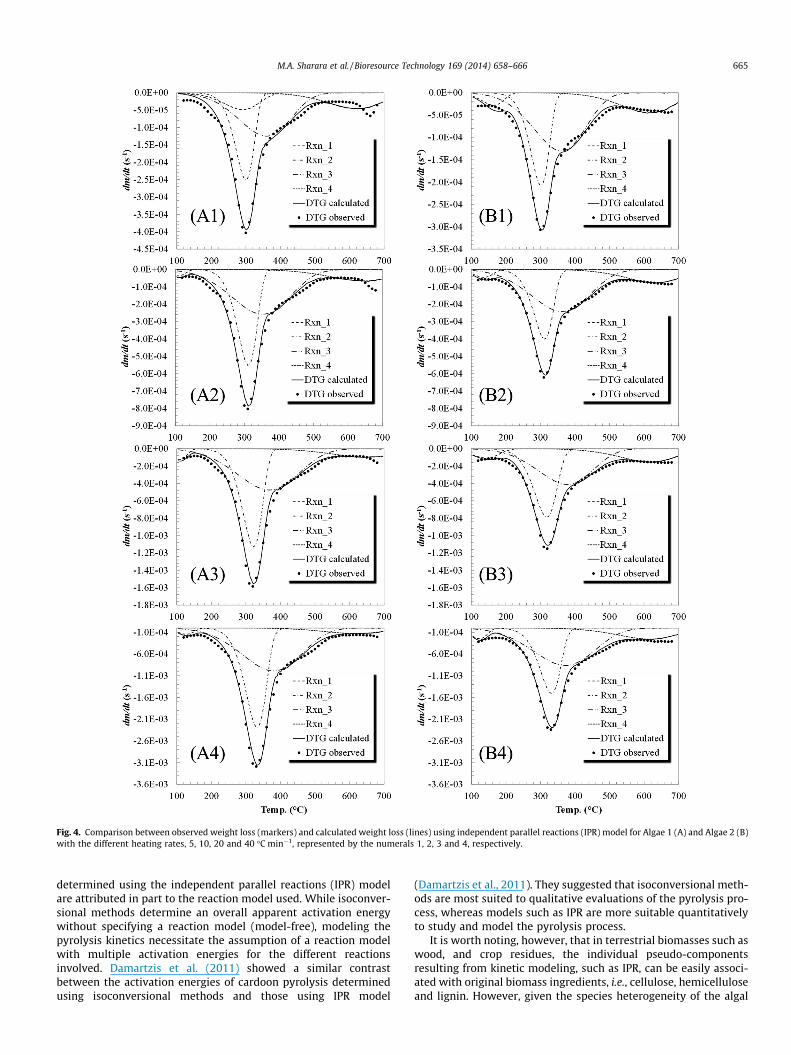
Fig. 4. Comparison between observed weight loss (markers) and calculated weight loss (lines) using independent parallel reactions (IPR) model for Algae 1 (A) and Algae 2 (B)with the different heating rates, 5, 10, 20 and 40 �C min�1, represented by the numerals 1, 2, 3 and 4, respectively.
M.A. Sharara et al. / Bioresource Technology 169 (2014) 658–666 665
determined using the independent parallel reactions (IPR) modelare attributed in part to the reaction model used. While isoconver-sional methods determine an overall apparent activation energywithout specifying a reaction model (model-free), modeling thepyrolysis kinetics necessitate the assumption of a reaction modelwith multiple activation energies for the different reactionsinvolved. Damartzis et al. (2011) showed a similar contrastbetween the activation energies of cardoon pyrolysis determinedusing isoconversional methods and those using IPR model
(Damartzis et al., 2011). They suggested that isoconversional meth-ods are most suited to qualitative evaluations of the pyrolysis pro-cess, whereas models such as IPR are more suitable quantitativelyto study and model the pyrolysis process.
It is worth noting, however, that in terrestrial biomasses such aswood, and crop residues, the individual pseudo-componentsresulting from kinetic modeling, such as IPR, can be easily associ-ated with original biomass ingredients, i.e., cellulose, hemicelluloseand lignin. However, given the species heterogeneity of the algal
666 M.A. Sharara et al. / Bioresource Technology 169 (2014) 658–666
consortia investigated here, not to mention the complex structuresin individual algal species, it is not possible to map the modeledpseudo-component to specific structural components or interme-diate species. Nonetheless, coupling these pseudo-components tothe evolved species, via spectral analysis, can offer better under-standing of the original species undergoing decomposition.
4. Conclusions
� The algae genus Mougeotia was the common genus in theAlgae 1 harvest, while the genus Cladophora was predomi-nant in the Algae 2 harvest.
� In isoconversional methods, the apparent activation ener-gies for pyrolysis of Algae 1 were lower than Algae 2pyrolysis.
� Friedman method activation energy values were within12% of Kissinger–Akahira–Sunose (KAS) and Flynn–Wall–Ozawa (FWO) values.
� The activation energy dependence on conversion suggestscomplex reaction schemes which should not be reducedto a single-step reaction.
� The pyrolysis kinetics of each consortium was modeledusing independent parallel reaction (IPR) model as a groupof four parallel, independent, first-order reactions.
Acknowledgements
This research is part of the program ‘‘Climate Change Mitigationand Adaptation in Agriculture,’’ and is supported by Agricultureand Food Research Initiative Competitive Grant no. 2011-68002-30208 from the USDA National Institute of Food and Agriculture.The authors would like to thank the funding agency for theircontinued support.
References
Agrawal, A., Chakraborty, S., 2013. A kinetic study of pyrolysis and combustion ofmicroalgae Chlorella vulgaris using thermo-gravimetric analysis. Bioresour.Technol. 128, 72–80.
Blaine, R.L., Kissinger, H.E., 2012. Homer Kissinger and the Kissinger equation.Thermochim. Acta 540, 1–6.
Carrier, M., Loppinet-Serani, A., Denux, D., Lasnier, J., Ham-Pichavant, F., Cansell, F.,Aymonier, C., 2011. Thermogravimetric analysis as a new method to determinethe lignocellulosic composition of biomass. Biomass Bioenergy 35, 298–307.
Conley, D.J., Paerl, H.W., Howarth, R.W., Boesch, D.F., Seitzinger, S.P., Havens, K.E.,Lancelot, C., Likens, G.E., 2009. Controlling eutrophication: nitrogen andphosphorus. Science 323, 1014–1015.
Damartzis, T., Vamvuka, D., Sfakiotakis, S., Zabaniotou, A., 2011. Thermaldegradation studies and kinetic modeling of cardoon (Cynara cardunculus)pyrolysis using thermogravimetric analysis (TGA). Bioresour. Technol. 102,6230–6238.
Demirbas, A., Fatih Demirbas, M., 2011. Importance of algae oil as a source ofbiodiesel. Energy Conv. Manage. 52, 163–170.
Doyle, C., 1962. Estimating isothermal life from thermogravimetric data. J. Appl.Polym. Sci. 6, 639–642.
Flynn, J.H., Wall, L.A., 1966. General treatment of the thermogravimetry ofpolymers. J. Res. Natl. Bur. Stand. A Phys. Chem. 70Z, 487–523.
Friedman, H.L., 1965. Kinetics of thermal degradation of char-foaming plastics fromthermogravimetry: application to a phenolic resin. J. Polym. Sci. 6, 183–195.
Gai, C., Zhang, Y., Chen, W., Zhang, P., Dong, Y., 2013. Thermogravimetric and kineticanalysis of thermal decomposition characteristics of low-lipid microalgae.Bioresour. Technol. 150, 139–148.
García, R., Pizarro, C., Lavín, A.G., Bueno, J.L., 2013. Biomass proximate analysis usingthermogravimetry. Bioresour. Technol. 139, 1–4.
Gomez, C.J., Varhegyi, G., Puigjaner, L., 2005. Slow pyrolysis of woody residues andan herbaceous biomass crop: a kinetic study. Ind. Eng. Chem. Res. 44, 6650–6660.
Gómez, X., Cuetos, M.J., García, A.I., Morán, A., 2007. An evaluation of stability bythermogravimetric analysis of digestate obtained from different biowastes.J. Hazard. Mater. 149, 97–105.
Heathwaite, A., 2010. Multiple stressors on water availability at global to catchmentscales: understanding human impact on nutrient cycles to protect water qualityand water availability in the long term. Freshwat. Biol. 55, 241–257.
Higgins, S.N., Malkin, S.Y., Todd Howell, E., Guildford, S.J., Campbell, L., Hiriart-Baer,V., Hecky, R.E., 2008. An ecological review of Cladophora glomerata(Chlorophyta) in the Laurentian great lakes1. J. Phycol. 44, 839–854.
Jenkins, B., Baxter, L., Miles Jr, T., Miles, T., 1998. Combustion properties of biomass.Fuel Process Technol. 54, 17–46.
Jones, D.B., 1941. Factors for Converting Percentages of Nitrogen in Foods and Feedsinto Percentages of Proteins. US Department of Agriculture, Washington, DC.
Kebede-Westhead, E., Pizarro, C., Mulbry, W.W., 2006. Treatment of swine manureeffluent using freshwater algae: production, nutrient recovery, and elementalcomposition of algal biomass at four effluent loading rates. J. Appl. Phycol. 18,41–46.
Maddi, B., Viamajala, S., Varanasi, S., 2011. Comparative study of pyrolysis of algalbiomass from natural lake blooms with lignocellulosic biomass. Bioresour.Technol. 102, 11018–11026.
Mani, T., Murugan, P., Abedi, J., Mahinpey, N., 2010. Pyrolysis of wheat straw in athermogravimetric analyzer: effect of particle size and heating rate ondevolatilization and estimation of global kinetics. Chem. Eng. Res. Des 88,952–958.
McCoy, B.J., 1999. Distribution kinetics for temperature-programmed pyrolysis. Ind.Eng. Chem. Res. 38, 4531–4537.
Morris, M.K., 1982. Effects of Wastewater Discharges on Periphyton Growth in LakeMead, Nevada-Arizona.
Muller-Feuga, A., 2000. The role of microalgae in aquaculture: situation and trends.J. Appl. Phycol. 12, 527–534.
Na, J., Lee, H.S., Oh, Y., Park, J., Ko, C.H., Lee, S., Yi, K.B., Chung, S.H., Jeon, S.G., 2011.Rapid estimation of triacylglycerol content of Chlorella sp. by thermogravimetricanalysis. Biotechnol. Lett. 33, 957–960.
Ozawa, T., 1965. A new method of analyzing thermogravimetric data. Bull. Chem.Soc. Jpn. 38, 1881–1886.
Pittman, J.K., Dean, A.P., Osundeko, O., 2011. The potential of sustainable algalbiofuel production using wastewater resources. Bioresour. Technol. 102, 17–25.
Sanchez, M., Otero, M., Gomez, X., Moran, A., 2009. Thermogravimetric kineticanalysis of the combustion of biowastes. Renew. Energy 34, 1622–1627.
Sharara, M., Sadaka, S., 2014. Thermogravimetric analysis of swine manure solidsobtained from farrowing, and growing-finishing farms. J. Sust. Bioenergy Syst. 4,75–86.
Skulberg, O.M., 2004. 30 Bioactive chemicals in microalgae. Handbook of MicroalgalCulture: Biotechnology and Applied Phycology, p. 485.
Starink, M., 2003. The determination of activation energy from linear heating rateexperiments: a comparison of the accuracy of isoconversion methods.Thermochim. Acta 404, 163–176.
Teng, H., Wei, Y., 1998. Thermogravimetric studies on the kinetics of rice hullpyrolysis and the influence of water treatment. Ind. Eng. Chem. Res. 37,3806–3811.
Vyazovkin, S., 1996. A unified approach to kinetic processing of nonisothermal data.Int. J. Chem. Kinet. 28, 95–101.
Xin, L., Hong-ying, H., Ke, G., Ying-xue, S., 2010. Effects of different nitrogen andphosphorus concentrations on the growth, nutrient uptake, and lipidaccumulation of a freshwater microalga Scenedesmus sp.. Bioresour. Technol.101, 5494–5500.
Yao, F., Wu, Q., Lei, Y., Guo, W., Xu, Y., 2008. Thermal decomposition kinetics ofnatural fibers: activation energy with dynamic thermogravimetric analysis.Polym. Degrad. Stab. 93, 90–98.
Zhao, H., Yan, H., Dong, S., Zhang, Y., Sun, B., Zhang, C., Ai, Y., Chen, B., Liu, Q., Sui, T.,2013. Thermogravimetry study of the pyrolytic characteristics and kinetics ofmacro-algae Macrocystis pyrifera residue. J. Therm. Anal. Calorim. 111,1685–1690.
Related Documents