PYRITE OXIDATION RATES FROM HUMIDITY CELL TESTING OF GREENSTONE ROCK 1 Kim A. Lapakko 2 David A. Antonson 2 Abstract. Fourteen samples of pyrite-bearing Archean greenstone rock (d < 6.35 mm, 0.08 ≤ FeS 2 ≤ 2.25 wt. %) were characterized and subjected to laboratory dissolution testing for periods of 154 or 204 weeks. Rates of pyrite oxidation were determined based on the observed rates of sulfate release between weeks 20 and 60 and the calculated pyrite surface areas exposed. The pyrite surface areas exposed were determined based on the particle size distribution, sulfur content of individual size fractions, and percent pyrite liberation. The pyrite oxidation rates, normalized for exposed surface area, ranged from 4 × 10 −10 to 18 × 10 −10 mol m −2 s −1 and tended to increase as drainage pH decreased from 7.3 to 3.3. For eight rock samples with median pH values above 6.0, rates were roughly 0.6 to 1.3 times those predicted in the literature for the abiotic oxidation of pyrite by oxygen. Median pH values for the remaining six samples ranged from 3.3 to 5.0, and pyrite oxidation rates were roughly 2 to 8 times the published abiotic rates, suggesting the influence of oxidation by ferric iron. Additional Key Words: kinetics, kinetic tests, mine waste drainage, drainage quality prediction Introduction Environmentally sound waste rock management plans are typically required to obtain mineral resource development permits. To develop plans that are effective, efficient, and economical, it is necessary to predict the quality of drainage generated by the lithologies excavated in order to access the ore. Mitigation techniques can then be scaled to the predicted potential for adverse impact. Existing data on a waste rock of composition similar to that at the proposed mine, generated by similar mining methods, and exposed to similar environmental conditions for an extended time provide the best indicator of drainage quality. Since these data 1 Paper was presented at the 2006, 7 th ICARD, March 26-30, 2006, St. Louis MO. Published by ASMR, 3134 Montavesta Rd., Lexington, KY 40502. 2 Kim A. Lapakko is a Principal Engineer and David A. Antonson is a Mineland Reclamation Field Supervisor at the Minnesota Department of Natural Resources, Division of Lands and Minerals, Hibbing, MN 55746.

Welcome message from author
This document is posted to help you gain knowledge. Please leave a comment to let me know what you think about it! Share it to your friends and learn new things together.
Transcript

PYRITE OXIDATION RATES FROM HUMIDITY CELL TESTING OF GREENSTONE ROCK1
Kim A. Lapakko2
David A. Antonson2
Abstract. Fourteen samples of pyrite-bearing Archean greenstone rock (d < 6.35 mm, 0.08 ≤ FeS2 ≤ 2.25 wt. %) were characterized and subjected to laboratory dissolution testing for periods of 154 or 204 weeks. Rates of pyrite oxidation were determined based on the observed rates of sulfate release between weeks 20 and 60 and the calculated pyrite surface areas exposed. The pyrite surface areas exposed were determined based on the particle size distribution, sulfur content of individual size fractions, and percent pyrite liberation. The pyrite oxidation rates, normalized for exposed surface area, ranged from 4 × 10⁻¹⁰ to 18 × 10−10 mol m−2s−1 and tended to increase as drainage pH decreased from 7.3 to 3.3. For eight rock samples with median pH values above 6.0, rates were roughly 0.6 to 1.3 times those predicted in the literature for the abiotic oxidation of pyrite by oxygen. Median pH values for the remaining six samples ranged from 3.3 to 5.0, and pyrite oxidation rates were roughly 2 to 8 times the published abiotic rates, suggesting the influence of oxidation by ferric iron. Additional Key Words: kinetics, kinetic tests, mine waste drainage, drainage quality prediction
Introduction
Environmentally sound waste rock management plans are typically required to obtain
mineral resource development permits. To develop plans that are effective, efficient, and
economical, it is necessary to predict the quality of drainage generated by the lithologies
excavated in order to access the ore. Mitigation techniques can then be scaled to the predicted
potential for adverse impact. Existing data on a waste rock of composition similar to that at the
proposed mine, generated by similar mining methods, and exposed to similar environmental
conditions for an extended time provide the best indicator of drainage quality. Since these data
1 Paper was presented at the 2006, 7th ICARD, March 26-30, 2006, St. Louis MO. Published by ASMR, 3134 Montavesta Rd., Lexington, KY 40502. 2 Kim A. Lapakko is a Principal Engineer and David A. Antonson is a Mineland Reclamation Field Supervisor at the Minnesota Department of Natural Resources, Division of Lands and Minerals, Hibbing, MN 55746.

are rarely available, it is necessary to use other means of drainage quality prediction, such as
compositional characterization and dissolution testing.
Laboratory kinetic tests are commonly conducted to aid in prediction of mine waste drainage
quality. Although leachate chemistry and rates of chemical release are typically reported for
these tests, rates of mineral dissolution are rarely reported. Whereas dissolution rates have been
determined based on laboratory studies conducted on individual, isolated minerals that might be
present in a given lithology (e.g. Williamson and Rimstidt, 1994; White and Brantley, 1995),
empirical data are needed to provide rates describing their dissolution within a specific rock
matrix. Distinct to each lithology are the chemistry, grain size, surface morphology, and extent
of exposure (extent to which a mineral grain is exposed to gaseous and aqueous phase reactants)
of the individual minerals. Within each lithology the interaction with other minerals and their
dissolution products will also be unique. Consequently, it is unknown how well mineral
dissolution rates determined from laboratory studies on individual, isolated minerals will
approximate rates occurring during mine waste dissolution in the laboratory or field.
Mineral dissolution rates can be helpful when interpreting kinetic test data and in
extrapolating predictive test results to full-scale operations. Furthermore, determination of these
rates will allow results from dissolution tests on different mineral assemblages to be compiled
and compared. This will provide a source of data for a wide variety of mineral assemblages,
provide greater insight into factors controlling mine waste weathering, and add a greater degree
of confidence to interpretation and extrapolation of kinetic test results. On a practical level, this
will reduce uncertainty in mine waste drainage quality predictions.
This paper presents calculates rates of pyrite oxidation during laboratory dissolution testing
of Archean greenstone rock from northeastern Minnesota and compares them to those reported in
the literature. Greenstones are a mineral exploration target in Minnesota and are host to
numerous gold and base metal deposits, although the exact mineralogy and petrology can vary
within and among formations. Lapakko and Antonson (2001, 2002) reported on earlier phases of
the laboratory studies presented.

Pyrite Oxidation Rates
The major water quality concern regarding mine waste drainage quality is generation of
acidic drainage and associated metal leaching, although release of metals in neutral drainage can
also adversely impact water quality. Acid is released as a result of the oxidation of iron sulfide
minerals (equation 1), which are common in both hydrothermal-quartz-carbonate gold deposits
and base metal deposits in greenstones.
FeS2 (s) + (15/4) O2 + (5/2) H2O = FeOOH(s) + 2SO42− (aq) + 4H+ (aq) (1)
Williamson and Rimstidt (1994) used literature data (Smith and Shumate, 1970; McKibben,
1984; Nicholson et al., 1988; Moses and Herman, 1991) to derive the following rate law for the
abiotic rate of pyrite oxidation by oxygen at 25 oC.
dFeS2/dt = 10−8.19 (±0.10) mDO0.5 (±0.04)mH+
(−0.11±0.01) (2)
where, mDO and mH+ are molalities of dissolved oxygen and H+ in units of mol kg−1, and where
the rate of pyrite destruction is expressed in mol m−2 s−1. Ranges of mDO and pH for which the
expression is applicable are approximately 10−5.5 to 10−1.5 mol kg−1 and 2 to 10, respectively. For
oxygen saturation at 25 oC (2.625 × 10⁻⁴ mol kg−1) at pH 3 and pH 7, this yields respective rates
of 2.2 × 10⁻¹⁰ and 6.2 × 10⁻¹⁰ mol m−2 s−1.
In the environment, the rate of sulfide mineral oxidation increases as pH decreases into a
range conducive to bacterial mediation of ferrous iron oxidation. Nordstrom (1982) reported that
as “pH decreases to 4.5, ferric iron becomes more soluble and begins to act as an oxidizing
agent.” As pH further decreases, bacterial oxidation of ferrous iron becomes the rate limiting
step in the oxidation of pyrite by ferric iron (Singer and Stumm, 1970), which is the only
significant oxidizing agent in this pH range (Nordstrom, 1982; Singer and Stumm, 1970;
Kleinmann et al., 1981). The bacterially mediated rate of pyrite oxidation by ferric iron is
roughly two to three orders of magnitude faster than the rate of abiotic oxidation by oxygen at
pH 2 (Nordstrom and Alpers, 1999). In laboratory experiments conducted on hydrothermal

quartz carbonate tailings (Lapakko and Wessels, 1995), the sulfate release rate from pyrite in the
pH range of 3.0 to 3.2 was approximately 13 times that at pH 8 (MN DNR, 2000).
Methods
Materials
As part of a project unrelated to mining, the University of Minnesota Department of Physics
constructed a cavern at a depth of 730 m in a greenstone formation near Soudan, MN. The goal
of the project was to enlarge an underground physics laboratory at the Soudan Mine, and resulted
in excavation of approximately 22,000 cubic yards of greenstone rock. Prior to excavation a
6.35-cm drill hole was bored through the center of the proposed cavern to characterize
geotechnical properties of the rock. Because there were also concerns regarding disposal of the
rock, drill core intervals were also analyzed for sulfur content using a LECO furnace.
Fourteen samples spanning a range of sulfur contents were collected from the core for
laboratory dissolution testing. Five-foot intervals of quarter core were stage-crushed to minus
0.64-cm to limit generation of fines. The three crushing steps were a large jaw crusher set at
1.92 cm, a small jaw crusher set at 0.95 cm, and a roll crusher set at 0.64 cm. After each step the
minus 0.64 cm fraction was retained and the plus 0.64 cm fraction was subjected to the next step.
Laboratory Procedures
Fourteen samples of five-cm drill core were stage crushed and subjected to laboratory
dissolution testing for 204 weeks. The experimental apparatus was similar to that specified in
ASTM Method 5744 (ASTM, 2000) and is described by Lapakko and White (2000). It had a
10.2-cm internal diameter and was approximately 19 cm tall. Each cell was charged with 1000 g
of air-dried rock. A total of 18 cells were used for the fourteen drill core samples, four of which
were run in duplicate. Prior to sample addition, the cells were washed with 10 % HNO3, then
rinsed three times with distilled water.
Each cell and the contained 1000 g dry solids was weighed, and the solids were then rinsed
daily with 500 mL of deionized water for three days (week 0) to remove oxidation products
which accumulated prior to the beginning of the experiment. The outlet port was capped and
500 mL of deionized water was added slowly from a graduated cylinder to the cell. Ten minutes
after all cells were filled, the outlets were uncapped and the cells drained. Subsequently the cells

were rinsed weekly in a similar manner, with the exception that a single 500-mL volume of
deionized water was slowly dripped into the cell from a separatory funnel. Dissolution tests on
twelve solids continued for 204 weeks. The four replicates of these samples and two additional
samples were terminated after 154 weeks of dissolution.
Between rinses, the cells were stored in a room in which temperature and humidity were
controlled. Over the 204-week period of testing, temperature and relative humidity were
measured three to four times per week, and average weekly values were determined.
Temperature ranged from 22.2 oC to 27.5 oC and averaged 24.5 oC, with a standard deviation of
1.1 oC. Average weekly relative humidity ranged from 51.3% to 63.5% and averaged 57.9%,
with a standard deviation of 2.4%.
Analyses
Particle size distribution for the laboratory samples was determined using method ASTM E-
276-93 (ASTM, 2000) by Lerch Brothers Inc. All samples were dry-sieved and two samples
were also wet-sieved.
The rock samples, as well as their size fractions, were analyzed for sulfur, sulfate (sulfide
was determined by difference), and evolved carbon dioxide by ACTLABS in Tucson, AZ using
ASTM E-1915-97 (ASTM, 2000). A 10 % HCl solution was used to decompose the carbonate
minerals, and the carbonate present was quantified as the difference between total carbon in the
initial sample and that in the residue. The remaining solid-phase constituents of the bulk samples
were determined by ACTLABS in Ancaster, ON. Whole rock constituents were determined
using a lithium tetraborate fusion modified from ASTM E-886-94 (ASTM, 2000) and analysis by
inductively coupled plasma-atomic emission spectroscopy (ICP-AES) using a Thermo Jarrell-
Ash ENVIRO II ICP. Concentrations of Ag, Cd, Cu, Ni, Pb, Zn, and Bi were determined using a
total digestion method modified from Crock et al. (1983), with analysis by ICP-AES. Other
trace elements were determined using instrumental neutron activation analysis (Hoffman, 1992).
Mineral content was determined using sample chemistry, optical microscopy, and previous x-ray
diffraction data on drill core samples. Chemistry of the siderite present in two of the samples
was determined by scanning electron microscope (Zeiss DSM 960A) using electron dispersive
spectrometry.

Pyrite oxidation rates were calculated based on the pyrite surface area that would be exposed
to gaseous and aqueous phase reactants in dissolution tests. The extent of pyrite liberation, the
degree to which pyrite grains are separated from the rock matrix, was determined
microscopically by loose grain counts of particles in 11 or 12 size fractions (Louis Mattson,
Mineralogical Consulting Service, Pengilly, MN). It was assumed that the surface area of the
liberated pyrite contributed virtually all of the exposed pyrite surface area (i.e. pyrite area
exposed on rock surfaces was negligible).
Water samples were analyzed for specific conductance, pH, alkalinity, and acidity at the
Minnesota Department of Natural Resources laboratory in Hibbing, MN. Specific conductance
was determined using a Myron L conductivity meter. An Orion SA720 meter, equipped with a
Ross combination pH electrode (8165), was used for pH determinations. Alkalinity (for pH $
6.3) and acidity were determined using standard titration techniques for endpoints of 4.5 and 8.3,
respectively (American Public Health Association et al., 1992). Samples were filtered through a
0.45-micron filter for sulfate determinations using a Lachat QuickChem 8000 or, for [SO4] < 5
mg/L, a Dionex ion chromatograph at the MN Department of Agriculture. Concentrations of
other solutes were also determined, but those results are not immediately relevant to the present
paper.
Calculations
Rates of pyrite oxidation were determined by dividing molar rates of sulfate release by twice
the liberated pyrite surface area. The division by two accounts for the fact that there are two
moles of sulfate released per mole of pyrite oxidized. Sulfate release rates were determined for
periods 20-60, 60-100, 100-154, and 154-204 weeks. The rates for a specific period were
calculated as the average of the weekly sulfate release rates during the period. An average rate
of release for weeks 20-204 was calculated as the total sulfate mass released during this time
divided by 185.
The exposed pyrite surface area of a sample was determined by summing the exposed pyrite
surface area in each particle size fraction, which was calculated as follows.
Apy, i = (%S2-i /100)[(55.85 + 64.12)/64.12][6/(ρ dgm, i)]MiLi(SR)/100, where (3)

Apy, i = pyrite area in particle size fraction i, m2,
%S2-i = percent sulfide (S2-) of sample in size fraction i,
ρ = pyrite density = 5.02 × 10⁶ g m−3,
dgm, i = geometric mean diameter of particle size fraction i, m,
Mi = mass of rock in particle size fraction i, g,
Li = percent pyrite exposure in particle size fraction i, and
SR = surface roughness factor for pyrite estimated as 2.6, using the value reported for
quartz (Parks, 1990) because pyrite surfaces were reported to be smooth.
The mass weighted sulfide concentrations for the individual size fractions were compared to
the sulfide content of the bulk sample. The agreement between the two values was reasonable.
A minimum diameter of 10 µm was used to determine the geometric mean diameter of the less
than 75-µm fraction. The mineralogical analysis indicated the pyrite finer than 10 µm was
“intergrown with the gangue minerals” (Mattson, 2000), which limited the pyrite surface
exposure.
All laboratory samples were dry sieved and two samples were wet sieved. The mass in the
wet-sieved 10-75 µm fraction averaged 1.26 times the dry-sieved fraction. The influence of wet
sieving on other size fractions was negligible. Consequently, the 10-75 µm fraction mass of dry-
sieved samples was multiplied by this factor.
Results and Discussion
Rock Composition
The 14 greenstone samples were analyzed for particle size distribution, chemistry, and
mineralogy. Solids were crushed to finer than 6.4 cm. Approximately 23 to 35 percent of the
particles were finer than 850 µm, 9 to 14 percent finer than 212 µm, and 5 to 8 percent finer than
75 µm (Table A1). Sulfur contents of the 14 samples ranged from 0.04 to 1.22 percent, and the
sulfate-sulfur content exceeded 0.016% in only one sample (Table 1).
Quartz (24-77%), chlorite (10-55%), and sericite (5-42%) contributed 90 to 98 weight
percent of the mineral content in 13 of the 14 samples (Table 1). The exception was the 0.72%-S
sample, in which the contribution of these three minerals was 77 percent and siderite

(Fe1.79Mn0.15Mg0.13Ca0.003Na0.07(CO3)2) content was 17.9 percent. Appreciable siderite
(Fe1.74Mn0.13Mg0.18Ca0.004Na0.06(CO3)2) was also present in the 0.50%-S sample, contributing 4.6
weight percent of the sample mass.
Table 1. Summary of sample compositions. Values in weight percent.
%S %SO4-S CO2 Pyrite Quartz Chlorite Sericite Siderite 0.04 <0.016 <0.05 0.1 29 55 12 <0.1 0.05a <0.016 <0.05 0.1 24 30 42 <0.1 0.05b <0.016 <0.05 0.1 24 39 32 <0.1 0.10 <0.016 <0.05 0.2 56 26 13 <0.1 0.12 <0.016 <0.05 0.2 28 41 28 <0.1 0.16a <0.016 <0.05 0.3 48 31 13 <0.1 0.16b <0.016 <0.05 0.3 42 35 19 <0.1 0.20 <0.016 0.05 0.4 72 14 12 0.1 0.26 <0.016 <0.05 0.5 68 14 8 <0.1 0.39 0.016 <0.05 0.7 59 21 16 <0.1 0.50 0.033 1.76 0.9 59 12 21 4.6 0.59 <0.016 <0.05 1.1 77 10 5 <0.1 0.72 <0.016 6.85 1.4 51 12 14 17.9 1.22 0.016 <0.05 2.2 48 33 13 <0.1
Pyrite was the only sulfide mineral reported, in quantities of 0.1 to 2.2 percent. Based on the
overall mineralogy and chemistry, the small amounts of sulfate were assumed to be present as
melanterite, with contents not exceeding 0.3 percent (Mattson, 2000). Pyrite grains ranged from
coarse (600 µm) “to very fine (<10 µm) grains intergrown with the gangue minerals.” The
distribution of pyrite grain sizes was fairly constant among the samples. Pyrite content, as
inferred by sulfur content, tended to increase as particle size decreased (Table A2). Pyrite
liberation in the !300 µm or !200 µm fractions was generally greater than 50 percent, with little
liberation in the coarser fractions (Mattson, 2000). The extent of liberation increased as particle
size decreased below 300 µm, and was generally greater than or equal to 90 percent for particles
less than 106 µm in diameter (Table A3).

Drainage Volume and Water Retention
Each week 500 mL of water was added to each cell. For each sample, the mass of water
retained after this addition was fairly stable over the course of the experiment and decreased only
slightly during the weekly cycle. One day after the addition the mean water retention in 12 of
the solids ranged from 129 to 153 mL, indicating typical water retentions of 13 to 15 percent of
the solids weight. Mean water retention for the 0.72% S and 0.26% S solids averaged 111 and
163 mL, respectively. Based on the percentage of mass in the –850-µm fraction, the 0.72% S
sample was the coarsest of the solids tested and the 0.26% S sample was the finest (Table A1).
This suggests, quite reasonably, that the water retention was a function of particle size
distribution. The water retention for each cell was fairly consistent, and the standard deviations
for the 14 samples ranged from three to eight percent of the mean value. The mean water
retention prior to water addition indicated that, on average, the cells lost two to ten mL of water
to evaporation during the weekly cycle (Table A4).
One implication of the water retention values is that the finer particles in the cells were very
likely water saturated. These particles have a relatively high specific surface area and are,
therefore, more reactive per unit mass. The pyrite in the finer fractions is also more likely to be
liberated from the rock matrix and, therefore, exposed for reaction.
Sulfate Release Rates
The replication of both drainage pH and sulfate release rates was excellent. For each of the
four pairs of duplicate samples, drainage pH and sulfate release rates were determined for three
different rate periods (20-60, 60-100, 100-154 weeks) over a period of roughly 2.5 years. For the
twelve comparative sets of data, median drainage pH values differed by no more than 0.07 units,
and the difference from the mean for sulfate release rates was less than five percent (Table 2).
Variation of sulfate release rates within a rate period was generally within about 25 percent
of the mean value. Sulfate release rates were calculated as the mean of the weekly rates during
the specified period. The standard deviation for each period was also calculated to provide a
measure of variability within the rate period. The standard deviations ranged from 0.04 to 0.35
times the mean rate, although the typical range for this fraction was roughly 0.08 to 0.25 (Table
2).

Sulfate release rates tended to increase with increasing sulfur content. This trend was
observed for all rate periods and was depicted by plotting the sulfate release rate after week 20 as
a function of sulfur content to provide an overview of the entire data set (Fig. 1). Data from
samples generating high drainage pH values tended to fall below the regression line, and the
opposite trend was observed for samples generating low drainage pH.
Table 2. Observed sulfate release rates in µmol (kg rock)-1wk-1.
Weeks 20-60 Weeks 60-100 Weeks 100-154 Weeks 154-204 dSO4/dt dSO4/dt dSO4/dt dSO4/dt %S
pHmed rate s.d.
pHmed rate s.d.
pHmedrate s.d.
pHmedrate s.d.
Ratefinal/ Rateinitial
0.04 7.26 4.98 0.91 7.04 4.46 0.74 7.12 3.94 0.39 7.01 3.16 0.26 0.63
0.05a1 7.05 7.81 1.26 6.88 6.57 1.29 6.69 4.89 0.60 6.58 3.88 0.30 0.50
0.05b1 7.05 5.42 1.19 6.87 4.87 0.91 6.72 4.30 0.62 6.56 4.09 1.2 0.75
0.10 rep 1 6.74 13.0 1.70 6.37 11.7 1.36 6.00 9.58 1.7 5.90 6.92 1.6 0.53
0.10 rep 2 6.69 13.6 1.11 6.31 11.6 1.37 6.06 10.5 1.4 Ended week 154 0.77
0.12 6.66 15.7 2.45 6.33 10.7 1.84 6.18 8.38 1.7 6.02 6.91 0.45 0.44
0.16a1 6.76 20.3 2.23 6.34 19.4 2.65 6.15 17.1 4.3 5.91 13.8 0.51 0.68
0.16b1 rep 1 6.38 18.2 2.39 6.06 15.0 2.15 5.78 13.4 2.9 5.61 10.8 0.68 0.59
0.16b1 rep 2 6.43 18.3 2.05 5.99 15.9 2.85 5.82 13.3 2.9 Ended week 154 0.73
0.20 4.54 58.8 10.6 4.15 66.6 9.91 4.13 58.4 15.0 4.10 46.2 3.4 0.79
0.26 4.78 85.4 11.6 3.95 90.8 7.14 3.87 94.7 18.0 Ended week 154 1.10
0.39 4.35 103 21.5 3.97 120 28.5 3.96 110 38.0 Ended week 154 1.07
0.50 5.04 186 41.7 5.63 116 16.5 6.47 92.5 22.1 6.88 69.3 5.2 0.37
0.59 rep 1 3.33 361 61.9 3.29 311 34.3 3.36 280 74.0 3.45 195 17.6 0.54
0.59 rep 2 3.29 379 70.4 3.27 331 46.5 3.35 293 79.0 Ended week 154 0.77
0.72 7.16 106 22.1 7.68 98.3 28.1 7.84 89.9 15.0 7.81 99.4 12.4 0.94
1.22 rep 1 3.67 244 46.5 3.51 300 66.6 3.55 301 83.0 Ended week 154 1.23
1.22 rep 2 3.63 266 44.5 3.47 305 34.0 3.50 289 29.0 3.50 274 22.6 1.03 1 Sulfur contents followed by “a” and “b” signify two different samples.
As sulfur content increased, drainage pH tended to decrease (Table 2). However, the 0.50%-
S and 0.72%-S solids produced higher drainage pH than would be expected based on the general
relationship between sulfur content and drainage pH. Dissolution of the magnesium carbonate
fraction of the siderite present in these samples neutralized much or all of the acid produced as a

result of pyrite oxidation, thus elevating drainage pH. Despite their higher sulfur contents, the
sulfate releases per unit exposed pyrite area from these samples were consistent with those of the
lower sulfur content samples that generated relatively high pH. This further demonstrates that
pH, in addition to pyrite surface area, influences rates of sulfate release.
Figure 1. Average sulfate release rates after week 20 tended to increase with increasing sulfur content. Samples generating high pH (blue diamonds represent median pH values above 6) tended to fall below the regression line, and those generating low pH (red circles represent median pH values below 6) tended to fall above the regression line.
As would be expected, sulfate release rates tended to decrease with time, and rates during
weeks 154-204 were typically 50 to 80 percent of those during weeks 20-60 (Table 2). Pyrite
depletion and development of iron oxyhydroxide coatings on the pyrite surfaces may have
contributed to decreasing release rates. The extent of pyrite depletion, as indicated by sulfate
release, typically ranged from 5 to 9% for samples with median pH values of at least 4.18 and 15
to 30% for lower pH samples (Table A5). Samples with sulfur contents of 0.26, 0.39, 0.72, and
1.22 percent did produce final rates that were near or above those generated initially, although
the period of record for the first two samples was limited to 154 weeks.
Pyrite Oxidation Rates
Sulfate release rates and estimated exposed pyrite surface areas were used to determine
normalized oxidation rates for pyrite in the samples. It was assumed that 1) all sulfate release
was due to oxidation of pyrite (the only sulfide mineral reported present), 2) all sulfate released
by pyrite oxidation was transported with the drainage, and 3) only exposed pyrite surfaces
y = 250x - 4.0R2 = 0.76
0
100
200
300
0.0 0.5 1.0 1.5
Percent Sulfur
dSO 4
/dt,
umol
(kg
rock
)-1
wk-1

oxidized and this exposure was approximated by that of liberated pyrite grains (i.e. oxidation of
interstitial or included pyrite was negligible).
With regard to the first assumption, it should be noted that small amounts of sulfate were
present in the rock, and it was assumed to be present as melanterite (see previous section on rock
composition). It was assumed that any melanterite, or other soluble sulfate minerals, was
removed with the three rinses prior to experimentation and within the first few weeks of the
experiment. Rates presented in this paper reflect drainage quality after week 20, well beyond the
expected period of melanterite dissolution. With regard to the second assumption, chemical
precipitation or inefficient rinsing of soluble reaction products can limit transport. Chemical
precipitation is unlikely because calcium concentrations were low, and sulfate concentrations
were more than two orders of magnitude below gypsum saturation. The rinsing efficiency was
likely quite high since the weekly rinse volume was in excess of two pore volumes and the rinse
water was allowed to remain in contact with the solids for at least ten minutes.
Two approaches were used to determine pyrite oxidation rates, and both used the exposed
pyrite surface area determined based on the solid-phase analyses. However, different periods for
sulfate release and methods of data analysis were applied. In the first approach, the sulfate
release observed for weeks 20-204 (or 20-154 for the 0.20%-S and 0.26%-S samples) was used.
For replicated samples, only the cell with the longer period of record was used. Thus, the data
used included roughly 90 percent of the three- to four-year period of record for 14 samples. It
should be noted, however, that this assessment ignores changes in drainage pH and sulfate
release rates over time and is intended as an initial estimation of the pyrite oxidation rates.
These data were analyzed by regressing half the rate of sulfate release against the exposed pyrite
surface area (Table A5). The sulfate release rate was multiplied by 0.5 to account for the fact
that one mole of sulfate release implies oxidation of one half mole pyrite (FeS2).
As indicated in Figure 1, sulfate release rates were related to drainage pH. Based on
inspection of data, the regression was conducted for rates with median drainage pH from 4.02 to
7.67 (Fig. 2). For this pH regime, the regression yielded a pyrite oxidation rate of 6.9 × 10⁻¹⁰
mol m−2s−1 (r2 = 0.85 and n = 12). Inserting these pH values and a dissolved oxygen
concentration of 2.6 × 10⁻⁴ mol kg−1 into equation 2 (Williamson and Rimstidt, 1994) yields
respective predicted rates of 2.9 × 10⁻¹⁰ and 7.3 × 10⁻¹⁰ mol m−2s−1 for the abiotic oxidation of
pyrite by oxygen. Thus, the pyrite oxidation rate determined using average sulfate release rates

observed after week 20 for median pH values of 4.02 to 7.67 was at the upper end of the
predicted range. This is consistent with the abiotic oxidation of pyrite by oxygen.
Figure 2. Average sulfate release rates after week 20 were regressed against exposed pyrite surface areas to obtain pyrite oxidation rates. The twelve blue diamonds and solid line represent samples with median pH values of 4.18 to 7.67. The red circles represent samples with median pH values of 3.35 and 3.53 and were not included in the regression.
For the remaining two samples, the median pH values were 3.35 and 3.53. The observed
sulfate release rates at these pH values were roughly twice those predicted based on the linear
regression analysis (Table A5). Although this is not a large difference, it suggests that
mechanisms other than abiotic oxidation by oxygen, most likely reaction with ferric iron, may
have influenced pyrite oxidation. Nordstrom (1982) indicated this reaction becomes more
dominant as pH decreases below 4.5, although the results in Figure 2 suggest a threshold value in
the neighborhood of pH 3.5 for the pyrite present in the greenstone rock.
In the second approach, pyrite oxidation rates were calculated for all 14 individual samples
and four replicates during weeks 20-60. Rates for weeks 20-60 were selected as the most
appropriate for presentation because effects of iron oxyhydroxide coating on pyrite mineral
surfaces would be minimized. The rates determined ranged from roughly 4 × 10⁻¹⁰ to 18 × 10−10
mol m−2s−1 (Table 3). The calculated rates increased slightly with decreasing pH, and for median
drainage pH ranges above 3.5 (observed range of 3.63 to 7.26 for 13 samples) the maximum rate
was roughly 2.5 times the minimum rate. The 0.59 %S samples generated median pH values
near 3.3 and the calculated pyrite oxidation rates were roughly four times the minimum
y = 6.9E-10x - 4.7E-13R2 = 0.85
0
5E-11
1E-10
1.5E-10
2E-10
2.5E-10
0 0.05 0.1 0.15 0.2 0.25
Exposed pyrite surface area, m2 kg-1
0.5
x dS
O4/d
t, m
ol (k
g ro
ck)-1
s-1

observed. The logarithm of rates was plotted against pH, with data from duplicated samples
averaged. Regression analysis yielded a slope of –0.1 for the 14 samples (r2 = 0.68) (Fig. 3).
This slope indicates that the variation of calculated pyrite oxidation rates with drainage pH was
relatively small.
Table 3. Comparison of pyrite oxidation rates observed in the laboratory during weeks 20-60 to those predicted by Williamson and Rimstidt (1994).
Sulfate release rate, weeks 20-60
µmol (kg rock)-1wk-1
dFeS2/dt, mol m-2 s-1 × 10⁻¹⁰ % S pHmed
Rate s.d.
Exposed FeS2 surface area,
m2 kg-1 Obs. Pred3
dFeS2/dt, obs/ pred
0.04 7.26 4.98 0.91 0.0096 4.3 6.6 0.65 0.05a1 7.05 7.81 1.26 0.013 5.0 6.2 0.80 0.05b1 7.05 5.42 1.19 0.0090 5.0 6.2 0.80 0.10 rep 1 6.74 13.0 1.70 0.018 6.0 5.8 1.04 0.10 rep 22 6.69 13.6 1.11 0.018 6.2 5.7 1.10 0.12 6.66 15.7 2.45 0.021 6.2 5.7 1.09 0.16a1 6.76 20.3 2.23 0.023 7.3 5.8 1.26 0.16b1 rep 1 6.38 18.2 2.39 0.026 5.8 5.3 1.10 0.16b1 rep 22 6.43 18.3 2.05 0.026 5.8 5.3 1.09 0.20 4.54 58.8 10.6 0.077 6.3 3.3 1.91 0.262 4.78 85.4 11.6 0.066 10.7 3.5 3.05 0.392 4.35 103 21.5 0.096 8.9 3.1 2.82 0.50 5.04 186 41.7 0.14 10.3 3.7 2.74 0.59 rep 1 3.33 361 61.9 0.17 17.6 2.4 7.22 0.59 rep 22 3.29 379 70.4 0.17 18.4 2.4 7.66 0.72 7.16 106 22.1 0.12 7.3 6.4 1.14 1.22 rep 1 3.67 244 46.5 0.21 9.6 2.7 3.63 1.22 rep 2 3.63 266 44.5 0.21 10.5 2.6 3.99
1 Sulfur contents followed by “a” and “b” signify two different samples. 2 Terminated at week 154 and sulfate release rates are for weeks 100-154. 3 Predicted rates based on Williamson and Rimstidt (1994) = dFeS/dt = 10-8.19 (±0.10)mDO
0.5(±0.04)mH+(-0.11 ±0.01);
mDO=2.625×10⁻⁴, assuming O2 saturation at 25 °C.
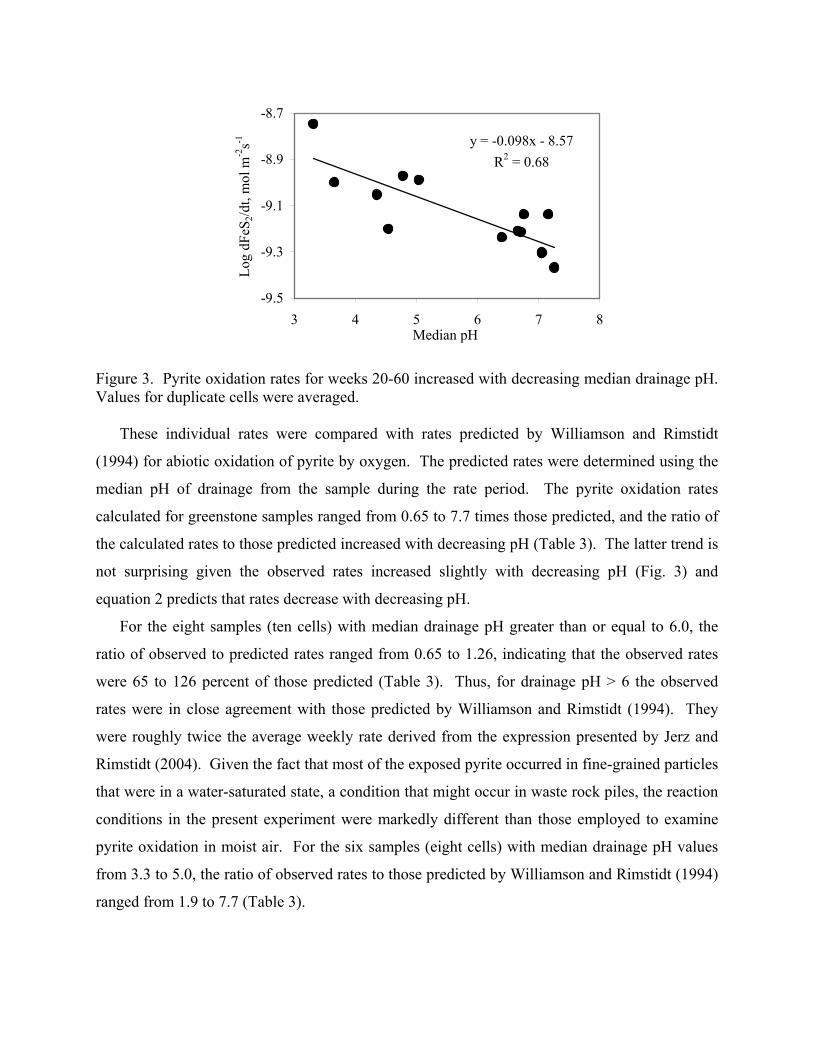
Figure 3. Pyrite oxidation rates for weeks 20-60 increased with decreasing median drainage pH. Values for duplicate cells were averaged.
These individual rates were compared with rates predicted by Williamson and Rimstidt
(1994) for abiotic oxidation of pyrite by oxygen. The predicted rates were determined using the
median pH of drainage from the sample during the rate period. The pyrite oxidation rates
calculated for greenstone samples ranged from 0.65 to 7.7 times those predicted, and the ratio of
the calculated rates to those predicted increased with decreasing pH (Table 3). The latter trend is
not surprising given the observed rates increased slightly with decreasing pH (Fig. 3) and
equation 2 predicts that rates decrease with decreasing pH.
For the eight samples (ten cells) with median drainage pH greater than or equal to 6.0, the
ratio of observed to predicted rates ranged from 0.65 to 1.26, indicating that the observed rates
were 65 to 126 percent of those predicted (Table 3). Thus, for drainage pH > 6 the observed
rates were in close agreement with those predicted by Williamson and Rimstidt (1994). They
were roughly twice the average weekly rate derived from the expression presented by Jerz and
Rimstidt (2004). Given the fact that most of the exposed pyrite occurred in fine-grained particles
that were in a water-saturated state, a condition that might occur in waste rock piles, the reaction
conditions in the present experiment were markedly different than those employed to examine
pyrite oxidation in moist air. For the six samples (eight cells) with median drainage pH values
from 3.3 to 5.0, the ratio of observed rates to those predicted by Williamson and Rimstidt (1994)
ranged from 1.9 to 7.7 (Table 3).
y = -0.098x - 8.57R2 = 0.68
-9.5
-9.3
-9.1
-8.9
-8.7
3 4 5 6 7 8Median pH
Log
dFeS
2/dt,
mol
m-2
s-1

The increase in calculated pyrite oxidation rates with decreasing pH (Fig. 3) suggests that
oxidation by ferric iron might have become more influential as pH decreased, particularly as pH
decreased below 3.5, a value consistent with that indicated by Figure 2. The extent of oxidation
by ferric iron does not appear to be great. Although rates increased at low pH, they appear to be
substantially lower than the rate predicted for abiotic oxidation of pyrite by ferric iron by
Williamson and Rimstidt (1994). It is possible that the retention time in the cells was inadequate
for substantial oxidation of ferrous iron to occur, especially if bacterial mediation of this reaction
was small.
It is also possible that the specific surface area of pyrite increased as sulfur content increased.
This could occur if pyrite surfaces in the higher sulfur solids were rougher or if characteristic
pyrite grain size in the –75 µm fraction decreased as sulfur content increased. This would yield a
larger pyrite surface area as sulfur content increased which would, in turn, lead to more rapid
sulfate release. However, the pyrite oxidation rate determined for the 0.72%-S sample was
consistent with that observed for the lower-sulfur solids, all of which generated drainage pH
values above 6.0. This suggests that the increase in oxidation rates at low pH was due to
mechanisms other than the abiotic reaction of pyrite and oxygen.
Assessment of Calculated Rates
The pyrite oxidation rates calculated for the greenstone samples were based on
determinations of sulfur content, particle size distribution, degree of pyrite liberation, a surface
roughness factor for the pyrite present, and the observed rate of sulfate release with humidity cell
drainage. The agreement between the mass-weighted sulfur content determined from the various
size fractions and the bulk sample sulfur content suggests the sulfur determinations did not
introduce substantial error. Rates were calculated based on the analyses of the size fractions, and
the mass-weighted mean sulfur contents were generally 0.8 to 1 times the bulk sulfur contents
(Table A2). A 20 percent underestimation of sulfur content in the finest fractions would result in
a 25 percent overestimation of the pyrite oxidation rate.
The particle size distribution was determined by dry sieving and was shown to be subject to
error. Two samples were wet sieved and the pyrite surface area calculated was roughly 26
percent higher than that determined by dry sieving, due to the increased mass of the –75 µm
fraction with wet sieving. The wet-sieved data were believed to be more accurate, and the dry-

sieved –75 µm fractions were multiplied by 1.26 to account for the difference in methods.
Nonetheless, more rigorous determination of the wet-sieved particle size distribution would be
beneficial. Furthermore, the calculation is sensitive to the minimum pyrite diameter. A
minimum diameter of 10 µm was selected based on the observation that finer grains were
intergrown with gangue minerals (Mattson, 2000). Changing the minimum diameter to 5 µm
would increase the calculated pyrite surface area of the 10-75 µm fraction and decrease the
calculated pyrite oxidation rate by roughly 40 percent.
Although error introduced by pyrite liberation assessments are believed to be small, the
surface roughness factor of the pyrite present was not determined directly. A value of 2.6 was
used for calculations and is at the lower end of the range of surface roughness factors reported
for pyrite. For example, surface roughness factors of 2.4, 3.7, 5.2, 5.5, and 7.6 were calculated
from data presented by Moses and Herman (1991), McKibben and Barnes (1986), Kamei and
Ohmoto (2000), Jantzen et al. (1997), and Williamson and Rimstidt (1994), respectively. The
use of a roughness factor of 7.6 would have resulted in rates roughly one-third of those
determined. However, all of these studies determined BET surface areas on pyrite that had been
crushed or ground. Drill core samples in the present study were subjected to crushing using jaw
crushers set at 1.92 and 0.95 cm and a roll crusher set at 0.64 cm. Relative to directly crushing
pyrite, this method of size reduction most likely had minimal impact on the surface of pyrite
grains that were less than 600 µm in diameter. Consequently, it is believed that the surfaces
would tend to be smoother than those subjected to more rigorous crushing and grinding and,
therefore, a surface roughness factor at the lower end of the range was appropriate.
In contrast to exposed pyrite surface area determinations, error introduced by the sulfate
release rates used to calculate pyrite oxidation rates was likely small. Each of these rates was
based on at least ten measurements, and the standard deviations determined indicate that
variation within rate periods was not excessive. Furthermore, sulfate release rates from four sets
of duplicate samples replicated very well over the course of the experiment.
Thus, most of the uncertainty in the calculated rates of pyrite present in greenstone rock
samples was related to determination of surface area. Although care was taken to ensure the
error introduced by solid phase analyses was relatively small, additional work could be
conducted to reduce uncertainty in the calculations. Wet-sieving existing splits sample would
increase the accuracy of the particle size distribution, particularly the fine size fractions in which

pyrite is largely liberated. Additional detailed examination of grain size and surface roughness
of pyrite present in the fine fractions would provide a check on the initial analysis. Direct
determination of the specific surface area of pyrite would further increase the integrity of the
data.
Conclusions
Laboratory dissolution studies were conducted on well-characterized Archean greenstone
rock in which pyrite was the only sulfide mineral identified. The exposed pyrite surface area
was calculated for samples tested based on particle size distribution and sulfur content and
degree of pyrite liberation in individual size fractions. Rates of pyrite oxidation were determined
based on the exposed pyrite surface area calculated and the sulfate release observed in drainage.
The laboratory rates calculated for samples generating drainage pH values above six were in
close agreement with those predicted for the abiotic oxidation of pyrite by dissolved oxygen
(Williamson and Rimstidt, 1994). The calculated oxidation rates increased slightly with
decreasing drainage pH and the dependence appeared to increase as drainage pH decreased
below 3.5. This suggests mechanisms other than abiotic oxidation by oxygen might be
influential at lower pH.
Acknowledgements
Funding for this phase of the project was provided by the US BLM Utah State office, the US
BLM Applications of Science program, the Minnesota Environmental Cooperative Research
(ECR) program, and the Minnesota Department of Natural Resources. Previous funding was
provided by the Minnesota Minerals Coordinating Committee and the Minnesota ECR program.
Rick Ruhanen provided geological expertise on Minnesota greenstone terranes and provided
input on sample selection for the laboratory dissolution tests. Anne Jagunich and Patrick
Geiselman assisted John Folman in conducting the experiment. Sue Saban provided data input.
Mark Williamson provided beneficial comments on pyrite oxidation rates. Stephen Day, Jeff
Fillipone, Bill White, Jennifer Engstrom, and Mike Berndt provided diligent reviews that
substantially improved the final manuscript.

Literature Cited
ASTM. 2000. D5744-96, Standard test method for accelerated weathering of solid materials
using a modified humidity cell. p. 257-269. In: Annual Book of ASTM Standards, 11.04.
American Society for Testing and Materials, West Conschohocken, Pennnsylvania.
American Public Health Association (APHA), American Water Works Association, Water
Environment Federation. 1992. Standard Methods for the Examination of Water and
Wastewater, 18th edition. American Public Health Association, Washington, D.C.
Crock, J. G., Lichte, F. E., and Briggs, P. H. 1983. Determination of elements in National
Bureau of Standards’ geological reference materials SRM 278 obsidian and SRM 688 basalt
by inductively coupled argon plasma-atomic emission spectrometry. Geostandards
Newsletter, 7. p. 335-340.
Hoffman, E.L. 1992. Instrumental neutron activation in geoanalysis. Jour. Geochem. Explor.,
44. p. 297-319.
Janzen, M.P., R.V., Nicholson and J.M. Scharer. 1997. The role of enhanced particle surface
area, crystal structure and trace metal content on pyrrhotite oxidation rates in tailings. p. 399-
415. In: Proceeding of the Fourth International Conference on Acid Rock Drainage. Vol. 1.
Vancouver, British Columbia, May 31 - June 6, 1997.
Jerz, J.K. and D.J. Rimstidt. 2004. Pyrite oxidation in moist air. Geochchim. Cosmochim. Acta
68. p. 701-714.
Kamei, G., ahd H. Ohmoto. 2000. The kinetics of reactions between pyrite and O2-bearing
water revealed from in situ monitoring of DO, Eh, and pH in a closed system. Geochchim.
Cosmochim. Acta 64. p. 2585-2601.
Kleinmann, R.L.P., D.A. Crerar and R.R. Pacelli. 1981. Biogeochemistry of acid mine drainage
and a method to control acid formation. Mining Eng. March 1981.
Lapakko, K.A. and D.A. Antonson. 2001. Laboratory drainage pH and sulfate release rates
from Archean Greenstone rock. p. 384-393. In: Securing the Future, International
Conference on Mining and the Environment. June 25-July 1, SkellefteD, Sweden.
Lapakko, K.A. and D.A. Antonson. 2002. Drainage pH, acid production, and acid neutralization
for Archean greenstone rock. Preprint 02-73. In: Proc. 2002 SME Annual Meeting,
February 25-27, Phoenix, AZ (CD-ROM). Soc. For Mining, Metallurgy, and Exploration,
Inc. Littleton, CO.
Lapakko, K. A., J.N. Wessels. 1995. Release of acid from hydrothermal quartz-carbonate
hosted gold-mine tailings. p. 139-148. In: Sudbury '95, Conference on Mining and the
Environment, Sudbury, Ontario, May 28th - June 1st, 1995.
Lapakko, K.A. and W.W. White III. 2000. Modification of the ASTM D5744-96 kinetic test. p.
631-639. In: Proc. from the Fifth International Conference on Acid Rock Drainage. SME,
Littleton, CO.
Mattson, L.A. 2000. Soudan mine cavern sample mineralogy. Report to Minnesota Department
of Natural Resources from Louis A. Mattson, Mineralogical Consulting Service, Pengilly,
MN. 27 September 2000. 6 p.
Mattson, L.A. 2001. Personal communication with Louis A. Mattson, Mineralogical Consulting
Service, Pengilly, MN. January 2001.
Minnesota Department of Natural Resources. 2000. Unpublished data for tailings sample T9 in
the experiment on dissolution of hydrothermal quartz carbonate gold tailings. Minnesota
Department of Natural Resources, Division of Lands and Minerals, St. Paul, MN.
McKibben, M.A. 1984. Kinetics of aqueous oxidation of pyrite by ferric iron, oxygen, and
hydrogen peroxide from pH 1-4 and 20-40oC. Ph.D. thesis. Pennsylvania State University.
McKibben, M.A. and J.L Barnes. 1986. Oxidation of pyrite in low temperature acidic solutions:
Rate laws and surface textures. Geochim. Cosmochim. Acta 50. p. 1509-1520.
Moses, C.O. J.S. Herman. 1991. Pyrite oxidation at circumneutral pH. Geochim. Cosmochim.
Acta 55. p. 471-482.
Nicholson, R.V., R.W. Gillham and E.J. Reardon. 1988. Pyrite oxidation in carbonate-buffered
solution: 1. Experimental kinetics. Geochim. Cosmochim. Acta 52. p. 1077-1085.
Nordstrom, D. K. 1982. Aqueous pyrite oxidation and the consequent formation of secondary
iron minerals. p. 37-56. In: Acid Sulfate Weathering. K.A. Cedric, D.S. Fanning, and I.R.
Hossner (eds.), Soil Sci. Soc. America Spec. Pub. 10.
Nordstrom, D.K. and C.N. Alpers. 1999. Geochemistry of acid mine waters. In: The
Environmental Geochemistry of Mineral Deposits. Part A: Processes, Techniques, and
Health Issues. p. 133-160. Vol. 6A, Ch. 4. Reviews in Economic Geology. Society of
Economic Geologists, Inc., Chelsea, MI.

Parks, G.A. 1990. Surface energy and adsorption at mineral-water interfaces: An introduction.
Reviews in Mineralogy 23. p. 133-175.
Singer, P.C. and W. Stumm. 1970. Acid mine drainage: The rate determining step. Science,
167. p. 1121-1123.
Smith E.E. and L.S. Shumate. 1970: Sulfide to sulfate reaction mechanism: A study of the
sulfide to sulfate reaction mechanism as it relates to the formation of acid mine waters. U.S.
Dep. of Inter., Fed. Water Poll. Control Adm., Water Poll. Control. Res. Ser.; FWPCA Grant
FPS #14010-FPS-OS-70. Washington, D.C. 115 p.
White, A.F. and S.L. Brantley. 1995. Chemical Weathering Rates of Silicate Minerals, Reviews
in Mineralogy Volume 31. Mineralogical Society of America, Washington, D.C. 583 p.
Williamson, M.A. and J.D. Rimstidt. 1994. The kinetics and electrochemical rate-determining
step of aqueous pyrite oxidation. Geochim. Cosmochim. Acta, 58. p. 5443-5454.
Appendix Table A1. Particle size distribution with values in percent mass retained. For particles larger than 850 µm, pyrite surface area was negligible.
Particle diameter, µm%S
10-75 75-106 106-150 150-212 212-300 300-500 500-600 600-850 −850 0.04 5.5 1.4 1.9 2.2 2.9 3.5 4.0 6.9 28.3 0.05a 5.8 1.2 1.7 2.1 2.8 3.5 3.8 8.5 29.4 0.05b 6.2 1.2 1.8 2.2 2.9 3.7 4.2 7.2 29.4 0.10 4.9 1.6 2.1 2.5 3.2 4.0 4.5 6.9 29.7 0.12 5.6 1.2 1.8 2.2 2.9 3.7 4.0 8.5 29.9 0.16a 5.1 1.3 2.0 2.3 3.0 3.8 4.0 9.0 30.5 0.16b 6.9 1.5 2.1 2.4 3.3 3.9 4.2 6.7 31.0 0.20 7.2 1.2 1.6 2.1 2.9 3.7 4.4 6.9 30.0 0.26 7.3 1.7 2.2 2.8 3.4 4.8 4.9 7.6 34.7 0.39 7.0 1.2 1.6 1.7 3.2 3.6 4.2 6.7 29.2 0.50 7.9 1.4 1.9 2.4 3.2 4.0 4.4 7.0 32.2 0.59 6.7 1.4 2.0 2.4 3.3 4.0 4.6 7.1 31.5 0.72 5.3 1.0 1.3 1.6 2.1 2.9 3.2 5.3 22.7 1.22 6.3 1.2 1.7 1.5 3.6 3.6 4.0 6.2 28.1
Range 4.9-7.9 1.0-1.7 1.3-2.2 1.5-2.8 2.1-3.6 2.9-4.8 3.2-4.9 5.3-9.0 22-35

Appendix Table A2. Percent sulfur in discrete size fractions. For particles larger than 850 µm, pyrite surface area was negligible.
Particle diameter, µm %S
Bulk 10- 75
75- 106
106- 150
150-212
212-300
300-500
500-600
600-850
Mass Weighted
Mean1
Mass Wtd/ Bulk
0.04 0.06 0.05 0.04 0.04 0.03 0.02 0.02 0.02 0.02 0.50
0.05a 0.07 0.11 0.09 0.08 0.06 0.05 0.07 0.07 0.06 1.20
0.05b 0.05 0.07 0.05 0.06 0.05 0.05 0.04 0.05 0.04 0.80
0.10 0.12 0.11 0.10 0.08 0.08 0.07 0.07 0.07 0.07 0.70
0.12 0.13 0.15 0.10 0.11 0.11 0.09 0.09 0.10 0.10 0.83
0.16a 0.15 0.13 0.12 0.11 0.10 0.11 0.13 0.16 0.13 0.81
0.16b 0.12 0.11 0.11 0.11 0.11 0.11 0.13 0.12 0.12 0.75
0.20 0.39 0.43 0.27 0.17 0.17 0.18 0.18 0.17 0.18 0.90
0.26 0.32 0.28 0.24 0.23 0.21 0.19 0.20 0.22 0.22 0.85
0.39 0.47 0.51 0.51 0.41 0.36 0.33 0.32 0.34 0.37 0.95
0.50 0.65 0.65 0.53 0.53 0.50 0.48 0.49 0.47 0.50 1.00
0.59 0.90 0.66 0.61 0.58 0.59 0.57 0.59 0.61 0.57 0.97
0.72 0.78 0.95 0.97 0.94 0.94 0.82 0.65 0.72 0.65 0.90
1.22 1.16 1.02 0.79 0.72 0.67 0.75 0.81 0.89 1.1 0.90 1 Determined from masses and sulfur contents of individual size fractions, including fractions larger than 850 µm. Appendix Table A3. Percent pyrite liberation in discrete size fractions. For particles larger than 850 µm, liberation in all samples was zero.
Particle diameter, µm%S 10-75 75-106 106-150 150-212 212-300 300-500 500-600 600-850
0.04 97 90 77 68 52 0 0 00.05a 98 95 90 86 74 0 0 0 0.05b 92 89 67 56 51 46 0 0 0.10 96 91 82 74 45 0 0 0 0.12 96 93 82 57 0 0 0 0 0.16a 98 91 86 73 54 0 0 0 0.16b 99 92 84 73 69 49 43 14 0.20 95 92 78 43 18 11 0 0 0.26 97 83 68 43 26 4 0 0 0.39 95 92 83 75 68 42 33 18 0.50 95 89 84 68 61 53 47 31 0.59 96 91 72 57 22 16 7 0 0.72 94 90 88 82 74 59 8 4 1.22 97 89 89 71 37 8 <5 <5
Range 92-99 83-95 67-90 43-86 0-74 0-59 0-47 0-31

Appendix Table A4. Water retention summary statistics for the greenstone samples. Before leach weight (g)1 After leach weight (g)2 %S n1
mean s.d. mean s.d.
0.04 204 125 7.0 131 7.1 0.05a 204 144 12.4 148 11.2 0.05b 204 127 5.5 129 5.9 0.10 rep 1 204 130 6.5 140 6.0 0.10 rep 2 154 130 5.5 137 6.0 0.12 204 123 6.6 132 7.3 0.16a 204 134 6.5 140 6.8 0.16b rep 1 204 136 5.6 139 6.8 0.16b rep 2 154 133 6.1 141 6.1 0.20 204 141 7.0 147 8.2 0.26 154 156 4.3 163 5.0 0.39 154 144 8.3 153 8.7 0.50 204 142 7.3 151 7.6 0.59 rep 1 204 125 7.4 134 6.7 0.59 rep 2 154 127 8.1 134 9.2 0.72 204 105 8.4 111 9.0 1.22 rep 1 154 135 7.5 143 8.2 1.22 rep 2 204 146 8.1 151 8.3
1 before leach: prior to water addition 2 after leach: 1 day after water added
Appendix Table A5. Average sulfate release rates, exposed pyrite surface areas, and pyrite depletion for the period of record (weeks 20-204 except for 0.26% and 0.39%-S samples which were terminated at week 154).
pHmed dSO4/dt dSO4/dt × 0 5 FeS2 exposed FeS2 depletion%S s.u. µmol (kg rock)-1 wk-1 mol (kg rock)-1 s-1 m2 %
0.04 7.16 3.96 3.28E-12 0.0096 7.20.05a 6.90 5.48 4.54E-12 0.013 8.2 0.05b 6.88 4.5 3.73E-12 0.0090 6.4 0.1 6.38 10.1 8.36E-12 0.018 7.1
0.12 6.34 9.42 7.80E-12 0.021 6.2 0.16a 6.38 17.3 1.43E-11 0.023 7.5 0.16b 6.08 13.6 1.13E-11 0.026 6.2 0.2 4.18 57.4 4.75E-11 0.077 5.5
0.26 4.02 91.6 7.58E-11 0.066 27 0.39 4.03 111 9.19E-11 0.096 14 0.50 5.52 102 8.44E-11 0.15 16 0.59 3.35 277 2.29E-10 0.14 31 0.72 7.67 90.2 7.47E-11 0.12 9.2 1.22 3.53 288 2.38E-10 0.21 15
Related Documents