International Photovoltaic Reliability Workshop II Removing Barriers to Photovoltaic Technology Adoption: Reliability, Codes/Standards, and Market Acceptance July 29–31, 2009 – Tempe Mission Palms Hotel, Tempe, AZ Christopher Cameron Sandia National Laboratories Sandia is a multiprogram laboratory operated by Sandia Corporation, a Lockheed Martin Company, for the United States Department of Energy’s National Nuclear Security Administration under contract DE-AC04-94AL85000. PV Systems Modeling and Analysis Tools

Welcome message from author
This document is posted to help you gain knowledge. Please leave a comment to let me know what you think about it! Share it to your friends and learn new things together.
Transcript

International Photovoltaic Reliability Workshop IIRemoving Barriers to Photovoltaic Technology Adoption:
Reliability, Codes/Standards, and Market Acceptance
July 29–31, 2009 – Tempe Mission Palms Hotel, Tempe, AZ
Christopher CameronSandia National Laboratories
Sandia is a multiprogram laboratory operated by Sandia Corporation, a Lockheed Martin Company,for the United States Department of Energy’s National Nuclear Security Administration
under contract DE-AC04-94AL85000.
PV Systems Modeling and Analysis Tools
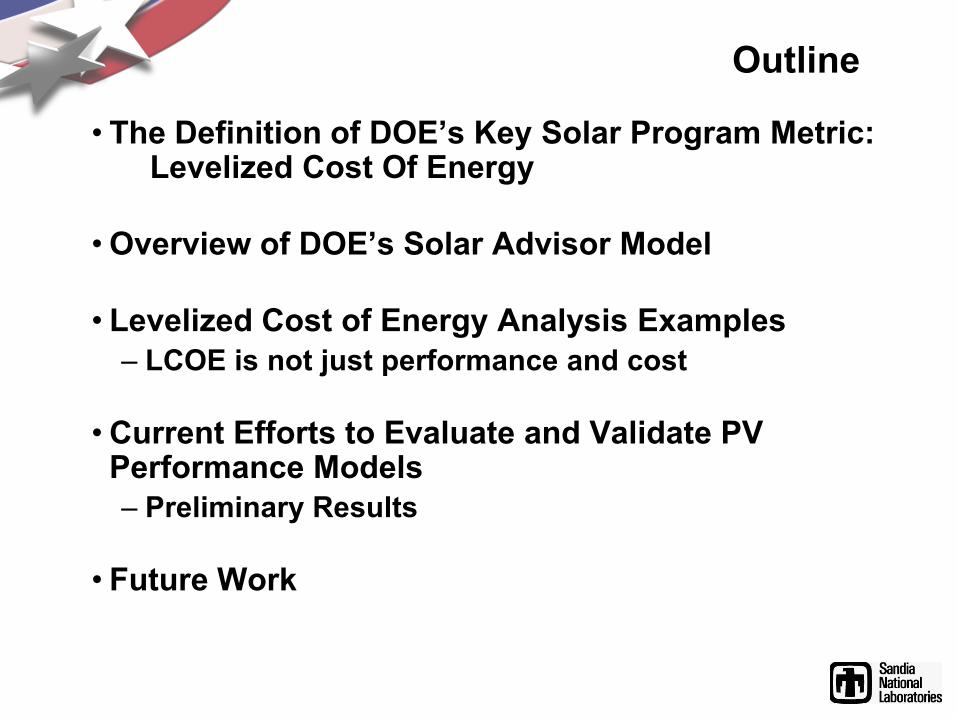
Outline
• The Definition of DOE’s Key Solar Program Metric: Levelized Cost Of Energy
•Overview of DOE’s Solar Advisor Model
• Levelized Cost of Energy Analysis Examples– LCOE is not just performance and cost
•Current Efforts to Evaluate and Validate PV Performance Models– Preliminary Results
• Future Work
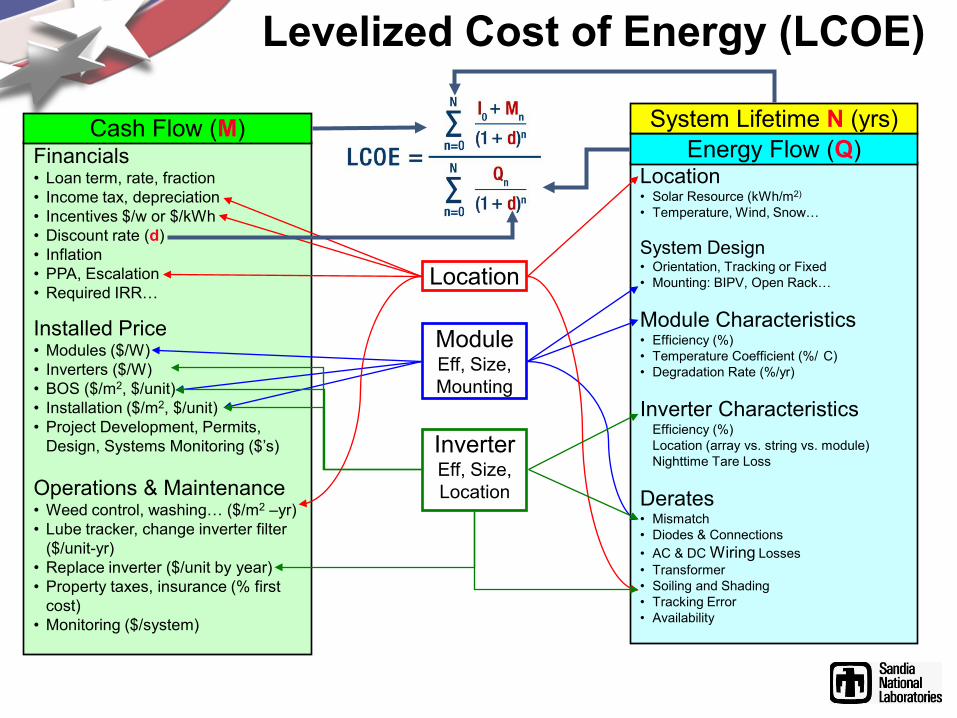
Financials• Loan term, rate, fraction• Income tax, depreciation• Incentives $/w or $/kWh• Discount rate (d)• Inflation• PPA, Escalation• Required IRR…
Installed Price• Modules ($/W)• Inverters ($/W)• BOS ($/m2, $/unit)• Installation ($/m2, $/unit)• Project Development, Permits,
Design, Systems Monitoring ($’s)
Operations & Maintenance• Weed control, washing… ($/m2 –yr)• Lube tracker, change inverter filter
($/unit-yr)• Replace inverter ($/unit by year)• Property taxes, insurance (% first
cost)• Monitoring ($/system)
Cash Flow (M)
Location• Solar Resource (kWh/m2)
• Temperature, Wind, Snow…
System Design• Orientation, Tracking or Fixed• Mounting: BIPV, Open Rack…
Module Characteristics• Efficiency (%)• Temperature Coefficient (%/ C)• Degradation Rate (%/yr)
Inverter CharacteristicsEfficiency (%)Location (array vs. string vs. module)Nighttime Tare Loss
Derates• Mismatch• Diodes & Connections• AC & DC Wiring Losses• Transformer• Soiling and Shading• Tracking Error• Availability
ModuleEff, Size, Mounting
Energy Flow (Q)System Lifetime N (yrs)
Location
Levelized Cost of Energy (LCOE)
InverterEff, Size, Location

DOE’s Solar Advisor Model (SAM)
Vision– Combine PV, CSP, thermal solar
technologies into a single model– Make high-quality performance
models developed by NREL, Sandia, and other partners available to a wider audience
– Facilitate comparison by handling performance, costs and financing consistently across technologies
– Facilitate calculating the impact of R&D on LCOE, NPV, etc. in various markets.
– Sensitivity analysis and graphing capabilities
– Over 6000 downloads• Download (no cost) at:
https://www.nrel.gov/analysis/sam
Thanks to Nate Blair and his colleagues at NREL for developing SAM
A Quick Tour of SAM
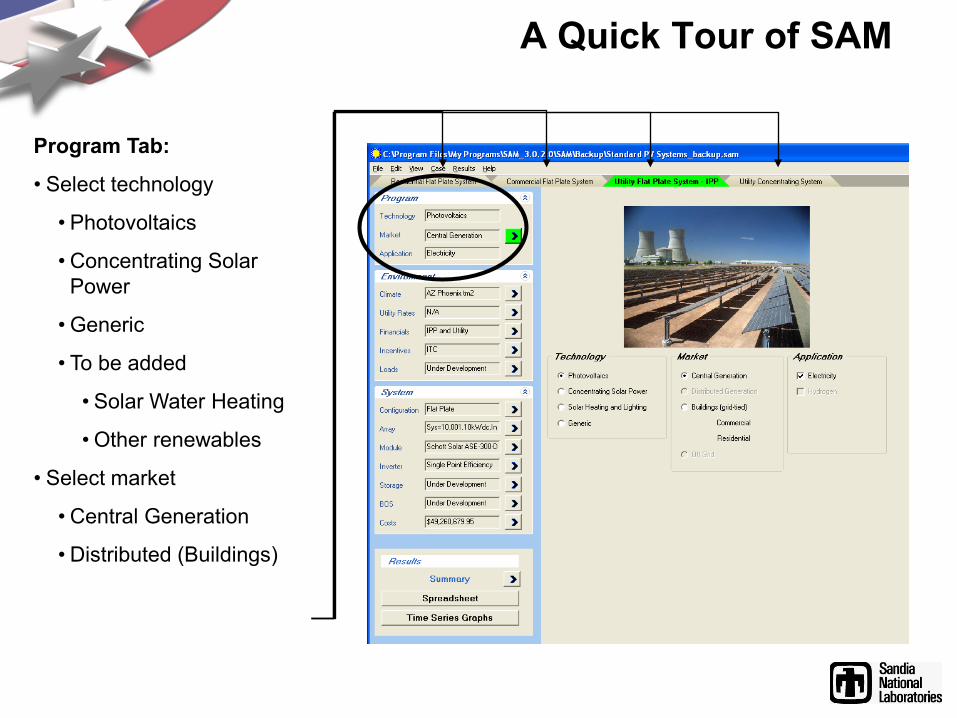
Program Tab:
• Select technology
• Photovoltaics
•Concentrating Solar Power
•Generic
• To be added
• Solar Water Heating
•Other renewables
• Select market
•Central Generation
•Distributed (Buildings)
• Multiple tabs can be opened (like Excel worksheets)
Program Tab:
• Select technology
• Photovoltaics
•Concentrating Solar Power
•Generic
• To be added
• Solar Water Heating
•Other renewables
• Select market
•Central Generation
•Distributed (Buildings)
A Quick Tour of SAM
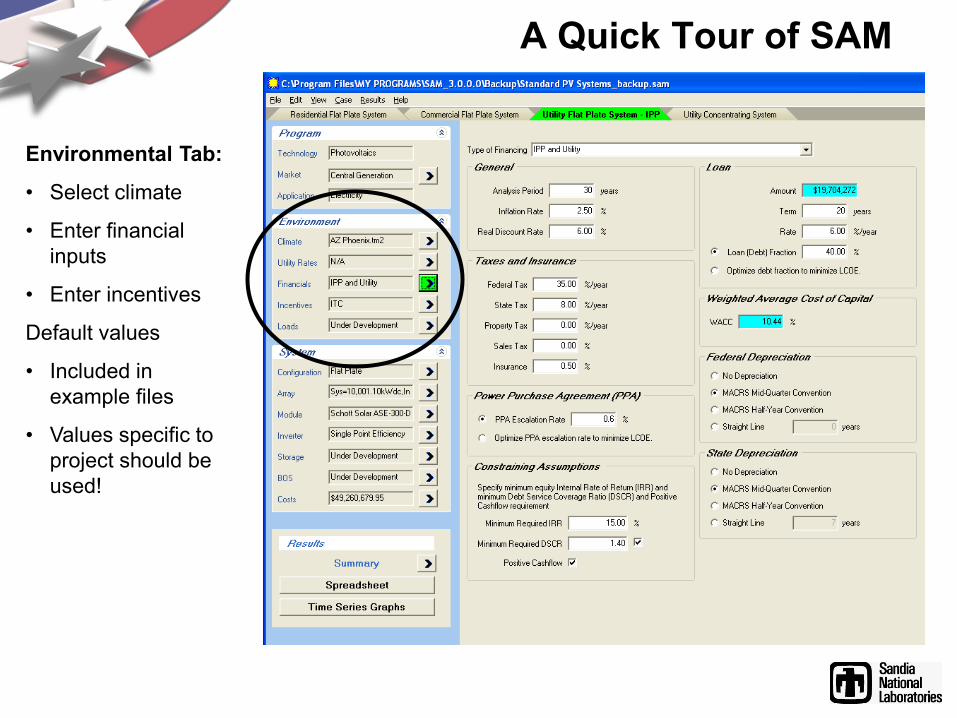
Environmental Tab:
• Select climate
• Enter financial inputs
• Enter incentives
Default values
• Included in example files
• Values specific to project should be used!

A Quick Tour of SAM
System Tab:
• Configuration
• Array characteristics
• Module and model
• Inverter and model
• Cost Data
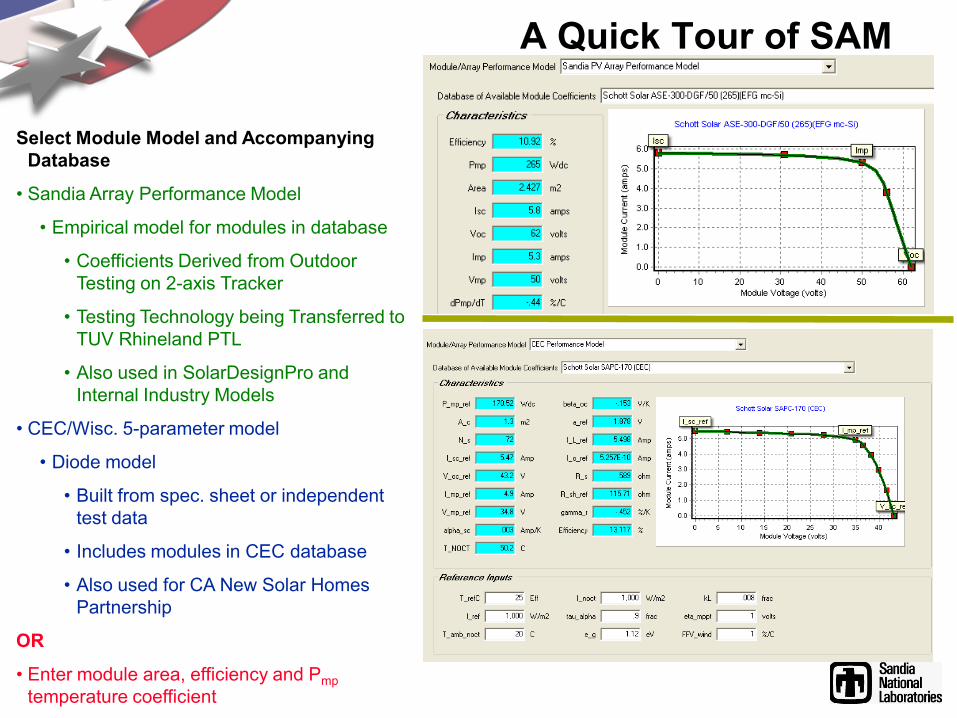
Select Module Model and Accompanying Database
• Sandia Array Performance Model
• Empirical model for modules in database
• Coefficients Derived from Outdoor Testing on 2-axis Tracker
• Testing Technology being Transferred to TUV Rhineland PTL
• Also used in SolarDesignPro and Internal Industry Models
• CEC/Wisc. 5-parameter model
• Diode model
• Built from spec. sheets or independent testing
• Includes modules in CEC database
• Also used for CA New Solar Homes Partnership
Select Module Model and Accompanying Database
• Sandia Array Performance Model
• Empirical model for modules in database
• Coefficients Derived from Outdoor Testing on 2-axis Tracker
• Testing Technology being Transferred to TUV Rhineland PTL
• Also used in SolarDesignPro and Internal Industry Models
• CEC/Wisc. 5-parameter model
• Diode model
• Built from spec. sheet or independent test data
• Includes modules in CEC database
• Also used for CA New Solar Homes Partnership
OR
• Enter module area, efficiency and Pmptemperature coefficient
A Quick Tour of SAM
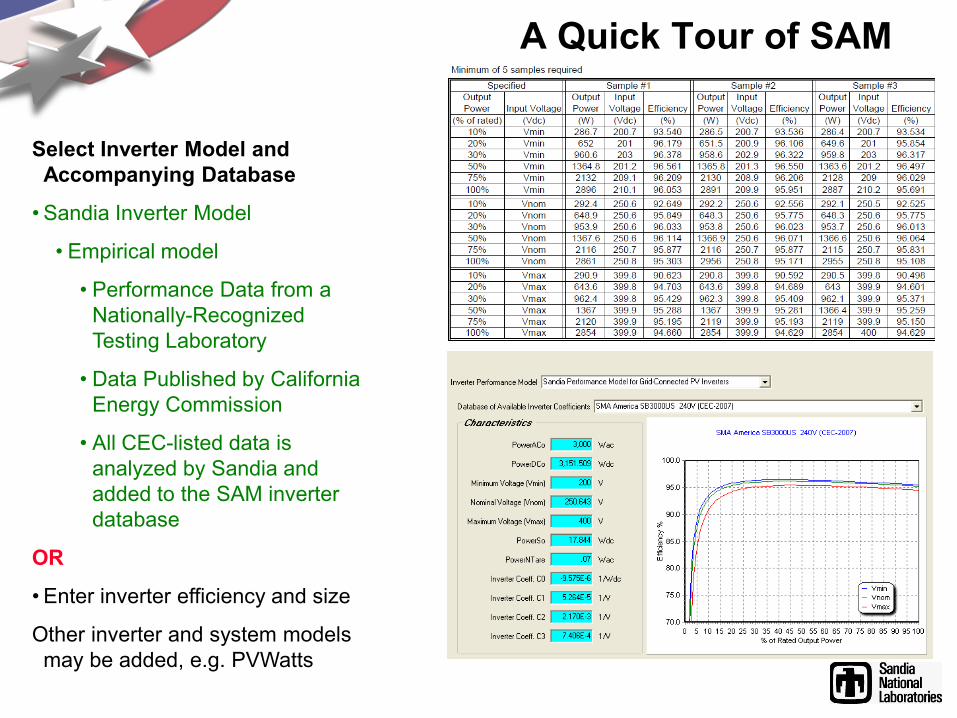
Select Inverter Model and Accompanying Database
•Sandia Inverter Model
• Empirical model
• Performance Data from a Nationally-Recognized Testing Laboratory
• Data Published by California Energy Commission
• All CEC-listed data is analyzed by Sandia and added to the SAM inverter database
Select Inverter Model and Accompanying Database
•Sandia Inverter Model
• Empirical model
• Performance Data from a Nationally-Recognized Testing Laboratory
• Data Published by California Energy Commission
• All CEC-listed data is analyzed by Sandia and added to the SAM inverter database
OR
•Enter inverter efficiency and size
Other inverter and system models may be added, e.g. PVWatts
A Quick Tour of SAM
A Quick Tour of SAM
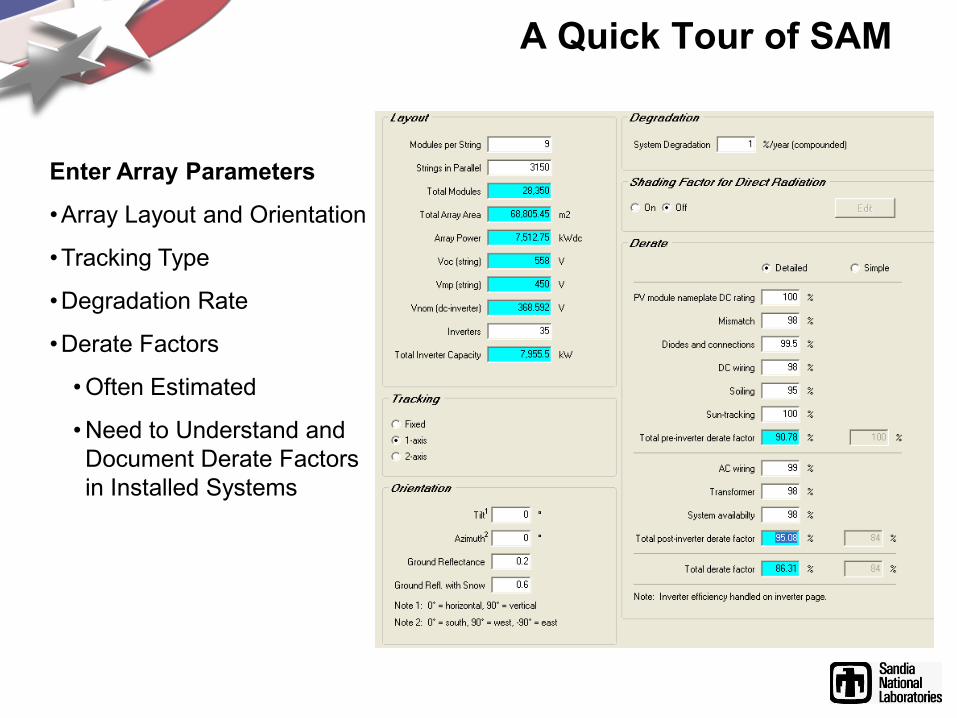
Enter Array Parameters
•Array Layout and Orientation
•Tracking Type
•Degradation Rate
•Derate Factors
•Often Estimated
•Need to Understand and Document Derate Factors in Installed Systems
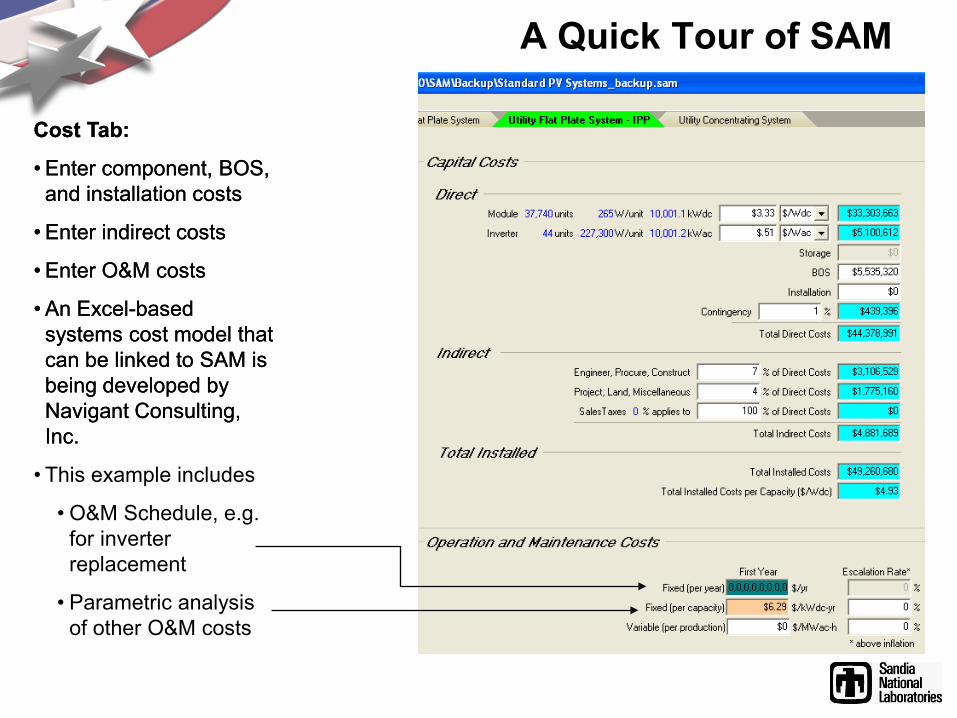
Cost Tab:
•Enter component, BOS, and installation costs
•Enter indirect costs
•Enter O&M costs
•An Excel-based systems cost model that can be linked to SAM is being developed by Navigant Consulting, Inc.
• This example includes
• O&M Schedule, e.g. for inverter replacement
• Parametric analysis of other O&M costs
A Quick Tour of SAM
Cost Tab:
•Enter component, BOS, and installation costs
•Enter indirect costs
•Enter O&M costs
•An Excel-based systems cost model that can be linked to SAM is being developed by Navigant Consulting, Inc.

A Quick Tour of SAM: Results Page
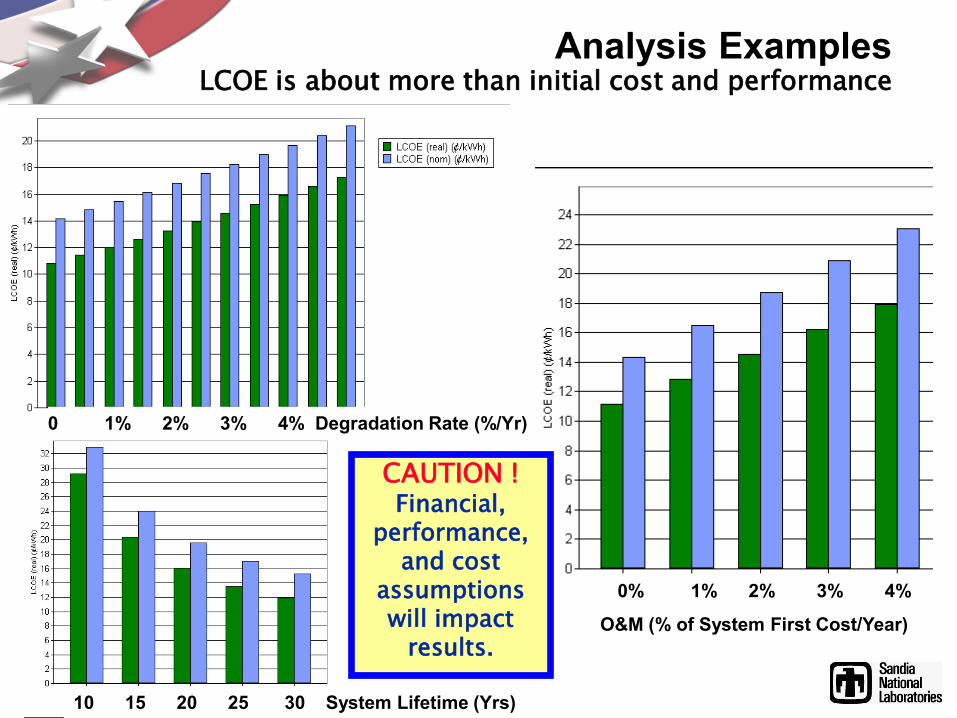
10 15 20 25 30 System Lifetime (Yrs)
0 1% 2% 3% 4% Degradation Rate (%/Yr)
0% 1% 2% 3% 4%
O&M (% of System First Cost/Year)
Analysis ExamplesLCOE is about more than initial cost and performance
CAUTION !Financial,
performance, and cost
assumptions will impact
results.
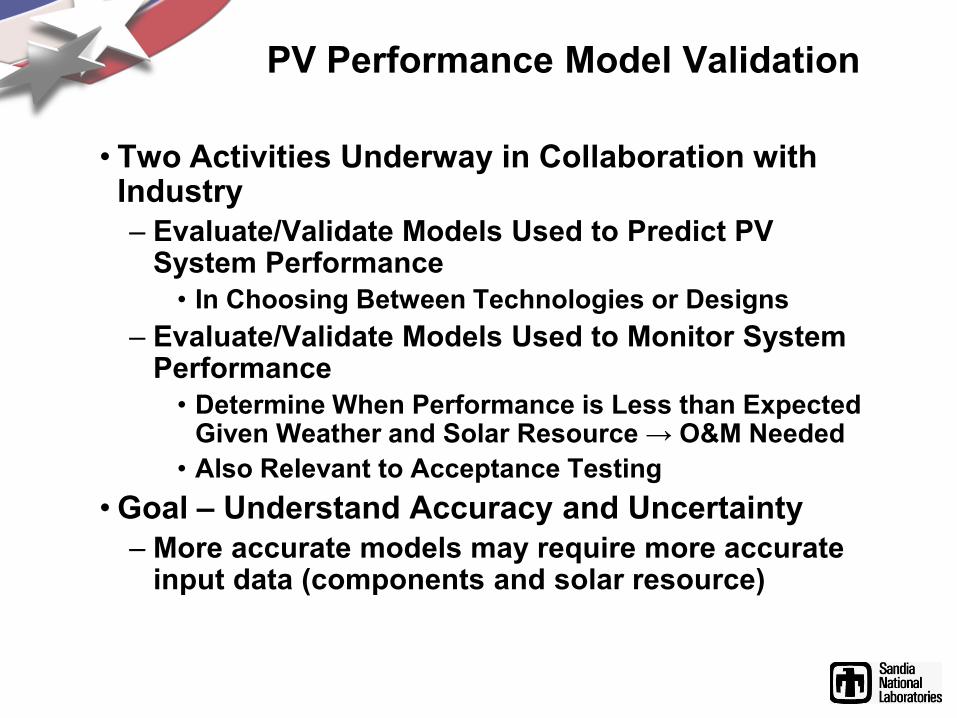
PV Performance Model Validation
• Two Activities Underway in Collaboration with Industry– Evaluate/Validate Models Used to Predict PV
System Performance• In Choosing Between Technologies or Designs
– Evaluate/Validate Models Used to Monitor System Performance• Determine When Performance is Less than Expected
Given Weather and Solar Resource → O&M Needed• Also Relevant to Acceptance Testing
•Goal – Understand Accuracy and Uncertainty– More accurate models may require more accurate
input data (components and solar resource)

ARRAY
INVERTER
PV Model
WeatherInstruments Average TMY
Format
RadiationModel
CompareInc DNI, Inc Diff,
POA
ModuleModel
ModuleDatabase
SandiaModule
Measurements
Array
CompareModuleTemp
DCOutput
CompareVmp
DC DerateCompareDC Output
InverterModel
AC DerateACOutput
CompareAC Output
AverageModule T
AverageVmp
AverageDC Output
AverageAC Output
RegressionAnalysis
InverterDatabase
RegressionAnalysis
CEC/SNLInverter
Data
IncidentDNI and Diffuse
System Model Validation Using Hourly Averaged Data
DNI*cos(IA)=Inc DNIPOA–Inc DNI=Inc Diff
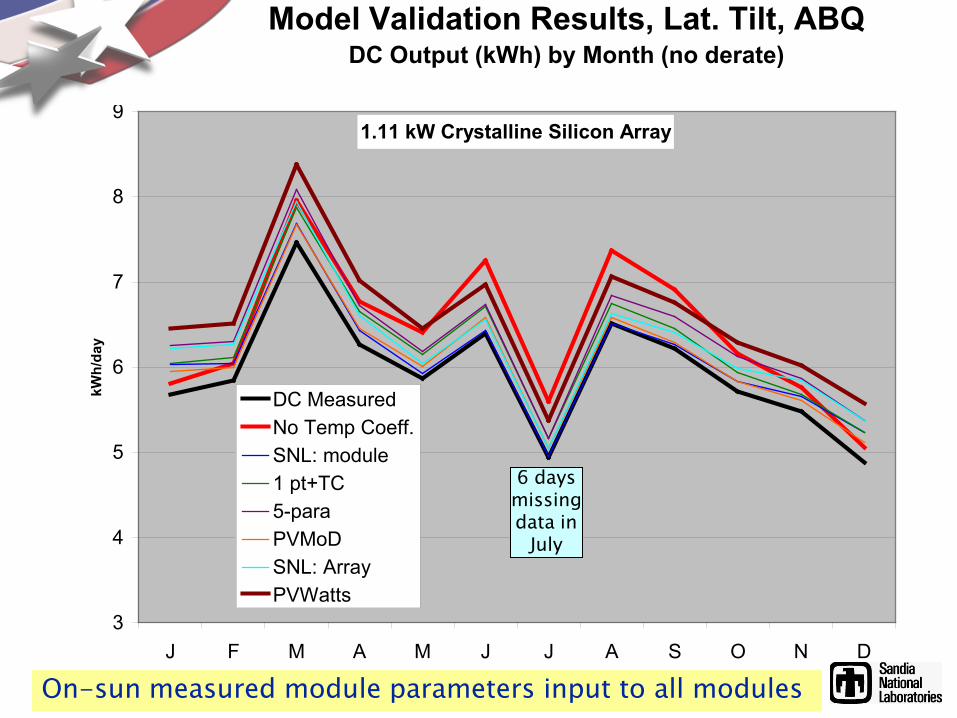
1.11 kW Crystalline Silicon Array
3
4
5
6
7
8
9
J F M A M J J A S O N D
kWh/
day
DC MeasuredNo Temp Coeff.SNL: module1 pt+TC5-paraPVMoDSNL: ArrayPVWatts
Model Validation Results, Lat. Tilt, ABQDC Output (kWh) by Month (no derate)
6 daysmissingdata in
July
On-sun measured module parameters input to all modules

1.11 kW Crystalline Silicon Array
3
4
5
6
7
8
9
J F M A M J J A S O N D
kWh/
day
(nor
mal
ized
to m
easu
red)
No Temp Coeff.SNL: module1 pt+TC5-paraPVMoDSNL: ArrayPVWatts
Monthly OutputNormalized to Measured Data
6 daysmissingdata in
July
When derate is applied, modeled monthly output is similar, but implied derate factors vary
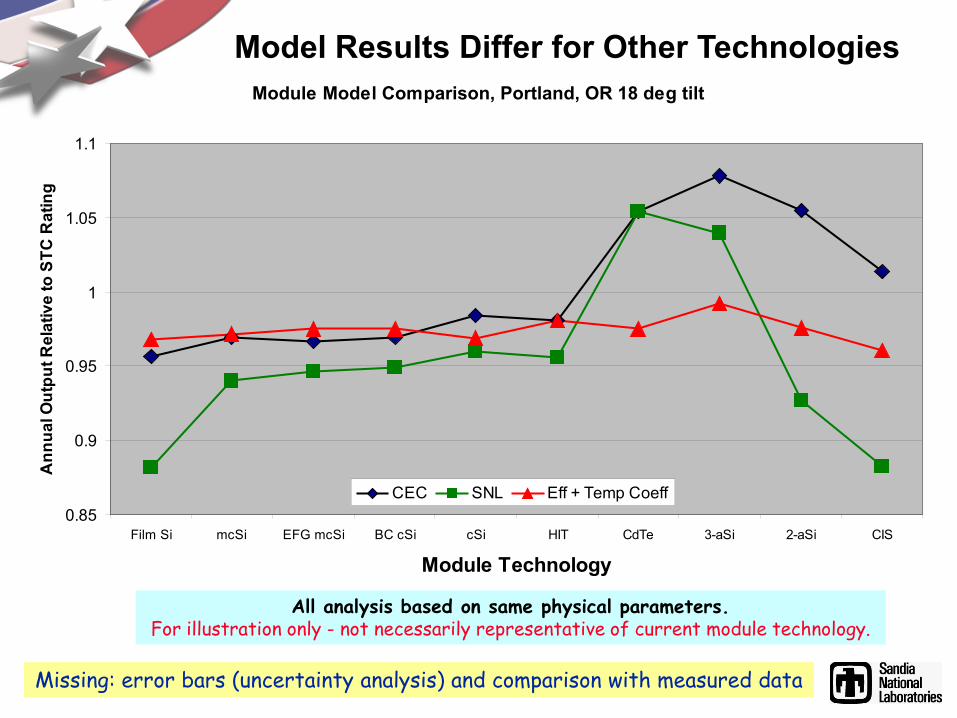
Model Results Differ for Other TechnologiesModule Model Comparison, Portland, OR 18 deg tilt
0.85
0.9
0.95
1
1.05
1.1
Film Si mcSi EFG mcSi BC cSi cSi HIT CdTe 3-aSi 2-aSi CIS
Module Technology
Ann
ual O
utpu
t Rel
ativ
e to
STC
Rat
ing
CEC SNL Eff + Temp Coeff
All analysis based on same physical parameters.For illustration only - not necessarily representative of current module technology.
Missing: error bars (uncertainty analysis) and comparison with measured data
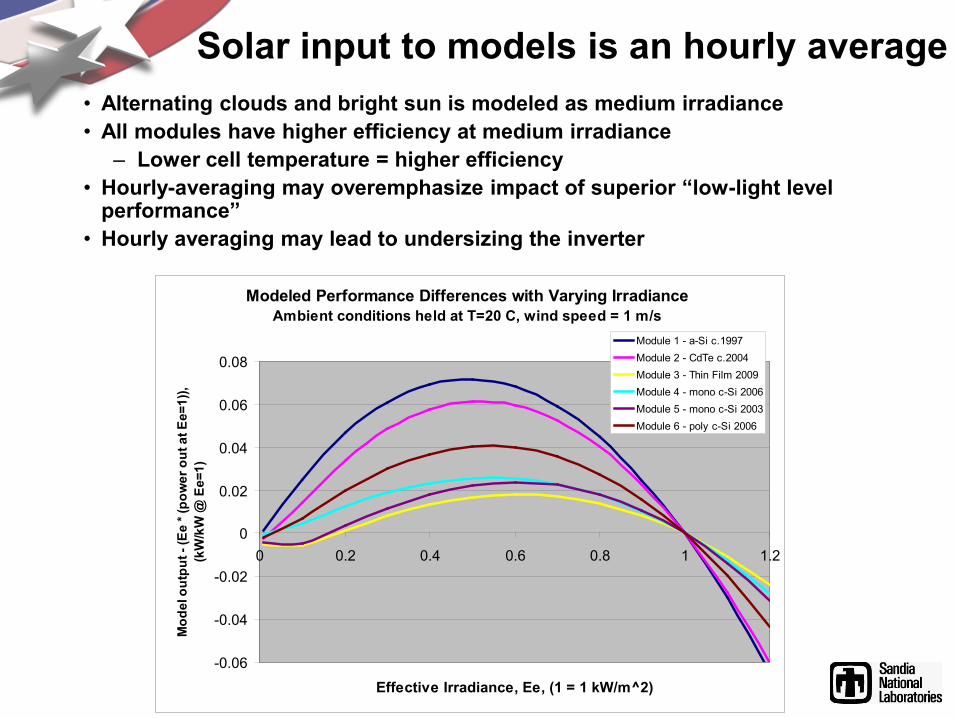
Solar input to models is an hourly average• Alternating clouds and bright sun is modeled as medium irradiance• All modules have higher efficiency at medium irradiance
– Lower cell temperature = higher efficiency• Hourly-averaging may overemphasize impact of superior “low-light level
performance”• Hourly averaging may lead to undersizing the inverter
Modeled Performance Differences with Varying IrradianceAmbient conditions held at T=20 C, wind speed = 1 m/s
-0.06
-0.04
-0.02
0
0.02
0.04
0.06
0.08
0 0.2 0.4 0.6 0.8 1 1.2
Effective Irradiance, Ee, (1 = 1 kW/m^2)
Mod
el o
utpu
t - (E
e * (
pow
er o
ut a
t Ee=
1)),
(kW
/kW
@ E
e=1)
Module 1 - a-Si c.1997Module 2 - CdTe c.2004Module 3 - Thin Film 2009Module 4 - mono c-Si 2006Module 5 - mono c-Si 2003Module 6 - poly c-Si 2006

Future Work
• Continue Validation and Evaluation of Models– Acquire cSi and thin-film data sets in bright and diffuse
climates (Albuquerque; Golden, Co; DC; Cocoa, FL)– Conduct detailed evaluation vs. incident angle, solar
radiation, temperature, wind speed…– No right answer: Requirement for accuracy may vary
• Perform robust uncertainty analysis– Incorporate stochastic analysis into models– Which parameters are most important?
• Improve understanding of derate factors– Develop Web-Based Photovoltaic (PV) Database
• See eere.energy.gov/solar/upcoming_opportunities.html• Complete evaluation of impact of hourly averaging
– Can modeling be improved by synthesizing sub-hourly data from existing hourly-averaged data sets?

Questions

DOE’s Solar Advisor Model (SAM)
Vision– Combine PV, CSP, thermal solar
technologies into a single model– Make high-quality performance
models developed by NREL, Sandia, and other partners available to a wider audience
– Facilitate comparison by handling performance, costs and financing consistently across technologies
– Facilitate calculating the impact of R&D on LCOE, NPV, etc. in various markets.
– Sensitivity analysis and graphing capabilities
– Over 6000 downloads• Download (no cost) at:
https://www.nrel.gov/analysis/sam
Thanks to Nate Blair and his colleagues at NREL for developing SAM

Select Performance Models and Accompanying Databases
•Sandia Array Performance Model
• Also used in SolarDesignPro
•CEC 5-parameter model
• New Solar Homes Partnership
• All modules in CEC database
Select Performance Models and Accompanying Databases
•Sandia Array Performance Model
• Also used in SolarDesignPro
•CEC 5-parameter model
• New Solar Homes Partnership
• All modules in CEC database
•Sandia Inverter Model
• All inverters in CEC database
A Quick Tour of SAM
Select Performance Models and Accompanying Databases
•Sandia Array Performance Model
• Also used in SolarDesignPro
•CEC 5-parameter model
• New Solar Homes Partnership
• All modules in CEC database
•Sandia Inverter Model
• All inverters in CEC database
OR
•Enter module area, efficiency and Pmp temperature coefficient
•Enter inverter efficiency and size
OR
•Use Generic Energy Input
PV Watts to be added to SAM
Related Documents