PV Manufacturing Cost Analysis: Future Cost Reduction Opportunities Future Cost Reduction Opportunities CESA Member Webinar: Solar PV Manufacturing Costs Alan Goodrich Alan Goodrich, Michael Woodhouse, Ted James NREL is a national laboratory of the U.S. Department of Energy, Office of Energy Efficiency and Renewable Energy, operated by the Alliance for Sustainable Energy, LLC. June 22, 2012

Welcome message from author
This document is posted to help you gain knowledge. Please leave a comment to let me know what you think about it! Share it to your friends and learn new things together.
Transcript
PV Manufacturing Cost Analysis:Future Cost Reduction OpportunitiesFuture Cost Reduction Opportunities
CESA Member Webinar: Solar PV Manufacturing Costs
Alan GoodrichAlan Goodrich,Michael Woodhouse,Ted James
NREL is a national laboratory of the U.S. Department of Energy, Office of Energy Efficiency and Renewable Energy, operated by the Alliance for Sustainable Energy, LLC.
June 22, 2012

Analysis DisclaimerDISCLAIMER AGREEMENT
These manufacturing cost model results (Data) are provided by the National Renewable Energy Laboratory (NREL), which is operated by the Alliance for Sustainable Energy LLC (Alliance) for the U.S. Department of Energy (DOE).
It is recognized that disclosure of these Data are provided under the following conditions and warnings: (1) these Data have been prepared for reference purposes only; (2) these Data consist of forecasts, estimates, or assumptions made on a best‐efforts basis, based upon present expectations; and (3) these Data were prepared with existing information and are subject to change without notice.
The names DOE/NREL/ALLIANCE shall not be used in any representation, advertising, publicity, or other manner whatsoever to endorse or promote any entity that adopts or uses these Data. DOE/NREL/ALLIANCE shall not provide any support, consulting, training, or assistance of any kind with regard to the use of these Data or any updates, revisions, or new versions of these Data.
YOU AGREE TO INDEMNIFY DOE/NREL/ALLIANCE AND ITS AFFILIATES, OFFICERS, AGENTS, AND EMPLOYEES AGAINST ANY CLAIM OR DEMAND, INCLUDING REASONABLE ATTORNEYS' FEES, RELATED TO YOUR USE, RELIANCE, OR ADOPTION OF THESE DATA FOR ANY PURPOSE WHATSOEVER. THESE DATA ARE PROVIDED BY DOE/NREL/ALLIANCE "AS IS" AND ANY EXPRESS OR IMPLIED WARRANTIES, INCLUDING BUT NOT LIMITED TO, THE IMPLIED WARRANTIES OF MERCHANTABILITY AND FITNESS FOR A PARTICULAR PURPOSE ARE EXPRESSLYIMPLIED WARRANTIES OF MERCHANTABILITY AND FITNESS FOR A PARTICULAR PURPOSE ARE EXPRESSLY DISCLAIMED. IN NO EVENT SHALL DOE/NREL/ALLIANCE BE LIABLE FOR ANY SPECIAL, INDIRECT, OR CONSEQUENTIAL DAMAGES OR ANY DAMAGES WHATSOEVER, INCLUDING BUT NOT LIMITED TO CLAIMS ASSOCIATED WITH THE LOSS OF DATA OR PROFITS, WHICH MAY RESULT FROM AN ACTION IN CONTRACT, NEGLIGENCE, OR OTHER TORTIOUS CLAIM THAT ARISES OUT OF OR IN CONNECTION WITH THE USE OR PERFORMANCE OF THESE DATA.
2
Overview
• Reported Prices: Market Distortionso Historic‐cost reduction factorso The rising importance of innovation
h l f l d b do The role of supply‐side subsidies
• Cost Analysis in‐Support of R&D• Future Cost‐Reduction Opportunities
o Wafer based c‐Si moduleso SJ polycrystalline CdTe modules
• System‐Price Trends
3
( d)Top‐Down (Reported) Prices
Useful for long‐term strategic decisions?f f g g
4
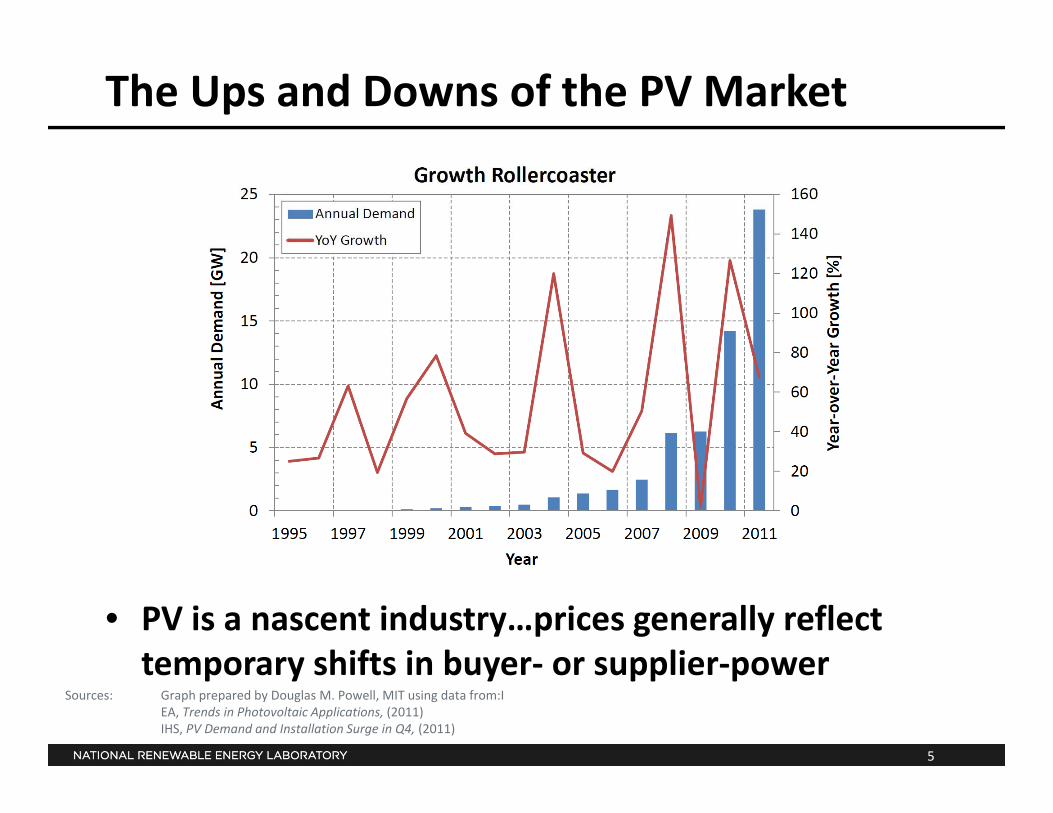
The Ups and Downs of the PV Market
• PV is a nascent industry…prices generally reflect temporary shifts in buyer or supplier power
5
temporary shifts in buyer‐ or supplier‐powerSources: Graph prepared by Douglas M. Powell, MIT using data from:I
EA, Trends in Photovoltaic Applications, (2011)IHS, PV Demand and Installation Surge in Q4, (2011)
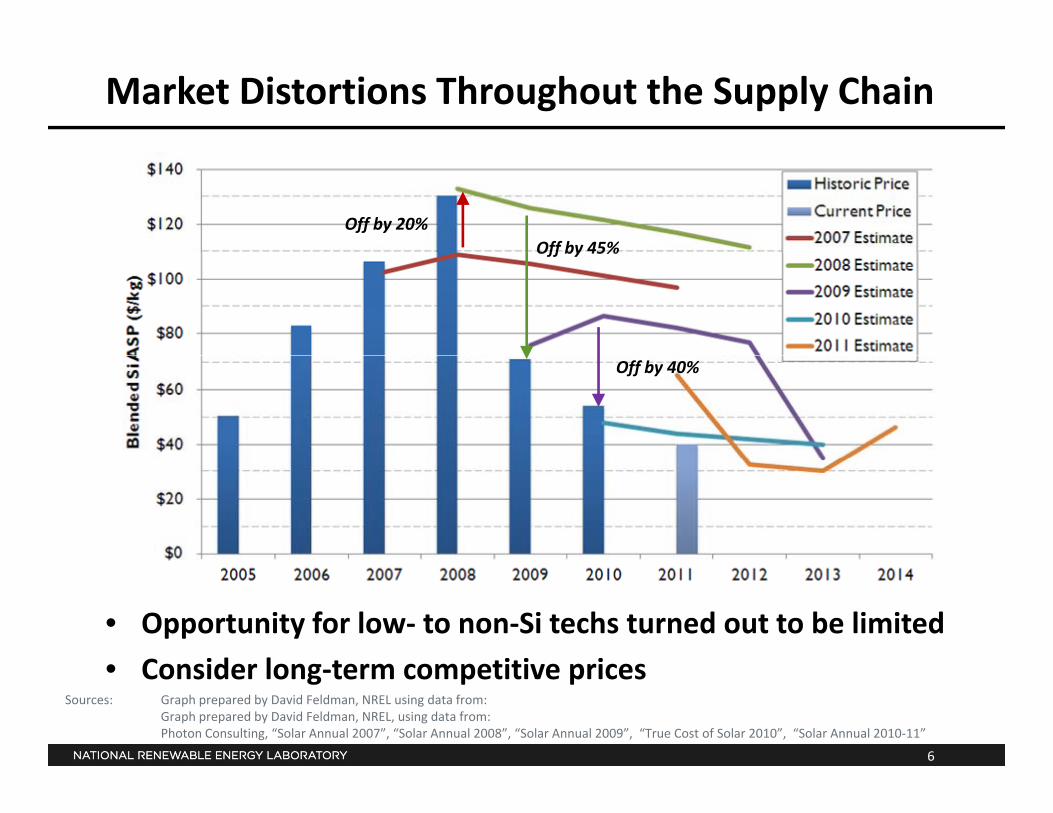
Market Distortions Throughout the Supply Chain
Off by 20%Off by 45%Off by 45%
Off by 40%
• Opportunity for low‐ to non‐Si techs turned out to be limited
C id l t titi i
6
• Consider long‐term competitive pricesSources: Graph prepared by David Feldman, NREL using data from:
Graph prepared by David Feldman, NREL, using data from:Photon Consulting, “Solar Annual 2007”, “Solar Annual 2008”, “Solar Annual 2009”, “True Cost of Solar 2010”, “Solar Annual 2010‐11”
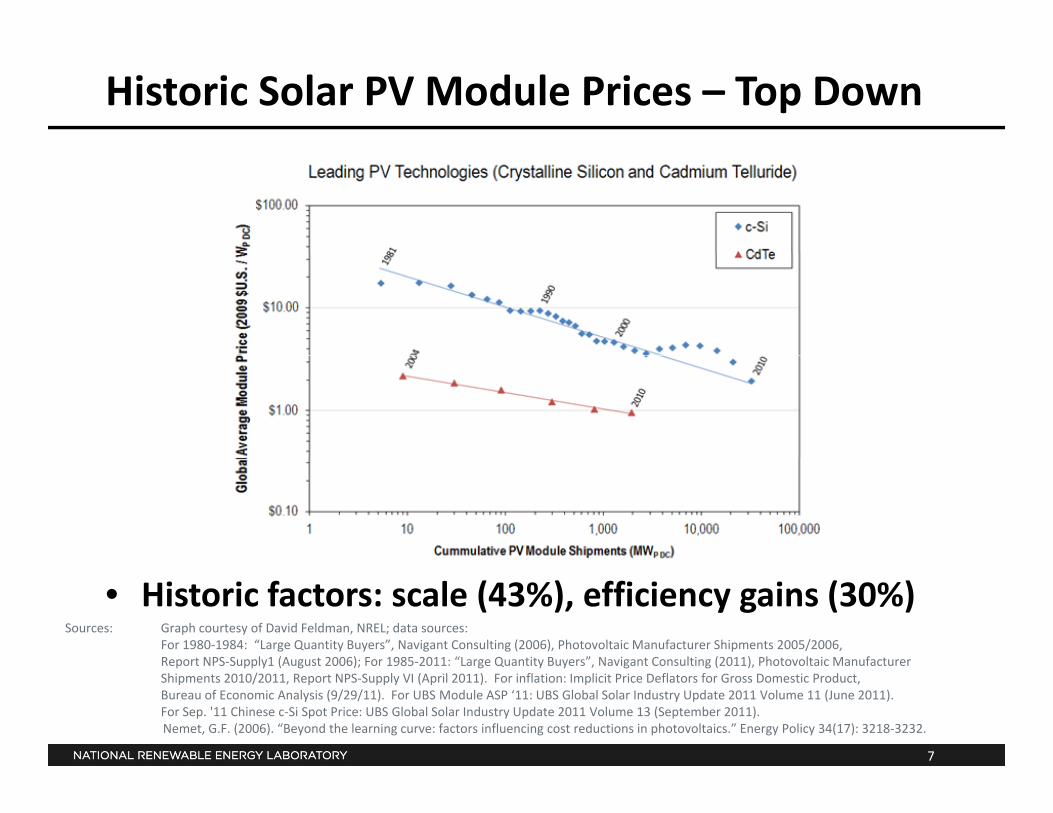
Historic Solar PV Module Prices – Top Down
Sources: Graph courtesy of David Feldman, NREL; data sources:For 1980‐1984: “Large Quantity Buyers”, Navigant Consulting (2006), Photovoltaic Manufacturer Shipments 2005/2006, Report NPS‐Supply1 (August 2006); For 1985‐2011: “Large Quantity Buyers” Navigant Consulting (2011) Photovoltaic Manufacturer
• Historic factors: scale (43%), efficiency gains (30%)
7
Report NPS Supply1 (August 2006); For 1985 2011: Large Quantity Buyers , Navigant Consulting (2011), Photovoltaic ManufacturerShipments 2010/2011, Report NPS‐Supply VI (April 2011). For inflation: Implicit Price Deflators for Gross Domestic Product, Bureau of Economic Analysis (9/29/11). For UBS Module ASP ‘11: UBS Global Solar Industry Update 2011 Volume 11 (June 2011). For Sep. '11 Chinese c‐Si Spot Price: UBS Global Solar Industry Update 2011 Volume 13 (September 2011). Nemet, G.F. (2006). “Beyond the learning curve: factors influencing cost reductions in photovoltaics.” Energy Policy 34(17): 3218‐3232.
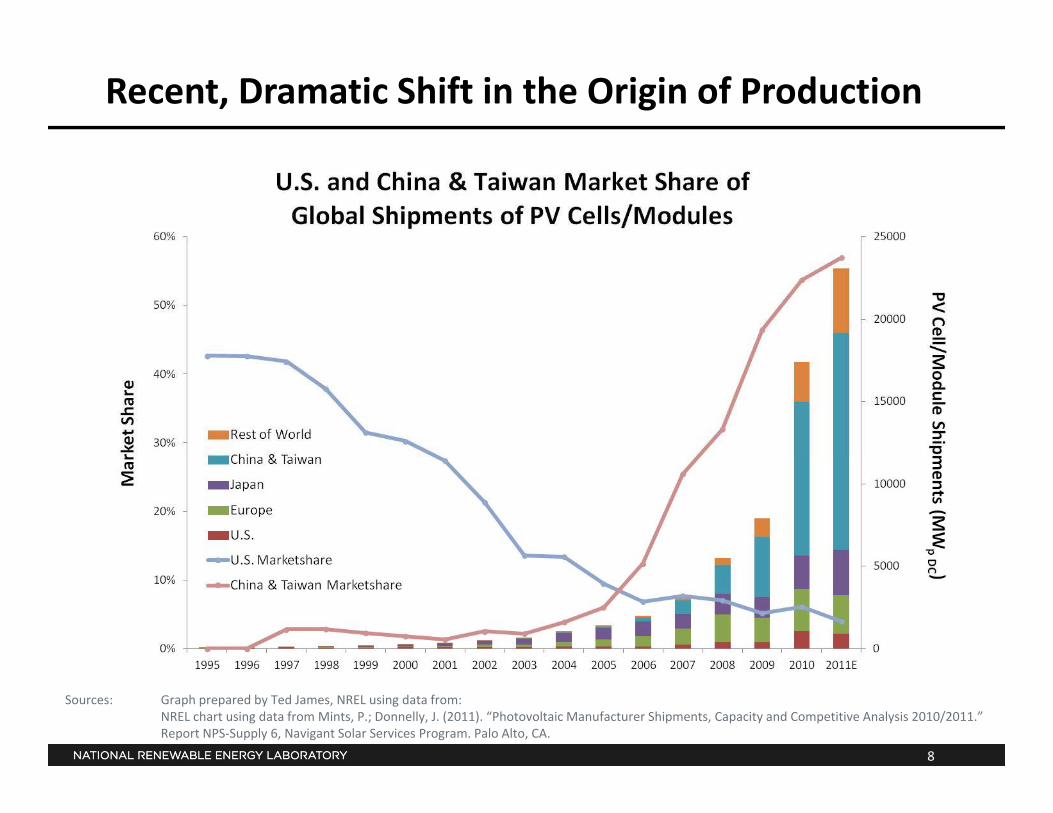
Recent, Dramatic Shift in the Origin of Production
8
Sources: Graph prepared by Ted James, NREL using data from:NREL chart using data from Mints, P.; Donnelly, J. (2011). “Photovoltaic Manufacturer Shipments, Capacity and Competitive Analysis 2010/2011.” Report NPS‐Supply 6, Navigant Solar Services Program. Palo Alto, CA.

The Impact of Supply‐Side Subsidies
Unpublished.NREL Internal Cost Model Results,As of May 28, 2012.
9
Sources: Alan Goodrich, Peter Hacke, Qi Wang, Bhushan Sopori, Robert Margolis, Ted James, David Hsu, and Michael Woodhouse (2012). “A Wafer‐Based Monocrystalline Silicon Photovoltaics Road Map:Utilizing Known Technical Improvement Opportunities for Further Reductions in Manufacturing Costs.” NREL (in preparation)
lBottom‐Up Cost Analysis
Long‐term competitive pricingg p p g
10
Methodology Overview
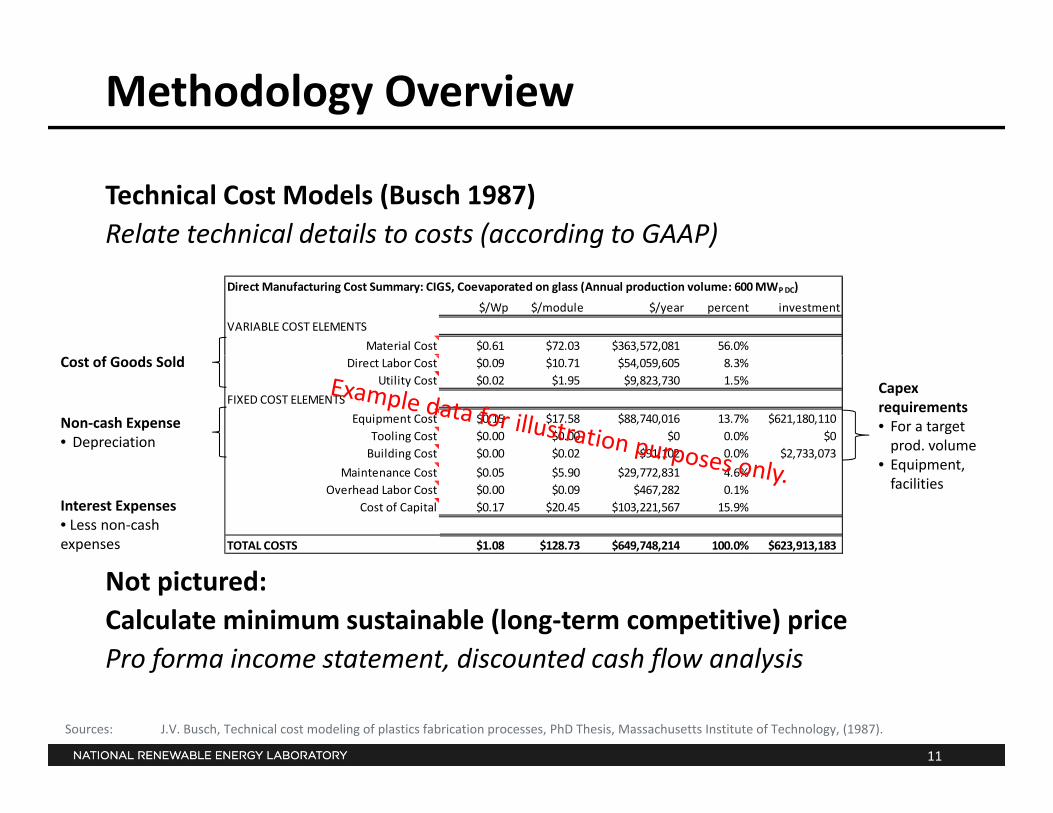
Technical Cost Models (Busch 1987)Relate technical details to costs (according to GAAP)
Direct Manufacturing Cost Summary: CIGS, Coevaporated on glass (Annual production volume: 600 MWP DC)
$/Wp $/module $/year percent investment
VARIABLE COST ELEMENTS
Material Cost $0.61 $72.03 $363,572,081 56.0%
Capex requirements• For a target prod. volume
Cost of Goods Sold
Non‐cash Expense• Depreciation
Direct Labor Cost $0.09 $10.71 $54,059,605 8.3%Utility Cost $0.02 $1.95 $9,823,730 1.5%
FIXED COST ELEMENTS
Equipment Cost $0.15 $17.58 $88,740,016 13.7% $621,180,110Tooling Cost $0.00 $0.00 $0 0.0% $0Building Cost $0.00 $0.02 $91,102 0.0% $2,733,073
• Equipment, facilities
Interest Expenses• Less non‐cash expenses
g $ $ $ , $ , ,
Maintenance Cost $0.05 $5.90 $29,772,831 4.6%Overhead Labor Cost $0.00 $0.09 $467,282 0.1%
Cost of Capital $0.17 $20.45 $103,221,567 15.9%
TOTAL COSTS $1.08 $128.73 $649,748,214 100.0% $623,913,183
Not pictured:Calculate minimum sustainable (long‐term competitive) pricePro forma income statement discounted cash flow analysis
11
Pro forma income statement, discounted cash flow analysis
Sources: J.V. Busch, Technical cost modeling of plastics fabrication processes, PhD Thesis, Massachusetts Institute of Technology, (1987).
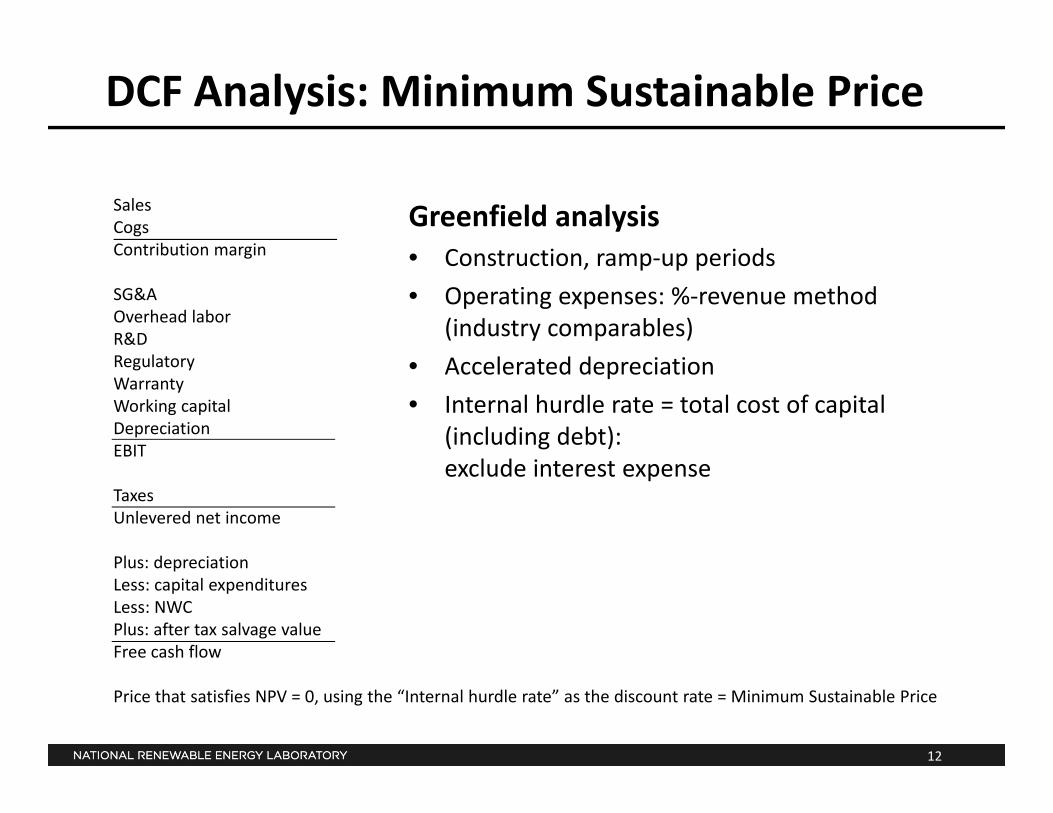
DCF Analysis: Minimum Sustainable Price
SalesCogsContribution margin
Greenfield analysisC t ti i dContribution margin
SG&AOverhead laborR&DR l
• Construction, ramp‐up periods
• Operating expenses: %‐revenue method (industry comparables)
RegulatoryWarrantyWorking capitalDepreciationEBIT
• Accelerated depreciation
• Internal hurdle rate = total cost of capital (including debt):
TaxesUnlevered net income
Plus: depreciation
exclude interest expense
Plus: depreciationLess: capital expendituresLess: NWCPlus: after tax salvage valueFree cash flow
12
Price that satisfies NPV = 0, using the “Internal hurdle rate” as the discount rate = Minimum Sustainable Price
h l dTechnology Road Maps
The competitive price of alternative tech. pathways:p p f p y
Wafer based c‐Si
SJ poly CdTe
13

Poly Costs: Capital, Energy Intensive
Unpublished.NREL Internal Cost Model Results,As of May 28, 2012.
• Today’s competitive price ($27/kg) may approach $20/kg in the long‐term
14
the long‐termSources: Alan Goodrich, Peter Hacke, Qi Wang, Bhushan Sopori, Robert Margolis, Ted James, David Hsu, and Michael Woodhouse (2012). “A Wafer‐Based
Monocrystalline Silicon Photovoltaics Road Map:Utilizing Known Technical Improvement Opportunities for Further Reductions in Manufacturing Costs.” NREL (in preparation)
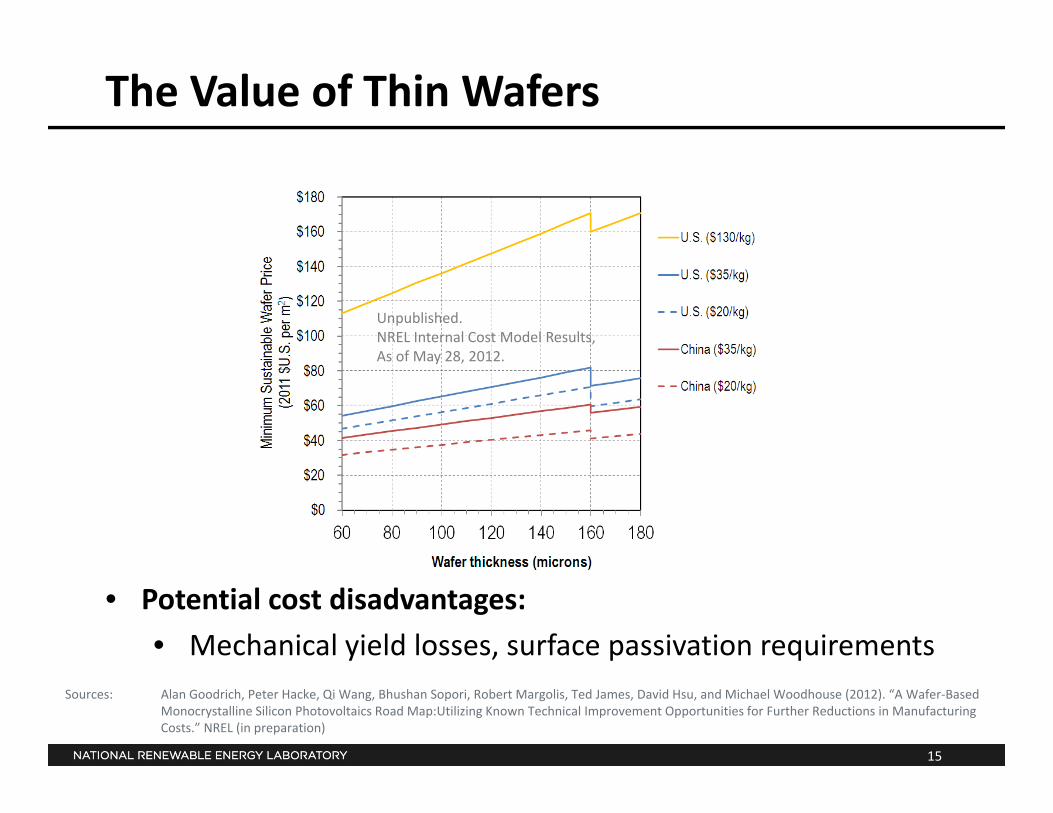
The Value of Thin Wafers
Unpublished.NREL Internal Cost Model Results,As of May 28 2012As of May 28, 2012.
• Potential cost disadvantages:
• Mechanical yield losses, surface passivation requirements
15
Sources: Alan Goodrich, Peter Hacke, Qi Wang, Bhushan Sopori, Robert Margolis, Ted James, David Hsu, and Michael Woodhouse (2012). “A Wafer‐Based Monocrystalline Silicon Photovoltaics Road Map:Utilizing Known Technical Improvement Opportunities for Further Reductions in Manufacturing Costs.” NREL (in preparation)
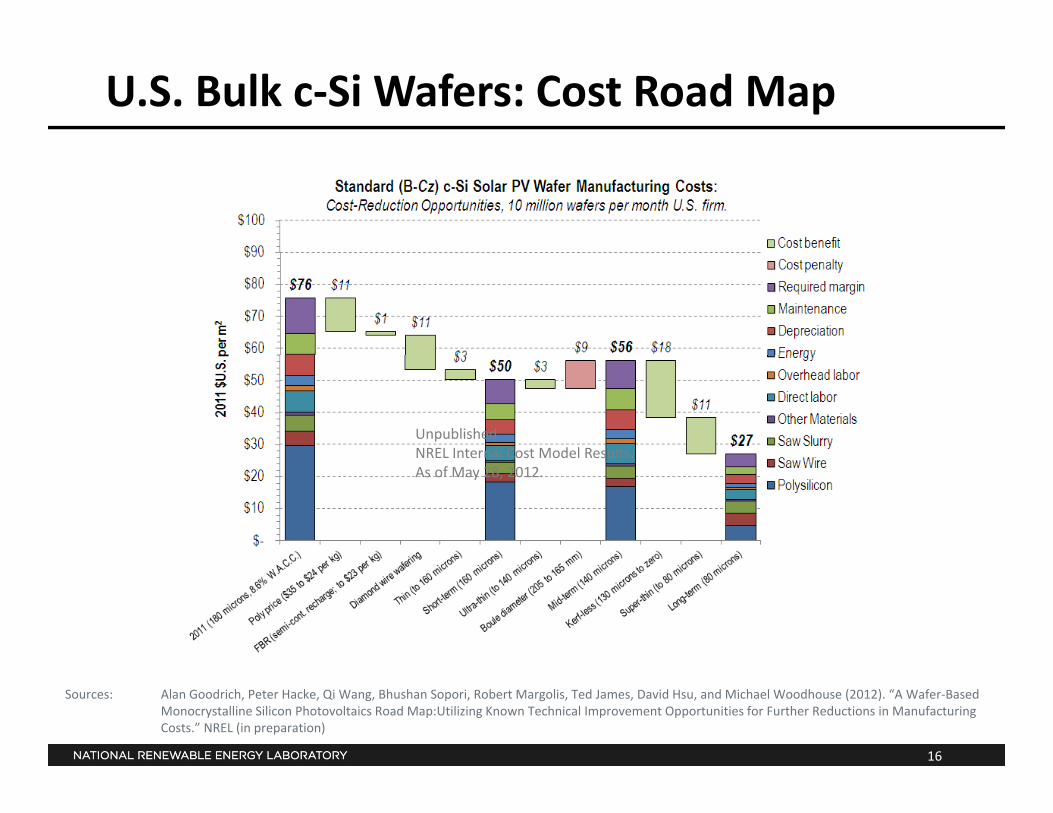
U.S. Bulk c‐Si Wafers: Cost Road Map
Unpublished.NREL Internal Cost Model Results,te a Cost ode esu ts,As of May 28, 2012.
16
Sources: Alan Goodrich, Peter Hacke, Qi Wang, Bhushan Sopori, Robert Margolis, Ted James, David Hsu, and Michael Woodhouse (2012). “A Wafer‐Based Monocrystalline Silicon Photovoltaics Road Map:Utilizing Known Technical Improvement Opportunities for Further Reductions in Manufacturing Costs.” NREL (in preparation)
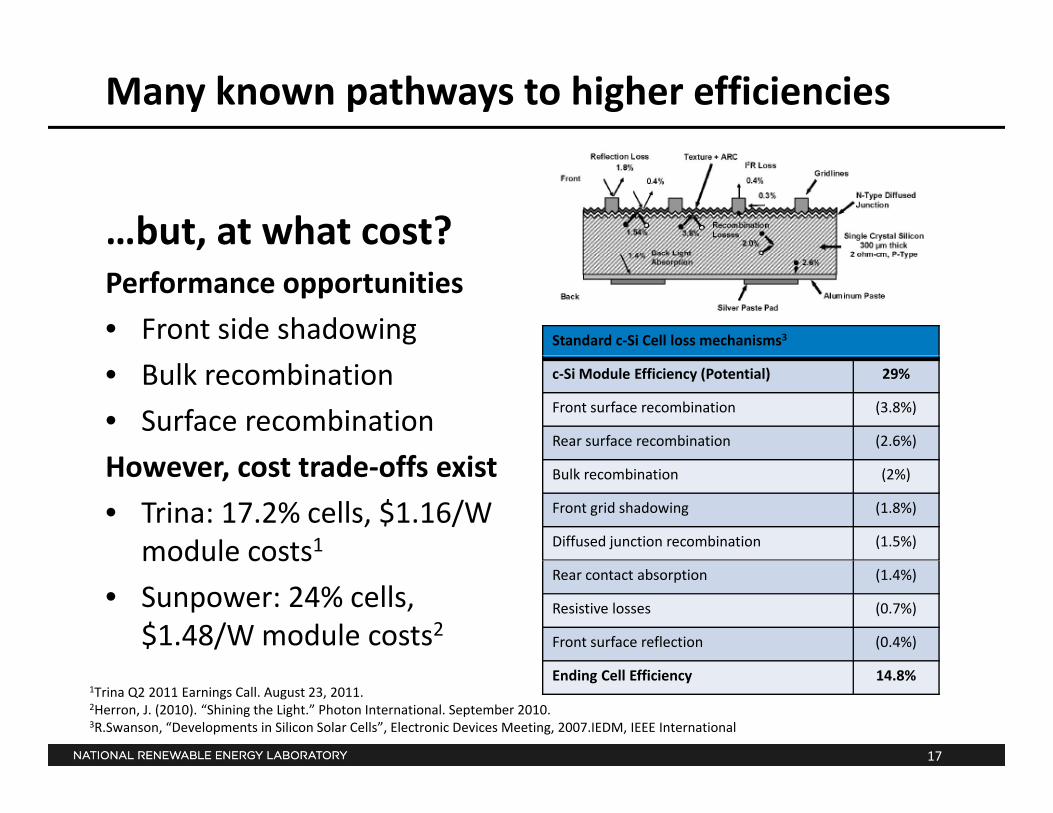
Many known pathways to higher efficiencies
…but, at what cost?Performance opportunities
• Front side shadowing Standard c‐Si Cell loss mechanisms3
• Bulk recombination
• Surface recombination
H t t d ff i t
c‐Si Module Efficiency (Potential) 29%
Front surface recombination (3.8%)
Rear surface recombination (2.6%)
However, cost trade‐offs exist
• Trina: 17.2% cells, $1.16/W module costs1
Bulk recombination (2%)
Front grid shadowing (1.8%)
Diffused junction recombination (1.5%)module costs
• Sunpower: 24% cells, $1.48/W module costs2
Rear contact absorption (1.4%)
Resistive losses (0.7%)
Front surface reflection (0.4%)
17
Ending Cell Efficiency 14.8%1Trina Q2 2011 Earnings Call. August 23, 2011.2Herron, J. (2010). “Shining the Light.” Photon International. September 2010.3R.Swanson, “Developments in Silicon Solar Cells”, Electronic Devices Meeting, 2007.IEDM, IEEE International
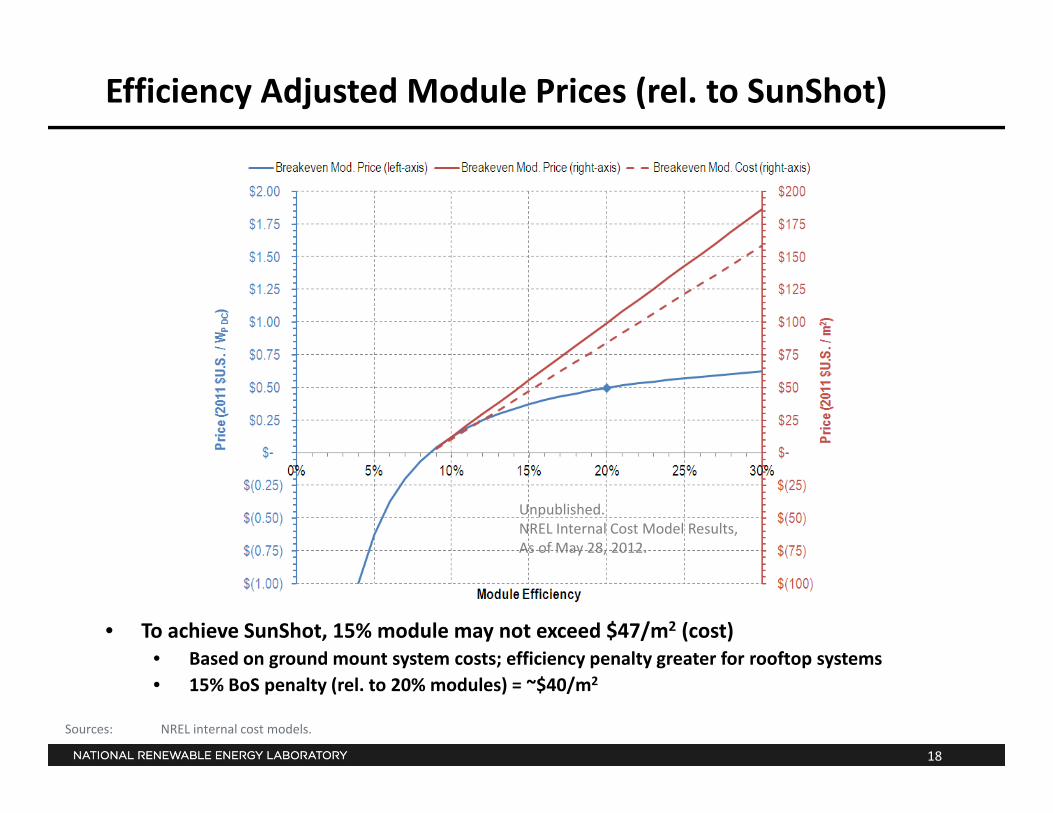
Efficiency Adjusted Module Prices (rel. to SunShot)
Unpublished.NREL Internal Cost Model Results,As of May 28, 2012.
• To achieve SunShot, 15% module may not exceed $47/m2 (cost)• Based on ground mount system costs; efficiency penalty greater for rooftop systems
18
Sources: NREL internal cost models.
Based on ground mount system costs; efficiency penalty greater for rooftop systems• 15% BoS penalty (rel. to 20% modules) = ~$40/m2
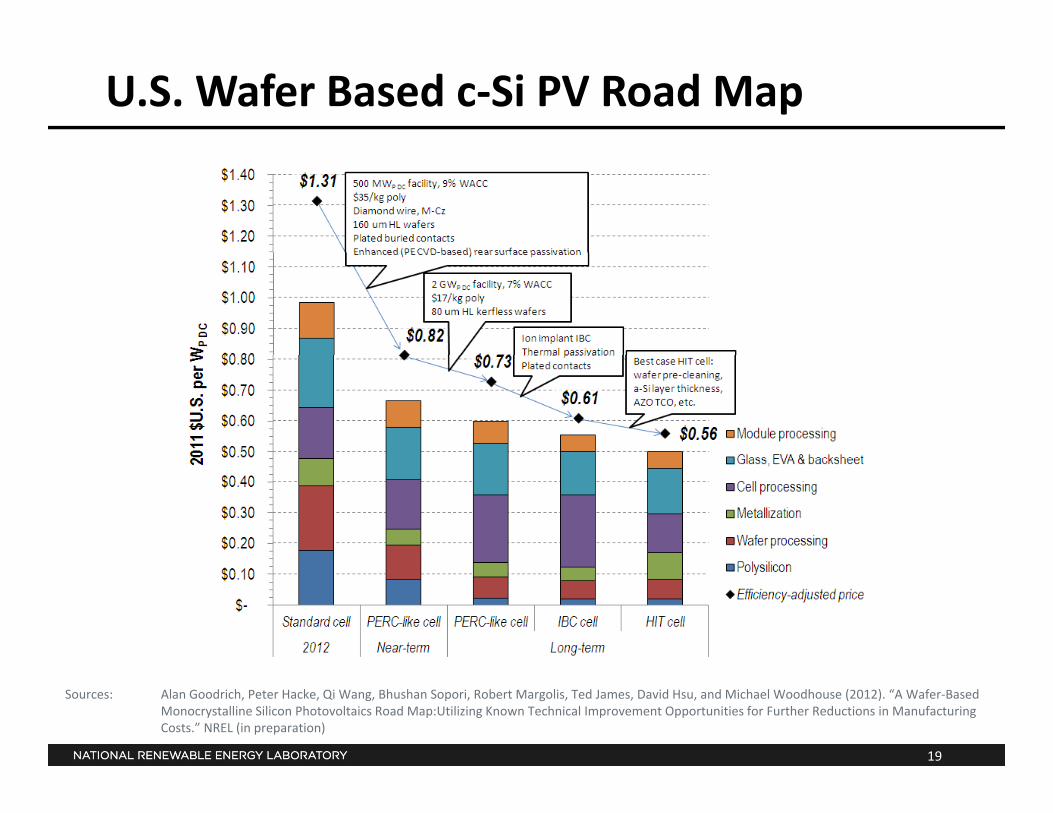
U.S. Wafer Based c‐Si PV Road Map
19
Sources: Alan Goodrich, Peter Hacke, Qi Wang, Bhushan Sopori, Robert Margolis, Ted James, David Hsu, and Michael Woodhouse (2012). “A Wafer‐Based Monocrystalline Silicon Photovoltaics Road Map:Utilizing Known Technical Improvement Opportunities for Further Reductions in Manufacturing Costs.” NREL (in preparation)
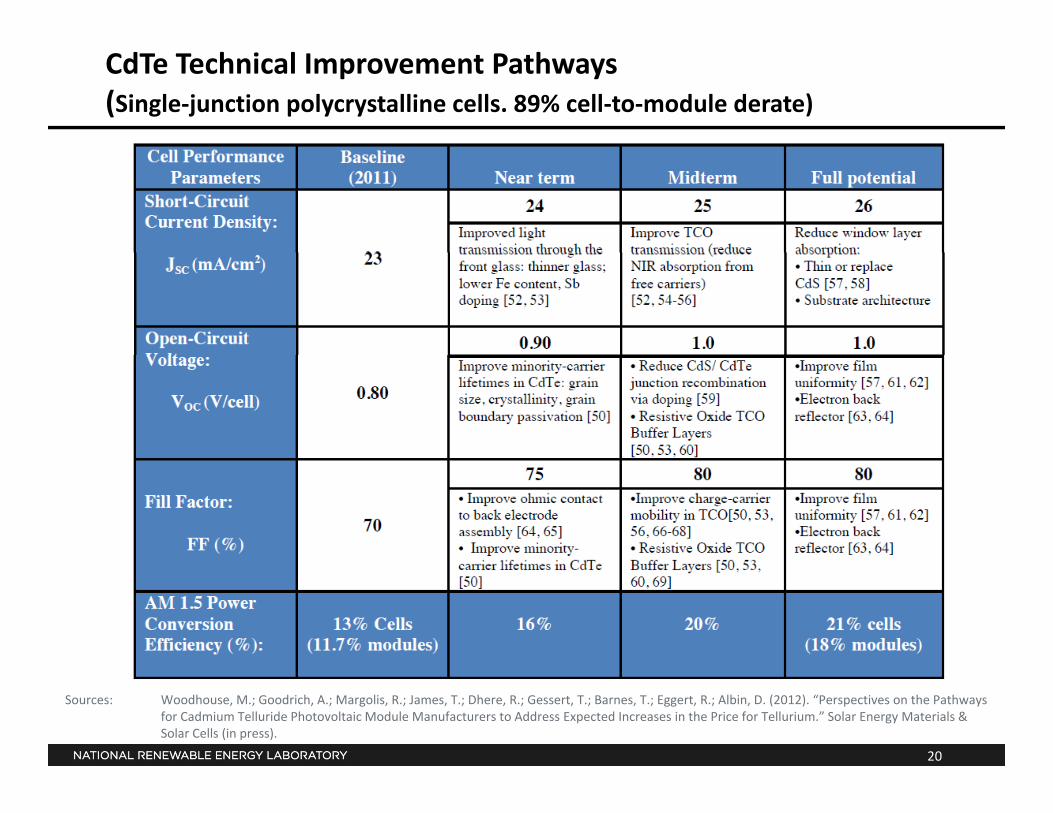
CdTe Technical Improvement Pathways(Single‐junction polycrystalline cells. 89% cell‐to‐module derate)
20
Sources: Woodhouse, M.; Goodrich, A.; Margolis, R.; James, T.; Dhere, R.; Gessert, T.; Barnes, T.; Eggert, R.; Albin, D. (2012). “Perspectives on the Pathways for Cadmium Telluride Photovoltaic Module Manufacturers to Address Expected Increases in the Price for Tellurium.” Solar Energy Materials & Solar Cells (in press).
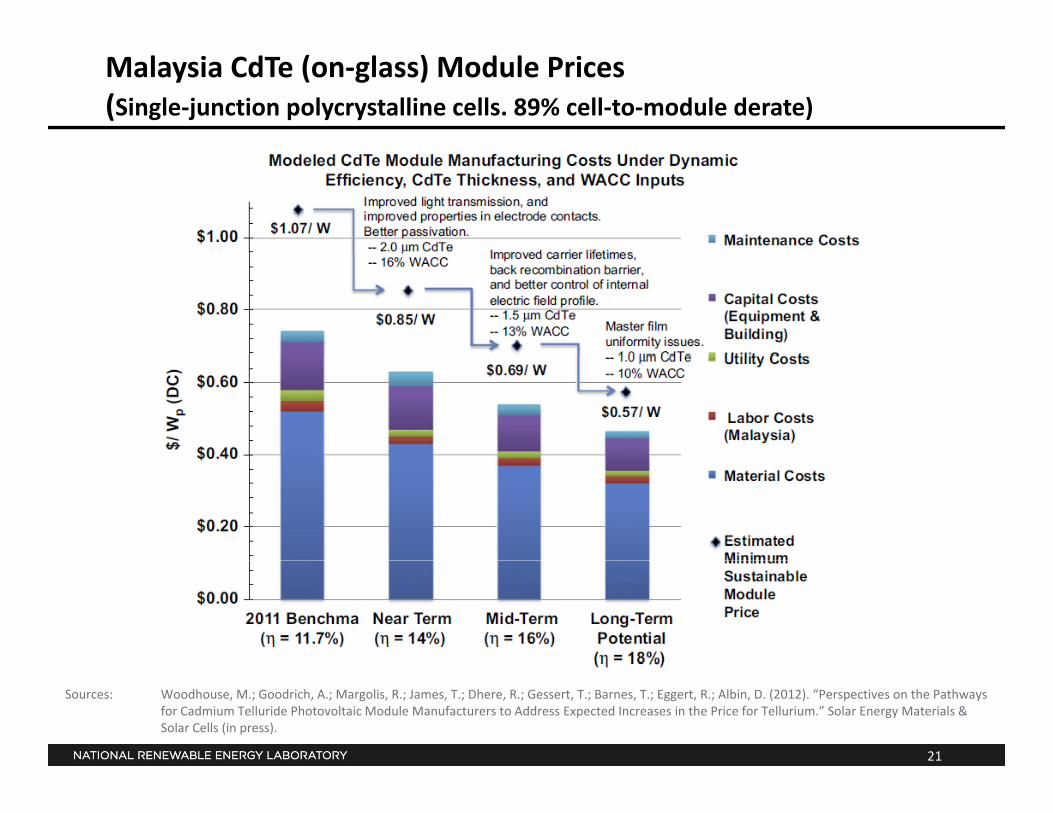
Malaysia CdTe (on‐glass) Module Prices(Single‐junction polycrystalline cells. 89% cell‐to‐module derate)
21
Sources: Woodhouse, M.; Goodrich, A.; Margolis, R.; James, T.; Dhere, R.; Gessert, T.; Barnes, T.; Eggert, R.; Albin, D. (2012). “Perspectives on the Pathways for Cadmium Telluride Photovoltaic Module Manufacturers to Address Expected Increases in the Price for Tellurium.” Solar Energy Materials & Solar Cells (in press).
dSystem Price TrendsMarket DistortionsRegional Variations
22
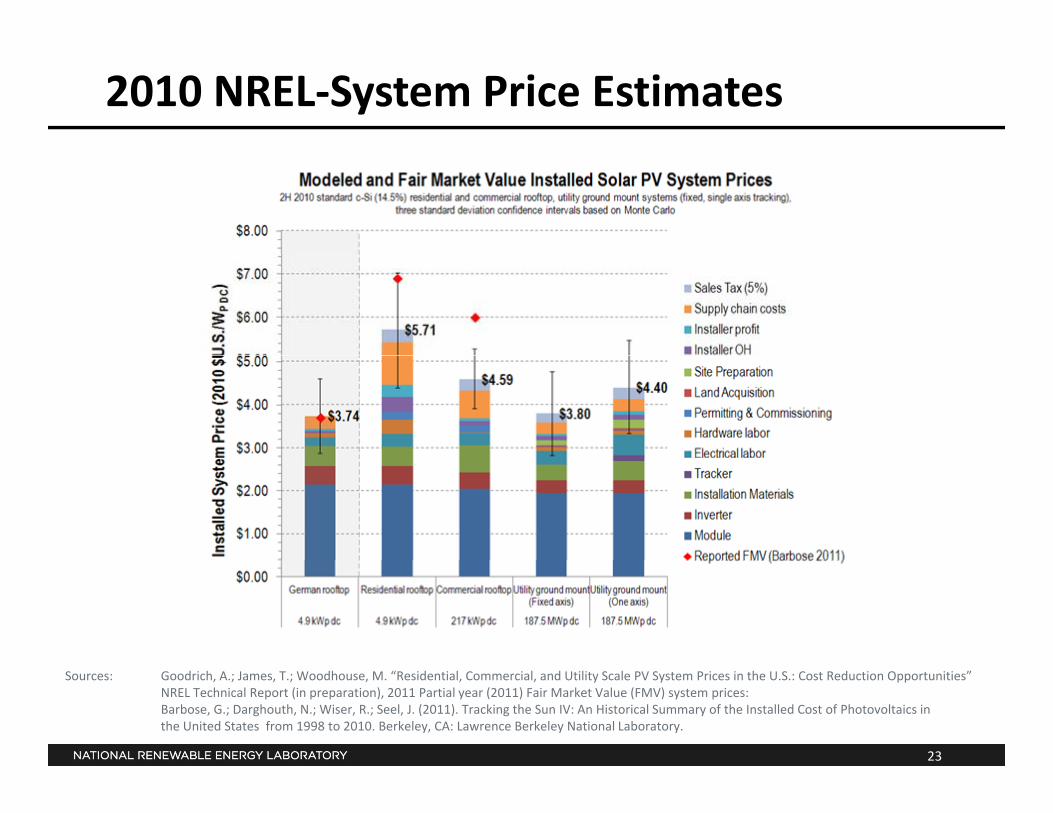
2010 NREL‐System Price Estimates
23
Sources: Goodrich, A.; James, T.; Woodhouse, M. “Residential, Commercial, and Utility Scale PV System Prices in the U.S.: Cost Reduction Opportunities” NREL Technical Report (in preparation), 2011 Partial year (2011) Fair Market Value (FMV) system prices: Barbose, G.; Darghouth, N.; Wiser, R.; Seel, J. (2011). Tracking the Sun IV: An Historical Summary of the Installed Cost of Photovoltaics in the United States from 1998 to 2010. Berkeley, CA: Lawrence Berkeley National Laboratory.
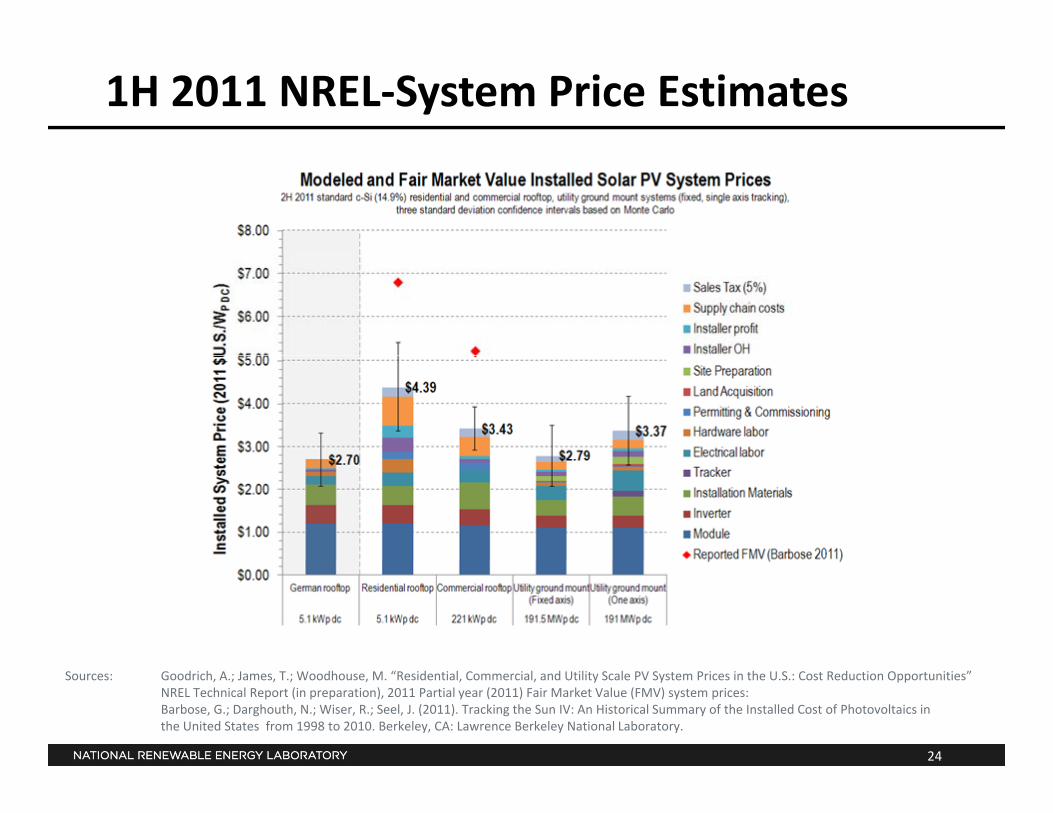
1H 2011 NREL‐System Price Estimates
24
Sources: Goodrich, A.; James, T.; Woodhouse, M. “Residential, Commercial, and Utility Scale PV System Prices in the U.S.: Cost Reduction Opportunities” NREL Technical Report (in preparation), 2011 Partial year (2011) Fair Market Value (FMV) system prices: Barbose, G.; Darghouth, N.; Wiser, R.; Seel, J. (2011). Tracking the Sun IV: An Historical Summary of the Installed Cost of Photovoltaics in the United States from 1998 to 2010. Berkeley, CA: Lawrence Berkeley National Laboratory.
© 2012 SEIA © 2012 SEIA
Status of the U.S. Solar Industry
Justin Baca Senior Research Manger Solar Energy Industries Association
© 2012 SEIA
About SEIA • Founded in 1974 • U.S. National Trade Association for Solar Energy
• 1,000+ member companies from around the world • Members from across 50 states • Largest companies in the world as well as small installers
• Our Mission: Build a strong solar industry to power America • Our Goal: 10 gigawatts (GW) of annual installed solar capacity in
the U.S. by 2015
© 2012 SEIA
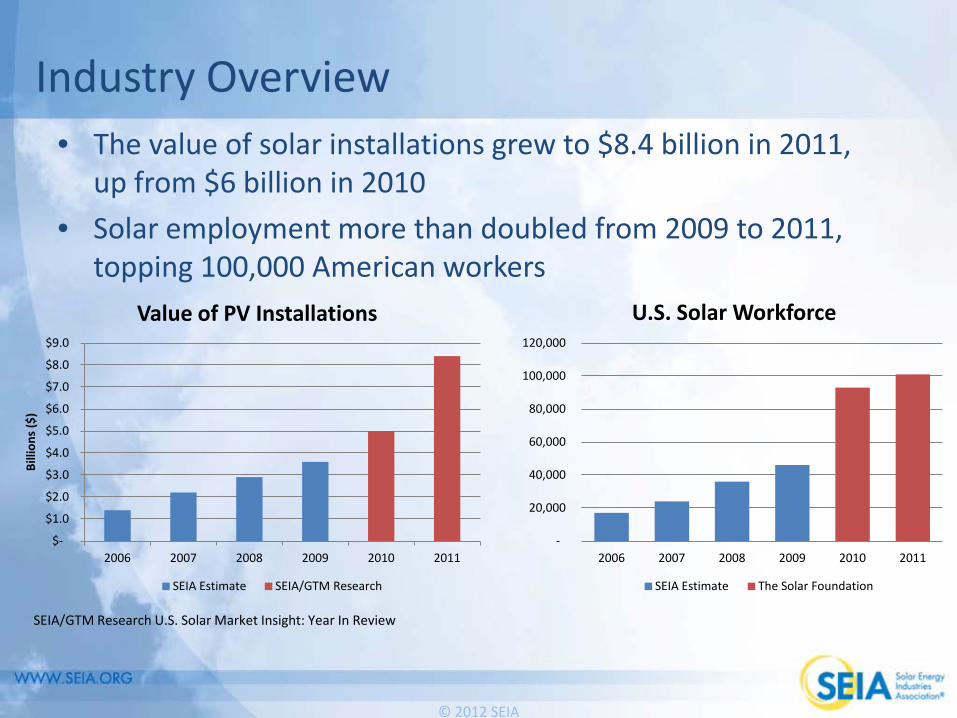
Industry Overview • The value of solar installations grew to $8.4 billion in 2011,
up from $6 billion in 2010 • Solar employment more than doubled from 2009 to 2011,
topping 100,000 American workers
SEIA/GTM Research U.S. Solar Market Insight: Year In Review
-
20,000
40,000
60,000
80,000
100,000
120,000
2006 2007 2008 2009 2010 2011
U.S. Solar Workforce
SEIA Estimate The Solar Foundation
$-
$1.0
$2.0
$3.0
$4.0
$5.0
$6.0
$7.0
$8.0
$9.0
2006 2007 2008 2009 2010 2011
Billi
ons (
$)
Value of PV Installations
SEIA Estimate SEIA/GTM Research
© 2012 SEIA
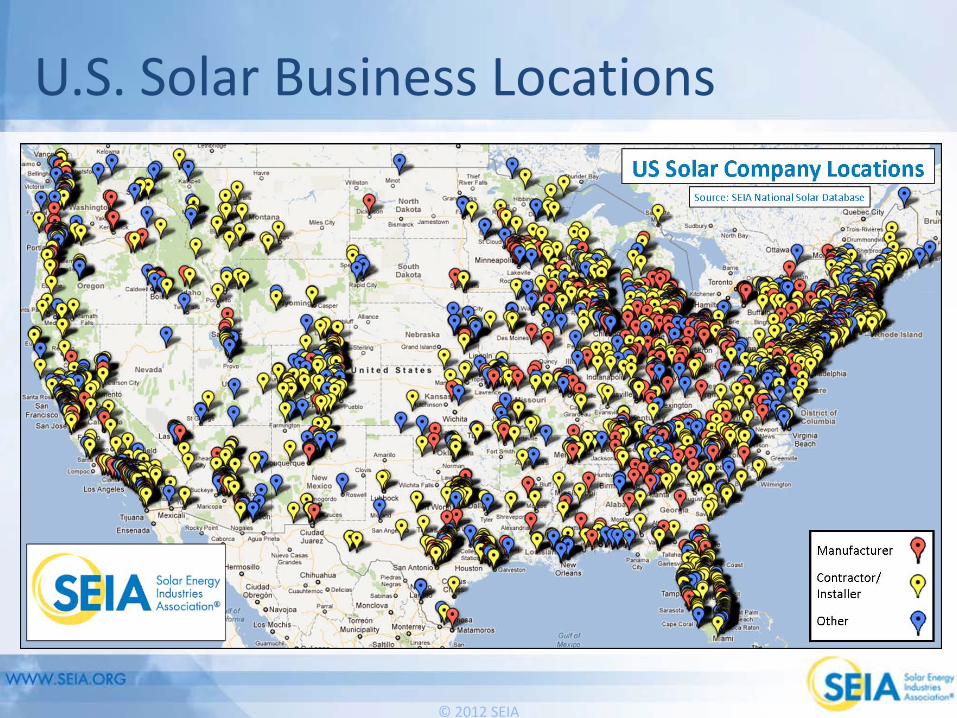
U.S. Solar Business Locations
© 2012 SEIA
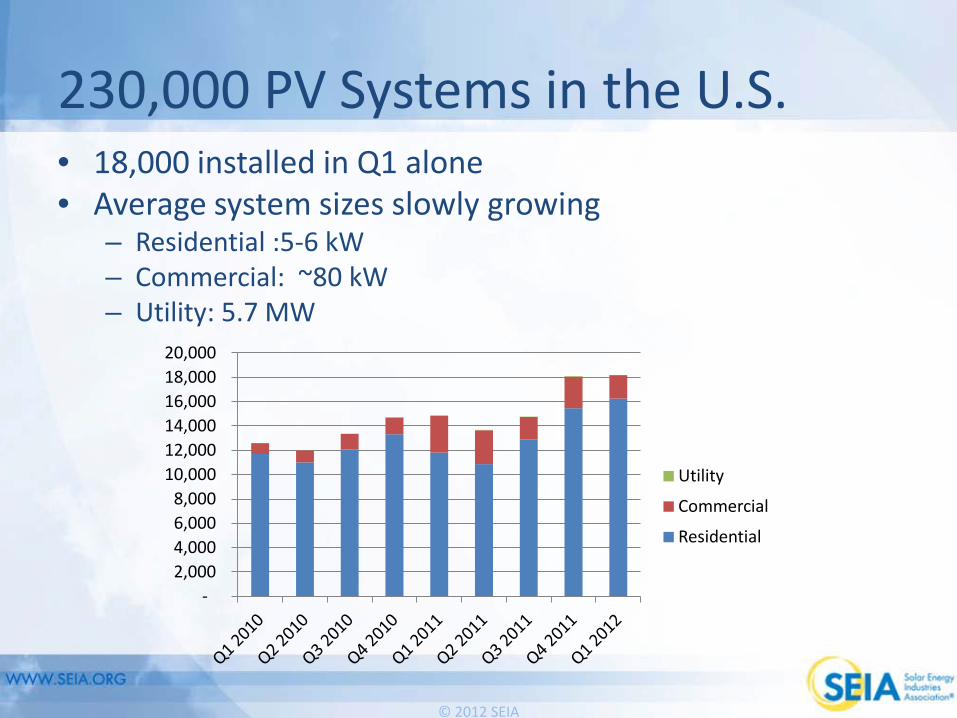
230,000 PV Systems in the U.S. • 18,000 installed in Q1 alone • Average system sizes slowly growing
– Residential :5-6 kW – Commercial: ~80 kW – Utility: 5.7 MW
- 2,000 4,000 6,000 8,000
10,000 12,000 14,000 16,000 18,000 20,000
Utility
Commercial
Residential
© 2012 SEIA
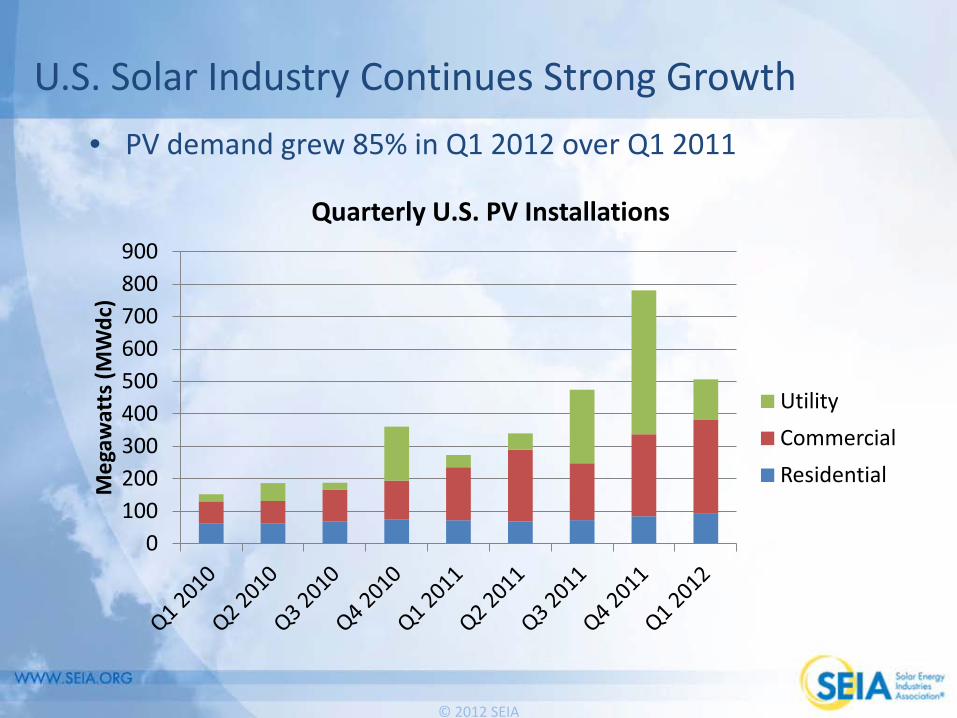
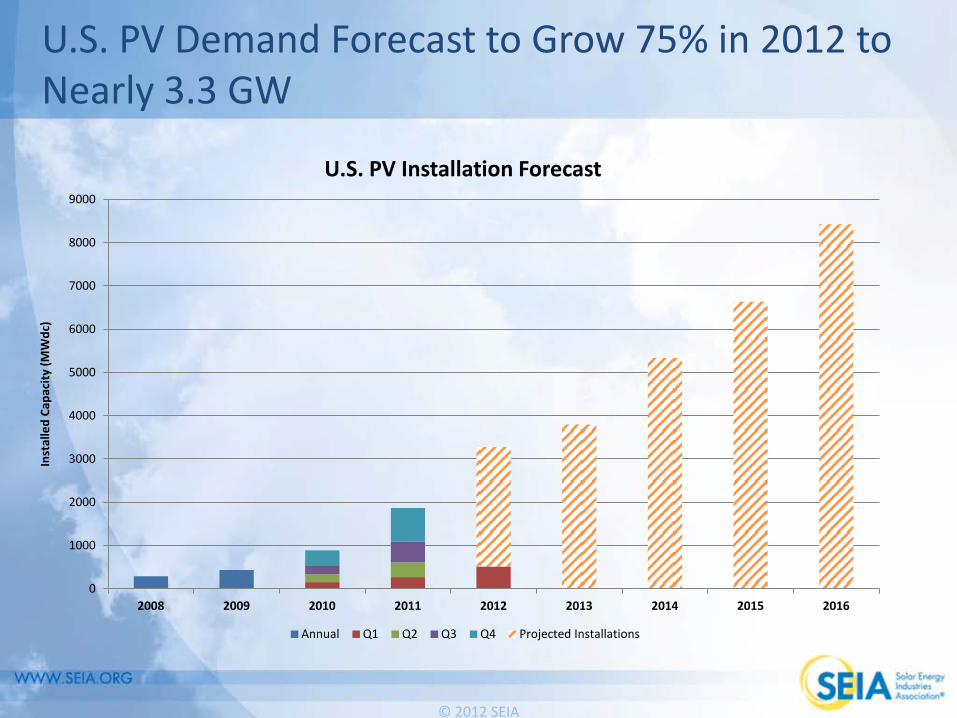
U.S. Solar Industry Continues Strong Growth • PV demand grew 85% in Q1 2012 over Q1 2011
0 100 200 300 400 500 600 700 800 900
Meg
awat
ts (M
Wdc
)
Quarterly U.S. PV Installations
Utility Commercial Residential
© 2012 SEIA
U.S. PV Demand Forecast to Grow 75% in 2012 to Nearly 3.3 GW
0
1000
2000
3000
4000
5000
6000
7000
8000
9000
2008 2009 2010 2011 2012 2013 2014 2015 2016
Inst
alle
d Ca
paci
ty (M
Wdc
)
U.S. PV Installation Forecast
Annual Q1 Q2 Q3 Q4 Projected Installations

© 2012 SEIA
U.S. to Lead in CSP • California, Arizona and Nevada are leading states for CSP • The current CSP pipeline contains some 5,700 MW of projects
with signed PPAs • 1,300 MW under construction
-
500
1,000
1,500
2,000
2,500 CSP & CPV Forecast
Installations Forecast
© 2012 SEIA
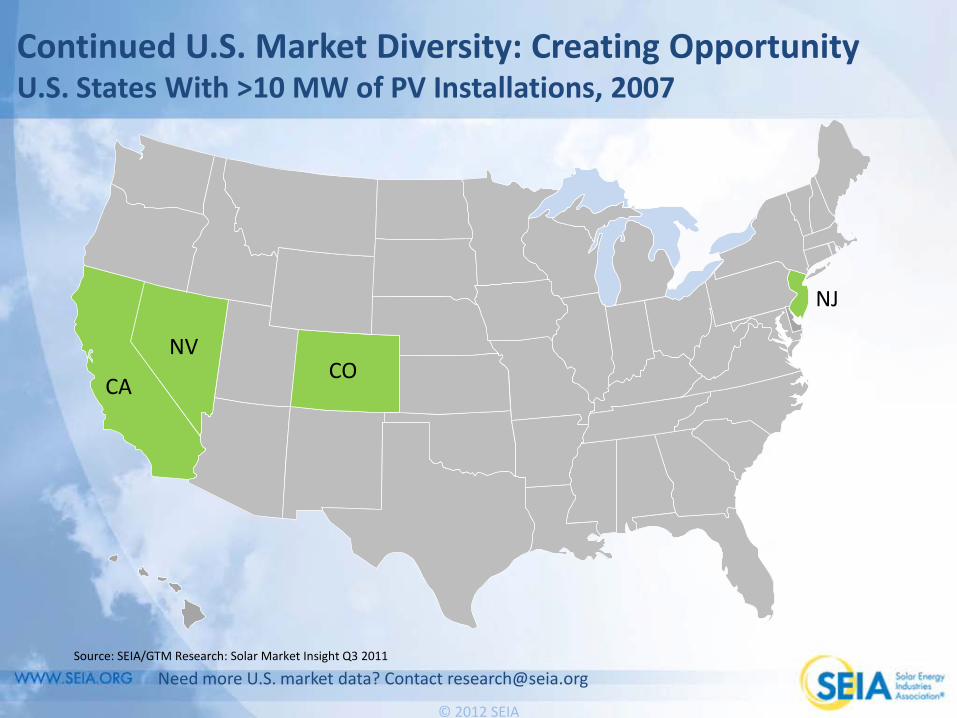
Continued U.S. Market Diversity: Creating Opportunity U.S. States With >10 MW of PV Installations, 2007
NV
NJ
CO CA
Source: SEIA/GTM Research: Solar Market Insight Q3 2011
Need more U.S. market data? Contact [email protected]
© 2012 SEIA
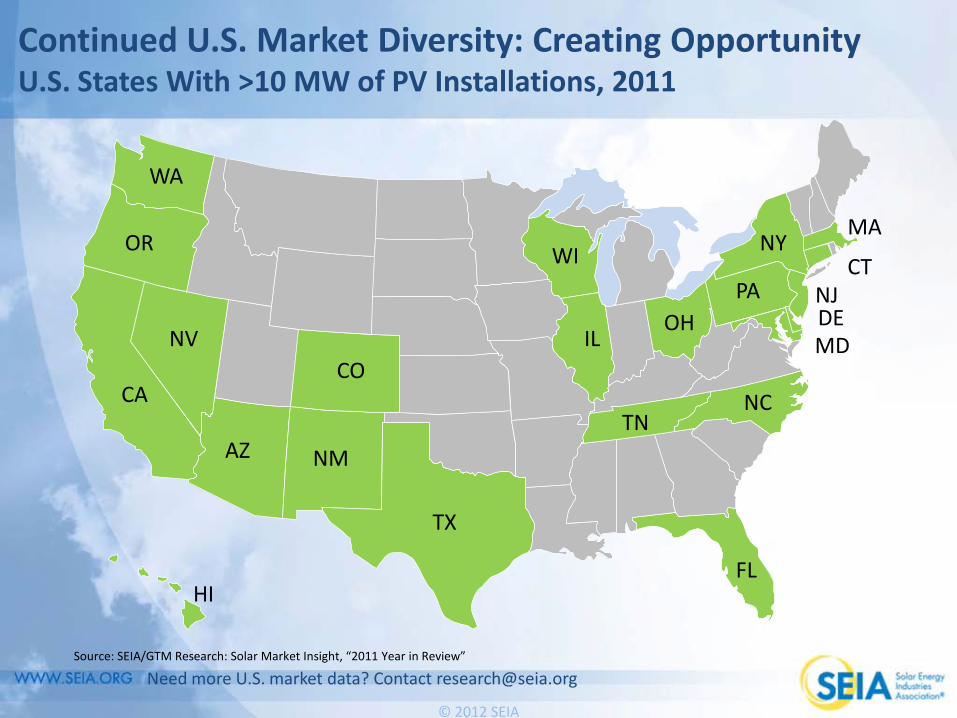
Continued U.S. Market Diversity: Creating Opportunity U.S. States With >10 MW of PV Installations, 2011
HI
NV CO
CA
FL
AZ NM
TX
IL OH
PA
MA NY
NC
NJ
OR
Need more U.S. market data? Contact [email protected]
CT
DE MD
TN
WA
WI
Source: SEIA/GTM Research: Solar Market Insight, “2011 Year in Review”
© 2012 SEIA
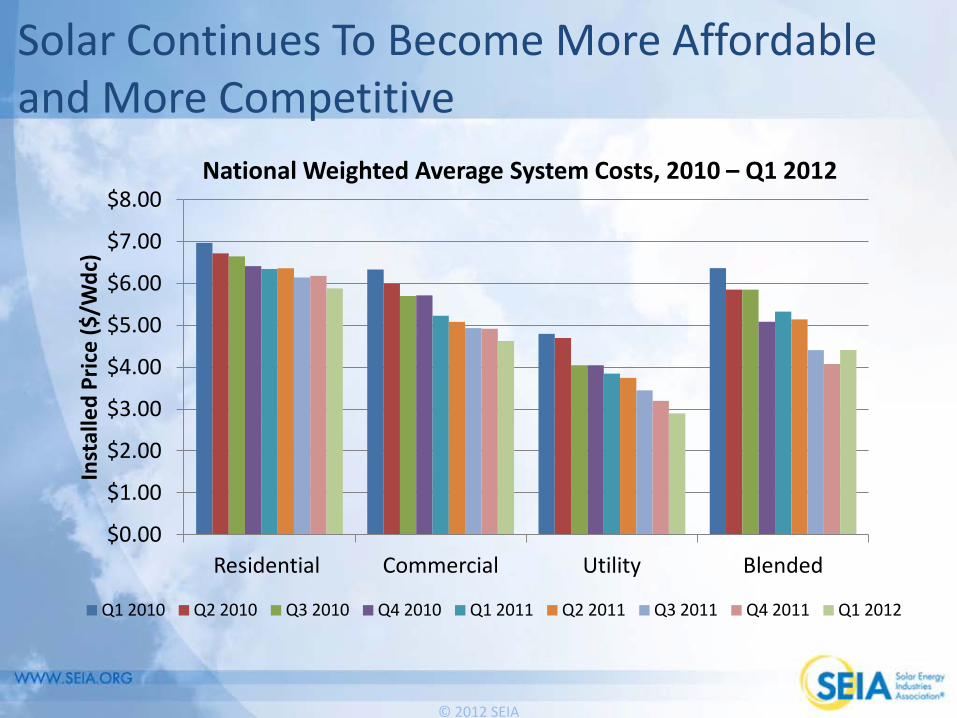
Solar Continues To Become More Affordable and More Competitive
$0.00
$1.00
$2.00
$3.00
$4.00
$5.00
$6.00
$7.00
$8.00
Residential Commercial Utility Blended
Inst
alle
d Pr
ice
($/W
dc)
National Weighted Average System Costs, 2010 – Q1 2012
Q1 2010 Q2 2010 Q3 2010 Q4 2010 Q1 2011 Q2 2011 Q3 2011 Q4 2011 Q1 2012
© 2012 SEIA
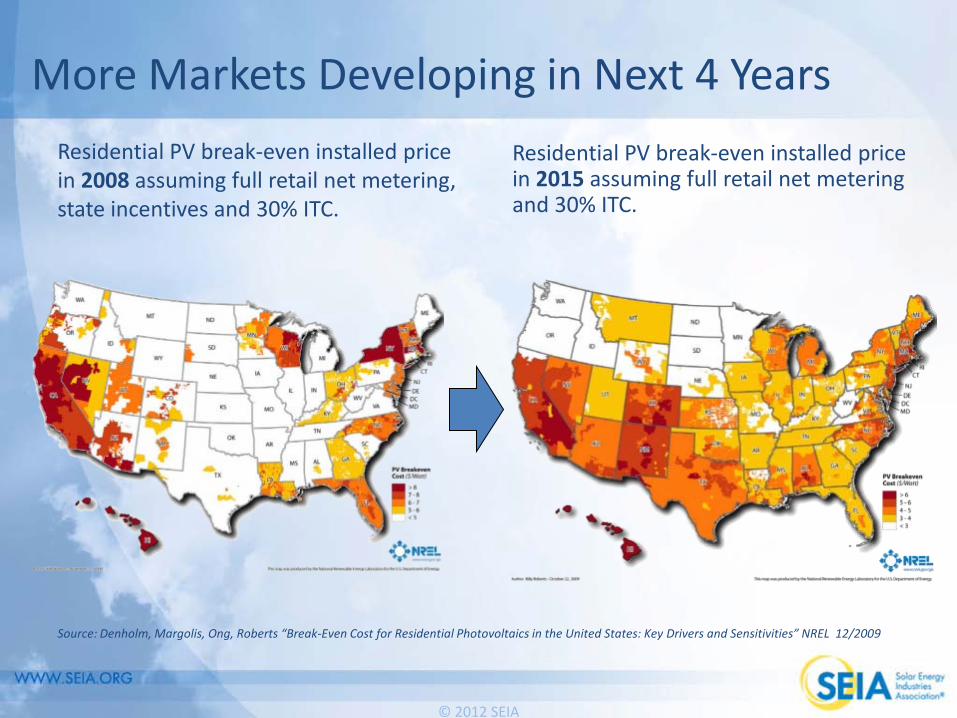
More Markets Developing in Next 4 Years Residential PV break-even installed price in 2008 assuming full retail net metering, state incentives and 30% ITC.
Residential PV break-even installed price in 2015 assuming full retail net metering and 30% ITC.
Source: Denholm, Margolis, Ong, Roberts “Break-Even Cost for Residential Photovoltaics in the United States: Key Drivers and Sensitivities” NREL 12/2009
© 2012 SEIA
Other Issues • SolarWorld trade case against Chinese cell manufacturers • Expiration of 1603 Treasury program at end of 2011 and tax
equity supply • Expiration of 30% Investment Tax Credit at the end of 2016 • Soft Costs

© 2012 SEIA
THANK YOU Justin Baca
Senior Research Manager [email protected]
More detailed data available in the quarterly U.S. Solar Market Insight
reports. Discounts on research and trade shows for SEIA members.
Interested in joining SEIA? [email protected]
Related Documents