GLOBAL Insight February 2022 Perspectives from the Global Portfolio Advisory Committee The bull market’s rocky road As the U.S. equity market faces headwinds including inflation and expected rate hikes, we look at the implications for portfolios. Bogdanova & Allworth | Page 4 Also in this issue GLOBAL EQUITY Farther to run GLOBAL FIXED INCOME The stage is set KEY FORECASTS For important and required non-U.S. analyst disclosures, see page 15. Produced: Feb. 2, 2022 10:41 am ET; Disseminated: Feb. 2, 2022 1:09 pm ET Investment and insurance products offered through RBC Wealth Management are not insured by the FDIC or any other federal government agency, are not deposits or other obligations of, or guaranteed by, a bank or any bank affiliate, and are subject to investment risks, including possible loss of the principal amount invested.

Welcome message from author
This document is posted to help you gain knowledge. Please leave a comment to let me know what you think about it! Share it to your friends and learn new things together.
Transcript

GLOBAL
InsightFebruary 2022Perspectives from the Global Portfolio Advisory Committee
The bull market’s rocky roadAs the U.S. equity market faces headwinds including inflation and expected rate hikes, we look at the implications for portfolios.
Bogdanova & Allworth | Page 4
Also in this issue
GLOBAL EQUITY
Farther to runGLOBAL FIXED INCOME
The stage is setKEY FORECASTS
For important and required non-U.S. analyst disclosures, see page 15. Produced: Feb. 2, 2022 10:41 am ET; Disseminated: Feb. 2, 2022 1:09 pm ET
Investment and insurance products offered through RBC Wealth Management are not insured by the FDIC or any other federal government agency, are not deposits or other obligations of, or guaranteed by, a bank or any bank affiliate, and are subject to investment risks, including possible loss of the principal amount invested.

GLOBAL
InsightFebruary 2022
CONTENTS4 The bull market’s rocky roadAs the U.S. equity market faces headwinds including inflation and expected rate hikes, we look at the implications for portfolios.
9 Global equity: Farther to runRecent market turbulence notwithstanding, leading economic indicators show the U.S. economy still firmly in expansion mode. We see scope for further equity gains—though volatility may stick around.
10 Global fixed income: The stage is set Central banks will be spending the next few months determining their next steps on the policy front. Despite the many questions they face, we think global monetary policy will remain accommodative through at least 2022.
IN THE MARKETS3 RBC’s investment stance
9 Global equity
10 Global fixed income
12 Key forecasts
13 Market scorecard
All values in U.S. dollars and priced as of market close, January 31, 2022, unless otherwise stated.
Asset Class View
– = +
Equities
Fixed Income
Expect below-average
performance
Expect above-average performance
Page 3 of 17 Global Insight, February 2022
RBC’S INVESTMENT
Stance
Global asset class views
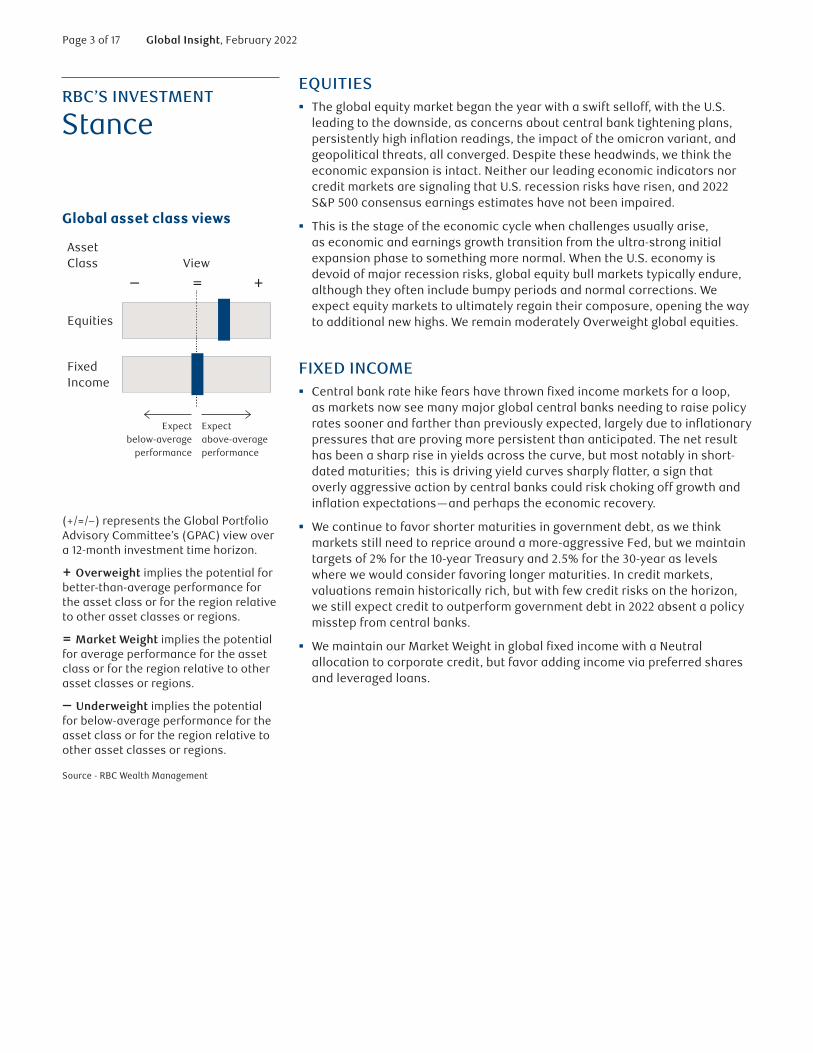
EQUITIES � The global equity market began the year with a swift selloff, with the U.S.
leading to the downside, as concerns about central bank tightening plans, persistently high inflation readings, the impact of the omicron variant, and geopolitical threats, all converged. Despite these headwinds, we think the economic expansion is intact. Neither our leading economic indicators nor credit markets are signaling that U.S. recession risks have risen, and 2022 S&P 500 consensus earnings estimates have not been impaired.
� This is the stage of the economic cycle when challenges usually arise, as economic and earnings growth transition from the ultra-strong initial expansion phase to something more normal. When the U.S. economy is devoid of major recession risks, global equity bull markets typically endure, although they often include bumpy periods and normal corrections. We expect equity markets to ultimately regain their composure, opening the way to additional new highs. We remain moderately Overweight global equities.
FIXED INCOME � Central bank rate hike fears have thrown fixed income markets for a loop,
as markets now see many major global central banks needing to raise policy rates sooner and farther than previously expected, largely due to inflationary pressures that are proving more persistent than anticipated. The net result has been a sharp rise in yields across the curve, but most notably in short-dated maturities; this is driving yield curves sharply flatter, a sign that overly aggressive action by central banks could risk choking off growth and inflation expectations—and perhaps the economic recovery.
� We continue to favor shorter maturities in government debt, as we think markets still need to reprice around a more-aggressive Fed, but we maintain targets of 2% for the 10-year Treasury and 2.5% for the 30-year as levels where we would consider favoring longer maturities. In credit markets, valuations remain historically rich, but with few credit risks on the horizon, we still expect credit to outperform government debt in 2022 absent a policy misstep from central banks.
� We maintain our Market Weight in global fixed income with a Neutral allocation to corporate credit, but favor adding income via preferred shares and leveraged loans.
x
x
(+/=/–) represents the Global Portfolio Advisory Committee’s (GPAC) view over a 12-month investment time horizon.
+ Overweight implies the potential for better-than-average performance for the asset class or for the region relative to other asset classes or regions.
= Market Weight implies the potential for average performance for the asset class or for the region relative to other asset classes or regions.
– Underweight implies the potential for below-average performance for the asset class or for the region relative to other asset classes or regions.
Source - RBC Wealth Management
Page 4 of 17 Global Insight, February 2022
MONTHLY
Focus
Kelly Bogdanova San Francisco, United States [email protected]
Jim Allworth Vancouver, Canada [email protected]
The bull market’s rocky roadWhat to make of the recent volatility in equity markets? As markets face headwinds including high inflation and the anticipation of interest rate hikes, we look at the sources of angst—and implications for portfolio positioning.
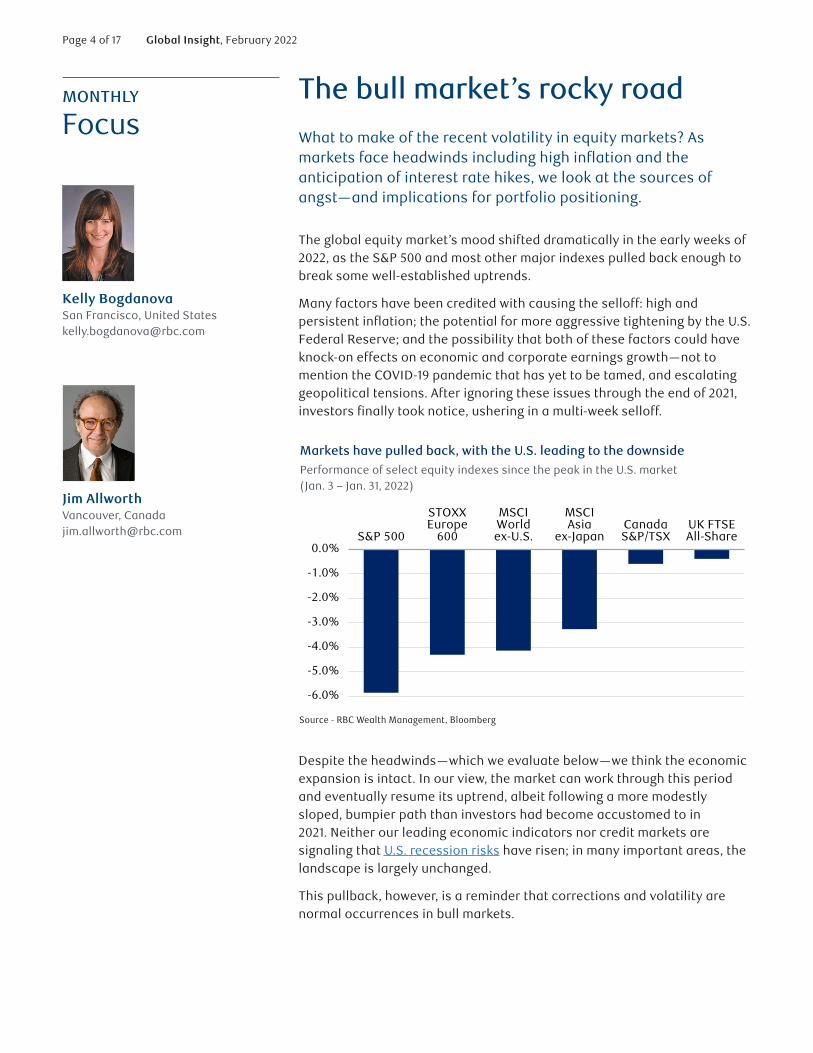
The global equity market’s mood shifted dramatically in the early weeks of 2022, as the S&P 500 and most other major indexes pulled back enough to break some well-established uptrends.
Many factors have been credited with causing the selloff: high and persistent inflation; the potential for more aggressive tightening by the U.S. Federal Reserve; and the possibility that both of these factors could have knock-on effects on economic and corporate earnings growth—not to mention the COVID-19 pandemic that has yet to be tamed, and escalating geopolitical tensions. After ignoring these issues through the end of 2021, investors finally took notice, ushering in a multi-week selloff.
Markets have pulled back, with the U.S. leading to the downsidePerformance of select equity indexes since the peak in the U.S. market (Jan. 3 – Jan. 31, 2022)
-6.0%
-5.0%
-4.0%
-3.0%
-2.0%
-1.0%
0.0%S&P 500
STOXXEurope
600
MSCIWorldex-U.S.
MSCIAsia
ex-JapanCanadaS&P/TSX
UK FTSEAll-Share
Source - RBC Wealth Management, Bloomberg
Despite the headwinds—which we evaluate below—we think the economic expansion is intact. In our view, the market can work through this period and eventually resume its uptrend, albeit following a more modestly sloped, bumpier path than investors had become accustomed to in 2021. Neither our leading economic indicators nor credit markets are signaling that U.S. recession risks have risen; in many important areas, the landscape is largely unchanged.
This pullback, however, is a reminder that corrections and volatility are normal occurrences in bull markets.

Page 5 of 17 Global Insight, February 2022
MONTHLY FOCUSThe bull market’s rocky road
As the chart illustrates, the S&P 500 has pulled back 10 percent or more at some point during the year in over half of the years since 2000. It’s important to recognize that pullbacks and corrections are not uncommon even in good years: among the 13 years with above-average annual returns, 10 included periods where the market pulled back seven percent or more.
Every market disruption has different catalysts and unique contours. In our view, the outlook for inflation and Fed policy, together with the knock-on effects these could have on economic expansion and corporate earnings growth, are the primary considerations that should factor into equity portfolio positioning.
Reality check: Pullbacks happen even in good yearsS&P 500 total returns and pullbacks each year since 2000
-9% -12% -22%
29%
11%5%
16%6%
-37%
26%
15%
2%
16%
32%
14%
1%
12%22%
-4%
31%
18%29%
-17%
-29% -33%
-14%-7% -7% -7% -10%
-47%
-27%
-16% -19%-10% -6% -7%
-12% -9%-3%
-19%
-7%
-34%
-5%
'00 '01 '02 '03 '04 '05 '06 '07 '08 '09 '10 '11 '12 '13 '14 '15 '16 '17 '18 '19 '20 '21
S&P 500 calendar-year price return (including dividends) Maximum peak-to-trough decline during calendar year
Source - RBC Wealth Management, Bloomberg; data through 12/31/21
The challenge of taming inflation
Our economists’ near-term inflation outlook is for more of the same: uncomfortably high inflation rates for several months. They anticipate the situation will improve in the second half of the year. The rate of goods inflation seems set to recede as supply chains gradually get back in gear and COVID-19-related anomalies fade further.
Some improvement is baked into Wall Street’s expectations, if only because the surging inflation in the second half of 2021 will make for easy comparisons with the same period this year.
Sticker shock
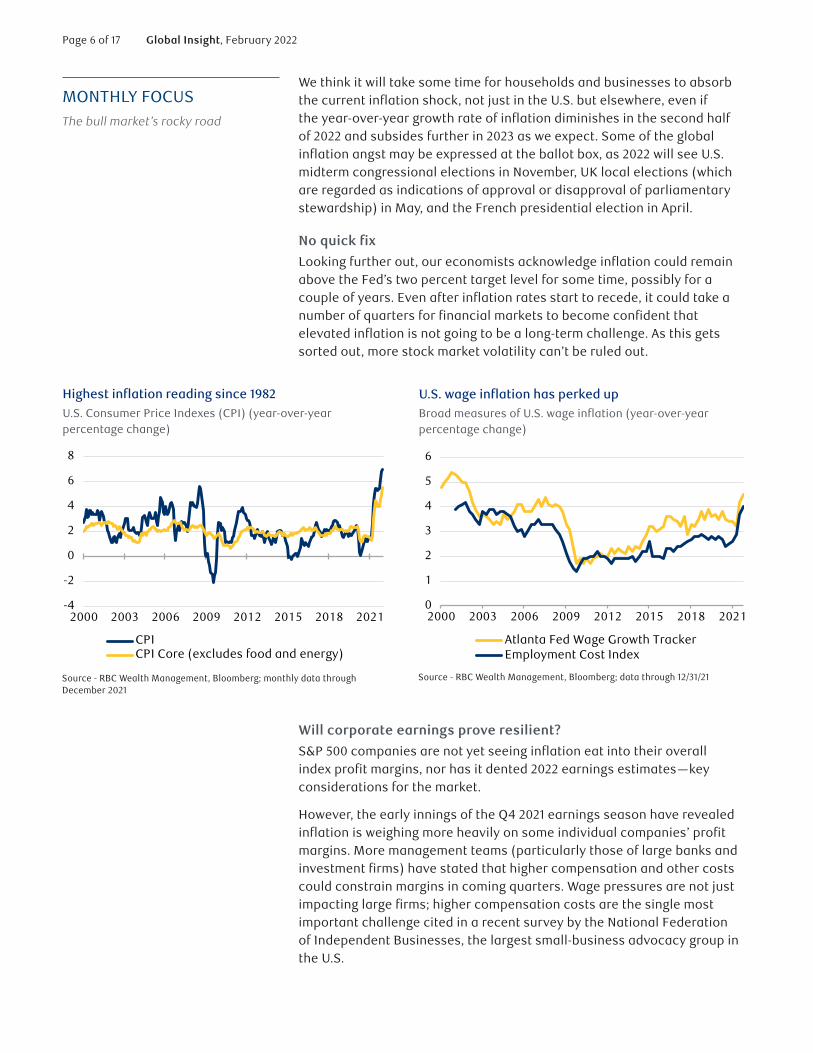
But even if U.S. inflation were to fall back from its current rate of 7.0 percent to an average of 4.0 percent in Q3 and 2.7 percent in Q4—a plausible scenario, according to RBC Capital Markets—it would still be advancing at an above-normal clip.
Consumer prices are already 8.3 percent in aggregate above where they were before the pandemic began in January 2020—this is what households and businesses experience; their reference point is not the year-over-year rate.
Page 6 of 17 Global Insight, February 2022
MONTHLY FOCUSThe bull market’s rocky road
We think it will take some time for households and businesses to absorb the current inflation shock, not just in the U.S. but elsewhere, even if the year-over-year growth rate of inflation diminishes in the second half of 2022 and subsides further in 2023 as we expect. Some of the global inflation angst may be expressed at the ballot box, as 2022 will see U.S. midterm congressional elections in November, UK local elections (which are regarded as indications of approval or disapproval of parliamentary stewardship) in May, and the French presidential election in April.
No quick fix
Looking further out, our economists acknowledge inflation could remain above the Fed’s two percent target level for some time, possibly for a couple of years. Even after inflation rates start to recede, it could take a number of quarters for financial markets to become confident that elevated inflation is not going to be a long-term challenge. As this gets sorted out, more stock market volatility can’t be ruled out.
Highest inflation reading since 1982U.S. Consumer Price Indexes (CPI) (year-over-year percentage change)
-4
-2
0
2
4
6
8
2000 2003 2006 2009 2012 2015 2018 2021
CPICPI Core (excludes food and energy)
Source - RBC Wealth Management, Bloomberg; monthly data through December 2021
U.S. wage inflation has perked upBroad measures of U.S. wage inflation (year-over-year percentage change)
0
1
2
3
4
5
6
2000 2003 2006 2009 2012 2015 2018 2021
Atlanta Fed Wage Growth TrackerEmployment Cost Index
Source - RBC Wealth Management, Bloomberg; data through 12/31/21
Will corporate earnings prove resilient?
S&P 500 companies are not yet seeing inflation eat into their overall index profit margins, nor has it dented 2022 earnings estimates—key considerations for the market.
However, the early innings of the Q4 2021 earnings season have revealed inflation is weighing more heavily on some individual companies’ profit margins. More management teams (particularly those of large banks and investment firms) have stated that higher compensation and other costs could constrain margins in coming quarters. Wage pressures are not just impacting large firms; higher compensation costs are the single most important challenge cited in a recent survey by the National Federation of Independent Businesses, the largest small-business advocacy group in the U.S.
Page 7 of 17 Global Insight, February 2022
MONTHLY FOCUSThe bull market’s rocky road
Even consumer staples companies, which usually are able to pass higher input costs on to consumers through price increases, have noted that it is becoming more difficult to manage expenses.
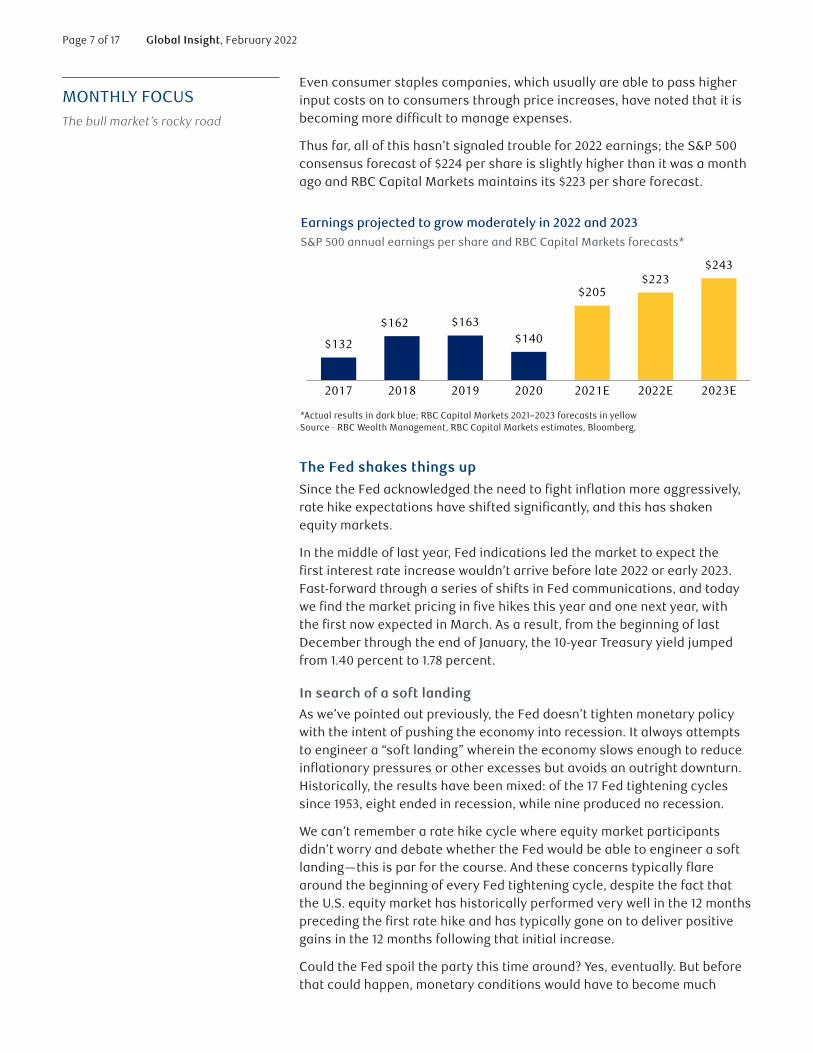
Thus far, all of this hasn’t signaled trouble for 2022 earnings; the S&P 500 consensus forecast of $224 per share is slightly higher than it was a month ago and RBC Capital Markets maintains its $223 per share forecast.
Earnings projected to grow moderately in 2022 and 2023S&P 500 annual earnings per share and RBC Capital Markets forecasts*
$132
$162 $163$140
$205$223
$243
2017 2018 2019 2020 2021E 2022E 2023E
*Actual results in dark blue; RBC Capital Markets 2021–2023 forecasts in yellow Source - RBC Wealth Management, RBC Capital Markets estimates, Bloomberg,
The Fed shakes things up
Since the Fed acknowledged the need to fight inflation more aggressively, rate hike expectations have shifted significantly, and this has shaken equity markets.
In the middle of last year, Fed indications led the market to expect the first interest rate increase wouldn’t arrive before late 2022 or early 2023. Fast-forward through a series of shifts in Fed communications, and today we find the market pricing in five hikes this year and one next year, with the first now expected in March. As a result, from the beginning of last December through the end of January, the 10-year Treasury yield jumped from 1.40 percent to 1.78 percent.
In search of a soft landing
As we’ve pointed out previously, the Fed doesn’t tighten monetary policy with the intent of pushing the economy into recession. It always attempts to engineer a “soft landing” wherein the economy slows enough to reduce inflationary pressures or other excesses but avoids an outright downturn. Historically, the results have been mixed: of the 17 Fed tightening cycles since 1953, eight ended in recession, while nine produced no recession.
We can’t remember a rate hike cycle where equity market participants didn’t worry and debate whether the Fed would be able to engineer a soft landing—this is par for the course. And these concerns typically flare around the beginning of every Fed tightening cycle, despite the fact that the U.S. equity market has historically performed very well in the 12 months preceding the first rate hike and has typically gone on to deliver positive gains in the 12 months following that initial increase.
Could the Fed spoil the party this time around? Yes, eventually. But before that could happen, monetary conditions would have to become much

Page 8 of 17 Global Insight, February 2022
MONTHLY FOCUSThe bull market’s rocky road
tighter; we think that would be a considerable distance down the road, and involve many more rate hikes than the Fed currently has planned for this year and next.
Tightening tensions
Financial markets will also have to contend with the Fed reducing the size of its balance sheet as a proportion of GDP—a process known as quantitative tightening or QT. Our Fixed Income Strategies team points out that the Fed’s balance sheet has ballooned to almost $9 trillion, a record 38 percent of GDP, since the Fed started pumping liquidity into the financial system during the height of the COVID-19 pandemic. The previous peak of 26 percent was reached in 2013, in the aftermath of the global financial crisis.
When the Fed moved to reduce its bloated balance sheet in the post-financial-crisis decade, both bonds and equities corrected. While our fixed income colleagues see the potential for similar, temporary volatility spikes as the Fed winds down the balance sheet this time around, they do not see a high risk of permanent impairment to asset prices. They point out that the Fed possesses several tools to keep the challenges associated with QT at bay, but market volatility is likely to emerge nonetheless.
A bull market in transition
Equity markets are grappling with these uncomfortable headwinds. This is the stage of the economic cycle when challenges typically arise, as economic and earnings growth transition from the ultra-strong initial expansion phase to something more normal.
When the U.S. economy is devoid of major recession risks, global equity bull markets typically endure, although they often include bumpy periods and normal corrections. It is when recession risks increase meaningfully that bull markets tend to run into real trouble. Currently, none of our seven leading economic indicators of U.S. recession are flashing red, or even yellow; their behavior suggests this economic expansion has farther to run. That should mean corporate earnings and business values will be able to move higher from here.
While the risks currently facing equity markets have the potential to generate further volatility or downside, we don’t think the economic backdrop has deteriorated in such a way that investors should reposition broad asset class exposure in portfolios. We remain moderately Overweight global equities, with the view that major developed equity markets have the potential to deliver worthwhile gains for the year ahead and probably beyond.

Page 9 of 17 Global Insight, February 2022
GLOBAL
Equity
Jim Allworth Vancouver, Canada [email protected]
Farther to run Global equity markets have been trending lower for several weeks as worries over central bank tightening plans, the impact of the omicron variant, persistently uncomfortable inflation readings, and geopolitical threats have all converged at the start of the new year.
So far, none of these look capable of delivering a fatal blow to the global economic recovery. The leading indicators of a U.S. recession tracked by RBC Wealth Management (updated in January) are unanimously pointing toward a U.S. economic expansion that has farther to run—perhaps much farther. None are signaling that a downturn in the world’s largest economy is approaching.
A growing economy is typically accompanied by rising corporate earnings and advancing business values. That said, the upward trajectories of growth, earnings, and valuations are likely to be shallower in slope and bumpier than during last year’s turbocharged run to
higher ground. Volatility, already on the scene, could be a feature for some time yet. But we expect equity markets to regain their composure in the second half of the year, opening the way to additional new highs by year’s end.
For a fuller discussion of the factors influencing equity markets, see “The bull market’s rocky road” on page 4.
Equity views
+ Overweight; = Market Weight; – Underweight Source - RBC Wealth Management
Region Current
Global +
United States +
Canada =
Continental Europe +
United Kingdom =
Asia (ex Japan) =
Japan =
Page 10 of 17 Global Insight, February 2022
GLOBAL
Fixed income
Thomas Garretson, CFA Minneapolis, United States [email protected]
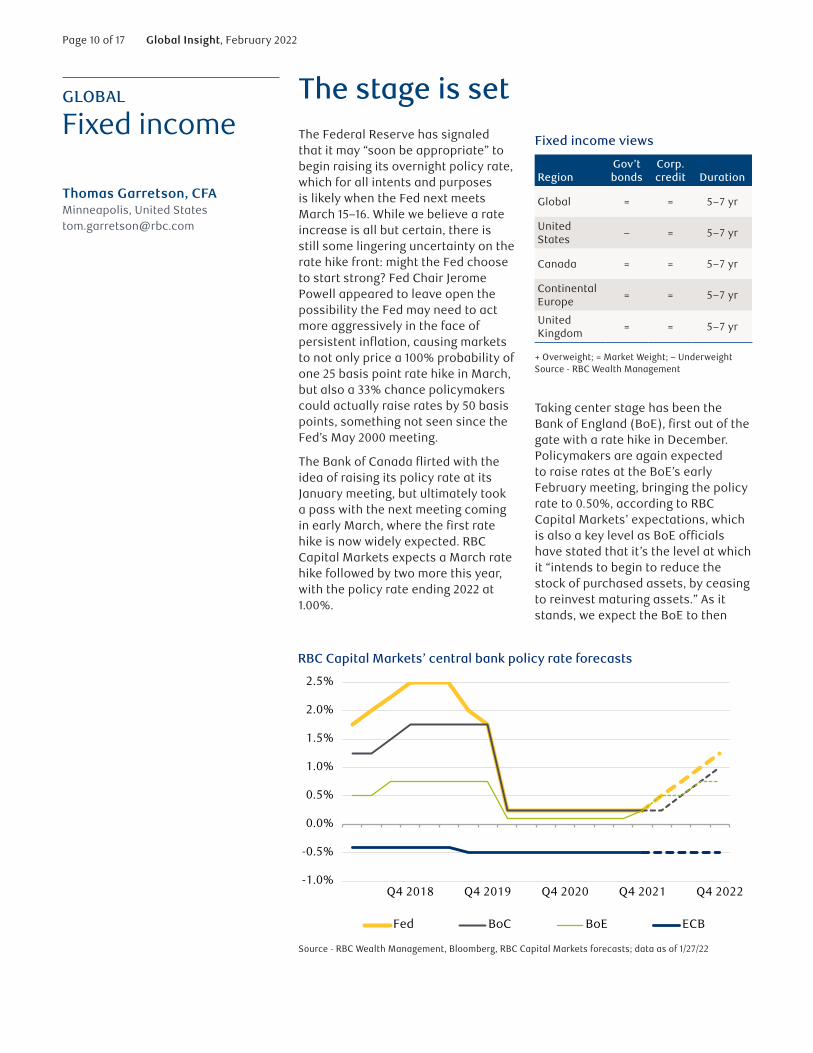
The stage is setThe Federal Reserve has signaled that it may “soon be appropriate” to begin raising its overnight policy rate, which for all intents and purposes is likely when the Fed next meets March 15–16. While we believe a rate increase is all but certain, there is still some lingering uncertainty on the rate hike front: might the Fed choose to start strong? Fed Chair Jerome Powell appeared to leave open the possibility the Fed may need to act more aggressively in the face of persistent inflation, causing markets to not only price a 100% probability of one 25 basis point rate hike in March, but also a 33% chance policymakers could actually raise rates by 50 basis points, something not seen since the Fed’s May 2000 meeting.
The Bank of Canada flirted with the idea of raising its policy rate at its January meeting, but ultimately took a pass with the next meeting coming in early March, where the first rate hike is now widely expected. RBC Capital Markets expects a March rate hike followed by two more this year, with the policy rate ending 2022 at 1.00%.
Taking center stage has been the Bank of England (BoE), first out of the gate with a rate hike in December. Policymakers are again expected to raise rates at the BoE’s early February meeting, bringing the policy rate to 0.50%, according to RBC Capital Markets’ expectations, which is also a key level as BoE officials have stated that it’s the level at which it “intends to begin to reduce the stock of purchased assets, by ceasing to reinvest maturing assets.” As it stands, we expect the BoE to then
RBC Capital Markets’ central bank policy rate forecasts
-1.0%
-0.5%
0.0%
0.5%
1.0%
1.5%
2.0%
2.5%
Q4 2018 Q4 2019 Q4 2020 Q4 2021 Q4 2022
Fed BoC BoE ECB
Source - RBC Wealth Management, Bloomberg, RBC Capital Markets forecasts; data as of 1/27/22
Fixed income views
Region
Gov’t bonds
Corp. credit
Duration
Global = = 5–7 yr
United States
– = 5–7 yr
Canada = = 5–7 yr
Continental Europe
= = 5–7 yr
United Kingdom
= = 5–7 yr
+ Overweight; = Market Weight; – Underweight Source - RBC Wealth Management
Page 11 of 17 Global Insight, February 2022
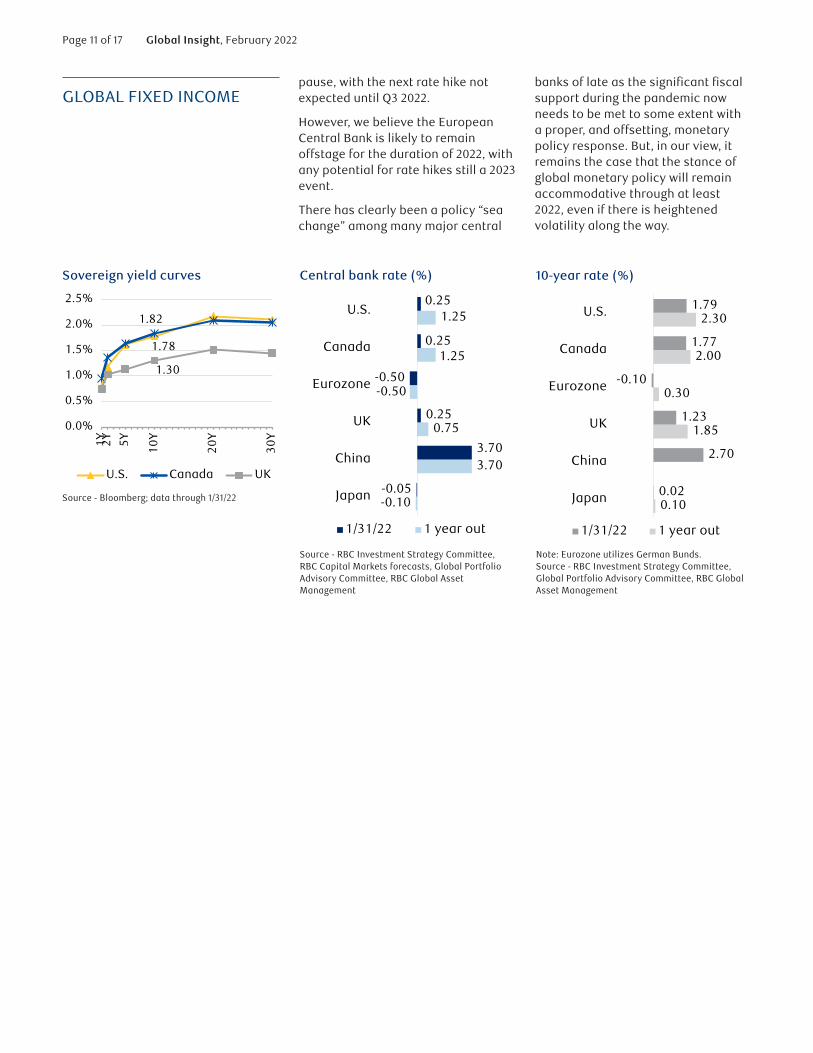
GLOBAL FIXED INCOMEpause, with the next rate hike not expected until Q3 2022.
However, we believe the European Central Bank is likely to remain offstage for the duration of 2022, with any potential for rate hikes still a 2023 event.
There has clearly been a policy “sea change” among many major central
banks of late as the significant fiscal support during the pandemic now needs to be met to some extent with a proper, and offsetting, monetary policy response. But, in our view, it remains the case that the stance of global monetary policy will remain accommodative through at least 2022, even if there is heightened volatility along the way.
Sovereign yield curves
1.78
1.82
1.30
0.0%
0.5%
1.0%
1.5%
2.0%
2.5%
1Y 2Y 5Y 10Y
20Y
30Y
U.S. Canada UK
Source - Bloomberg; data through 1/31/22
Central bank rate (%)
-0.10
3.70
0.75
-0.50
1.25
1.25
-0.05
3.70
0.25
-0.50
0.25
0.25
Japan
China
UK
Eurozone
Canada
U.S.
1/31/22 1 year out
Source - RBC Investment Strategy Committee, RBC Capital Markets forecasts, Global Portfolio Advisory Committee, RBC Global Asset Management
10-year rate (%)
0.10
1.85
0.30
2.00
2.30
0.02
2.70
1.23
-0.10
1.77
1.79
Japan
China
UK
Eurozone
Canada
U.S.
1/31/22 1 year out
Note: Eurozone utilizes German Bunds. Source - RBC Investment Strategy Committee, Global Portfolio Advisory Committee, RBC Global Asset Management
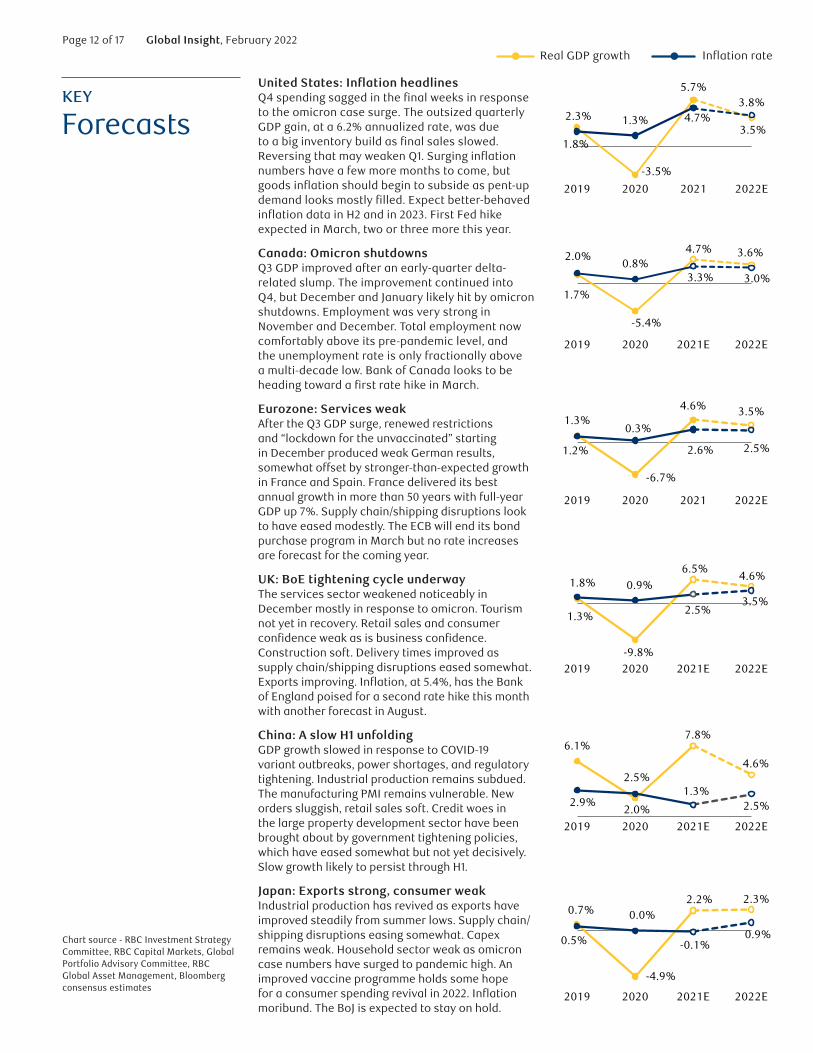
Page 12 of 17 Global Insight, February 2022Real GDP growth Inflation rate
KEY
Forecasts
United States: Inflation headlinesQ4 spending sagged in the final weeks in response to the omicron case surge. The outsized quarterly GDP gain, at a 6.2% annualized rate, was due to a big inventory build as final sales slowed. Reversing that may weaken Q1. Surging inflation numbers have a few more months to come, but goods inflation should begin to subside as pent-up demand looks mostly filled. Expect better-behaved inflation data in H2 and in 2023. First Fed hike expected in March, two or three more this year.
2.3%
-3.5%
1.8%
1.3% 4.7%
5.7%
3.5%
3.8%
2019 2020 2021 2022E
Canada: Omicron shutdownsQ3 GDP improved after an early-quarter delta-related slump. The improvement continued into Q4, but December and January likely hit by omicron shutdowns. Employment was very strong in November and December. Total employment now comfortably above its pre-pandemic level, and the unemployment rate is only fractionally above a multi-decade low. Bank of Canada looks to be heading toward a first rate hike in March.
1.7%
-5.4%
2.0%0.8%
4.7% 3.6%
3.3% 3.0%
2019 2020 2021E 2022E
Eurozone: Services weakAfter the Q3 GDP surge, renewed restrictions and “lockdown for the unvaccinated” starting in December produced weak German results, somewhat offset by stronger-than-expected growth in France and Spain. France delivered its best annual growth in more than 50 years with full-year GDP up 7%. Supply chain/shipping disruptions look to have eased modestly. The ECB will end its bond purchase program in March but no rate increases are forecast for the coming year.
1.3%
-6.7%
1.2%
0.3%
4.6% 3.5%
2.6% 2.5%
2019 2020 2021 2022E
UK: BoE tightening cycle underwayThe services sector weakened noticeably in December mostly in response to omicron. Tourism not yet in recovery. Retail sales and consumer confidence weak as is business confidence. Construction soft. Delivery times improved as supply chain/shipping disruptions eased somewhat. Exports improving. Inflation, at 5.4%, has the Bank of England poised for a second rate hike this month with another forecast in August.
1.3%
-9.8%
1.8% 0.9%6.5%
4.6%
2.5%3.5%
2019 2020 2021E 2022E
China: A slow H1 unfolding GDP growth slowed in response to COVID-19 variant outbreaks, power shortages, and regulatory tightening. Industrial production remains subdued. The manufacturing PMI remains vulnerable. New orders sluggish, retail sales soft. Credit woes in the large property development sector have been brought about by government tightening policies, which have eased somewhat but not yet decisively. Slow growth likely to persist through H1.
6.1%
2.0%2.9%
2.5%
7.8%
4.6%
1.3%2.5%
2019 2020 2021E 2022E
Japan: Exports strong, consumer weakIndustrial production has revived as exports have improved steadily from summer lows. Supply chain/ shipping disruptions easing somewhat. Capex remains weak. Household sector weak as omicron case numbers have surged to pandemic high. An improved vaccine programme holds some hope for a consumer spending revival in 2022. Inflation moribund. The BoJ is expected to stay on hold.
0.7%
-4.9%
0.5%
0.0%2.2% 2.3%
-0.1%0.9%
2019 2020 2021E 2022E
Chart source - RBC Investment Strategy Committee, RBC Capital Markets, Global Portfolio Advisory Committee, RBC Global Asset Management, Bloomberg consensus estimates
Page 13 of 17 Global Insight, February 2022
MARKET
Scorecard
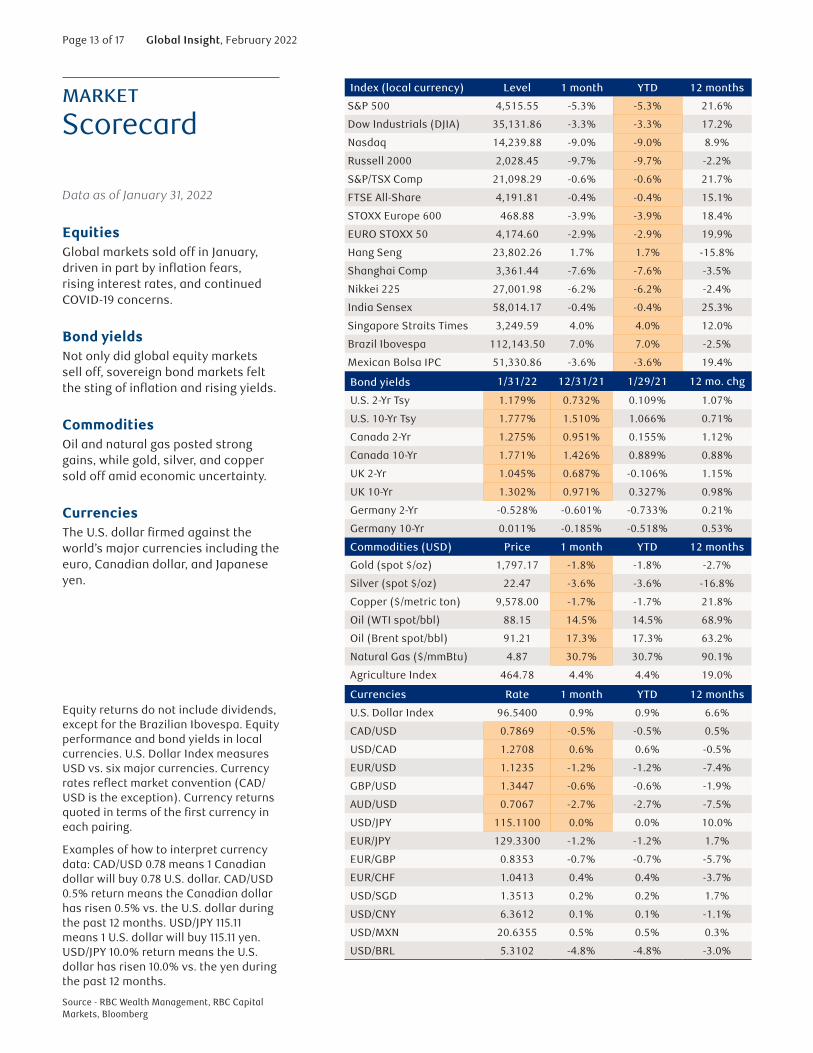
Data as of January 31, 2022
EquitiesGlobal markets sold off in January, driven in part by inflation fears, rising interest rates, and continued COVID-19 concerns.
Bond yieldsNot only did global equity markets sell off, sovereign bond markets felt the sting of inflation and rising yields.
CommoditiesOil and natural gas posted strong gains, while gold, silver, and copper sold off amid economic uncertainty.
CurrenciesThe U.S. dollar firmed against the world’s major currencies including the euro, Canadian dollar, and Japanese yen.
Index (local currency) Level 1 month YTD 12 months
S&P 500 4,515.55 -5.3% -5.3% 21.6%
Dow Industrials (DJIA) 35,131.86 -3.3% -3.3% 17.2%
Nasdaq 14,239.88 -9.0% -9.0% 8.9%
Russell 2000 2,028.45 -9.7% -9.7% -2.2%
S&P/TSX Comp 21,098.29 -0.6% -0.6% 21.7%
FTSE All-Share 4,191.81 -0.4% -0.4% 15.1%
STOXX Europe 600 468.88 -3.9% -3.9% 18.4%
EURO STOXX 50 4,174.60 -2.9% -2.9% 19.9%
Hang Seng 23,802.26 1.7% 1.7% -15.8%
Shanghai Comp 3,361.44 -7.6% -7.6% -3.5%
Nikkei 225 27,001.98 -6.2% -6.2% -2.4%
India Sensex 58,014.17 -0.4% -0.4% 25.3%
Singapore Straits Times 3,249.59 4.0% 4.0% 12.0%
Brazil Ibovespa 112,143.50 7.0% 7.0% -2.5%
Mexican Bolsa IPC 51,330.86 -3.6% -3.6% 19.4%
Bond yields 1/31/22 12/31/21 1/29/21 12 mo. chg
U.S. 2-Yr Tsy 1.179% 0.732% 0.109% 1.07%
U.S. 10-Yr Tsy 1.777% 1.510% 1.066% 0.71%
Canada 2-Yr 1.275% 0.951% 0.155% 1.12%
Canada 10-Yr 1.771% 1.426% 0.889% 0.88%
UK 2-Yr 1.045% 0.687% -0.106% 1.15%
UK 10-Yr 1.302% 0.971% 0.327% 0.98%
Germany 2-Yr -0.528% -0.601% -0.733% 0.21%
Germany 10-Yr 0.011% -0.185% -0.518% 0.53%
Commodities (USD) Price 1 month YTD 12 months
Gold (spot $/oz) 1,797.17 -1.8% -1.8% -2.7%
Silver (spot $/oz) 22.47 -3.6% -3.6% -16.8%
Copper ($/metric ton) 9,578.00 -1.7% -1.7% 21.8%
Oil (WTI spot/bbl) 88.15 14.5% 14.5% 68.9%
Oil (Brent spot/bbl) 91.21 17.3% 17.3% 63.2%
Natural Gas ($/mmBtu) 4.87 30.7% 30.7% 90.1%
Agriculture Index 464.78 4.4% 4.4% 19.0%
Currencies Rate 1 month YTD 12 months
U.S. Dollar Index 96.5400 0.9% 0.9% 6.6%
CAD/USD 0.7869 -0.5% -0.5% 0.5%
USD/CAD 1.2708 0.6% 0.6% -0.5%
EUR/USD 1.1235 -1.2% -1.2% -7.4%
GBP/USD 1.3447 -0.6% -0.6% -1.9%
AUD/USD 0.7067 -2.7% -2.7% -7.5%
USD/JPY 115.1100 0.0% 0.0% 10.0%
EUR/JPY 129.3300 -1.2% -1.2% 1.7%
EUR/GBP 0.8353 -0.7% -0.7% -5.7%
EUR/CHF 1.0413 0.4% 0.4% -3.7%
USD/SGD 1.3513 0.2% 0.2% 1.7%
USD/CNY 6.3612 0.1% 0.1% -1.1%
USD/MXN 20.6355 0.5% 0.5% 0.3%
USD/BRL 5.3102 -4.8% -4.8% -3.0%
Equity returns do not include dividends, except for the Brazilian Ibovespa. Equity performance and bond yields in local currencies. U.S. Dollar Index measures USD vs. six major currencies. Currency rates reflect market convention (CAD/USD is the exception). Currency returns quoted in terms of the first currency in each pairing.
Examples of how to interpret currency data: CAD/USD 0.78 means 1 Canadian dollar will buy 0.78 U.S. dollar. CAD/USD 0.5% return means the Canadian dollar has risen 0.5% vs. the U.S. dollar during the past 12 months. USD/JPY 115.11 means 1 U.S. dollar will buy 115.11 yen. USD/JPY 10.0% return means the U.S. dollar has risen 10.0% vs. the yen during the past 12 months.
Source - RBC Wealth Management, RBC Capital Markets, Bloomberg
Page 14 of 17 Global Insight, February 2022
Research resourcesThis document is produced by the Global Portfolio Advisory Committee within RBC Wealth Management’s Portfolio Advisory Group. The RBC Wealth Management Portfolio Advisory Group provides support related to asset allocation and portfolio construction for the firm’s investment advisors / financial advisors who are engaged in assembling portfolios incorporating individual marketable securities.
The Global Portfolio Advisory Committee leverages the broad market outlook as developed by the RBC Investment
Strategy Committee (RISC), providing additional tactical and thematic support utilizing research from the RISC, RBC Capital Markets, and third-party resources.
The RISC consists of senior investment professionals drawn from individual, client-focused business units within RBC, including the Portfolio Advisory Group. The RISC builds a broad global investment outlook and develops specific guidelines that can be used to manage portfolios. The RISC is chaired by Daniel Chornous, CFA, Chief Investment Officer of RBC Global Asset Management Inc.
Global Portfolio Advisory Committee membersJim Allworth – Co-chair Investment Strategist, RBC Dominion Securities Inc.
Kelly Bogdanova – Co-chair Portfolio Analyst, RBC Wealth Management Portfolio Advisory Group U.S., RBC Capital Markets, LLC
Frédérique Carrier – Co-chair Managing Director & Head of Investment Strategies, RBC Europe Limited
Mark Bayko, CFA – Head, Portfolio Management, RBC Dominion Securities Inc.
Rufaro Chiriseri, CFA – Head of Fixed Income – British Isles, RBC Europe Limited
Janet Engels – Head, Portfolio Advisory Group U.S., RBC Wealth Management, RBC Capital Markets, LLC
Thomas Garretson, CFA – Fixed Income Senior Portfolio Strategist, RBC Wealth Management Portfolio Advisory Group, RBC Capital Markets, LLC
Ryan Harder, CFA – Fixed Income Portfolio Advisor, Portfolio Advisory Group, RBC Dominion Securities Inc.
Patrick McAllister, CFA – Manager, Equity Advisory & Portfolio Management, Portfolio Advisory Group, RBC Dominion Securities Inc.
Alan Robinson – Portfolio Analyst, RBC Wealth Management Portfolio Advisory Group – U.S. Equities, RBC Capital Markets, LLC
Michael Schuette, CFA – Multi-Asset Portfolio Strategist, RBC Wealth Management Portfolio Advisory Group – U.S., RBC Capital Markets, LLC
David Storm, CFA, CAIA – Chief Investment Officer, BI & Asia, RBC Europe Limited
Tat Wai Toh – Head of Portfolio Management, BI & Asia, Royal Bank of Canada, Singapore Branch
Joseph Wu, CFA – Portfolio Manager, Multi-Asset Strategy, RBC Dominion Securities Inc.
Page 15 of 17 Global Insight, February 2022
Required disclosures
Analyst Certification All of the views expressed in this report accurately reflect the personal views of the responsible analyst(s) about any and all of the subject securities or issuers. No part of the compensation of the responsible analyst(s) named herein is, or will be, directly or indirectly, related to the specific recommendations or views expressed by the responsible analyst(s) in this report.
Important DisclosuresIn the U.S., RBC Wealth Management operates as a division of RBC Capital Markets, LLC. In Canada, RBC Wealth Management includes, without limitation, RBC Dominion Securities Inc., which is a foreign affiliate of RBC Capital Markets, LLC. This report has been prepared by RBC Capital Markets, LLC which is an indirect wholly-owned subsidiary of the Royal Bank of Canada and, as such, is a related issuer of Royal Bank of Canada.
One or more research analysts involved in the preparation of this report (i) may not be registered/qualified as research analysts with the NYSE and/or FINRA and (ii) may not be associated persons of the RBC Wealth Management and therefore may not be subject to FINRA Rule 2241 restrictions on communications with a subject company, public appearances and trading securities held by a research analyst account.
In the event that this is a compendium report (covers six or more companies), RBC Wealth Management may choose to provide important disclosure information by reference. To access current disclosures, clients should refer to https://www.rbccm.com/GLDisclosure/PublicWeb/ DisclosureLookup.aspx?EntityID=2 to view disclosures regarding RBC Wealth Management and its affiliated firms. Such information is also available upon request to RBC Wealth Management Publishing, 60 South Sixth St, Minneapolis, MN 55402.
References to a Recommended List in the recommendation history chart may include one or more recommended lists or model portfolios maintained by RBC Wealth Management or one of its affiliates. RBC Wealth Management recommended lists include the Guided Portfolio: Prime Income (RL 6), the Guided Portfolio: Dividend Growth (RL 8), the Guided Portfolio: ADR (RL 10), and the Guided Portfolio: All Cap Growth (RL 12). RBC Capital Markets recommended lists include the Strategy Focus List and the Fundamental Equity Weightings (FEW) portfolios. The abbreviation ‘RL On’ means the date a security was placed on a Recommended List. The abbreviation ‘RL Off’ means the date a security was removed from a Recommended List.
Distribution of RatingsFor the purpose of ratings distributions, regulatory rules require member firms to assign ratings to one of three rating categories – Buy, Hold/Neutral, or Sell – regardless of a firm’s own rating categories. Although RBC Capital Markets’ ratings of Outperform (O), Sector Perform (SP), and Underperform (U) most closely correspond to Buy, Hold/Neutral and Sell, respectively, the meanings are not the same because our ratings are determined on a relative basis.
Explanation of RBC Capital Markets, LLC Equity Rating SystemAn analyst’s “sector” is the universe of companies for which the analyst provides research coverage. Accordingly, the rating assigned to a particular stock represents solely the analyst’s view of how that stock will perform over the next 12 months relative to the analyst’s sector average.
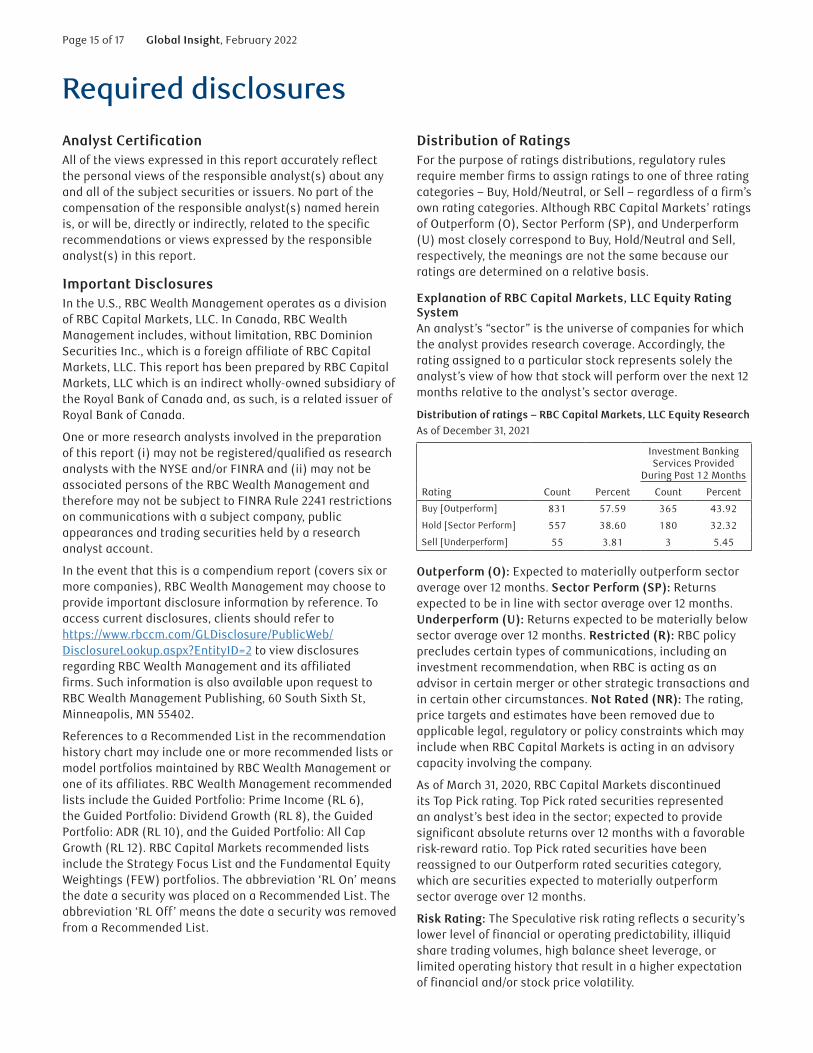
Distribution of ratings – RBC Capital Markets, LLC Equity ResearchAs of December 31, 2021
Rating Count Percent
Investment Banking Services Provided
During Past 12 Months
Count Percent
Buy [Outperform] 831 57.59 365 43.92
Hold [Sector Perform] 557 38.60 180 32.32
Sell [Underperform] 55 3.81 3 5.45
Outperform (O): Expected to materially outperform sector average over 12 months. Sector Perform (SP): Returns expected to be in line with sector average over 12 months. Underperform (U): Returns expected to be materially below sector average over 12 months. Restricted (R): RBC policy precludes certain types of communications, including an investment recommendation, when RBC is acting as an advisor in certain merger or other strategic transactions and in certain other circumstances. Not Rated (NR): The rating, price targets and estimates have been removed due to applicable legal, regulatory or policy constraints which may include when RBC Capital Markets is acting in an advisory capacity involving the company.
As of March 31, 2020, RBC Capital Markets discontinued its Top Pick rating. Top Pick rated securities represented an analyst’s best idea in the sector; expected to provide significant absolute returns over 12 months with a favorable risk-reward ratio. Top Pick rated securities have been reassigned to our Outperform rated securities category, which are securities expected to materially outperform sector average over 12 months.
Risk Rating: The Speculative risk rating reflects a security’s lower level of financial or operating predictability, illiquid share trading volumes, high balance sheet leverage, or limited operating history that result in a higher expectation of financial and/or stock price volatility.
Page 16 of 17 Global Insight, February 2022
Valuation and Risks to Rating and Price TargetWhen RBC Wealth Management assigns a value to a company in a research report, FINRA Rules and NYSE Rules (as incorporated into the FINRA Rulebook) require that the basis for the valuation and the impediments to obtaining that valuation be described. Where applicable, this information is included in the text of our research in the sections entitled “Valuation” and “Risks to Rating and Price Target”, respectively.
The analyst(s) responsible for preparing this research report have received (or will receive) compensation that is based upon various factors, including total revenues of RBC Capital Markets, LLC, and its affiliates, a portion of which are or have been generated by investment banking activities of RBC Capital Markets, LLC and its affiliates.
Other DisclosuresPrepared with the assistance of our national research sources. RBC Wealth Management prepared this report and takes sole responsibility for its content and distribution. The content may have been based, at least in part, on material provided by our third-party correspondent research services. Our third-party correspondent has given RBC Wealth Management general permission to use its research reports as source materials, but has not reviewed or approved this report, nor has it been informed of its publication. Our third-party correspondent may from time to time have long or short positions in, effect transactions in, and make markets in securities referred to herein. Our third-party correspondent may from time to time perform investment banking or other services for, or solicit investment banking or other business from, any company mentioned in this report.
RBC Wealth Management endeavors to make all reasonable efforts to provide research simultaneously to all eligible clients, having regard to local time zones in overseas jurisdictions. In certain investment advisory accounts, RBC Wealth Management or a designated third party will act as overlay manager for our clients and will initiate transactions in the securities referenced herein for those accounts upon receipt of this report. These transactions may occur before or after your receipt of this report and may have a short-term impact on the market price of the securities in which transactions occur. RBC Wealth Management research is posted to our proprietary Web sites to ensure eligible clients receive coverage initiations and changes in rating, targets, and opinions in a timely manner. Additional distribution may be done by sales personnel via e-mail, fax, or regular mail. Clients may also receive our research via third-party vendors. Please contact your RBC Wealth Management Financial Advisor for more information regarding RBC Wealth Management research.
Conflicts Disclosure: RBC Wealth Management is registered with the Securities and Exchange Commission as a broker/dealer and an investment adviser, offering both brokerage and investment advisory services. RBC Wealth
Management’s Policy for Managing Conflicts of Interest in Relation to Investment Research is available from us on our website at https://www.rbccm.com/GLDisclosure/PublicWeb/ DisclosureLookup.aspx?EntityID=2. Conflicts of interests related to our investment advisory business can be found in Part 2A Appendix 1 of the Firm’s Form ADV or the RBC Advisory Programs Disclosure Document. Copies of any of these documents are available upon request through your Financial Advisor. We reserve the right to amend or supplement this policy, Part 2A Appendix 1 of the Form ADV, or the RBC Advisory Programs Disclosure Document at any time.
The authors are employed by one of the following entities: RBC Wealth Management USA, a division of RBC Capital Markets, LLC, a securities broker-dealer with principal offices located in Minnesota and New York, USA; RBC Dominion Securities Inc., a securities broker-dealer with principal offices located in Toronto, Canada; RBC Investment Services (Asia) Limited, a subsidiary of RBC Dominion Securities Inc., a securities broker-dealer with principal offices located in Hong Kong, China; Royal Bank of Canada, Singapore Branch, a licensed wholesale bank with its principal office located in Singapore; and RBC Europe Limited, a licensed bank with principal offices located in London, United Kingdom.
Third-party DisclaimersThe Global Industry Classification Standard (“GICS”) was developed by and is the exclusive property and a service mark of MSCI Inc. (“MSCI”) and Standard & Poor’s Financial Services LLC (“S&P”) and is licensed for use by RBC. Neither MSCI, S&P, nor any other party involved in making or compiling the GICS or any GICS classifications makes any express or implied warranties or representations with respect to such standard or classification (or the results to be obtained by the use thereof), and all such parties hereby expressly disclaim all warranties of originality, accuracy, completeness, merchantability and fitness for a particular purpose with respect to any of such standard or classification. Without limiting any of the foregoing, in no event shall MSCI, S&P, any of their affiliates or any third party involved in making or compiling the GICS or any GICS classifications have any liability for any direct, indirect, special, punitive, consequential or any other damages (including lost profits) even if notified of the possibility of such damages.
DisclaimerThe information contained in this report has been compiled by RBC Wealth Management, a division of RBC Capital Markets, LLC, from sources believed to be reliable, but no representation or warranty, express or implied, is made by Royal Bank of Canada, RBC Wealth Management, its affiliates or any other person as to its accuracy, completeness or correctness. All opinions and estimates contained in this report constitute RBC Wealth Management’s judgment as of the date of this report, are subject to change without notice and are provided in good faith but without legal responsibility. Past performance is not a guide to future performance, future returns are not guaranteed, and a loss of original capital may occur. Every province in Canada, state in the U.S., and most countries throughout the world have their own laws regulating the types of securities and other investment products which may be offered to their residents, as well as the process for doing so. As a result, the securities discussed in this report may not be eligible for sale in some jurisdictions. This report is not, and under no circumstances should be construed as, a solicitation to act as securities broker or dealer in any jurisdiction by any person or company that is not
Page 17 of 17 Global Insight, February 2022
legally permitted to carry on the business of a securities broker or dealer in that jurisdiction. Nothing in this report constitutes legal, accounting or tax advice or individually tailored investment advice. This material is prepared for general circulation to clients, including clients who are affiliates of Royal Bank of Canada, and does not have regard to the particular circumstances or needs of any specific person who may read it. The investments or services contained in this report may not be suitable for you and it is recommended that you consult an independent investment advisor if you are in doubt about the suitability of such investments or services. To the full extent permitted by law neither Royal Bank of Canada nor any of its affiliates, nor any other person, accepts any liability whatsoever for any direct, indirect or consequential loss arising from, or in connection with, any use of this report or the information contained herein. No matter contained in this document may be reproduced or copied by any means without the prior written consent of Royal Bank of Canada in each instance. In the U.S., RBC Wealth Management operates as a division of RBC Capital Markets, LLC. In Canada, RBC Wealth Management includes, without limitation, RBC Dominion Securities Inc., which is a foreign affiliate of RBC Capital Markets, LLC. This report has been prepared by RBC Capital Markets, LLC. Additional information is available upon request.
To U.S. Residents: This publication has been approved by RBC Capital Markets, LLC, Member NYSE/FINRA/SIPC, which is a U.S. registered broker-dealer and which accepts responsibility for this report and its dissemination in the United States. RBC Capital Markets, LLC, is an indirect wholly-owned subsidiary of the Royal Bank of Canada and, as such, is a related issuer of Royal Bank of Canada. Any U.S. recipient of this report that is not a registered broker-dealer or a bank acting in a broker or dealer capacity and that wishes further information regarding, or to effect any transaction in, any of the securities discussed in this report, should contact and place orders with RBC Capital Markets, LLC. International investing involves risks not typically associated with U.S. investing, including currency fluctuation, foreign taxation, political instability and different accounting standards.
To Canadian Residents: This publication has been approved by RBC Dominion Securities Inc. RBC Dominion Securities Inc.* and Royal Bank of Canada are separate corporate entities which are affiliated. * Member Canadian Investor Protection Fund. ® Registered
trademark of Royal Bank of Canada. Used under license. RBC Wealth Management is a registered trademark of Royal Bank of Canada. Used under license.
RBC Wealth Management (British Isles): This publication is distributed by RBC Europe Limited and RBC Investment Solutions (CI) Limited. RBC Europe Limited is authorised by the Prudential Regulation Authority and regulated by the Financial Conduct Authority and the Prudential Regulation Authority (FCA registration number: 124543). Registered office: 100 Bishopsgate, London, EC2N 4AA, UK. RBC Investment Solutions (CI) Limited is regulated by the Jersey Financial Services Commission in the conduct of investment business in Jersey. Registered office: Gaspé House, 66-72 Esplanade, St Helier, Jersey JE2 3QT, Channel Islands, registered company number 119162.
To Hong Kong Residents: This publication is distributed in Hong Kong by Royal Bank of Canada, Hong Kong Branch which is regulated by the Hong Kong Monetary Authority and the Securities and Futures Commission (‘SFC’), and RBC Investment Services (Asia) Limited, which is regulated by the SFC.
To Singapore Residents: This publication is distributed in Singapore by the Royal Bank of Canada, Singapore Branch, a registered entity licensed by the Monetary Authority of Singapore. This material has been prepared for general circulation and does not take into account the objectives, financial situation, or needs of any recipient. You are advised to seek independent advice from a financial adviser before purchasing any product. If you do not obtain independent advice, you should consider whether the product is suitable for you. Past performance is not indicative of future performance. If you have any questions related to this publication, please contact the Royal Bank of Canada, Singapore Branch. Royal Bank of Canada, Singapore Branch accepts responsibility for this report and its dissemination in Singapore.
© 2022 RBC Capital Markets, LLC – Member NYSE/FINRA/SIPC © 2022 RBC Dominion Securities Inc. – Member Canadian Investor Protection Fund © 2022 RBC Europe Limited © 2022 Royal Bank of Canada All rights reserved RBC1524

Checkpoint Passed Warned Failed
Basic Requirements
PDF Syntax 1 141 0 0
Fonts 62 0 0
Content 31 166 0 0
Embedded Files 0 0 0
Natural Language 13 568 0 0
Logical Structure
Structure Elements 508 0 0
Structure Tree 2 082 0 0
Role Mapping 2 430 0 0
Alternative Descriptions 4 332 0 0
Metadata and Settings
Metadata 6 0 0
Document settings 20 0 0
PAC Test Report
2 MB171083en-US
SizePagesTagsLanguage
Global_Insight_Feb_2022.pdf
Filename
Global Insight - February 2022
Title
PAC Version StandardDate/Time
2022-02-02 11:59 3.0.7.0 PDF/UA
The PDF/UA requirements checked by PAC are fulfilled.
Check
PDF Document
Result
PAC is a free checking tool of the foundation «Access for all»: www.access-for-all.ch
PDF Accessibility Checker (PAC) evaluates the accessibility of PDF files according to ISO-/DIN-Standard 14289-1 (PDF/UA) by using the Matterhorn Protocol. It checks 107 criteria that can be checked automatically.
Copyright © 2017 Foundation «Access for all»
Related Documents