Purification by Foam Fractionation Kayode Oyinloye Wadham College University of Oxford Engineering Science, Part III Finals, 2006 4 th Year Project Supervisors: Dr. Peter Martin Prof. Richard Darton

Welcome message from author
This document is posted to help you gain knowledge. Please leave a comment to let me know what you think about it! Share it to your friends and learn new things together.
Transcript

Purification by Foam Fractionation
Kayode Oyinloye
Wadham College
University of Oxford
Engineering Science, Part III Finals, 2006
4th Year Project
Supervisors: Dr. Peter Martin
Prof. Richard Darton

2
Abstract
Foam fractionation is a separation technique that can be used to separate surface active
components from solution. Previous years’ work has shown that an important part of a foam
fractionation column is the riser, where the material transfer takes place. This process has not
been researched extensively. The objective of this project was to develop experiments to
investigate the process, and assess column performance under different conditions.
A single stage column with sampling points to test the foam inside the riser was available from
the previous year’s fourth year project, but was not functioning properly. This report details the
development and modification of the equipment and the experimental method. Preliminary tests
were carried out to determine the time taken for the column to reach steady state.
The column is operated under continuous conditions with a surfactant solution of cetylpyridinium
chloride (CPC). The properties of the foam at different heights in the riser were measured, and by
applying foam fractionation theory to the results, estimates for the number of theoretical mixing
stages in the column were made. Analysis was also performed to try to characterise the
performance of the column independent of the column running conditions.

3
Contents
Abstract 2
Contents 3
1 Introduction 4
2 Literature Review 7
3 Development of Experimental Apparatus and Equipment 13
4 Experimental Measurement 28
4 Results and Analysis 31
6 Further Work 39
7 Conclusions 40
8 Acknowledgements 41
9 References 42
10 Appendices 43

4
1 Introduction
1.1 Background
Foam can be seen as a two-phase system in which gas cells are enclosed by liquid. The
continuous networks of liquid channels surrounding the individual bubbles are known as Plateau
borders. A network of Plateau borders is illustrated in Figure 1.1, showing quite a wet foam.
Typically, as a foam becomes drier its Plateau borders become thinner and its bubbles more
polyhedral and less spherical in shape.
Figure 1.1: Plateau Boarders in a foam. (Weaire and Hutzler, 1999)
Most foams are caused by the presence of surface active molecules, or surfactants, which
concentrate themselves at an air-water surface and stabilise the thin bubble films against rupture.
This surface-active tendency of some chemicals is what the technique of foam fractionation
makes use of, to extract them from solution. A foam is created which, with its large area of air-
water surfaces will adsorb surfactant from solution, and carry it up a foam riser. At the top of the
riser the surfactant enriched foam is broken, and an enriched solution collected. Consequently the

5
surfactant concentration in the liquid bulk stage at the bottom of the column will gradually
reduce.
Foam fractionation has been used industrially since the 1960s (although not extensively), to
remove nutrients from waste streams in treatment plants. A current, very widespread application
of the technology can be seen in the commercial availability of pond management systems, which
use foam fractionation to remove proteins from the water before they decompose
(http://www.koicarp.org.uk/fraction.htm).
Figure 1.2 shows a typical arrangement for a single stage foam fractionating column operating in
batch mode. Foam is created in the bulk solution at the bottom of the column by sparging air into
it, and surfactant is taken up the riser on the bubble surfaces. The foam flows upwards with
surfactant adsorbed to its surfaces, and at the same time liquid drainage occurs in the Plateau
borders due to gravity. The material transfer between these two streams in opposite directions
serves to enrich the top product. Two ways of further enriching the top product are through
reflux, or by using the liquid in the overflow pool as the bulk solution in a further foam
fractionation stage.
Figure 1.2: A typical arrangement for a foam fractionation column operating in batch mode. (Swain, 2005)
Riser
Overflow pool
Bulk solution
Bubble flow
Liquid drainage

6
1.2 Project History
A lot of work on this subject has been done by fourth year project students over recent years.
Foam fractionation columns with multiple stages have been constructed, and experiments
performed yielding data that give a good fit to the theoretical models for separation (Supino
(2001), Pearson (2004)). Particular attention has been given to exploring the idea of using foam
to extract a contaminant from a solution, based on the theory that the contaminant, having an
affinity for the surfactant, would be separated from the bulk solution. The aim of the projects of
Sweeting (2002), and Pearson (2004) were to select a suitable surfactant and contaminant pairing
and test the performance of their columns under various operating conditions.
Last year Swain (2005) took the project in a new direction, giving special focus to the riser part
of the foam fractionation column. A single stage column was constructed with numerous
sampling points where foam could be extracted and thus the performance of the riser studied in
detail. The column had a base that could slide up and down the column, so that the riser geometry
could be varied and the effect on column performance investigated.
The bulk solution was a fixed concentration of aqueous cetylpyridinium chloride, although there
were experiments for different air flow rates to be sparged in. The column was designed to
operate under the condition of total reflux. Unfortunately the project encountered difficulties with
the operation of the column, mainly that of the foam breaker not being able to break the foam at
the top. Consequently steady state conditions were never achieved; mass balance analysis of an
overflowing system was impossible, and the results failed to show significant enrichment of
surfactant over the height of the riser.
1.3 Aims and Objectives
The objective of this project was to further the understanding of foam fractionation performance
that has been gained in previous fourth year projects on the subject. The riser has been identified
as a key part of the equipment, and a detailed study of the foam fractionation process with
regards to it has yet to be successfully carried out by the department, neither has it been
investigated extensively outside of this.

7
The aims and objectives of this project were to:
• Make design modifications to existing experimental equipment, so that column achieves
condition of steady-state.
• Develop theory to predict riser performance.
• Make concentration measurements to gain a concentration profile for the height of the riser.
• Validate theory with experiment.
• Improve riser design, and hence be able to design a better multistage device.
The approach to carrying out these objectives was to spend time observing the dysfunctional
foam breaking equipment at the top of the riser while the column was in operation, and studying
scientific literature on the subject of foam breakage. This was done to try and fully understand
the nature of the problem and see what possible solutions might be applicable to it. After the
successful completion of this first objective the project could proceed by simply repeating the
experiments that were attempted by Swain (2005), to gain a concentration profile for the riser.
Finally this leads to the possibility of improved riser design in terms of optimised foam
fractionation performance.

8
2 Literature Review
This section introduces the important terms and theory of foam fractionation.
2.1 Liquid Hold-up
The liquid hold-up of a foam, lε , is defined as the volume of liquid as a fraction of the total foam
volume. Essentially it is a measure of a foam’s ‘wetness’. Due to drainage through the foam
caused by gravity, the foam will generally get dryer as you move up the riser, and therefore liquid
hold-up will decrease.
2.2 Surface Excess
Surface excess,Γ , is a term to express the degree of absorption of surfactant at the air-water
surfaces in a foam. Adsorption to air-water surfaces is what causes the creation of foam and the separation of surfactant from solution and therefore the surface excess value of a surfactant is key
to how easily it can be enriched from solution. It has units of moles per area, and can therefore be considered as the concentration of the surfactant at the surface. The value of surface excess can
be calculated from equation 2.1, the Gibbs adsorption equation:
adnRTd lnΓ−=γ [2.1]
Where R is the gas constant, T is the absolute temperature, γ is the surface tension, n is the ionic
charge of the surfactant and a is the activity of the surfactant. At low enough concentrations it
can be assumed that a is equal to the concentration of the liquid solution, C. Equation 2.1 then
becomes:
Cd
d
nRT ln
1 γ−=Γ [2.2]
With this equation it is possible to calculate a value for the surface excess for any chemical,
provided that the relationship is known between the concentration of that chemical in a solution,
C, and the surface tension of the solution, γ. This relationship is determined experimentally, and
figure 2.1 shows such a graph of results for CPC:

9
Figure 2.1: The variation of surface tension of CPC with concentration. (Aubourg et al (2000)). The added line
represents the maximum change in surface tension.
The gradient of the line of maximum change in surface tension is:
33.1
1040
303.2
1
log10lnln
3
−==
−x
Cd
d
Cd
d γγ [2.3]
31006.13ln
−−= x
Cd
dγ [2.4]
This value can be substituted into equation 2.2, along with the other constants (the ionic charge,
n, of CPC is 2, and the temperature is assumed constant at 298K) to gain a value for the maximum surface excess:
298314.82
1006.13
ln
1 3
xx
x
Cd
d
nRT
−
∞
−==Γ
γ [2.5]
210 /1064.2 cmmolx−
∞ =Γ [2.6]
Thus the maximum value for the surface excess can be taken as 2.64x10⁻¹⁰ molcm-2.
Throughout this report this value will be used as the value of surface excess for CPC.
2.3 Foam Fractionation without Reflux
Most current applications of foam fractionation do not use reflux. The concentration profile in a foam fractionation column with no reflux is governed by a single equation, which shall be
derived here.

10
Air is sparged through the bulk solution, of surfactant concentration C0, and the foam is created.
The absence of reflux means that the liquid in the Plateau borders of the foam is the same concentration as the bulk solution. There is extra surfactant adsorbed to the air-liquid surfaces of
the bubbles, the amount of which is governed by the surface excess of the surfactant and the surface area of the bubbles per unit volume, S. A cross section of the foam is seen in figure 2.2.
Figure 2.2: Foam cross section.
When foam of liquid hold-uplε , is collapsed the surfactant on the bubble interfaces is released
into solution, and the concentration of the collapsed liquid is C1. The mass balance equation for
this is:
C1 lε = C0 lε + Γ S [2.7]
Which can be rearranged to give C1;
C1 = C0 + Γ S/lε [2.8]
This equation shows that the enrichment is strongly affected by the liquid hold-up, which will
decrease up a riser as liquid drains down due to gravity. Therefore it is seen that enrichment in
foam fractionation is effected by the drying of foam in a riser due to drainage as well as by surfactant adsorption to the bubble surfaces.
2.4 Foam Fractionation with Reflux
Lemlich (1972) makes the analogy between foam fractionation and distillation with entrainment.
The rising bubble surfaces correspond to the vapour, the interstitial liquid carried up corresponds to the entrainment, and the interstitial liquid flowing down through the foam corresponds to the
downflow. The term effective concentration,C , is used for the solute in the rising stream at any
height in the foam column. Its definition is:
1u
GSCC
Γ+= [2.9]
Air-liquid surface
Interstitial liquid, C0

11
With an approximation for liquid hold-up this becomes:
l
SCC
ε
Γ+= [2.10]
G is the volumetric gas flow rate (m3s
-1), u1 is the rate of interstitial liquid upflow (m
2s
-1), and S
is the ratio of bubble surface to bubble volume. The surface excess, Γ , is taken to be in
equilibrium with the concentration in the rising interstitial liquid, C. Equation 2.7 therefore constitutes an equilibrium curve.
Two material balances around a column and around the top section of a column yield the top
operating line. The flow streams are analogous to those of a continuous distillation column supplied with a feed flow rate f and concentration Cf. The bottoms product of concentration Cw exits at a flow rate w and the top product of concentration Cd, leaves at flow rate d. The column
and its flow streams are shown in figure 2.3.
Figure 2.3: The column operation and a material balance over the top section of the riser (Swain, 2005).
The top operating line equation obtained from this analysis will depend on the reflux ratio, R:
Dnn CR
CR
RC
1
1
11
++
+= +
[2.9]
And for a column operating at total reflux this simplifies to:
1+= nn CC [2.10]
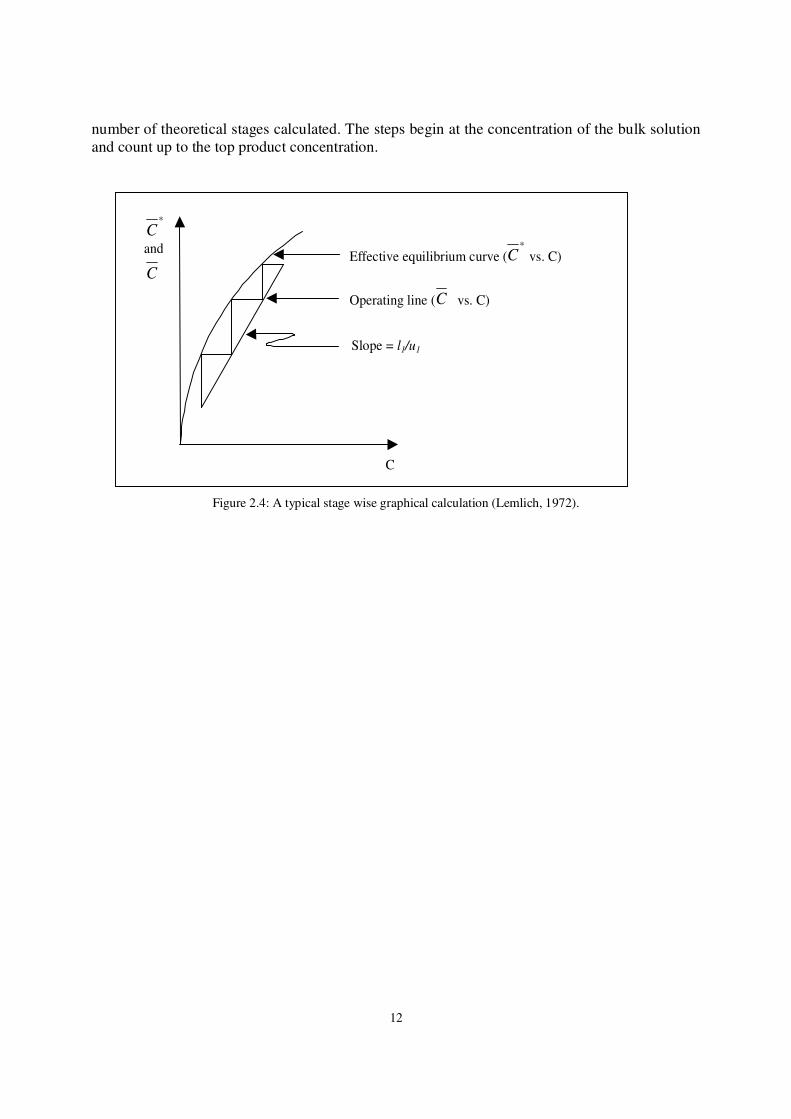
This is the basis for a graphical stagewise calculation to be performed to find the number of theoretical stages in a column. A typical example of this analysis is shown in figure 2.4. If
experiments were carried out to gain a relationship between the concentration of the rising liquid
in a column, C, and the liquid hold-up, lε , then an equilibrium line could be drawn and the
wCwfCf
u1 Cn+1l1
dCdRdCd
(R+1)d
Rd dCd
12
number of theoretical stages calculated. The steps begin at the concentration of the bulk solution
and count up to the top product concentration.
Figure 2.4: A typical stage wise graphical calculation (Lemlich, 1972).
C
*
Cand
CEffective equilibrium curve (
*
C vs. C)
Operating line (C vs. C)
Slope = l1/u1

13
3 Development of Experimental Apparatus and Procedure
The project sought to make use of the experimental apparatus that remained from an earlier
fourth year project carried out by Swain (2005). The first objective was to get this equipment
running properly so that experiments could be run and more meaningful data taken. This section
describes the development and modification of the inherited equipment as well as the
experimental procedure for using it.
3.1 Existing Apparatus
Swain (2005) designed a single stage foam fractionation column to these stated criteria:
1) The riser geometry should be variable.
2) The foam at the top of the riser is to be broken, and the liquid collected in an overflow
pool, so that the liquid can drain back down the column.
3) It should be possible to take measurements of the concentration of the foam in the riser,
and the liquid in the bulk stage and the overflow pool.
4) It should be possible to measure the dispersion in the riser.
The final design is shown in figure 3.1. The column was manufactured from glass, was 8cm in
diameter and 45cm in height. There are eight equally spaced sampling points along its height so
that the foam can be accessed. The two lowest sampling points are generally used as inlet and
outlet points so that the column can be continuously supplied with bulk solution. The base was
not built in to the rest of the column but fits inside, and is designed to move up or down the riser
so that experiments on columns with different riser heights is possible. This feature was to satisfy
the first design criteria of having variable riser geometry. The base was made sintered, and was
connected by hollow glass tube to an air supply so that air could be sparged right through it into
the bulk solution. At the top of the column the foam was collapsed using a mechanical foam
breaker – a rotating steel impeller. The liquid from the collapsed foam would accumulate in an
overflow pool, where it could flow over a weir and drain back down the column. A glass cap with
holes on it was made to cover the riser, allowing foam to come up through the holes but
preventing the liquid from the collapsed foam falling straight back down the column. By ensuring
that the liquid collected in the overflow pool it was possible to take a small sample with a syringe
to measure the top product concentration, yet still run the column at total reflux.

14
Figure 3.1: Swain’s final foam fractionation column design, with dimensions in mm.
Sampling points
Air flow
Foam Breaker
Overflow pool
Cap
Foam column
Bulk liquid
Sintered glass
Riser
Weir
50
50
50
50
50
50
50
50
60
120
100
40
80
460
40

15
3.2 Modifications made to the Equipment
The problems encountered by Swain were observed immediately during test runs on the column. It was the first objective of this project to identify and remedy these dysfunctional aspects, and
the process is described in this section.
3.2.1 Foam Breakage
The most challenging part of this project was achieving complete foam breakage at the top of the riser. It transpired that the foam produced from sparging air through the sintered base into the
bulk solution was of a very wet quality – with a rough measurement technique Swain had calculated the liquid hold up in the middle of the column to be about 0.1. Wet foams tend to be
more stable, and it was found that the rotating impeller could not completely collapse the foam, instead only managing to break it down into a smaller, creamy foamate, which then overflowed
over the sides of the column. Even when the air flow-rate sparged into the column was reduced, and the concentration in the bulk solution lowered to just above the CMC in an attempt to make
the foam less stable, the steel foam breaker still could not adequately collapse the foam. The
result was that material left the system in an unquantifiable fashion so that no mass balance could
be performed to analyse the process. Also, the column was unable to achieve a high degree of
enrichment, since total reflux was not occurring according to design.
Alternative methods for breaking the foam were considered, such as the use of mechanical or
ultrasonic vibrations to destabilise the foam. In the end the problem was solved by the use of a
sparger with larger holes to create larger bubbles and hence a drier and less stable foam. The
sintered base was taken out of the column and replaced with a solid glass base, and the air was
now supplied to the column through a metal sparger inserted through one of the sampling points
in the side of the column. It was then found that the steel foam breaker at the top of the column
was adequate in collapsing the foam.
3.2.2 Overflow Pool
While performing test runs on the column the overflow pool at the top of the riser was filled with liquid beforehand, so that as soon as the foam breaker began to collapse foam the liquid would
overflow down the column – thus demonstrating the total reflux operation condition.
But it was observed that the liquid in the overflow pool did not flow over the weir back down the riser, instead the level slowly dropped over time until the pool was completely dry. It was
deduced that this occurrence was caused by the dry foam at the top of the column that was in contact with the liquid in the overflow pool and so could draw liquid up through its Plateau
borders.
This showed that the column was not operating at total reflux but in fact exceeding it, and again, although no material was escaping the system the mass transfer of this ‘siphoning effect’ was
unquantifiable.
The design of the overflow pool at the top of the column was such that contact between the foam
and the liquid was unavoidable, and this turned out to be a basic design oversight that couldn’t be

16
fixed by modification. The only way to effect total reflux and a steady state concentration profile
in the column was to remove this stage from the column completely. Thus a new equipment set-up was devised; a slightly narrower steel foam breaker was designed and made to fit inside the
riser so that the liquid from the collapsed foam would fall straight back into the foam. This satisfied the total reflux condition in the simplest way possible, although it now meant that it
wouldn’t be possible to extract and measure a top product concentration. The rotating foam breaker was placed 3cm down into the riser – deep enough that the liquid from the smashed foam
did not spray outside the riser, but not too close to the level of the highest sampling point that the foam at that height would be disturbed by the foam breaking process.
The modified column set up is shown schematically in figure 3.2a, and photograph of its
operation is seen in figure 3.2b.
Figure 3.2a: Modified column set up

17
Figure 3.2b: Photograph of modified column set-up.
Rotating foam breaker
Sample point
Air flow in
through sparger
Foam column
Overflow pool
(not used)

18
3.2.3 Foam Sampling Tool
In order to measure the concentration of surfactant at different heights in the column it was first
necessary to extract a small sample of the foam. A foam sampling tool designed by Swain was available for use with the column at each of its sampling points. It consisted of a tightly sealed
test tube with two tubes leading into it – one to be inserted into the foam through one of the column ports, the other tube connected to an air suction pump. By turning on the pump air was
sucked out of the sealed test tube, which caused foam to be drawn in from the other tube. The design of the tool was such that it could reach into the centre of the column and extract foam free
from edge effects one might expect at the sides of the column – this technique is shown in figure 3.3.
Figure 3.3: Foam sampling technique (Swain, 2005).
It was found however, that the foam collecting tool used by Swain did not work adequately with
the new, drier foam in the column. The bubbles were bigger than the diameter of the glass tube
that was inserted into the column, which meant that the foam could not be extracted intact. Also,
with a drier foam in the riser it was now necessary to extract a much larger volume to get the
same mass of sample, therefore the test tube collecting the foam needed to be much bigger. A new, larger foam sampling tool was made, and is shown in figure 3.4. The diameter of the test
tube diameter is 3.5cm compared to 1.1cm for that of the previous foam sampling tool, making the volume of the new tool approximately 10 times larger. Other modifications to the original
design include the addition of PFTE tape around the neck of the L shaped glass tube to thicken it, so that an airtight seal was created at the sampling point when the tube was inserted through it
into the column. It was also decided to have the glass tubes going into the test tube of different lengths to avoid the transfer of foam from one to the other. And finally by testing the strength of
suction of the foam sampling tool it was found that a simple rubber bung with holes drilled
Suction to
pump
Test tube
Sample point
Sample
Bubble
column
Riser
Foam sucked
in

19
through it for the tubes was more effective at sealing the test tube than an elastic membrane (as
was used on the older model).
Figure 3.4: A photograph of the foam sampling tool.
3.3 Development of Experimental Method
Once proper operation of the column had been achieved the next objective of this project was to
conduct experiments on it. It was decided to perform tests with different flow rates of air being
sparged into the column, and obtain concentration and liquid hold up profiles for the column in each case. The base of the column and hence the geometry of the riser would stay fixed, but by
having the glass base at the very bottom of the column the riser was made as large as possible.
With reference to a series of preliminary tests, this section presents an in-depth breakdown of every aspect of the experiment, detailing procedure and showing how and why it was developed.
3.3.1 Solution Supply to the Riser

20
The foam fractionation theory detailed in section 2.3 applied to a column operating with a
continuous input, so that the concentrations of the feed and waste streams were constant. However, since the column would be experimented upon under the condition of total reflux,
continuous supply could be simulated by circulating a bulk solution of large volume into the column. No enriched product was being taken from the system, only small samples of foam and
therefore at steady state all the concentrations would be constant, as with a continuously supplied column.
Measurements of the bulk solution before, during and after experiments confirmed that
concentration did not change. A preliminary test had explored the possibility of running the column with a small bulk solution enclosed at the bottom of the column, but the concentration
levels dropped significantly with each foam sample, and eventually the concentration in the bulk solution was so weak that the foam did not make it to the top of the riser. Therefore a bulk
solution of volume 10 litres was made up in a large glass container, and supplied to the bulk stage of the column through one of the sampling points, via a peristaltic pump. The output stream is
effected by placing a tube through another of the sampling points and allowing the solution to drain back to the container. This tube is elevated so as to control the height of the bulk stage. It is
wrapped around the back of the column and during experiments was taped down to keep it steady
as liquid flowed through it. Since this is an enrichment process high concentration gradients were
to be anticipated, and therefore it was essential that the height of the liquid level of the bulk stage
should stay constant, so that the height of foam at each sampling point was always the same. It
was necessary to have the liquid level of the bulk solution above the inlet to the column, so that
the solution did not splash and create foam just by entering the column. For all experiments it
was kept steady 2.5cm above this column port. This can be seen in Figure 3.5, a photograph of
this section of the column in operation, with input and output streams indicated.
Figure 3.5: Photograph of the bulk stage of the column
Air flow in
through sparger
Inlet tube
Outlet tube
Foam

21
It was required that the bulk solution concentration be above the Critical Micelle Concentration
(CMC), so that the surface excess, Г, can be taken as constant. The CMC of CPC in pure water was shown in Section 2.2 to be approximately 1mM, so the bulk solution concentration was made
to be much higher than this, at 1.46mM.
3.3.2 Gas Flow Rate
The existing rig for use in this project had a pressurised air supply and three gas flow meters, two ranging from 0-2 L/min, and the other ranging from 0-10 L/min. Previous projects had performed
foam fractionation experiments using air flow rates as low as 0.4L/min, but in this project, using a less stable foam, it was found that this wasn’t enough to make the foam reach the top of the
riser. In order for the foam to get to the top of the column and stay there for the several hour
duration of an experiment it was found necessary to have a gas flow rate of at least 0.8L/min
sparged into the bulk solution. Conversely, it was found that if the gas flow rate were too high
then the foam would be too stable, and the foam breaker rotating at maximum speed would be
unable to collapse the foam adequately for the full duration of the experiment. 1.4L/min was
found to be the highest flow rate that the foam breaker could manage. It was desired that data for
as wide a range of flow rates as possible be obtained, so the column was tested at 0.8L/min,
1.1L/min and 1.4L/min.
3.3.3 Foam Sampling
It was decided to measure the performance of the riser over its maximum height, by having the
slidable glass base at the bottom of the column. This column set up was the same for each experiment. With the three lowest sampling points taken up by the inlet and outlet streams for the
bulk solution and the inlet for air through the sparger, there were five sampling points left where foam could be extracted. These sampling points were labelled 1), 2), 3) ,4) and 5), counting
upwards. They are labelled on the diagram of figure 3.6.
Figure 3.6: Column sampling point notation.

22
In carrying out the experiment the concentration profile was gained by sampling the foam at each
of these points, one at a time. It was also decided to sample the points at least ten minutes apart, as too frequent sampling might upset the equilibrium in the foam. This consideration also made it
impossible to do repeat samples in order to average the results. The overall procedure was to wait until the column was operating at steady state (see section 3.3.4) and then to sample the foam at
each of the sampling points every 10-15 minutes, starting from the bottom of the column and working up. Then after another 10-15 minute break the process was repeated, working down the
column from the top and getting a second set of results, which could be averaged with the first. This was considered to be the best way to measure the performance of the foam fractionation
process without disrupting it too much.
The first approach to sampling the foam was to follow the procedure of Swain – to extract a sizeable amount of foam using the foam sampling tool connected to a suction pump. The foam
could be weighed, and when collapsed to liquid could be analysed for its concentration. The drawback to this method was that it gave no value for the exact volume of foam extracted, and
therefore the liquid hold up of the foam was undeterminable. Swain therefore assumed a constant
liquid hold-up of foam over the height of the column, which was estimated by opening the
sampling point in the middle of the column to drain out enough foam to fill a container of known
volume. The foam, when weighed, gave the mass of liquid, and also, making the assumption that
the liquid had the same density of water, the volume of liquid. Hence a value for the liquid hold
up was obtained. It was decided that this method for calculating liquid hold up was too
inaccurate, mainly because it sampled foam and measured its volume, ignoring the fact that foam
starts to collapse as it is taken from the column. Also the foam extracted was not from the centre
of the column and therefore will have been subject to edge effects.
A modified method of foam sampling was devised, which sought to accurately measure the
volume of foam as it was extracted by the foam sampling tool, and therefore give enough data to
calculate the concentration and liquid hold-up of the foam at the same time. The foam sampling
tool was connected to the suction pump via an air flowmeter, which would measure the rate at
which air was being sucked out of the sealed test tube, and therefore the flow rate of foam entering it. If the foam sampling process was timed then the total volume of foam extracted
would be known, and hence liquid hold-up. The new set up is shown schematically in figure 3.7.

23
Figure 3.7: Modified set up for foam sampling.
Another advantage of the new foam sampling method was that the rate of extraction could be
controlled using the flow meter (the suction pump had only one strength setting). It was desired
that the foam in the column be disturbed as little as possible by the sampling process, and two
different approaches were considered to achieve this. First, was to take short sharp shots of foam
by drawing the foam at the highest rate possible for a few seconds. Second, was to slowly draw
out the foam over a period of minutes at a low enough rate that the foam level in the column did
not begin to noticeably drop. It was found that if the foam was extracted rapidly it was less
manageable inside the test tube - bubbles inflated and the foam managed to push up towards the
tube where the air was being sucked out. Also it would be difficult to accurately measure the total
volume of foam being drawn if sucking for such a short time. Therefore it was decided that for
each sample the foam would be drawn slowly.
By experimenting a flow rate of around 0.10-0.15L/min was found to be most practicable – at
this rate the foam level in the column did not go down, and it took about 2-3 minutes to extract
enough foam to fill the test tube of the foam sampling tool. However the flowmeter used was able
to supply 2L/min, and the smallest unit on its scale was 0.2L/min, and so it was found that the
correct flow could not be measured accurately. It also became apparent during experimentation
that there was a slight variation in the flow rate of the foam sampling tool depending on which of
the three test tubes was used, even when no adjustment was made to the flowmeter. This was thought to be because the test tubes were of slightly different size, and there was a difference in
effectiveness of the seal with the rubber bung. The flowmeter could only be used to make sure that the foam sampling tool was drawing foam at approximately 0.10-0.15L/min, but could not
measure the rate precisely.
In order to measure the flow rate of foam being extracted from the column, the internal volume of the L shaped glass tube along which the foam was drawn was calculated, and the time taken for it
to completely fill with foam during operation was measured with a stopwatch. The internal

24
volume of the tube was calculated by filling it completely with water and counting the number of
times it took to fill a 100ml measuring cylinder. Ten loads of water amounted to 95.5ml, thus the volume was calculated fairly accurately to be 9.55ml.
3.3.4 Steady State
Sampling and analysis of foam in the column would have been pointless if the system was not known to be at steady state. It was important to know how long the column needed to run in an
experiment before reaching steady state, because only then could accurate measurements be taken. Therefore preliminary tests were carried out on the column to measure the concentration of
foam at a particular point over time, hoping to be able to see it converge to its steady state value. The column was run with an air flow rate of 1.2L/min and foam samples taken from the middle
sampling point (column point 3) every 10-15 minutes. Time was started at the moment that the foam first reached the foam breaker, the point at which reflux into the foam could be said to first
occur. This experiment to determine the time for the column to reach steady state was carried out, and was repeated three times. The results are shown graphically in figure 3.8.

25
SS Experiment 1
0
5
10
15
20
25
30
0 20 40 60 80 100 120 140
Time/mins
Co
nc/m
M
SS Experiment 2
0
5
10
15
20
25
30
0 20 40 60 80 100 120 140
Time/min
Co
nc/m
M
SS Experiment 3
0
5
10
15
20
25
30
0 20 40 60 80 100 120 140
Time/mins
Co
nc/m
M
SS Experiment 4
0
5
10
15
20
25
30
0 20 40 60 80 100 120 140
Time/mins
Co
nc/m
M
All SS Experiments
0
5
10
15
20
25
30
0 20 40 60 80 100 120 140
Time/mins
Co
nc/m
M
Figure 3.8: Graphs showing concentration of the foam at column point 3 over time (gas flow rate of 1.2L/min).

26
The graphs for all the repeated experiments were of a similar shape, although it was not expected that for some of the tests concentration measurements would be consistently higher. Since the
same bulk solution and air flow rate were used, and the experimental method was the same, it can only be concluded that concentration profile in the column was dependent on other uncontrollable
factors such as temperature and other atmospheric conditions at the time and day of the experiment. Investigation into a way to incorporate these factors into a model for the performance
of the column was outside the scope of this project. It was decided instead that all experiments would be performed at similar times of the day, and on days close to each other.
These results showed that the concentration at one point in the column could never be measured
to be ‘steady’ although there did seem to be a mean value about which it would fluctuate gently. It was decided that these concentration values were most steady after the second measurement, as
usually the first measured concentration was considerably higher than the average. Thus, from studying the graphs it was concluded that after about 20 minutes of column running time at this
gas flow rate, concentration was steady enough for a value to be taken, with an approximate 10% error. Experimental error will be largely responsible for this 10% figure, although it is likely that
these fluctuating graphs represent something of the true, ‘unsteady’ nature of this dynamic
system. This finding lead to the decision to take two measurements of concentration and liquid
hold-up at each sampling point in the column, to improve accuracy.
Since experiments were to be carried out for three different gas flow rates, it was seen necessary
to do another steady state test at a different flow rate. Earlier preliminary tests had indicated that
the column took longer to reach steady state at lower gas flow rates, so a single test was carried
out with an air flow rate of 0.6L/min measuring the concentration at the same point in the
column. The graph of results is shown in figure 3.9.
Figure 3.9: Graph showing concentration of the foam at point 3 over time (gas flow rate 0.6L/min).
Gas flow rate 0.6L/min
0
5
10
15
20
25
30
35
0 20 40 60 80 100 120 140
Time/min
Co
nc/m
M

27
This graph does indeed show that the column takes a much longer time to reach steady state when
running with a lower gas flow rate. It was considered that the column approached steady state after about an hour, as soon after this time the concentration stopped falling and began to rise.
From this point on it fluctuated about its steady state value, as was the case before. This time however, the fluctuations seemed to be of significantly larger amplitude, so that for 0.6L/min the
column was only steady enough to limit the error on any measurement taken to about 20%. It was noted for the experiments later that a lower standard of accuracy should be expected for the
concentration measurements on the column at lower gas flow rates.
28
4 Experimental Measurement
It has been explained in the previous section how samples of foam were extracted from the
column at its sampling points. This section outlines the method of analysis for each sample of
foam, so that its liquid hold-up and concentration could be deduced. The method employed to
measure the average diameter of bubbles in the foam is also detailed.
4.1 Liquid Hold-up
Once a sample of foam was taken, the test tube was detached from the rest of the sampling tool
and weighed. The mass of the test tube was known, and therefore the mass of the foam sample, MF was yielded. It was assumed throughout these experiments that the liquid had the density of
1g/ml and therefore the volume of collapsed foam liquid, VL, was also known.
For each sample the volume of foam extracted, VF, was calculated by considering the time taken for the L shaped glass tube to completely empty of foam, which was measured with a stopwatch.
Dividing this value by the known volume of the glass tube gave the flow rate of foam extraction. The total volume of foam extracted, VF, was simply the product of this foam flow rate and the
total sampling time.
Liquid hold-up could then be determined:
lε = VL/ (VF+ VL) [4.1]
4.2 Concentration
Obtaining a concentration profile for the column from the samples of foam along the height was
not straightforward, as the concentration could not be measured directly. The method used to
determine surfactant concentrations made use of the relationship between the concentration of a
solution and its absorbance of light of a suitable wavelength.
4.2.1 Calibration
The Beer-Lambert law states that there is a relationship between the absorbance and
concentration of an absorbing species, which is linear at low concentrations. Therefore a test can
be carried out to measure the absorbances of a number of solutions at known strengths and then
draw up a calibration curve. Thereafter this calibration curve can be referred to, to find out the
concentration of a solution from its measured absorbance.
This was an important preliminary test as future experimental data would depend on the accuracy of this curve, and therefore a precise and careful method was followed, and then repeated so that
the results could be averaged for further accuracy.
An initial solution of 1 litre and 1mM was prepared, and of this a small sample was taken and its
absorbance measured in a spectrophotometer. 500ml of the initial solution was taken, and mixed
with 100ml of de-ionised water. This gave a new solution with a concentration of 0.833mM, and
the absorbance of this was also measured. Now, 500ml of this new solution was taken and mixed

29
with 100ml of water to give a new solution of concentration 0.758mM. Thus the starting solution
was gradually watered down to lower concentrations with known, carefully measured quantities of water, and the absorbance measured each time. For measuring the absorbance the
spectrophotometer only required a sample of a few ml in a cuvette – the large volumes of solution were made so that slight inaccuracies in measurement would not constitute significant error.
In the end 15 values of absorbance had been measured over a range of concentrations from
1.0mM to 0.08mM. The experiment was repeated, and an averaged calibration curve is shown in figure 4.1.
Figure 4.1: Absorbance correlation graph, CPC at 259nm.
The spectrophotometer was used to measure absorbance at a wavelength of 259nm, as CPC has a
well-defined absorbance peak at this wavelength. A silica cuvette was used in the
spectrophotometer, and washed after each use, as the operating wavelength was too low for
plastic disposable cuvettes to be used.
4.2.2 Absorbance Measurement
The concentration of the bulk solution was determined by taking a 2ml sample inside the column
with a hypodermic syringe, before the experiment was started. Because of the surface-active nature of the CPC it was thought sensible to switch on the peristaltic pump and wait for the
solution to circulate through the column for a few minutes first. This was in case there should be extra surfactant sticking to the sides of the container and the plastic tubing leading to the column,
Calibration Curve
0
0.5
1
1.5
2
2.5
3
0 0.2 0.4 0.6 0.8 1 1.2
Conc/mM
Ab
so
rba
nc
e/A

30
which might come free once a flow rate was established. The sample was diluted with distilled
water to make sure that the absorbance measured would lie in the linear region of the calibration curve. Finally the sample was transferred to the cuvette and a value for the absorbance obtained
using the Spectrophotometer.
To determine the concentration of the foam at different points in the column, each of the foam samples, extracted using the foam tool shown in figure 3.4, first had to be allowed to collapse
into a small pool of liquid at the bottom of the test tube. This enriched surfactant solution was then diluted with distilled water added using a pipette, and its absorbance measured as before.
The quantity of distilled water added to the test tube was kept as 4ml in most cases, to keep things simple, (although occasionally if very enriched or very wet foam was predicted this
quantity would be increased). This represented a dilution factor, D, equal to:
D = (VL + 4ml)/ VL [4.2]
The concentration of the foam was then simply the concentration corresponding to the absorbance of the diluted sample measured in the spectrophotometer, multiplied by the dilution
factor.
4.3 Bubble size
Bubble size within the column was estimated with the aid of a template – a narrow strip of paper
with a column of circles of gradually increasing size printed on it. Holding this up to the column
it was found to be much easier to estimate the average bubble size than had been the case using a
ruler. The average bubble size was measured to be 3.3mm, and there was no visible change in
size over the height of the column or different experiments.
31
5 Results and Analysis
This section shows the results from the experiments and discusses their significance.
5.1 Results
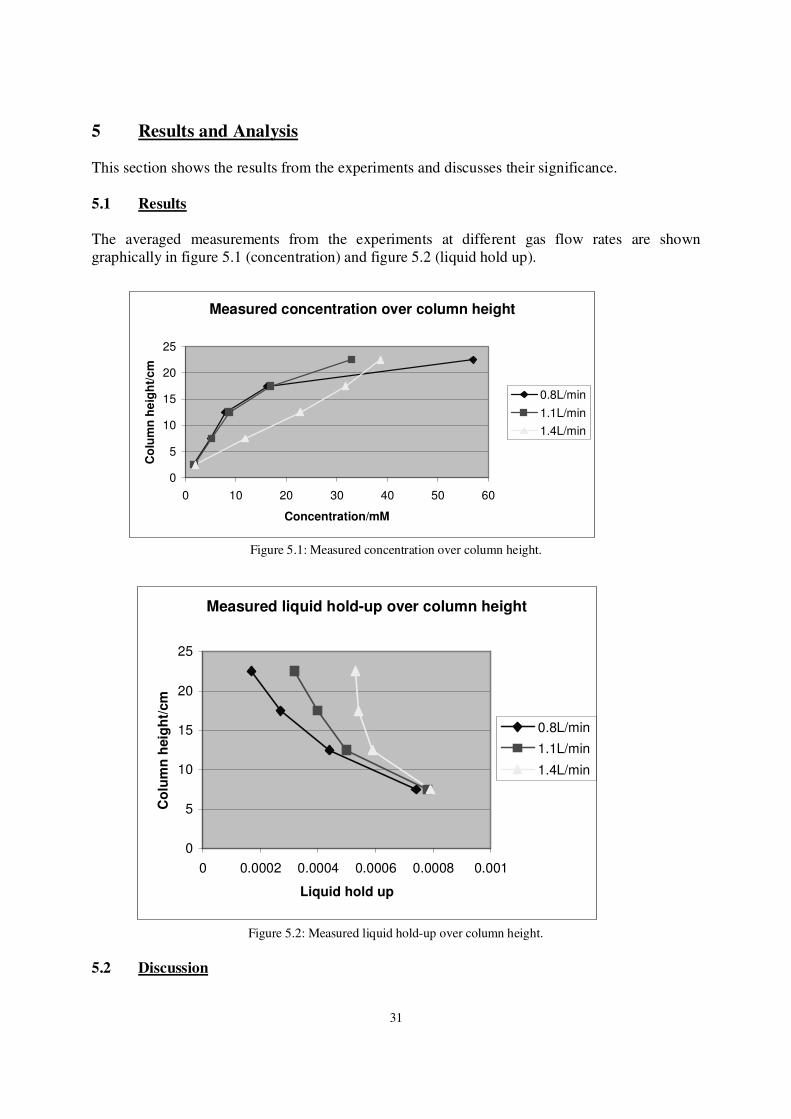
The averaged measurements from the experiments at different gas flow rates are shown
graphically in figure 5.1 (concentration) and figure 5.2 (liquid hold up).
Figure 5.1: Measured concentration over column height.
Figure 5.2: Measured liquid hold-up over column height.
5.2 Discussion
Measured concentration over column height
0
5
10
15
20
25
0 10 20 30 40 50 60
Concentration/mM
Co
lum
n h
eig
ht/
cm
0.8L/min
1.1L/min
1.4L/min
Measured liquid hold-up over column height
0
5
10
15
20
25
0 0.0002 0.0004 0.0006 0.0008 0.001
Liquid hold up
Co
lum
n h
eig
ht/
cm
0.8L/min
1.1L/min
1.4L/min

32
It can be seen clearly in figure 5.2 that foam gets drier as it gets higher up the riser, and also that
sparging a larger gas flow rate into the column creates a wetter foam. Figure 5.1 show the levels of enrichment achieved by the column at different gas flow rates. There seem to be two different
shapes to these concentration profile curves, and their smoothness suggests that the difference is not caused by experimental error. A probable conclusion is that the curves at the lower flow rates
are not actually at steady state, but were approaching it so slowly that the measurements were deceptively ‘steady’. Since their foams were drier, the enriching effect of the reflux would take
much longer to reach down the column by dispersion. This gives a good explanation for why in these two cases the enrichment is proportionally much higher at the top of the column, whereas
the concentration profile for the 1.4L/min gas flow rate is nearly linear.
It is worthwhile to compare these measured concentration profiles to what the theory would predict in the case of foam fractionation without reflux. Concentration in the no reflux case is
shown in equation 2.8:
C1 = C0 + Γ S/lε [2.8]
By substituting in the measured values of liquid hold-up, lε , it is possible to plot graphs of this
equation for the three different gas flow rates. This is shown in figure 5.3. In figure 5.4, 5.5 and
5.6 the curves are compared to the measured concentration profiles for each gas flow rate.
Figure 5.3: Theoretical concentration profile for column operating at different gas flow rates.
Theoretical concentration profile (no reflux)
0
5
10
15
20
25
0 10 20 30 40 50 60
Conc/mM
Co
lum
n h
eig
ht/
cm
0.8L/min
1.1L/min
1.4L/min

33
Figure 5.4: Measured and theoretical no reflux concentration profiles.
Figure 5.5: Measured and theoretical no reflux concentration profiles.
It is telling that in figures 5.4 and 5.5 the measured concentration curves are very similar to the
theoretical no reflux curves, except near the top of the column where the measured concentration
0.8L/min
0
5
10
15
20
25
0 10 20 30 40 50 60
Conc/mM
Co
lum
n h
eig
ht/
cm
No reflux
Measured
1.1L/min
0
5
10
15
20
25
0 10 20 30 40 50 60
Conc/mM
Co
lum
n h
eig
ht/
cm
No reflux
Measured
1.4L/min
0
5
10
15
20
25
0 10 20 30 40 50 60
Conc/mM
Co
lum
n h
eig
ht/
cm
No reflux
Measured
Figure 5.6: Measured and theoretical no reflux concentration profiles.

34
is much larger. This similarity suggests that the effects of the reflux have not yet reached the
bottom of the column for these two gas flow rates.
These graphs also show that operating a foam fractionation column with reflux can yield a much more enriched top product. This is most apparent in figure 5.6 for the higher gas flow rate of
1.4L/min, where concentration was measured to be approximately 4 times greater than is predicted for a column operating at the same conditions without reflux.
5.3 Analysis of Number of Stages
The number of theoretical stages is calculated graphically for each gas flow rate, according to the theory in section 2.4. The equilibrium line for the system is given in Equation 2.8:
l
SCC
ε
Γ+= [2.8]
However Figure 5.2 shows how the liquid hold-up, lε , varies over the height of the column in
each experiment, and therefore the system cannot be exactly represented by any one single value.
Thus, in order to perform this graphical calculation it was necessary to approximate this line.
Two different approaches were taken, and they are outlined in the two subsequent sections.
5.3.1 Constant Liquid Hold-up
The simplest way to draw the equilibrium line of Equation 2.8 was to take an average value of the
liquid hold-up, lε , from all the measurements up the column. This mean value was calculated for each gas flow rate and substituted into Equation 2.8 to plot the equilibrium line. The graphical
stagewise plot using this line is shown for each of the experiments in Figures 5.7, 5.8, and 5.9.
The stages count all the way from point (1.46,1.46), marking the bulk solution concentration, to
the concentration of the foam at sampling point 5.

35
0.8L/min - Constant Liquid Hold-up
0
10
20
30
40
50
60
0 10 20 30 40 50 60
1.1L/min - Constant Liquid Hold-up
0
10
20
30
40
50
60
0 10 20 30 40 50 60
1.4L/min - Constant Liquid Hold-up
0
10
20
30
40
50
60
0 10 20 30 40 50 60
Figure 5.7: lε = 0.001212, 14.0 stages.
Figure 5.8: lε = 0.001476, 9.6 stages.
Figure 5.9: lε = 0.001736, 13.3 stages.

36
5.3.2 Varying Liquid Hold-up A second set of graphs was created, with the notion of modelling the changing liquid hold up
more closely. The column was split into five sections, and a value for the liquid hold-up calculated for each from the average values of the adjacent sampling points. This modelling of
the column is shown in Figure 5.10. The sampling points are labelled according to their number, and the liquid hold-up and concentration measured at each point are indicated.
The measured values of foam concentration at each sampling point C1, C2, C3, C4 and C5 were
used as bounds at which point the liquid hold-up value changed. Up until the concentration C1,
the equilibrium line was calculated using the value 1lε , and then the value changed to ( 1lε +
lε 2)/2, and so on.
The discrete changes in liquid hold-up resulted in a ‘jumpy’ equilibrium line, and the graphical calculation was performed using this for each gas flow rate in Figures 5.11, 5.12, and 5.13.
Figure 5.10: Model of varying liquid hold-up in the riser

37
5.4
0.8L/min - Varying Liquid Hold-up
0
10
20
30
40
50
60
70
80
0 10 20 30 40 50 60
1.1L/min - Varying Liquid Hold-up
0
10
20
30
40
50
60
70
80
0 10 20 30 40 50 60
1.4L/min - Varying Liquid Hold-up
0
10
20
30
40
50
60
70
80
0 10 20 30 40 50 60
Figure 5.11: 6.3 stages.
Figure 5.12: 5.7 stages.
Figure 5.13: 12.3 stages.

38
5.5 Final Discussion
These graphs will give rough estimates for the number of theoretical mixing stages for the
column operating at the three different flow rates. Since the second approach takes into account a
varying liquid hold-up it can reasonably be considered more reliable.
However there is no discernible trend in the number of theoretical mixing stages with gas flow
rates from my results, which suggests that they are not reflective of true column performance.
This could be due to the suspected failure to reach complete levels of steady state in some of the
experiments.
An attempt was made to characterise the column independently of its conditions, by plotting a
graph of the height of an equilibrium stage, h, versus the liquid hold-up. The values for the height
of an equilibrium stage were taken from the step-wise calculation graphs, where for each value of
liquid hold-up the number of stages could be counted.
Figure 5.14: Graph of h versus liquid hold up.
0
1
2
3
4
5
6
0 0.001 0.002 0.003 0.004
Liquid hold-up
Th
eo
reti
ca
l sta
ge
he
igh
t/cm
Figure 5.11
Figure 5.12
Figure 5.13
Figure 5.7
Figure 5.8
Figure 5.9

39
6 Further Work
The two main operational problems that were inherited from last years project have been
addressed, and the experimental equipment operated with some success, however it has been
found that these issues still cause limitations to the experiment, which a fresh riser design may be
able to avoid.
The foam was broken successfully, although only within quite a narrow range of gas flowrates, which meant that identifying trends within the results was dificult. A new design could seek to
employ more hi-tech foam breakers such as electric heating grids or ultrasound emitters at the top
of the riser.
The ‘siphoning’ effect of the dry foam at the top of the riser was bypassed by moving the foam
breaker to within the riser, but this is not an ideal solution since it is now impossible to measure a
top product concentration. The solution to this problem will require a completely different design
to the top section of the column, and this should be investigated. The new design must allow for
top product to be collected, and thus the amount of reflux controlled, and its effects on a foam
fractionation column explored further. The design should also if possible be suitable for a multistage column, and therefore must be geometrically simple. One such design that was
conceived is a radial multistage column, where instead of the traditional stacking of stages, all the stages are at the same height, with successive stages moving out in concentric cylindrical rings
around the bulk solution in the centre. Liquid from collapsed foam would flow down the outside
of the riser to form a new bulk stage in a surrounding riser.
The investigations into the dynamics of the foam fractionation system revealed that the column
takes time to reach steady state, and that this time varies with the gas flow rate supplied. In order
to validate future experiments, more investigative tests should be carried out to explore this
further.
There was no time at the end of this project for investigation into the effects of varying the riser
geometry by adjusting the slidable gas base. This could be an effective study into riser design and the optimal height for each stage of a multistage foam fractionation column.
New experiments should be carried out to investigate dispersion within the foam, carrying on the
work from previous years, particularly that of Swain (2005). Data should be obtained to characterise the drier foam used in these experiments.

40
7 Conclusions
The initial aims and objectives of the project were:
• Make design modifications to existing experimental equipment, so that column achieves
condition of steady-state.
• Develop theory to predict riser performance.
• Make concentration measurements to gain a concentration profile for the height of the riser.
• Validate theory with experiment.
• Improve riser design, and hence be able to design a better multistage device.
This project has tackled each of these objectives apart from the last, and made reasonable
progress in them.
The design modifications to the experimental set up were successful, as column operation is
much improved. Concentration and liquid hold-up profiles have been obtained, and by achieving
basic conditions such as complete foam breakage and total reflux it has been made possible to
compare the experimental data with foam fractionation theory.
There is still some uncertainty about the system as regards steady state, and more work needs to
be done to investigate this for different gas flow rates. Results from this project suggest that
higher flow rates are more conducive to the column reaching steady state faster.
The positive effect on enrichment from reflux has been demonstrated - again, the results indicate
that the column performs best at higher gas flow rates.
The final objective to improve riser design has not been accomplished, as riser geometry was not
varied in any of the tests. However one key column operating condition, that of gas flow rate, has
been investigated and it has been strongly indicated that higher flow rates are more steady and
achieve greater enrichment.

41
8 Acknowledgements
I would like to express thanks to all who have assisted me while undertaking this project, especially Professor Darton and Dr. Martin for their advice and encouragement. I would also like
to thank Russell Payne for his help in the design and manufacture of the foam sampling tube, and various glasswork on the column. Many thanks also to those in Stores, and the Engineering
Department Workshop for their kind advice and assistance.

42
9 References
Aubourg, R., Bee, A., Cassaignon, S., Monticone, V., Treiner, C., “Adsorption Isotherms of
Cetylpyridinium Chloride with Iron III Salts at Air/Water and Silica/Water Interfaces”, Journal
of Colloid and Interfacial Science vol. 230 pp 298-305, 2000
Lemlich, R., “Adsorptive Bubble Separation Techniques”, New York, Academic Press, 1972
Swain, M., “Foam Fractionation Risers”, Engineering Science Part II Project, 2005
Pearson, R., “Foam Fractionation”, Engineering Science Part II Project, 2004
Stevenson, P., Sullivan, P.S., Jameson, G.J., “Short-time Tracer Dispersion in a Two
Dimensional Rising Froth”, Chemical Engineering Science, vol. 58 pp 5025-5043, 2003
Supino, S., “Multi-Stage Foam Fractionation” Engineering Science Part II Project, 2001
Sweeting, K., “Foam Extraction of Aromatics” Engineering Science Part II Project, 2002
Weaire, D., Hutzler, S., “The Physics of Foams”. Oxford, Clarendon Press, 1999
http://www.koicarp.org.uk/fraction.htm, date viewed: 01/05/2006

43
10 Appendices
The Appendices that follow are:
Appendix A: Risk Assessment 44
Appendix B: Chemical Data 45
Appendix C: Interim Progress Report 46
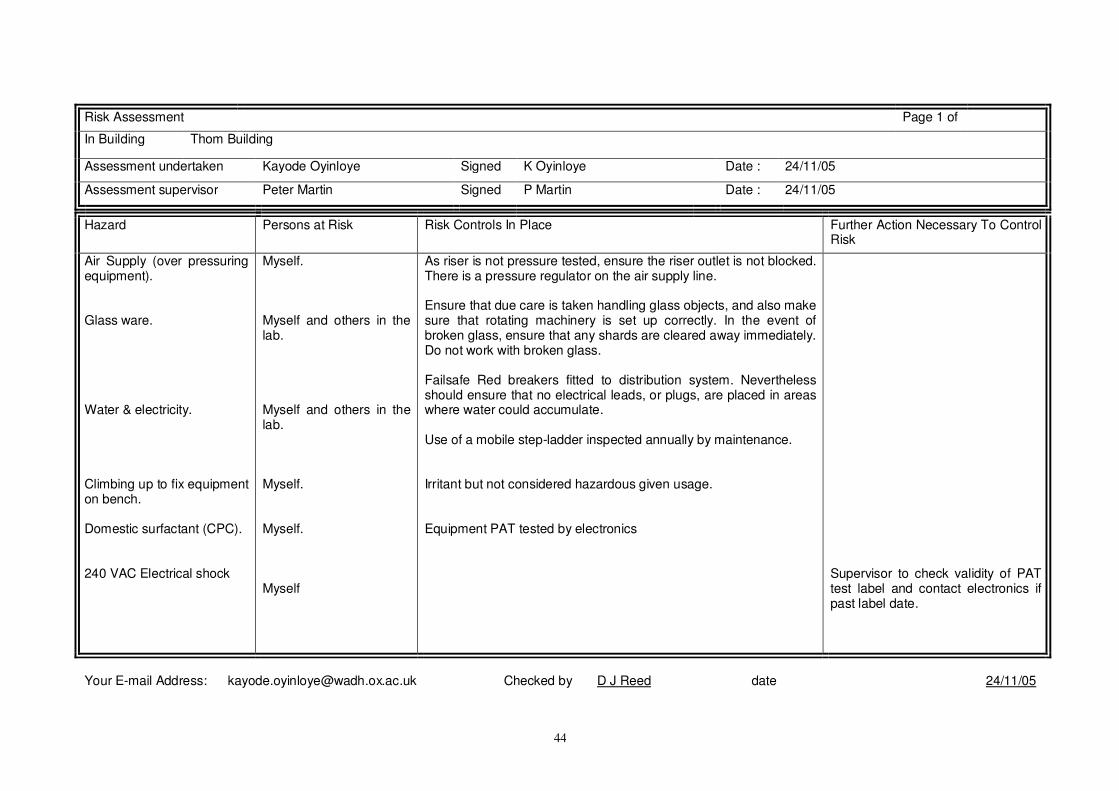
10.1 Appendix A: Risk Assessment
A copy of the risk assessment, made at the beginning of the project, is attached below.
44
Risk Assessment Page 1 of
In Building Thom Building
Assessment undertaken Kayode Oyinloye Signed K Oyinloye Date : 24/11/05
Assessment supervisor Peter Martin Signed P Martin Date : 24/11/05
Hazard Persons at Risk Risk Controls In Place Further Action Necessary To Control
Risk
Air Supply (over pressuring equipment). Glass ware. Water & electricity. Climbing up to fix equipment on bench. Domestic surfactant (CPC). 240 VAC Electrical shock
Myself. Myself and others in the lab. Myself and others in the lab. Myself. Myself. Myself
As riser is not pressure tested, ensure the riser outlet is not blocked. There is a pressure regulator on the air supply line. Ensure that due care is taken handling glass objects, and also make sure that rotating machinery is set up correctly. In the event of broken glass, ensure that any shards are cleared away immediately. Do not work with broken glass. Failsafe Red breakers fitted to distribution system. Nevertheless should ensure that no electrical leads, or plugs, are placed in areas where water could accumulate. Use of a mobile step-ladder inspected annually by maintenance. Irritant but not considered hazardous given usage. Equipment PAT tested by electronics
Supervisor to check validity of PAT test label and contact electronics if past label date.
Your E-mail Address: [email protected] Checked by D J Reed date 24/11/05
45
10.2 Appendix B: Chemical Data
Cetylpyridinium Chloride
Name: Cetylpyridinium Chloride (CPC)
Formula: C12H38NCl
Appearance: White powder
Relative Molecular Mass: 340g
Melting Point: 80-83°C
Relevant Absorbance Peak: 259nm
Solubility in Water: Freely soluble
Stability: Stable under ordinary conditions

46
10.3 Appendix C: Interim Progress Report
Fourth Year Progress report Name: Kayode Oyinloye College: Wadham Project Title : Purification by foam fractionation Supervisor: Peter Martin, Richard Darton Description of project (200 words): Foam fractionation is a nascent technology for the separation of surface active agents. Bubbles are passed through a solution to form a foam. Surface active molecules adsorb to the interface, thus when the foam is collapsed at the top of the column an enriched product is acquired. This project will utilise state of the art experimental equipment to study the phenomena that occur during foam fractionation. Previous years work on the project has shown that the riser is a key part of the equipment. By measuring the concentration profile and dispersion occurring in the riser it is hoped that riser design can be improved. A riser with adjustable base has been made so that results for different column heights can be obtained. Results achieved so far (500 words, up to 5 figures): The first problem that I was confronted with as I sought to pick up the work of the project from last year was that although experiments had been performed, and data recorded, it had all been done in unsatisfactory conditions, which meant the results were of little value. The mechanical foam breaker had been unable to break the foam rising up the column, which consequently poured out over the top. Thus the column never reached steady state conditions. The results taken were therefore not really accurate enough to use to formulate new riser theory, which was in any case impossible to do since they couldn’t do a mass balance for an overflowing system. My first task was therefore to study the foam breaking problem, reading scientific literature on the subject and experimenting with columns from previous years. The idea of using an ultrasound emitter was considered as a possible high- tech solution to collapse the foam, and will surely be kept in mind as something to try in the future since the idea has potential. In the end however the problem was solved by bubbling in the air through a sparger with larger sized holes. This created a foam with bigger bubbles that was easier to collapse. I am now in a position to repeat the experiments from last year and gain much more reliable results. It has also been necessary to have a few structural amendments done to the equipment, with extra struts installed to keep the apparatus vertical and steady during experiments. I also fitted a counterweight to the rig to balance the drill to make it hang straight. Another necessary task to prepare me for the experiments was a small experiment to deduce the absorbance curve over various concentrations for CPC, the chemical to be used. A 1litre 1mM solution was prepared and

47
gradually diluted, with the absorbance at a set wavelength measured in the spectrophotometer each time. The experiment was repeated four times and a mean curve obtained. I will be able to use this curve to deduce the concentration of samples taken from the column during experiments by comparing the absorbance. Problems: (Describe any potential problems and how you might address them) Adjusting the clamps on the column to make it exactly vertical will be difficult. The use of a plum-line will be necessary to give a constant vertical reference. Future work:(Give a very brief description of what you will be doing in the remaining time.) Week 7,8 MT: Repeating the experiments of last year – measuring the concentration at various heights along the column to see the purification effectiveness, and injecting a salt solution tracer and measuring conductivity, aiming to get an estimate for the dispersion in the foam. Winter break: Studying experimental data and dispersion theory, working towards formulae that model column behaviour. Week 1,2 HT: In depth discussion with supervisors on the results of my experiments and my
ideas for modelling column behaviour. Plan out future course of project
depending on the significance of results and how well conclusions can be
drawn: Further experiments to get better/different results? Devise more theory
to explain results? Launch investigation into possible ultra sound designs for
foam breaking?
Related Documents